Potential benefits of delaying the second mRNA COVID-19 vaccine dose
Abstract
Vaccination against COVID-19 with the recently approved mRNA vaccines BNT162b2 (BioNTech/Pfizer) and mRNA-1273 (Moderna) is currently underway in a large number of countries. However, high incidence rates and rapidly spreading SARS-CoV-2 variants are concerning. In combination with acute supply deficits in Europe in early 2021, the question arises of whether stretching the vaccine, for instance by delaying the second dose, can make a significant contribution to preventing deaths, despite associated risks such as lower vaccine efficacy, the potential emergence of escape mutants, enhancement, waning immunity, reduced social acceptance of off-label vaccination, and liability shifts. A quantitative epidemiological assessment of risks and benefits of non-standard vaccination protocols remains elusive. To clarify the situation and to provide a quantitative epidemiological foundation we develop a stochastic epidemiological model that integrates specific vaccine rollout protocols into a risk-group structured infectious disease dynamical model. Using the situation and conditions in Germany as a reference system, we show that delaying the second vaccine dose is expected to prevent COVID-19 deaths in the four to five digit range, should the incidence resurge in the first six months of 2021. We show that this considerable public health benefit relies on the fact that both mRNA vaccines provide substantial protection against severe COVID-19 and death beginning 12 to 14 days after the first dose. The model predicts that the benefits of protocol change are attenuated should vaccine compliance decrease substantially. To quantify the impact of protocol change on vaccination adherence we performed a large-scale online survey. We find that, in Germany, changing vaccination protocols may lead only to small reductions in vaccination intention depending on liability issues associated with postponing the second dose. In sum, we therefore expect the benefits of a strategy change to remain substantial and stable.
I Introduction
Large-scale vaccine rollouts against coronavirus disease 2019 (COVID-19) began on a world-wide scale at the end of 2020. Because of variable vaccine supplies, distribution and delivery protocols, national policies and vaccination strategies, the rate at which vaccines are administered varies substantially in different countries. For instance, Israel had reached a national vaccine coverage of more than 28% in the general population by Feb 16, 2021 and started vaccinating adolescents on Jan 23, 2021 israel_ministry_of_health_corona_2021 . By the same date, many European countries had only vaccinated a fraction of the population in the single digit percent range commissario_straordinario_per_lemergenza_covid-19_-_presidenza_del_consiglio_dei_ministri_covid-19_2021 ; bundesministerium__fur__soziales__gesundheit__pflege__und__konsumentenschutz_corona-schutzimpfung_2021 ; sante_publique_france_donnees_2021 ; robert_koch_institute_digitales_2021 . In Germany, for example, by Feb 15, 2021 only 3% of the population had received the first dose and at the time of writing the vaccination progresses at approximately 120,000-150,000 persons per day robert_koch_institute_digitales_2021 . Currently approved mRNA vaccines BNT162b2 (BioNTech/Pfizer) and mRNA-1273 (Moderna) are reported to be approximately 95% efficacious against COVID-19 disease after receiving two doses polack_safety_2020 ; voysey_safety_2021 . Efficacy against severe COVID-19 and death is projected to be close to 100%, whereas overall risk reduction of infection by the causing agent severe acute respiratory syndrome coronavirus type 2 (SARS-CoV-2) is found to be less considerable polack_safety_2020 ; voysey_safety_2021 ; chodcik_effectiveness_2021 . Therefore, and because vaccination rates are limited by supply and infrastructural challenges, vaccination strategies typically prioritize the population at risk, i.e. the elderly, people with comorbidities, and people with high risk of exposure vygen-bonnet_beschluss_2020 ; bullard_predicting_2020 . The public health priority during this early phase is therefore the direct and effective reduction of severe COVID-19 cases and deaths in the high-risk groups as opposed to reducing transmission frequency in the general population.
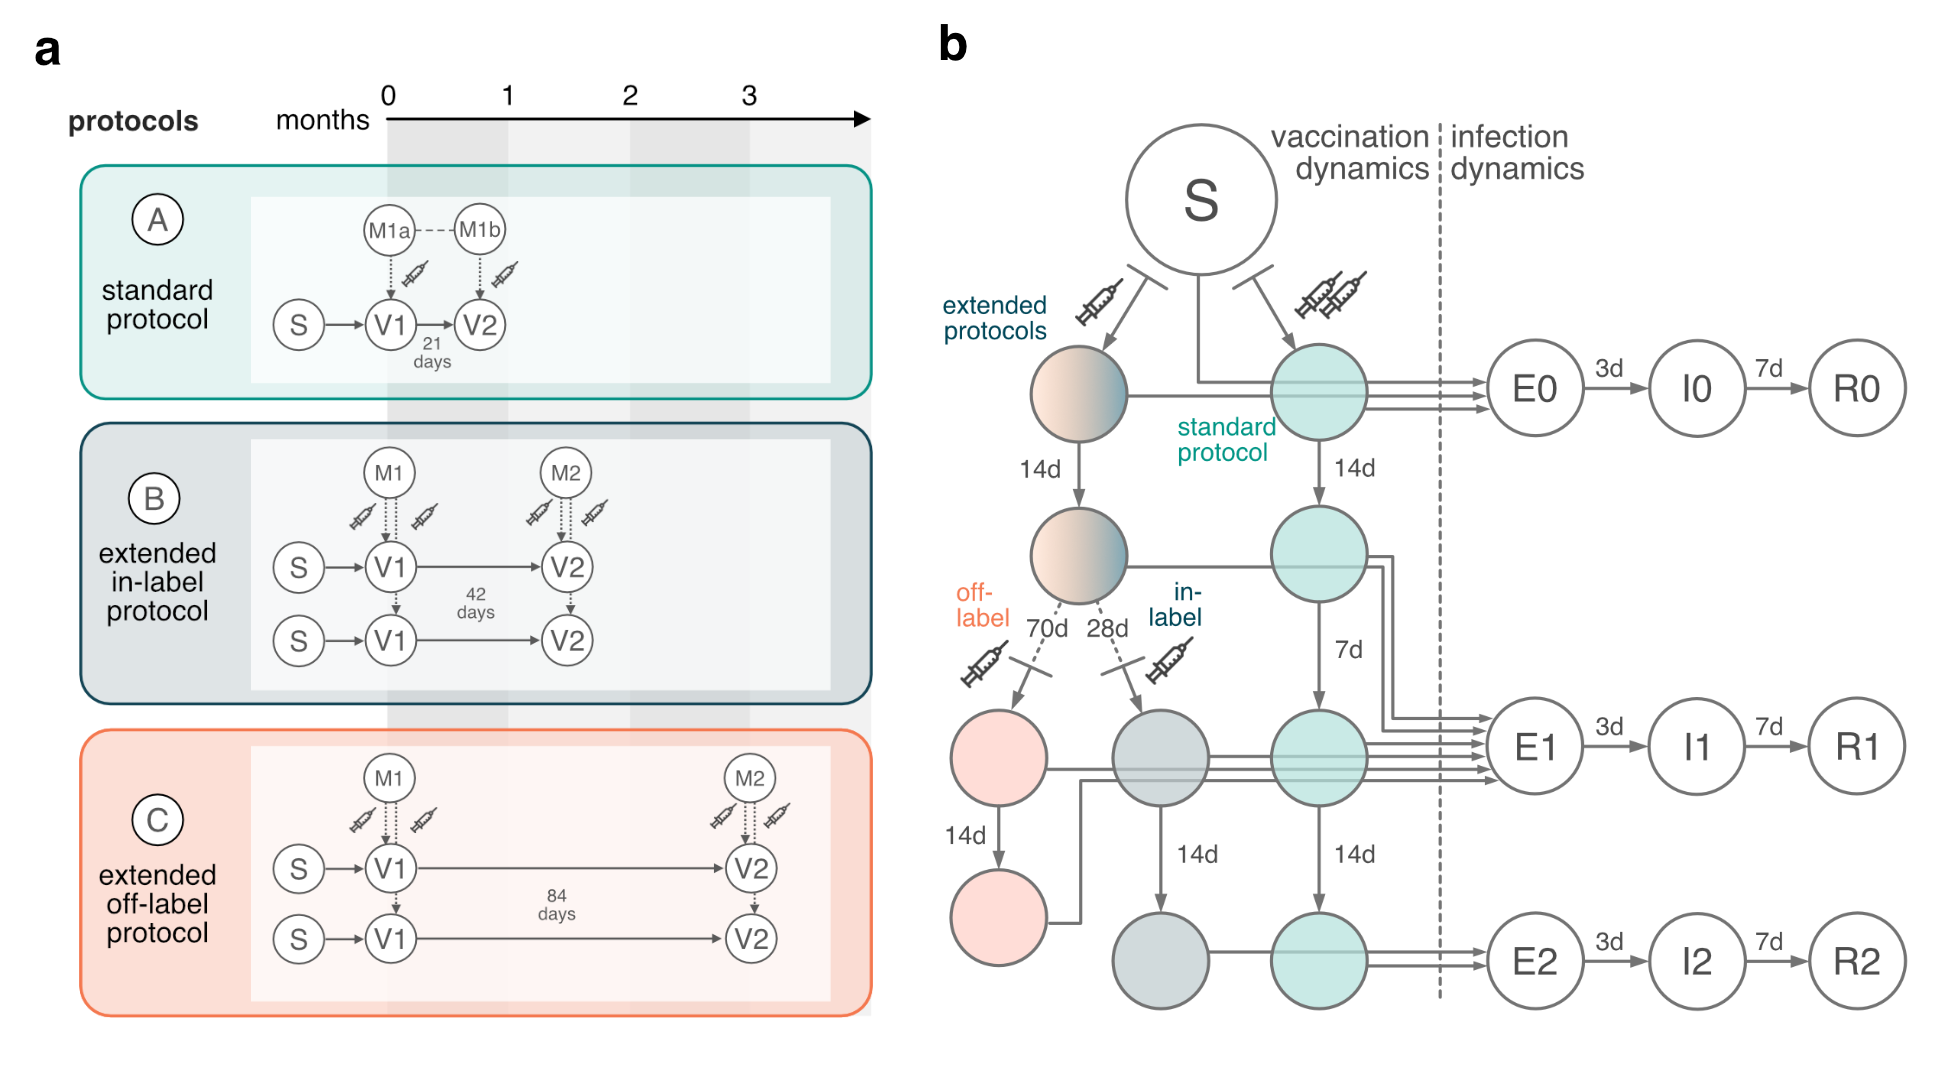
According to the World Health Organization’s Strategic Advisory Group of Experts on Immunization (SAGE) as well as manufacturers’ recommendations, individuals that receive the first dose of the respective vaccine should receive the second dose after approximately 21 or 28 days, but no later than 42 days after the first dose strategic_advisory_group_of_experts_on_immunization_sage_interim_2021 ; strategic_advisory_group_of_experts_on_immunization_sage_interim_2021-1 . To comply with these recommendations, the current standard vaccine administration protocol that is applied in the majority of European countries provides the first dose immediately, and the second dose is withheld and stored appropriately to be used on the same individual 21 to 28 days later (see Fig. 1a). Reserving the second dose, however, implies that the stock of available doses is depleted twice as fast as the number of people with first dose protection increases. Studies indicate that a substantial amount of protection is already delivered by the first dose polack_safety_2020 ; voysey_safety_2021 ; chodcik_effectiveness_2021 . After 12-14 days of receiving the initial dose, efficacy was approximately 89% and 92% for BNT162b2 and mRNA-1273, respectively polack_safety_2020 ; voysey_safety_2021 ; strategic_advisory_group_of_experts_on_immunization_sage_interim_2021 ; strategic_advisory_group_of_experts_on_immunization_sage_interim_2021-1 . Supported by additional epidemiological data from Israel, this implies that the first dose provides almost complete protection against severe COVID-19 and death polack_safety_2020 ; voysey_safety_2021 ; chodcik_effectiveness_2021 ; jabal_impact_2021 ; cohen_one-dose_2021 ; amit_early_2021 ; public_health_england_annex_2021 . Consequently, a situation of severe vaccine scarcity could potentially be improved by instead of reserving the second dose on an individual basis, administering it to a second person on the same date, thereby doubling the initial vaccination rate and substantially reducing the time required to protect the high-risk population (see Fig. 1a). Naturally, this would delay the administration of the second dose if vaccine supply is limited. Such a protocol is being followed in the UK, for instance, where the Joint Committee on Vaccination explicitly recommends to prioritize the first-dose vaccination of as many high-risk individuals as possible over a timely administration of the second dose department_of_health_and_social_care_priority_2020 .
In light of the current situation including concerns about the spread of new virus variants with substantially higher transmission probabilities, discussions of whether the benefits of these alternative vaccination protocols outweigh their risks are highly disputed and controversial department_of_health_and_social_care_priority_2020 ; noauthor_science_2021 ; iacobucci_covid-19_2021 ; sewell_revisiting_2021 .
Many European countries face a shortage of available mRNA vaccine doses within the first quarter of 2021, a situation that is likely to improve in the second quarter when the number of delivered doses is expected to be significantly greater. Therefore, a systematic delay of the second dose administration could potentially save many lives by maximizing vaccination speed and scope. However, so far only few systematic analyses have been performed that compare potential epidemiological outcomes of alternative strategies to the standard protocol wang_impacts_2021 . In what way and under which conditions alternative protocols affect the expected number of severe COVID-19 cases and deaths remains yet unknown but could significantly guide policy makers to make informed decisions.
Given this and the substantial protection against severe COVID-19 and death provided by a single dose, it might be beneficial to delay the second dose by 12 weeks, reaching twice as many people in the first quarter of 2021 compared to the standard protocol. However, exceeding the recommended interval between the first and second doses comes with the hypothetical risk of decreased vaccine efficacy, as well as the potential loss of manufacturer liability when administering vaccines by an off-label procedure. A further risk is a potential reduction in the population’s willingness to get vaccinated when the vaccines are used on off-label protocols.
Alternatively, and in order to comply with the manufacturers’ recommendations, the second dose can be delayed up to 42 days in an extended in-label protocol european_medicines_agency_clarification_2021 ; strategic_advisory_group_of_experts_on_immunization_sage_interim_2021 ; strategic_advisory_group_of_experts_on_immunization_sage_interim_2021-1 . As contracts over vaccine dose deliveries are usually signed per quarter (three months), the same number of individuals can be vaccinated per quarter for both the standard and extended in-label protocol. In the extended in-label protocol, however, all high-risk individuals will have received the second dose after about six weeks which is within the originally approved time frame.
Here we employ a stochastic computational model to capture the epidemiological impact of changing the standard protocol and implementing in- and off-label extended protocols instead. A particular emphasis is placed on quantifying the public health benefits or drawbacks of these alternative strategies in terms of the expected number of saved lives and avoided COVID-19 cases in the high-risk population. The model is designed to shed light onto the factors that may yield benefits of alternative protocols and identify conditions for which benefits become drawbacks. In particular, we investigate how a potentially negative impact of an alternative vaccination protocol, especially off-label use, on vaccination adherence may neutralize the benefits expected by faster coverage. The model compares three categorically different pandemic scenarios for the first 6 months in 2021.
We find that due to the high efficacy of the vaccines with respect to death from COVID-19, a substantial reduction in fatal outcomes is expected for all extended protocols and all pandemic scenarios. However, should a change in protocol impact vaccine adherence substantially, our model indicates that these benefits are neutralized and become disadvantageous.
II Model and methods
In order to assess the impact and potential benefits of different vaccination protocols, the model requires detailed data on vaccine supplies which can vary between countries. We therefore investigate two different supply timelines and scenarios. Both scenarios are derived from the particular situation in Germany (population of the order of 80 million).
In both scenarios we assume that in the first quarter of 2021, 14 million doses of mRNA vaccine are available and are delivered at a constant rate over the whole quarter. A parsimonious “extreme scarcity” scenario focuses on the general effects expected for different vaccination protocols and assumes the same number of doses for each quarter in 2021, so after 6 months a total of 14 million individuals can be vaccinated with two doses. The results obtained for these values can be used as a guide for the expected effects in other countries and as a reference scenario.
The second scenario is based on actual estimations on mRNA vaccine availability in Germany federal_ministry_of_health_of_germany_informationen_2021 . Here, 46 million doses are expected to be available in the second quarter of 2021. This would amount to a total of 30 million people that could receive two doses of the discussed vaccines in the first half of 2021. We explicitly ignore the influence of Adenovirus vaccines that might become available additionally, in order to solely focus on the impact made by delaying the second mRNA vaccine dose.
Analyzing both scenarios enables us to compare the benefits of protocol changes for both extreme scarcity as well as moderate scarcity of vaccine supply.
We developed and implemented a risk-group-structured stochastic susceptible-exposed-infectious-removed (SEIR) model to capture the combined dynamics of the time-course of the pandemic and the impact of vaccination (see Fig. 1b) anderson_infectious_2010 ; keeling_modeling_2011 with a uniform average latent period of 3.2 days and an infectious period of 6.7 days khailaie_development_2021 . Using a coarse-grain approximation, we divide the population into two groups: high-risk (which we define as having increased risk of death from infection) and low-risk (low risk of death from infection). We assume that the high-risk group comprises approx. 20% of the population, requiring swift and high-priority vaccination (see vygen-bonnet_beschluss_2020 and Supplementary Information (SI)). We model the average number of epidemiologically relevant contacts between individuals of one risk group to another risk group based on results by the POLYMOD study, using the 65+ age group as a proxy for the “high-risk” group and the <65 age group for “low-risk” mossong_social_2008 ; funk_socialmixr_2020 . While the official definition for “high-risk” begins at age 70, individuals with co-morbidities are classified as “high-risk” as well, many of which belong to the age group 65-70 mueller_why_2020 . Based on empirical results, we expect that approx. 75%-80% (i.e. 12 million people) of the high-risk group are willing to get vaccinated (see Fig. 4a). Additionally, we assume that 7 million individuals of the low-risk group are workers in the health care sector and consequently are vaccinated with high priority in concurrence with the high-risk population vygen-bonnet_beschluss_2020 .
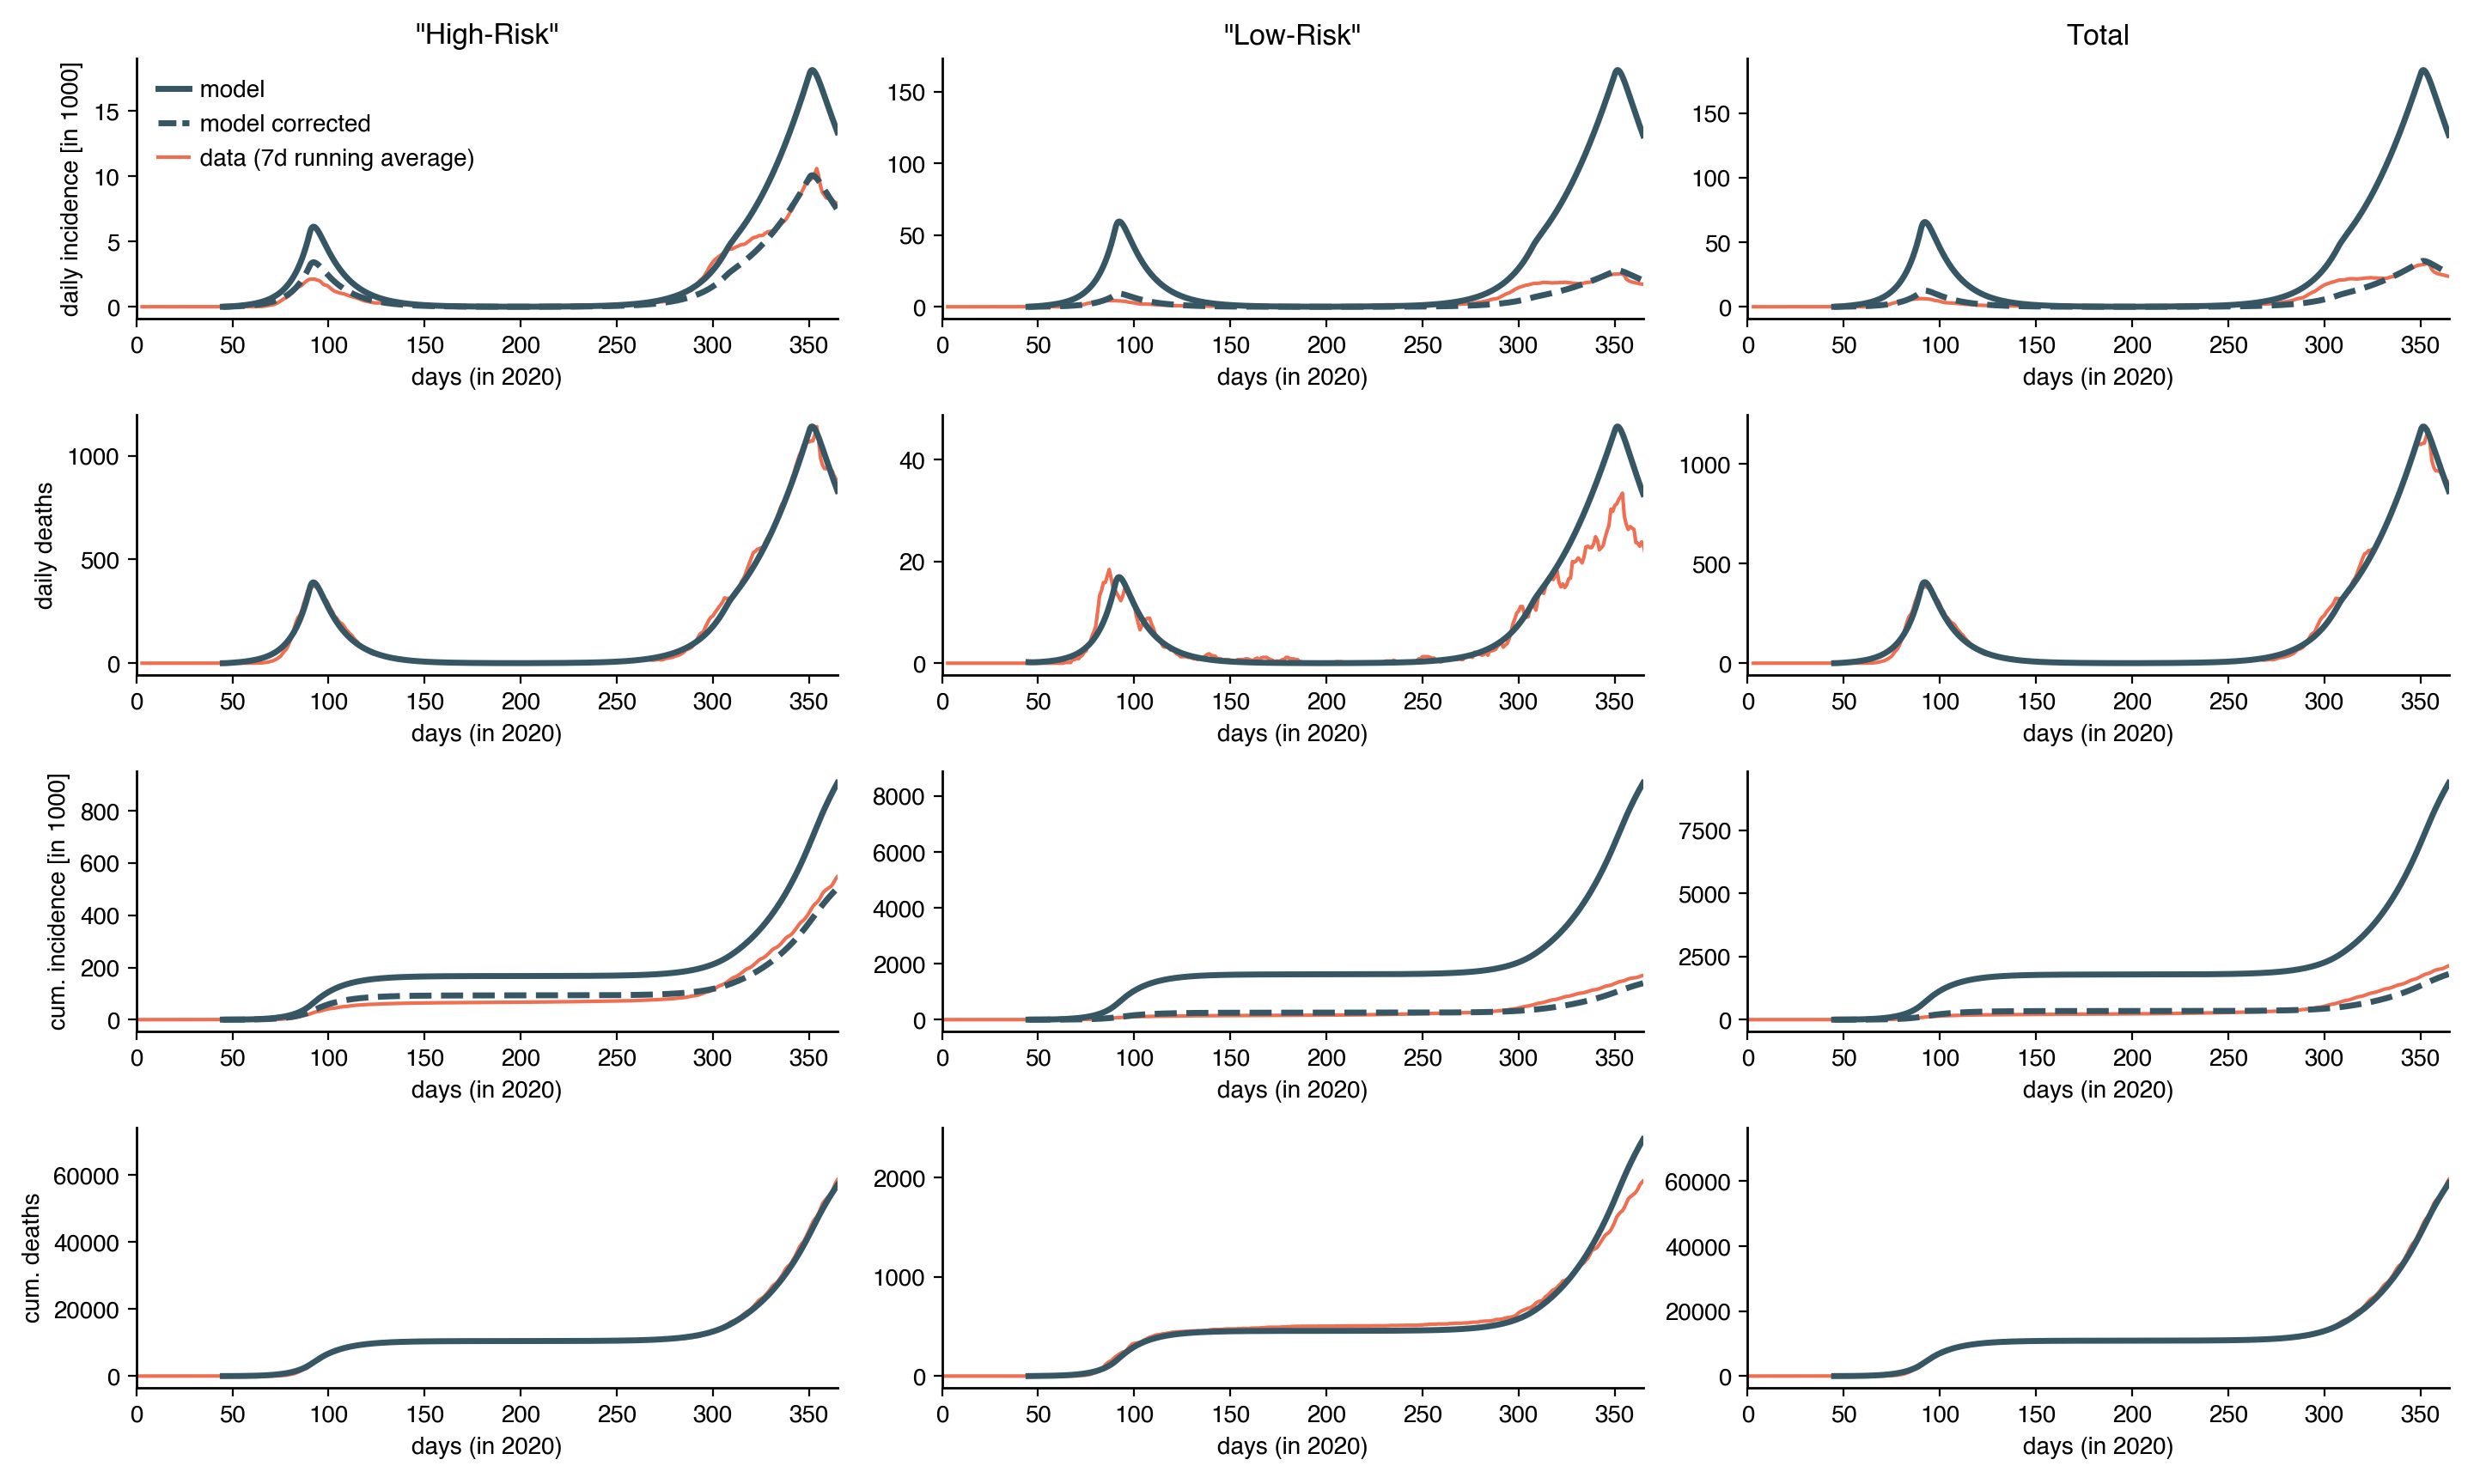
We calibrate the model based on the reported daily incidence and COVID-19-related deaths in Germany in 2020, yielding plausible values of infection fatality rates (IFRs) of 6.25% for the high-risk and 0.028% for the low-risk group levin_assessing_2020 , further details are provided in the SI. We find an in-group base reproduction number of for the low-risk group which we use to scale cross-group transmission rates accordingly (see SI). Additionally, we set an 83% probability of infected individuals to display symptoms of COVID-19 byambasuren_estimating_2020 .
Vaccination protection is primarily aimed at preventing disease and reducing COVID-19 deaths. Vaccines are expected to be less effective with respect to preventing SARS-CoV-2 infection polack_safety_2020 ; voysey_safety_2021 ; chodcik_effectiveness_2021 ; amit_early_2021 ; public_health_england_annex_2021 . A vaccinated person is almost fully protected against COVID-19 related death approx. 14 days after receiving the first dose chodcik_effectiveness_2021 . In the model we therefore set efficacy against death to be 99.9% after the first dose and increase it to 99.99% after two doses. We further expect that the efficacy against COVID-19 is 90% after the first dose as compared to 95% after receiving the second dose polack_safety_2020 ; voysey_safety_2021 . We implement values of a 50% reduction in susceptibility approx. 14 days after receiving the first dose chodcik_effectiveness_2021 , and assume an increase of susceptibility reduction to 60% after the second dose if administered according to the standard protocol, i.e. 21 days plus 14 days after the first dose. We assume that vaccination following the extended off-label protocol provides overall less protection against the disease compared to the standard and extended in-label protocols, respectively. These assumptions are conservative and deliberately underestimate the effectiveness of the second dose when administered with a 12 week delay. Fixed at a lower level, we additionally assume that vaccination protection does not decrease significantly in the first 12 weeks after receiving the first dose, and that, after 12 weeks, the second dose only maintains this protection rather than increasing it.
The course of the pandemic over the next six months cannot be predicted due to the complexity of the process and feedback effects between pandemic dynamics, population behavioral changes, and policy measures ioannidis_forecasting_2020 ; prasse_fundamental_2020 . An important empirical finding of the analysis of the pandemic in Germany and other countries, however, is that while the epidemic unfolds, a dynamic equilibrium is achieved in which the natural force of infection and response measures balance, causing the effective reproduction number to continuously fluctuate around the system-critical value , a phenomenon known as self-organized criticality that has been observed in disease dynamical systems funk_spread_2009 and other complex dynamical systems bak_self-organized_1987 ; bak_punctuated_1993 . The statistical properties of fluctuations can therefore be used to generate long-term forecasts from quasi-stationary and temporally homogeneous driven stochastic processes that resemble empirical incidence curves.
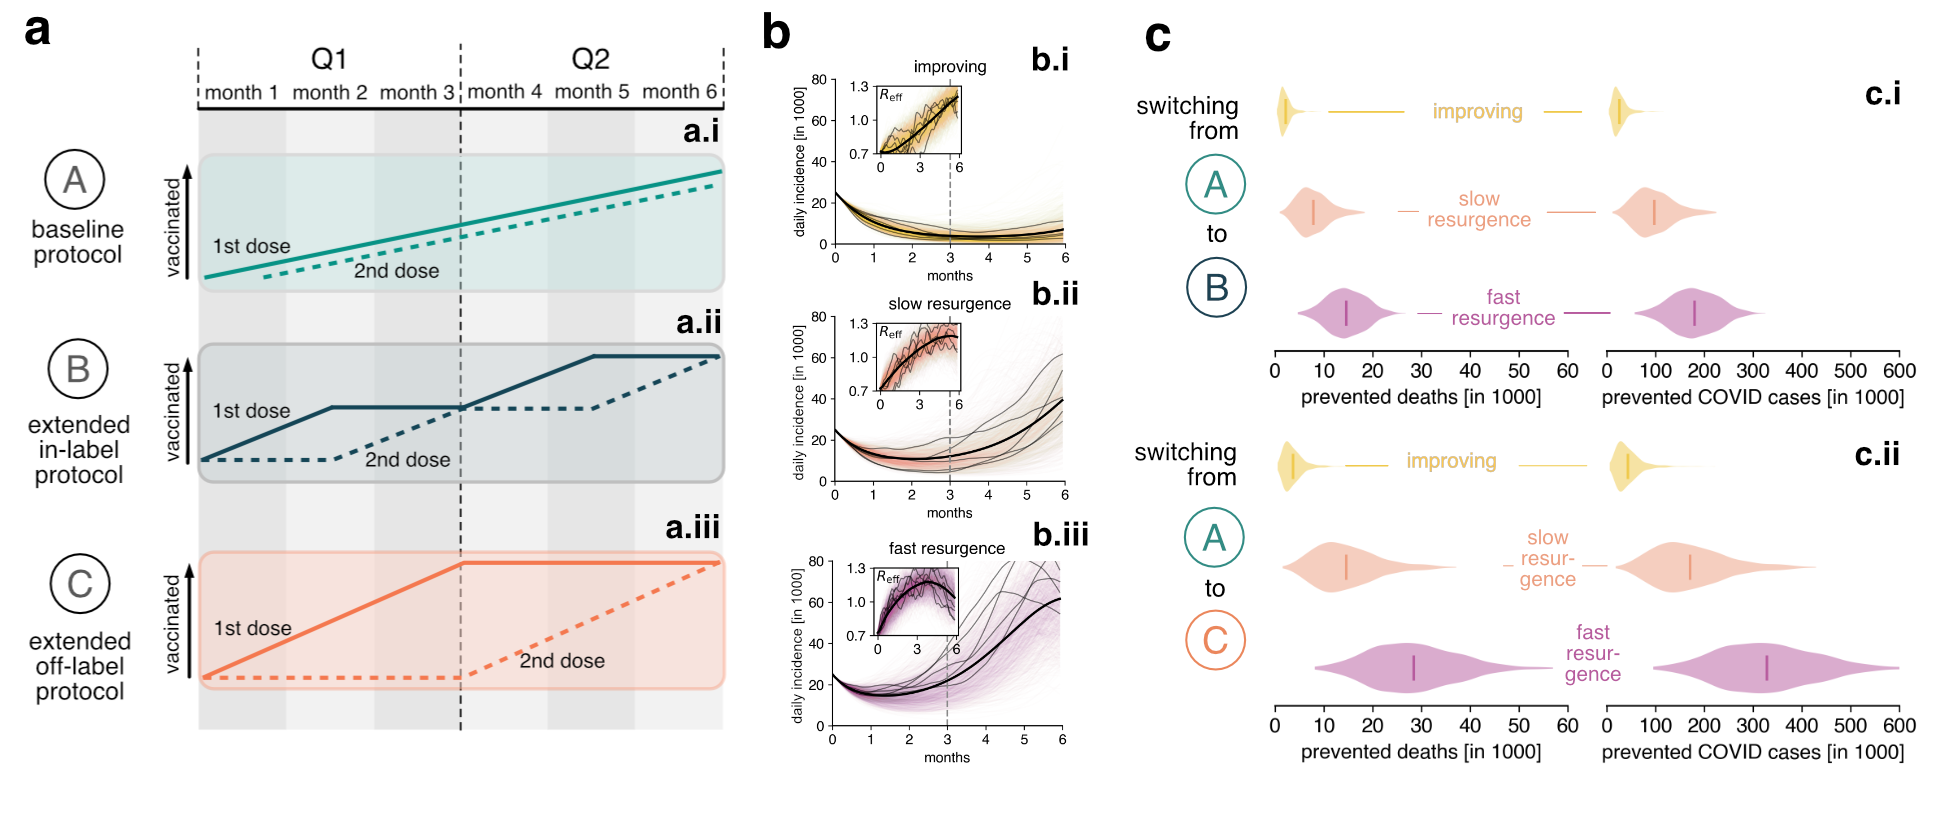
With regard to the development of the pandemic in 2021, we therefore address three different basic scenarios based on transmission rates that follow a stochastic process (see Fig. 2b and SI). In the “improving” scenario, the expected incidence continues to decrease over the first and second quarter of 2021, reaching a low, approximately constant level. In the “slow resurgence” scenario, the expected incidence ceases to decrease in the first quarter and increases again in the second quarter. In the “fast resurgence” scenario, expected incidence increases again on a shorter time-scale, typically causing a large epidemic wave in the second quarter or soon after. Note that for each scenario, individual trajectories of the base reproduction number are stochastically simulated and therefore individual incidence curves can substantially differ for a fixed scenario (see SI for details). For each such realization, the model is analyzed with respect to different assumptions of vaccine efficacy and vaccine distribution/administration protocols. This approach permits a direct comparison of different strategies with respect to the same epidemic course in order to clearly evaluate all possible dynamic effects of a change in protocol. As an outcome, we measure the cumulative number of deaths and cumulative number of symptomatic COVID-19 cases in the high-risk group caused within the first 24 weeks (6 months) of the vaccine rollout.
![[Uncaptioned image]](/html/2102.13600/assets/x1.png)
III Results
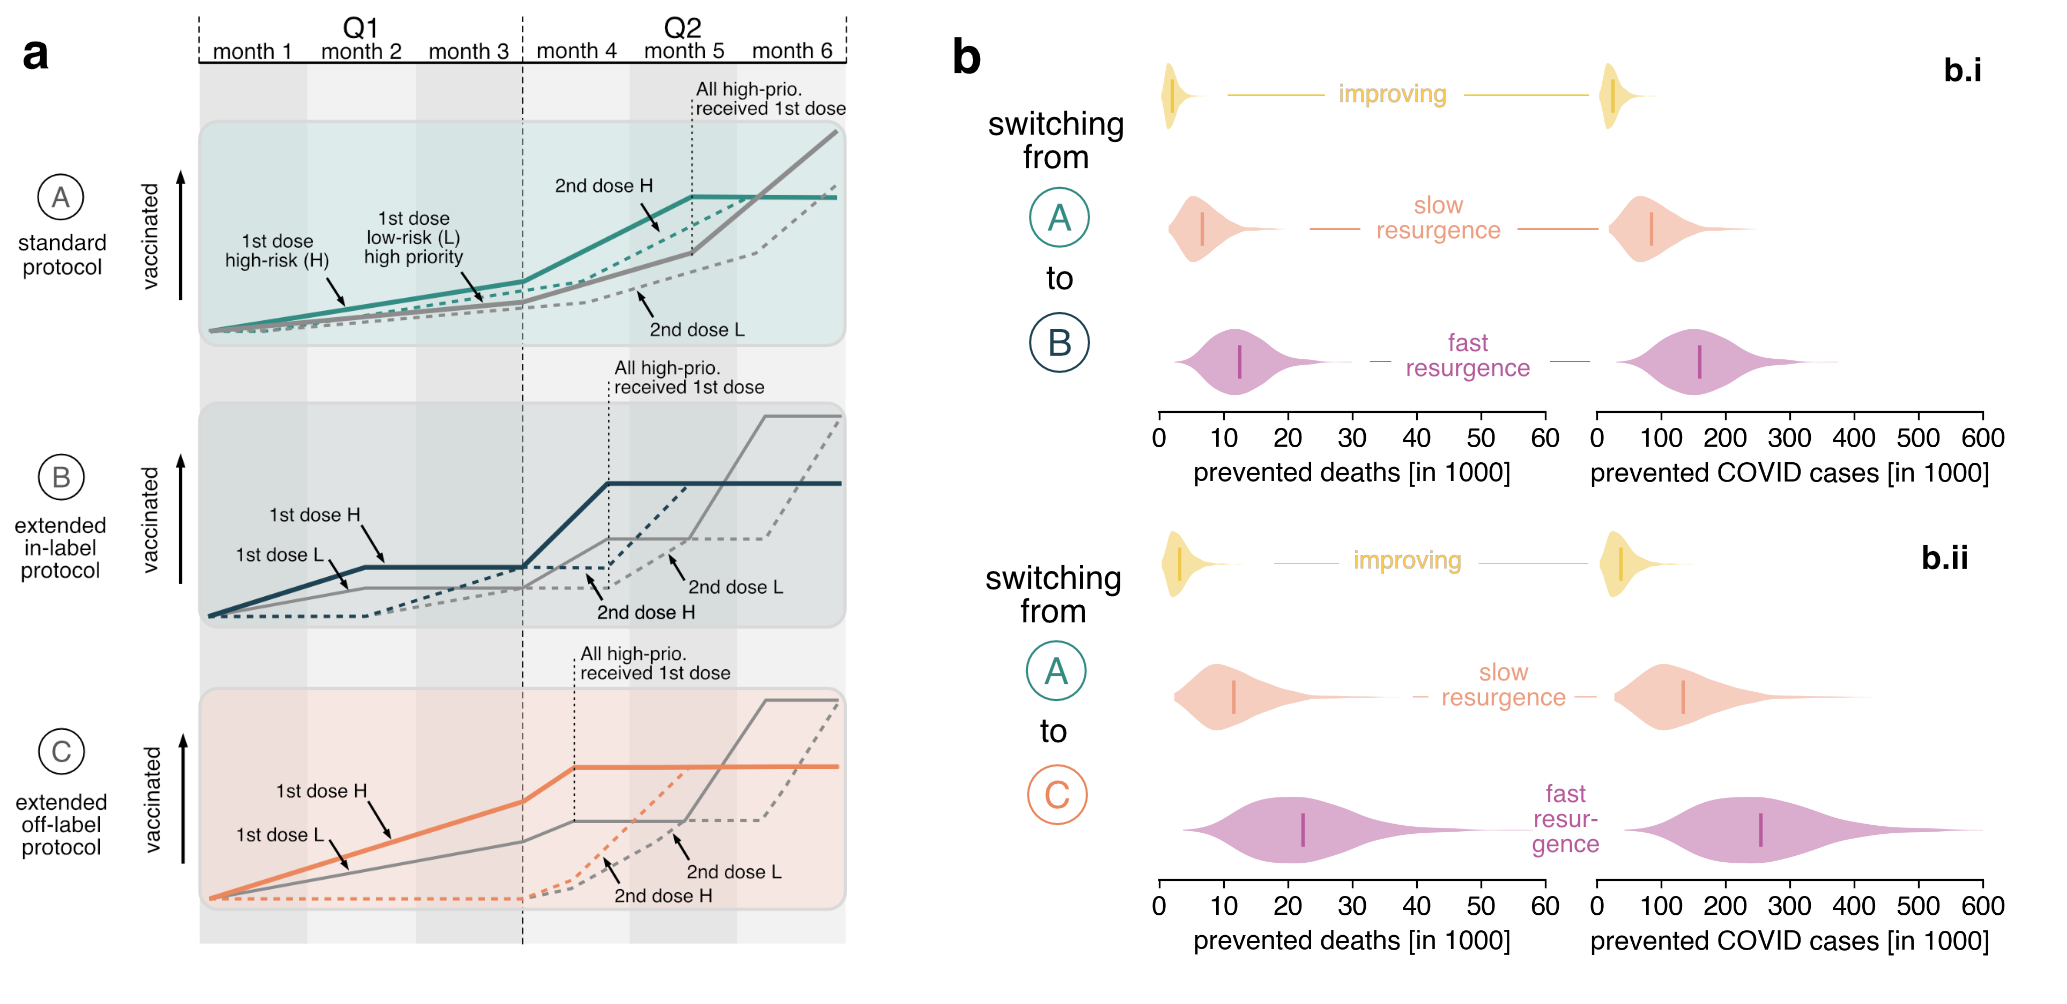
We first investigated the extreme scarcity situation where the number of delivered doses in Q2 equals the low number of delivered doses in Q1 (see Fig. 2). The course of the pandemic in the near future (Fig. 2b) has the most substantial impact on the success of a change in strategy in terms of the absolute number of high-risk-group deaths prevented (Fig. 2c). If the expected incidence decreases in the near future, vaccination according to the extended off-label protocol (Fig. 2c.ii) will prevent an average of 3,700 deaths. If the incidence resurges within the first six months of vaccine roll-out, an average of 14,600 deaths may be prevented by switching to the extended off-label protocol, reaching a value of 28,400 prevented deaths for a fast resurgence. These values are reduced by 43% to 49% when the vaccination protocol is changed to the extended in-label protocol instead (see Fig. 2c.i and Tab. 1), resulting in 2,100-14,600 deaths prevented. The advantage of changing to extended protocols decreases by if more doses are available in the second quarter (see Fig. 3 and Tab. 2) but remain of similar order. Overall, we observe a highly correlated relationship between the intensity of the epidemic and the success of a change in protocol: the more intense the epidemic, the more deaths will be prevented by delaying the second dose.
![[Uncaptioned image]](/html/2102.13600/assets/x2.png)
With respect to the number of symptomatic COVID-19 cases in the high-risk group, a greater reduction can be expected within the first six months of vaccine rollout should any of the extended protocols be implemented (Figs. 2c and 3b), which is caused by the dramatic increase in the number of people protected by the initial vaccine dose in spite of lower efficacy. Note that the number of prevented COVID-19 cases is directly proportional to the fraction of infected individuals that will display symptoms, which is an additional model parameter (here chosen as 83%).
In general, the number of prevented symptomatic COVID-19 cases varies between simulations and scenarios. Nevertheless, the model suggests the general rule: the worse the pandemic progresses in the near future, the more worthwhile a change in protocol. However, if the first half of 2021 is followed by another epidemic wave in the second half of the year, a higher number of symptomatic cases in the high-risk group can be expected under the off-label extended protocol compared to the standard protocol, because of assumed reduced vaccine efficacy. However, because protection against death is nearly 100%, a substantial number of deaths will still be prevented.
A potential drawback of extended protocols is a negative impact on the population’s attitude towards COVID-19 vaccination. We therefore also examined the potential negative effect that a publicly announced change in strategy may have on the confidence of the population and, consequently, the willingness to vaccinate.
A survey experiment within the German COVID-19 Snapshot Monitoring (wave 34, betsch_monitoring_2020 ; betsch_germany_2020 ; betsch_ergebnisse_nodate ) compared the standard protocol to both extended in-label and off-label strategies (; methods and data see ref. betsch_consequences_2021 ). In a forced-choice setting, 59.9% opted for the standard protocol, 30.3% for the extended in-label, and 8.6% extended off-label protocol (rest: missing). However, the decrease in the mean willingness to get vaccinated after learning about the delay of doses was minimal and non-significant: of those willing to be vaccinated before the change in strategies, the average willingness to get vaccinated decreased by 1.5% in the extended in-label, and 3.1% in the extended off-label condition). In the relevant 65+ age group, the change to the extended off-label protocol led to a reduction of 5%. For the extended in-label protocol, we found a small increase in the number of people willing to get vaccinated (Fig. 4a). However, the sample size in the higher age groups was rather small, so that the values reported above might be attributed to noise. Confidence in vaccine safety decreased slightly in the off-label condition betsch_beyond_2018 . This change, however, did not explain the small decrease in the intention to get vaccinated in the off-label condition. Pre-existing vaccine hesitancy also did not affect the evaluation of the strategies. In sum, detrimental effects of the willingness to vaccinate would likely be minimal.

Nevertheless, we compare the number of deaths prevented in the high-risk group by a protocol change, assuming that such a change reduces the number of those willing to vaccinate in the high-risk group by 5% and 10% (i.e. from 12 million to 11.4 million and to 10.8 million, respectively), see Fig. 4b. We find that even with a 5- to 10-percent reduction in those willing to get vaccinated, there is still a positive impact of a protocol change on the number of deaths as well as prevented symptomatic cases. For a 10% reduction in the extended off-label protocol, the order of deaths prevented is similar to that of deaths prevented switching to the extended in-label protocol with a 0% reduction. Approximately, a 30% reduction in vaccination willingness is required to observe negative effects of the extended off-label protocol compared to the standard protocol regarding the number of prevented COVID-19 cases in the high-risk group (see SI).
If we assume that vaccine efficacy against disease after the first dose is only 80% and that this value is maintained, but not increased, by administering the second dose after 12 weeks (which corresponds to a 100% increase in the assumed probability of showing symptoms after infection), the absolute number of symptomatic cases prevented by the change in strategy decreases by approximately 26-42%. Even if we increase the post-vaccination IFR drastically by a factor of 50 (equivalent to reducing efficacy against death to 95%), the number of prevented deaths decreases only by 11–18% (see SI).
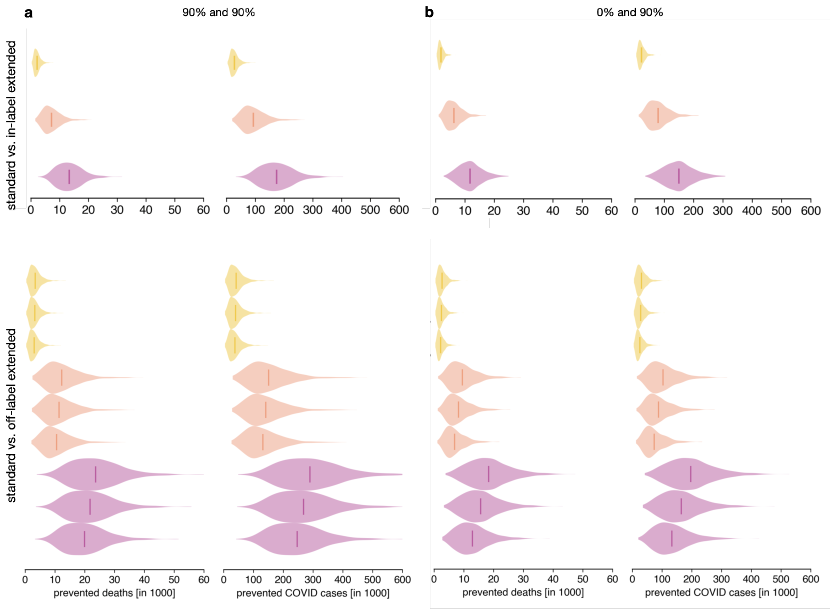
Conservatively, and because exact values are unknown at the time of writing, we assumed a zero transmission reduction for vaccinated, yet infected individuals. If we assumed large transmission reductions (90% for both doses), the number of prevented deaths and prevented symptomatic cases would increase by a low percentage for both extended in-label and off-label protocols. If, instead, we analyzed an extreme and unbalanced scenario where the first dose does not reduce transmission probability for such individuals but the second dose reduces transmission by 90%, a switch to extended protocols would still be beneficial, but would reduce the prevented deaths and cases by 13–30% as compared to results obtained using the original assumptions.
These analyses suggest that earlier protection of a larger group of high-risk individuals has a greater systemic protective effect in a hypothetical off-label vaccination protocol, even if switching protocols might lead to a reduction in vaccine adherence or vaccine efficacy.
IV Discussion and conclusion
The results suggest that switching to an alternative vaccination strategy (12-week delay of the second dose) of the currently available mRNA vaccines against COVID-19 could prevent an additional number of deaths in the four to five digit range for hypothetical vaccine rollout scenarios in Germany. Such benefits are reached should incidence resurge, for instance in the case of the spread of one of the recently discovered more contagious viral variants—given that the existing vaccines are effective against these variants. This is true even for a low reduction in willingness to vaccinate induced by a change in protocol. A switch to extended protocols is even more beneficial when supply of vaccines remains limited. If nonpharmaceutical interventions show effect in the first half of 2021 and the incidence remains low over the first half of 2021, however, the number of deaths prevented by a change in protocol drops to lower values in the three- to four-digit range. The respective values are likewise reduced if vaccine efficacy is lower than anticipated but remain of similar magnitude nonetheless. If a change in strategy were adopted, damage to vaccine confidence and willingness to get vaccinated needs to be prevented. Results of the online survey in Germany showed that protocol changes would likely have only minimal detrimental effects on the willingness to get vaccinated. However, a shift in protocols would increase the need for communication measures as the survey also showed that deviating from the standard protocol was not the best preferred solution despite a high number of deaths prevented. In the course of a feasibility study it could be determined, for example, to what extent a voluntary three-month waiver of the second dose allows additional vaccinations without reducing the willingness to vaccinate, and whether the higher vaccination rate achieved in this way justifies potential other risks.
Risks related to delaying the second dose of vaccination which are not considered here include (i) the possibility of infection enhancing antibodies (antibody dependent enhancement, ADE), (ii) the increased likelihood of the development of escape mutations of the virus, and (iii) that the high efficacy of the first dose does not persist.
ADE has not been shown after vaccination so far, neither after first nor second dose. Given the large number of people immunized so far and that ADE is likely to occur early in the course of vaccination, the risk appears to be small. An increased mutation pressure through the combination of imperfect immunity and high case loads (peak risk) cannot be ruled out. However, it is unclear if the delay of the second dose increases or decreases mutation pressure, since an early first dose reduces case load but may at the same time increase selection pressure, the net effect being unclear. Loss of protection of neutralizing antibody titers between first and second dose in extended second dose protocols is possible but unlikely given high titers following first dose mRNA vaccination.
Despite the benefits and advantages of changing the standard protocol and delaying the second dose that persist even if vaccination adherence should drop in response to changing protocols, the results must be viewed as part of a wider context and must be carefully weighed against a number of risks that are difficult to quantify and beyond the scope of the current analysis. In fact, the model does not account for several of the widely discussed and difficult-to-calculate risks of postponing the second vaccination that must be taken into account when viewed as part of a practical public health guide line. The current model is limited and intentionally designed to estimate the epidemiological consequences in terms of the expected change in the number of deaths and COVID-19 cases only, and helps with the assessment of how benefits or disadvantages may depend on parameters of the system.
Acknowledgments
BFM is financially supported as an Add-On Fellow for Interdisciplinary Life Science by the Joachim Herz Stiftung. MMH was supported by the European Union’s Horizon 2020 research and innovation programme under grant agreement No 101003480 and by German Federal Ministry of Education and Research within the project CoViDec (FKZ: 01KI20102). We express our gratitude to C. Drosten for helpful comments during the research process. BFM would like to thank W. Wu for productive discussions. DB would like to thank I. Mortimer and V. Hardapple for valuable comments on the manuscript.
References
- [1] Israel Ministry of Health. Corona virus in Israel - general situation, 2021. URL https://datadashboard.health.gov.il/COVID-19/general.
- [2] Commissario straordinario per l’emergenza Covid-19 Presidenza del Consiglio dei Ministri. Covid-19 Opendata Vaccines, January 2021. URL https://github.com/italia/covid19-opendata-vaccini.
- [3] Pflege und Konsumentenschutz Bundesministerium für Soziales, Gesundheit. Corona-Schutzimpfung in österreich, 2021. URL https://info.gesundheitsministerium.gv.at.
- [4] Santé publique France. Données relatives aux personnes vaccinées contre la Covid-19 (VAC-SI), January 2021. URL https://www.data.gouv.fr/en/datasets/donnees-relatives-aux-personnes-vaccinees-contre-la-covid-19-1/.
- [5] Robert Koch Institute. Digitales Impfquotenmonitoring zur COVID-19-Impfung, 2021. URL https://www.rki.de/DE/Content/InfAZ/N/Neuartiges_Coronavirus/Daten/Impfquoten-Tab.html.
- [6] Fernando P. Polack, Stephen J. Thomas, Nicholas Kitchin, Judith Absalon, Alejandra Gurtman, Stephen Lockhart, John L. Perez, Gonzalo Pérez Marc, Edson D. Moreira, Cristiano Zerbini, Ruth Bailey, Kena A. Swanson, Satrajit Roychoudhury, Kenneth Koury, Ping Li, Warren V. Kalina, David Cooper, Robert W. Frenck, Laura L. Hammitt, Özlem Türeci, Haylene Nell, Axel Schaefer, Serhat Ünal, Dina B. Tresnan, Susan Mather, Philip R. Dormitzer, Uğur Şahin, Kathrin U. Jansen, and William C. Gruber. Safety and Efficacy of the BNT162b2 mRNA Covid-19 Vaccine. New England Journal of Medicine, 383(27):2603–2615, December 2020. doi: 10.1056/NEJMoa2034577. URL http://www.nejm.org/doi/10.1056/NEJMoa2034577.
- [7] Merryn Voysey, et al. Safety and efficacy of the ChAdOx1 nCoV-19 vaccine (AZD1222) against SARS-CoV-2: an interim analysis of four randomised controlled trials in Brazil, South Africa, and the UK. The Lancet, 397(10269):99–111, January 2021. doi: 10.1016/S0140-6736(20)32661-1. URL https://linkinghub.elsevier.com/retrieve/pii/S0140673620326611.
- [8] Gabriel Chodcik, Lilac Tene, Tal Patalon, Sivan Gazit, Amir Ben-Tov, Dani Cohen, and Khitam Muhsen. The effectiveness of the first dose of BNT162b2 vaccine in reducing SARS-CoV-2 infection 13-24 days after immunization: real-world evidence. medRxiv, Infectious Diseases (except HIV/AIDS), January 2021. URL http://medrxiv.org/lookup/doi/10.1101/2021.01.27.21250612.
- [9] Sabine Vygen-Bonnet, Judith Koch, Christian Bogdan, Thomas Harder, Ulrich Heininger, Kerstin Kling, Martina Littmann, Joerg Meerpohl, Heidi Meyer, Thomas Mertens, Nora Schmid-Küpke, Stefan Scholz, Martin Terhardt, Marina Treskova-Schwarzbach, Klaus Überla, Marianne Van Der Sande, Ole Wichmann, Sabine Wicker, Ursula Wiedermann, Verina Wild, and Rüdiger Von Kries. Beschluss und Wissenschaftliche Begründung der Ständigen Impfkommission (STIKO) für die COVID-19-Impfempfehlung. December 2020. doi: 10.25646/7755. URL https://edoc.rki.de/handle/176904/7579.
- [10] Jared Bullard, Kerry Dust, Duane Funk, James E Strong, David Alexander, Lauren Garnett, Carl Boodman, Alexander Bello, Adam Hedley, Zachary Schiffman, Kaylie Doan, Nathalie Bastien, Yan Li, Paul G Van Caeseele, and Guillaume Poliquin. Predicting Infectious Severe Acute Respiratory Syndrome Coronavirus 2 From Diagnostic Samples. Clinical Infectious Diseases, 71(10):2663–2666, December 2020. ISSN 1058-4838, 1537-6591. doi: 10.1093/cid/ciaa638. URL https://academic.oup.com/cid/article/71/10/2663/5842165.
- [11] Interim recommendations for use of the Moderna mRNA-1273 vaccine against COVID-19, January 2021a. URL https://www.who.int/publications/i/item/interim-recommendations-for-use-of-the-moderna-mrna-1273-vaccine-against-covid-19.
- [12] Interim recommendations for use of the Pfizer– BioNTech COVID-19 vaccine, BNT162b2, under Emergency Use Listing, January 2021b. URL https://www.who.int/publications/i/item/WHO-2019-nCoV-vaccines-SAGE_recommendation-BNT162b2-2021.1.
- [13] Kamal Abu Jabal, Hila Ben-Amram, Karine Beiruti, Yunis Batheesh, Christian Sussan, Salman Zarka, and Michael Edelstein. Impact of age, ethnicity, sex and prior infection status on immunogenicity following a single dose of the BNT162b2 mRNA COVID-19 vaccine: real-world evidence from healthcare workers, Israel, December 2020 to January 2021. Eurosurveillance, 26(6):2100096, February 2021. doi: 10.2807/1560-7917.ES.2021.26.6.2100096. European Centre for Disease Prevention and Control. URL https://www.eurosurveillance.org/content/10.2807/1560-7917.ES.2021.26.6.2100096.
- [14] Jon Cohen. One-dose COVID-19 vaccine offers solid protection against severe disease, Science, January 2021. URL https://www.sciencemag.org/news/2021/01/one-dose-covid-19-vaccine-offers-solid-protection-against-severe-disease.
- [15] Sharon Amit, Gili Regev-Yochay, Arnon Afek, Yitshak Kreiss, and Eyal Leshem. Early rate reductions of SARS-CoV-2 infection and COVID-19 in BNT162b2 vaccine recipients. The Lancet, February 2021. ISSN 0140-6736, 1474-547X. doi: 10.1016/S0140-6736(21)00448-7. URL https://www.thelancet.com/journals/lancet/article/PIIS0140-6736(21)00448-7/abstract.
- [16] Public Health England. Annex A: Report to JCVI on estimated efficacy of a single dose of Pfizer BioNTech (BNT162b2 mRNA) vaccine and of a single dose of ChAdOx1 vaccine (AZD1222), 2021.
- [17] Department of Health and Social Care. Priority groups for coronavirus (COVID-19) vaccination: advice from the JCVI, 30 December 2020, December 2020. URL https://www.gov.uk/government/publications/priority-groups-for-coronavirus-covid-19-vaccination-advice-from-the-jcvi-30-december-2020.
- [18] Science advisers: publish evidence behind COVID vaccine dosing strategy. Nature, 589(7841):169–170, January 2021. doi: 10.1038/d41586-021-00045-8. URL https://www.nature.com/articles/d41586-021-00045-8. Number: 7841 Publisher: Nature Publishing Group.
- [19] Gareth Iacobucci and Elisabeth Mahase. Covid-19 vaccination: What’s the evidence for extending the dosing interval? BMJ, 372:n18, January 2021. ISSN 1756-1833. doi: 10.1136/bmj.n18. URL https://www.bmj.com/content/372/bmj.n18. Publisher: British Medical Journal Publishing Group Section: News.
- [20] Herb F Sewell, John F R Robertson, Marcia Stewart, Denise Kendrick, and Sheila M Bird. Revisiting the UK’s strategy for delaying the second dose of the Pfizer covid-19 vaccine. The BMJ Opinion. January 2021. URL https://blogs.bmj.com/bmj/2021/01/20/revisiting-the-uks-strategy-for-delaying-the-second-dose-of-the-pfizer-covid-19-vaccine/.
- [21] Xutong Wang, Zhanwei Du, Kaitlyn E. Johnson, Spencer J. Fox, Michael Lachmann, Jason S. McLellan, and Lauren Ancel Meyers. The impacts of COVID-19 vaccine timing, number of doses, and risk prioritization on mortality in the US. medRxiv, page 2021.01.18.21250071, January 2021. doi: 10.1101/2021.01.18.21250071. URL https://www.medrxiv.org/content/10.1101/2021.01.18.21250071v1.
- [22] European Medicines Agency. Clarification of Comirnaty dosage interval, January 2021. URL https://www.ema.europa.eu/en/news/clarification-comirnaty-dosage-interval.
- [23] Federal Ministry of Health of Germany. Informationen zur Impfstoffbeschaffung gegen COVID-19. Technical report, February 2021.
- [24] Roy M. Anderson and Robert M. May. Infectious diseases of humans: dynamics and control. Oxford Univ. Press, Oxford, reprinted edition, 2010. ISBN 978-0-19-854040-3.
- [25] Matt J Keeling and Pejman Rohani. Modeling infectious diseases in humans and animals. Princeton University Press, Princeton, 2011. ISBN 978-1-4008-4103-5. URL http://public.eblib.com/choice/publicfullrecord.aspx?p=769616.
- [26] Sahamoddin Khailaie, Tanmay Mitra, Arnab Bandyopadhyay, Marta Schips, Pietro Mascheroni, Patrizio Vanella, Berit Lange, Sebastian C. Binder, and Michael Meyer-Hermann. Development of the reproduction number from coronavirus SARS-CoV-2 case data in Germany and implications for political measures. BMC Medicine, 19(1):32, January 2021. doi: 10.1186/s12916-020-01884-4. URL https://doi.org/10.1186/s12916-020-01884-4.
- [27] Joël Mossong, Niel Hens, Mark Jit, Philippe Beutels, Kari Auranen, Rafael Mikolajczyk, Marco Massari, Stefania Salmaso, Gianpaolo Scalia Tomba, Jacco Wallinga, Janneke Heijne, Malgorzata Sadkowska-Todys, Magdalena Rosinska, and W. John Edmunds. Social Contacts and Mixing Patterns Relevant to the Spread of Infectious Diseases. PLOS Medicine, 5(3):e74, March 2008. ISSN 1549-1676. doi: 10.1371/journal.pmed.0050074. URL https://journals.plos.org/plosmedicine/article?id=10.1371/journal.pmed.0050074.
- [28] Sebastian Funk. socialmixr: R package for deriving social mixing matrices from survey data, November 2020. URL https://github.com/sbfnk/socialmixr.
- [29] Amber L. Mueller, Maeve S. McNamara, and David A. Sinclair. Why does COVID-19 disproportionately affect older people? Aging, 12(10):9959–9981, May 2020. ISSN 1945-4589. doi: 10.18632/aging.103344. URL https://www.aging-us.com/lookup/doi/10.18632/aging.103344.
- [30] Andrew T. Levin, William P. Hanage, Nana Owusu-Boaitey, Kensington B. Cochran, Seamus P. Walsh, and Gideon Meyerowitz-Katz. Assessing the age specificity of infection fatality rates for COVID-19: systematic review, meta-analysis, and public policy implications. European Journal of Epidemiology, 35(12):1123–1138, December 2020. ISSN 0393-2990, 1573-7284. doi: 10.1007/s10654-020-00698-1. URL http://link.springer.com/10.1007/s10654-020-00698-1.
- [31] Oyungerel Byambasuren, Magnolia Cardona, Katy Bell, Justin Clark, Mary-Louise McLaws, and Paul Glasziou. Estimating the extent of asymptomatic COVID-19 and its potential for community transmission: Systematic review and meta-analysis. Official Journal of the Association of Medical Microbiology and Infectious Disease Canada, 5(4):223–234, December 2020. ISSN 2371-0888. doi: 10.3138/jammi-2020-0030. URL https://jammi.utpjournals.press/doi/10.3138/jammi-2020-0030.
- [32] John P.A. Ioannidis, Sally Cripps, and Martin A. Tanner. Forecasting for COVID-19 has failed. International Journal of Forecasting, page S0169207020301199, August 2020. ISSN 01692070. doi: 10.1016/j.ijforecast.2020.08.004. URL https://linkinghub.elsevier.com/retrieve/pii/S0169207020301199.
- [33] Bastian Prasse, Massimo A Achterberg, and Piet Van Mieghem. Fundamental Limits of Predicting Epidemic Outbreaks. Technical Report report2020410, Delft University of Technology, April 2020. URL https://www.nas.ewi.tudelft.nl/people/Piet/papers/TUD2020410_prediction_limits_epidemic_outbreaks.pdf.
- [34] S. Funk, E. Gilad, C. Watkins, and V. A. A. Jansen. The spread of awareness and its impact on epidemic outbreaks. Proceedings of the National Academy of Sciences, 106(16):6872–6877, April 2009. ISSN 0027-8424, 1091-6490. doi: 10.1073/pnas.0810762106. URL http://www.pnas.org/cgi/doi/10.1073/pnas.0810762106.
- [35] Per Bak, Chao Tang, and Kurt Wiesenfeld. Self-organized criticality: An explanation of the 1/f noise. Physical Review Letters, 59(4):381–384, July 1987. doi: 10.1103/PhysRevLett.59.381. URL https://link.aps.org/doi/10.1103/PhysRevLett.59.381.
- [36] Per Bak and Kim Sneppen. Punctuated equilibrium and criticality in a simple model of evolution. Physical Review Letters, 71(24):4083–4086, December 1993. doi: 10.1103/PhysRevLett.71.4083. URL https://link.aps.org/doi/10.1103/PhysRevLett.71.4083.
- [37] Cornelia Betsch, Lothar H Wieler, and Katrine Habersaat. Monitoring behavioural insights related to COVID-19. The Lancet, 395(10232):1255–1256, April 2020a. ISSN 01406736. doi: 10.1016/S0140-6736(20)30729-7. URL https://linkinghub.elsevier.com/retrieve/pii/S0140673620307297.
- [38] Cornelia Betsch, Lothar Wieler, Michael Bosnjak, Michael Ramharter, Volker Stollorz, Saad Omer, Lars Korn, Philipp Sprengholz, Lisa Felgendreff, Sarah Eitze, and Philipp Schmid. Germany COVID-19 Snapshot Monitoring (COSMO Germany): Monitoring knowledge, risk perceptions, preventive behaviours, and public trust in the current coronavirus outbreak in Germany. March 2020b. doi: 10.23668/psycharchives.2776. URL https://www.psycharchives.org/handle/20.500.12034/2386. Accepted: 2020-03-03T13:41:21Z Publisher: PsychArchives.
- [39] Cornelia Betsch. Ergebnisse aus dem COVID-19 Snapshot MOnitoring COSMO: Die psychologische Lage. Technical Report 34 Wellen KW 04, Universität Erfurt - Philosophische Fakultät. URL https://dfncloud.uni-erfurt.de/s/izLRePpZi85tQRX.
- [40] Cornelia Betsch, Lars Korn, Philipp Sprengholz, Dirk Brockmann, Benjamin F. Maier, Angelique Burdinski, and Annika Rose. Consequences of postponing the second vaccine dose: a model analysis. January 2021. doi: None. URL https://osf.io/4v5ay/.
- [41] Cornelia Betsch, Philipp Schmid, Dorothee Heinemeier, Lars Korn, Cindy Holtmann, and Robert Böhm. Beyond confidence: Development of a measure assessing the 5C psychological antecedents of vaccination. PLOS ONE, 13(12):e0208601, December 2018. ISSN 1932-6203. doi: 10.1371/journal.pone.0208601. URL https://dx.plos.org/10.1371/journal.pone.0208601.
- [42] Kevin Heng and Christian L. Althaus. The approximately universal shapes of epidemic curves in the Susceptible-Exposed-Infectious-Recovered (SEIR) model. Scientific Reports, 10(1):19365, November 2020. ISSN 2045-2322. doi: 10.1038/s41598-020-76563-8. URL https://www.nature.com/articles/s41598-020-76563-8.
- [43] J Wallinga and M Lipsitch. How generation intervals shape the relationship between growth rates and reproductive numbers. Proceedings of the Royal Society B: Biological Sciences, 274(1609):599–604, February 2007. doi: 10.1098/rspb.2006.3754. URL https://royalsocietypublishing.org/doi/10.1098/rspb.2006.3754.
- [44] “Fallzahlen in Deutschland,” Robert Koch Institute.
- [45] H. Streeck et al., “Infection fatality rate of SARS-CoV-2 infection in a German community with a super-spreading event,” medRxiv, Infectious Diseases (except HIV/AIDS), May 2020.
- [46] C. Santos-Hövener et al., “Seroepidemiologische Studie zur Verbreitung von SARS-CoV-2 in der Bevölkerung an besonders betroffenen Orten in Deutschland – Studienprotokoll von CORONA-MONITORING lokal,” Sept. 2020.
- [47] Robert Koch Institute. Fallzahlen in Deutschland. Data, Robert Koch Institute (RKI). URL https://npgeo-corona-npgeo-de.hub.arcgis.com/datasets/dd4580c810204019a7b8eb3e0b329dd6_0.
- [48] Hendrik Streeck, Bianca Schulte, Beate M. Kümmerer, Enrico Richter, Tobias Höller, Christine Fuhrmann, Eva Bartok, Ramona Dolscheid, Moritz Berger, Lukas Wessendorf, Monika Eschbach-Bludau, Angelika Kellings, Astrid Schwaiger, Martin Coenen, Per Hoffmann, Birgit Stoffel-Wagner, Markus M. Nöthen, Anna-Maria Eis-Hübinger, Martin Exner, Ricarda Maria Schmithausen, Matthias Schmid, and Gunther Hartmann. Infection fatality rate of SARS-CoV-2 infection in a German community with a super-spreading event. medRxiv, Infectious Diseases (except HIV/AIDS), May 2020. URL http://medrxiv.org/lookup/doi/10.1101/2020.05.04.20090076.
- [49] Claudia Santos-Hövener, Markus A. Busch, Carmen Koschollek, Martin Schlaud, Jens Hoebel, Robert Hoffmann, Hendrik Wilking, Sebastian Haller, Jennifer Allen, Jörg Wernitz, Hans Butschalowsky, Tim Kuttig, Silke Stahlberg, Julia Strandmark, Angelika Schaffrath-Rosario, Antje Gößwald, Andreas Nitsche, Victor Cormann, Osamah Hamouda, Lothar H. Wieler, Christian H. M. Drosten, Lars Schaade, and Thomas Lampert. Seroepidemiologische Studie zur Verbreitung von SARS-CoV-2 in der Bevölkerung an besonders betroffenen Orten in Deutschland – Studienprotokoll von CORONA-MONITORING lokal. September 2020. doi: 10.25646/7052.4. URL https://edoc.rki.de/handle/176904/6929.4.
- [50] S. Funk and V. A. A. Jansen, “The Talk of the Town: Modelling the Spread of Information and Changes in Behaviour,” in Modeling the Interplay Between Human Behavior and the Spread of Infectious Diseases (P. Manfredi and A. D’Onofrio, eds.), pp. 93–102, New York, NY: Springer, 2013.
- [51] N. G. Davies et al., “Effects of non-pharmaceutical interventions on COVID-19 cases, deaths, and demand for hospital services in the UK: a modelling study,” The Lancet Public Health, vol. 5, pp. e375–e385, July 2020.
- [52] Sebastian Funk and Vincent A. A. Jansen. The Talk of the Town: Modelling the Spread of Information and Changes in Behaviour. In Piero Manfredi and Alberto D’Onofrio, editors, Modeling the Interplay Between Human Behavior and the Spread of Infectious Diseases, pages 93–102. Springer, New York, NY, 2013. ISBN 978-1-4614-5474-8. doi: 10.1007/978-1-4614-5474-8_6. URL https://doi.org/10.1007/978-1-4614-5474-8_6.
- [53] Nicholas G. Davies, Adam J. Kucharski, Rosalind M. Eggo, Amy Gimma, W. John Edmunds, Thibaut Jombart, Kathleen O’Reilly, Akira Endo, Joel Hellewell, Emily S. Nightingale, Billy J. Quilty, Christopher I. Jarvis, Timothy W. Russell, Petra Klepac, Nikos I. Bosse, Sebastian Funk, Sam Abbott, Graham F. Medley, Hamish Gibbs, Carl A. B. Pearson, Stefan Flasche, Mark Jit, Samuel Clifford, Kiesha Prem, Charlie Diamond, Jon Emery, Arminder K. Deol, Simon R. Procter, Kevin van Zandvoort, Yueqian Fiona Sun, James D. Munday, Alicia Rosello, Megan Auzenbergs, Gwen Knight, Rein M. G. J. Houben, and Yang Liu. Effects of non-pharmaceutical interventions on COVID-19 cases, deaths, and demand for hospital services in the UK: a modelling study. The Lancet Public Health, 5(7):e375–e385, July 2020. ISSN 2468-2667. doi: 10.1016/S2468-2667(20)30133-X. URL https://www.thelancet.com/journals/lanpub/article/PIIS2468-2667(20)30133-X/abstract.
- [54] Frank Schlosser, Benjamin F. Maier, Olivia Jack, David Hinrichs, Adrian Zachariae, and Dirk Brockmann. COVID-19 lockdown induces disease-mitigating structural changes in mobility networks. Proceedings of the National Academy of Sciences, 117(52):32883–32890, December 2020. ISSN 0027-8424, 1091-6490. doi: 10.1073/pnas.2012326117. URL https://www.pnas.org/content/117/52/32883. Publisher: National Academy of Sciences Section: Physical Sciences.
- [55] Colin J. Carlson, Ana C. R. Gomez, Shweta Bansal, and Sadie J. Ryan. Misconceptions about weather and seasonality must not misguide COVID-19 response. Nature Communications, 11(1):4312, August 2020. ISSN 2041-1723. doi: 10.1038/s41467-020-18150-z. URL https://www.nature.com/articles/s41467-020-18150-z.
- [56] Benjamin F. Maier. epipack: Fast prototyping of epidemiological models, January 2021. URL https://github.com/benmaier/epipack.
- [57] Benjamin F. Maier and Angelique Burdinski. devacc: A model to evaluate the potential benefits of delaying the second mRNA COVID-19 vaccine dose, February 2021. URL https://zenodo.org/record/4562594.
Supplementary Information
Appendix A Model
We first define a deterministic compartmental infection model based on a susceptible-exposed-infected-recovered (SEIR) model with additional compartments for vaccination status and parallel counting of symptomatic cases, confirmed cases, and fatalities. We further consider the population to be structured according to risk-group affiliation. Such models are well-established and -studied keeling_modeling_2011 , anderson_infectious_2010 .
In this model, individuals are part of either low-risk () or high-risk () groups of sizes and , respectively, such that the total population size is given as . An affiliation with group will be denoted by a superscript in the following but will rarely be used explicitly because individuals cannot change status between these population groups by any means.
Initially, all individuals of group are “susceptible” with protection level zero (received zero vaccine doses), i.e. are part of compartment (note that we also denote the probability of any person of group to be susceptible as and similarly for other compartments). Individuals may be vaccinated according to three protocols. In the standard protocol, people are vaccinated with a single dose, while the second dose is given out immediately but held back for approximately three weeks to be given to the same person. This dose therefore cannot be used on other individuals during this time. In the “extended in-label protocol”, a person is vaccinated with a single dose, but the second dose will not be held back. Instead, the remaining dose is administered to a second person. After days, a second dose will be given to both individuals, which represents the maximal time between the administration of two doses by the BNT162b2 vaccine for the vaccination to be considered “in-label”, i.e. administered as recommended by the manufacturer. The third, “extended off-label protocol” postpones the second dose for 12 weeks, i.e. days, which is considered an “off-label” vaccination but allows one to give twice as many individuals a first protection in the first quarter when vaccine doses are scarce. Note that throughout this paper, we define a quarter to have a duration of 84 days and 6 months to comprise 168 days.

Model equations will be defined in separate but consecutive phases that are defined for time intervals . The total amount of remaining vaccine doses at time will be denoted as for the first shot in the extended protocols, for all doses administered according to the standard protocol, and denoting the number of doses reserved for second shots in the extended protocols. We assume a constant vaccine supply rate and therefore a linear depletion of both vaccine doses and susceptibles with rates
such that
where
Here, refers to the total number of vaccine doses available to population group following shot . Upon receiving a vaccine dose, a susceptible individual transitions to either (extended protocols) or (standard protocol). In many countries, the employed vaccine roll-out strategies do not require individuals to prove that they have not yet been infected with SARS-CoV-2. Therefore, we consider two parallel vaccine rollouts and divide the population in “never had a SARS-CoV-2 infection” (denoted by default compartment symbols such as ) and “currently are infected with SARS-CoV-2 or have been infected in the past” (denoted by overlined compartment symbols ). When picking a non-vaccinated individual to be vaccinated at random, the probability to pick a truly susceptible person is , which means that the vaccine-related depletion of individuals with vaccine status zero is given as
Note that following the standard protocol, only half the number of people can be vaccinated per day initially as compared to the extended protocol (as explained above), hence a factor is introduced. The transitional term accounts for infections that happen in parallel to the vaccination process. We will define the force of infection further below. Note that the depletion of already infected individuals is given as
In the following we will omit the explicit definitions of changes in infectious/infected counterparts , as their equations of motion are equal to their respective non-infected counterparts bar an opposite sign in the infection terms.
Individuals that received the first dose (i.e. are part of , , or their respective overlined counterparts) are reaching protection with protection level 1 after an average duration of such that
A person that was vaccinated according to the standard protocol will receive the second dose approximately after reaching the first protection level. Afterwards, it takes another days to reach protection level 2. The remaining equations of motion for all standard-protocol individuals therefore read
Regarding the extended protocols, individuals that received the first dose and obtained the first protection level remain in compartment until they are vaccinated again with rate in a consecutive phase. The equations of motion read
Even though individuals of compartment receive a second dose after 12 weeks, we will conservatively assume that postponing the second dose merely upholds the protection achieved by the first dose and does not enhance it when administered after a duration longer than 6 weeks (as such a procedure is an off-label vaccination). For vaccinations by the in-label extended protocol, we instead assume that the second protection level is reached.
In total, we have
such that the total number of people in each population group remains constant (here, “i.c.” refers to “infectious counterparts”, i.e. the respective overlined compartments). Note that we define the sum in the equation above to be equal to 1.
In parallel to the vaccination process, individuals can become infected and infectious. We categorize susceptible individuals of group and protection level as
Then, for each group and protection level , the infection process is defined by the equations
Here, all quantities except , , and should be read as explicitly depending on group affiliation and protection level (sub- and superscripts are omitted for readability). We assume a universal average latency time of after which exposed individuals transition to compartment . We further assume a universal infectious period of after which individuals become non-infectious and immune or otherwise removed from the process (). We count individuals who pass away in compartment as the proportion of . Additionally, we track the cumulative amount of people who will become symptomatic (show symptoms of COVID-19) in compartment as the ratio of . Note that
i.e. the total population size in group remains constant at all times (we require the sum in the equation above to be equal to unity). Since infected individuals are counted twice in separate parts of the model, we have
as well. The total force of infection on any susceptible individual is given as
| (1) |
Here, is the average number of contacts a person of group has with a person of group (temporal and ensemble average). We scale the force of infection globally by the in-group temporal reproduction number of the low-risk group. We further decrease an individual’s susceptibility based on group affiliation and protection level using an assumed susceptibility reduction . Similarly, the infectivity of an infectious person of group and protection level is reduced based on a transmissibility reduction .
In addition to the default infection process, we count the cumulative number of all infected people with reporting delay as
In addition to the model equations, we find the daily incidence of cases in age group to be
| (2) |
As argued below, we assume that only a fraction of all infected individuals of risk group are reported. This implies that the total reported daily incidence is given as
| (3) |
Furthermore, following the derivation in heng_approximately_2020 , wallinga_how_2007 for SEIR models, we define the temporal effective reproduction number as
where we evaluate the growth rate as based on the incidence as
In this study, we are interested in how different vaccine distribution protocols influence the cumulative number of deaths in the high-risk group and the cumulative number of symptomatic cases in the high-risk group. Hence, we evaluate the observables
to compare the impact of any of the extended protocols. Here, represents the value of compartment at the end of the respective 6-month vaccine distribution protocol, i. e. their respective cumulative count.
Appendix B Population structure and parameter choices
The German national vaccine rollout strategy entails a tier-based provision of vaccines to people of different risk groups vygen-bonnet_beschluss_2020 . Here, we consider the first three tiers that comprise most of the individuals at high risk regarding death by COVID-19. Tier 1 contains individuals of age >80 and inhabitants of nursing homes ( million) as well as high-risk-of-exposure healthcare workers. Tier 2 entails individuals aged 75–79, individuals with diagnosed dementia, people with mental disabilities (all mentioned in total million), and other health care workers. Tier 3 contains, besides others, individuals aged 70–74 ( million). In total, the high-risk group contains about 15.7 million people. This group will be referred to by the superscript in the following. Tier 1 and tier 2 alone total about million individuals of which 12.1 million are in the high-risk group (the rest being medical workers).
In order to structure the population in a way that reflects both the size of the high risk group as well as the higher age of people within the risk group, we choose
with , and , which is the contact structure one obtains when distributing the population into age strata and using data from the POLYMOD study with the open source R software “socialmixr” mossong_social_2008 , funk_socialmixr_2020 . We find that the contact matrix does not change substantially when choosing age strata [0,70) and 70+ which is closer to our high-risk group criteria but yields a much smaller high-risk group population size (due to the data being from 2005).
We calibrate the infection fatality ratio (IFR) for both risk groups based on the course of the pandemic in Germany in 2020 using data for age strata [0,59) (an approximation to group ) and 60+ (approximation to group ) due to the lack of more fine-grained data and find that by choosing IFRs of
the progression of the pandemic in Germany in 2020 is reflected reasonably well by the model (see Sec. C). We calibrate the model by comparing the 7-day running average of daily new reported cases and daily new deaths of official case counts robert_koch_institute_fallzahlen_nodate . These IFR values are within the reported bounds of a meta-review study on IFR by age levin_assessing_2020 and correspond to a population-wide IFR of 1.15%. The exact value of the IFR is, however, of less importance for our analysis. In order to accurately model the situation, we have to calibrate the model case fatality rate (CFR) to be equal to the reported CFR. Varying the IFR will have to be compensated by varying the respective dark factors accordingly to match the empirical CFR. If, then, reported incidence curves remain constant, the number of deaths will approximately remain constant, as well.
Based on the phase 3 studies for the Biontech/Pfizer and Moderna vaccines, we assume that the IFR decreases to diminishingly small values beginning 14 days after receiving one or two doses. In neither study, any participant that received the vaccine passed away by COVID-19 and only one person developed a severe case of COVID-19 as compared to 4 severe cases in the placebo group vygen-bonnet_beschluss_2020 . We therefore assume vaccine efficacies of
and set
We assume a uniform transmissibility reduction of for all groups and protection levels. Vaccine studies showed a reduction in the rate of viral shedding following SARS-CoV-2 infection in various animal models, yet vaccinated humans will manifest few if any symptoms—consequently, these individuals would not change their behavior (a typical cause for an effective transmission reduction in symptomatic cases), which we assume results in a diminishing net transmission reduction.
Regarding a susceptibility reduction of vaccinated individuals, preliminary results from Israel suggest a 51% efficacy against infection with SARS-CoV-2 12 days after receiving the first dose chodcik_effectiveness_2021 which we assume translates to a % reduction in susceptibility for those with protection level 1, i.e. . We further assume that this protection increases to for the second protection level.
While irrelevant for the dynamics of the system, we aim to estimate the number of prevented symptomatic COVID-19 cases, as well. Following ref. byambasuren_estimating_2020 , we set a population-wide probability for symptomatic infection of
We further implement a vaccine efficacy 14 days after receiving a second dose in-label as
Data from the BNT162b2 phase 3 study further suggests an efficacy of
12-14 days after receiving the first dose polack_safety_2020 . We implement these values as
Appendix C Calibration simulation
As initial conditions we choose , , , and (corresponding to Mar 4, 2020 when Jan 1, 2020 corresponds to ). We find that the temporal shape of the low-risk in-group reproduction number
| (4) |
replicates the daily fatalities in the age group 60+ during 2020 in Germany (see Fig. 6). We integrated Eqs. (6-93) using Euler’s method for with incremental steps of .
In order to explain differences in model incidence and observed incidence, we have to assume that overall, 2 in 13 of the infecteds in group were officially reported, and that 10 in 18 infecteds in group were reported. This corresponds to a dark factor of in the low-risk group and in the high-risk group, resulting in a population-wide dark factor of which is comparable to the results of sero-prevalence studies in Germany streeck_infection_2020 , santos-hovener_seroepidemiologische_2020 .
Note that official case data can be subject to fluctuations that are associated with reporting errors such as delay and erroneous entries, especially for case numbers that lie in the recent past. In order to test for the influence of such fluctuations, we varied the reproduction number in the last quarter of 2020 by 5% to find that such variations do not have any influence on our results, because they only influence the absolute cumulative value of symptomatic cases and deaths, but not their difference with respect to competing distribution protocols, which is our main observable.
Appendix D Stochastic simulations
As defined above, the model is fully deterministic. However, large-scale epidemic outbreaks are chaotic systems in the sense that environmental influences as well as behavioral and societal feedback loops make it impossible to predict the exact course of epidemics in the long-term funk_spread_2009 , funk_talk_2013 , davies_effects_2020 . Rather, several more general statements about the course of epidemics can be made, for instance that decreasing case counts are usually met with lifting restrictions and a return to normalcy, therefore causing another resurgence. One may also expect that lockdowns are implemented once case numbers rise again davies_effects_2020 . On shorter time scales, environmental changes may impact the contact structure schlosser_covid-19_2020 or viral transmission carlson_misconceptions_2020 . In order to model the stochasticity of these influences, we transform the deterministic model equations into stochastic differential equations by defining a fluctuating low-risk reproduction number
| (5) |
where is a Wiener process and the functions and are independent of the remaining system. As such, is entirely decoupled from all other equations of motion. In order to integrate the complete system numerically, it therefore suffices to integrate Eq. (5) once using the Euler–Maruyama method with . Afterwards, we can integrate the model equations using Euler’s method with the same . This is numerically equivalent to evaluating the whole system with the Euler–Maruyama method and enables us to evaluate the outcome of different vaccination strategies with the same time series . This means that even though we model a stochastic system, the consequences of different vaccine rollout strategies can be compared directly.
As initial condition, we choose the final value of Eq. (4) and redefine corresponding to Jan 1, 2021. Furthermore we define
i.e. an Ornstein-Uhlenbeck process with drift. For all simulations, we set and fix and , which generates model incidence curves that roughly replicate the autocorrelation time and standard deviation of the population-wide 7-day running average incidence curve in Germany in 2020. We also employ reflective boundary conditions at and .
As explained above, we can expect an initially decreasing incidence curve to resurge after a certain amount of time, causing a third wave because restrictions are lifted while case counts are low and people slowly return to their normal behavior. This leads to an increased effective reproduction number. In order to obtain model curves that replicate this behavior on a very slow, a slow, and a fast time-scale, we choose and set a drift of .
We dub reproduction number time series with as “improving” scenarios, those where as “slow resurgence” scenarios, and curves with as “fast resurgence” scenarios. We simulate reproduction number time series and use each to integrate the model equations for all vaccination scenarios.
Appendix E Varying vaccine efficacy, transmission reduction, and adherence
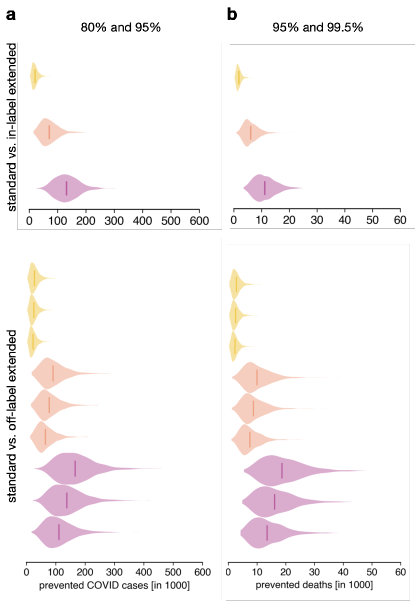

In our baseline model configuration, we assume efficacy against COVID-19 to be after the first and after the second dose as reported by the vaccine’s respective phase 3 studies. Vaccine efficacy against death is assumed to be and after reaching first and second protection levels, respectively. In order to test the robustness of our results regarding this baseline configuration, we performed additional sensitivity analyses where the efficacy of the first dose is substantially smaller than that provided by the second dose. In the following, we report the resulting relative changes of prevented deaths and COVID-19 cases with respect to the results obtained using the baseline configuration. Here, we only do analyses for vaccination distribution protocols shown in Fig. 3 of the main text.
First, we reduce first-dose efficacy against COVID-19 to while we keep the efficacy of the second dose fixed, therefore deliberately weakening the off-label protocol. A reduction from 90% to 80% efficacy implies an increase of 100% in the probability to show symptoms after infection, hence representing a strong change. As expected, we find that such a strong reduction in first-dose efficacy leads to a reduction in the number of prevented “high-risk” COVID-19 cases while the positive net effect remains (i.e. the number of prevented COVID-19 cases remains positive and large), see Fig. 7a). We find a 17% reduction in for the extended in-label protocol. Regarding the extended off-label protocol, is reduced by 26 for the “improved” and 35 for the “fast resurgence” scenario, respectively. Additionally reducing the adherence by 10% yields a reduction of 28 (“improved”) and 42 (“fast resurgence”) in , respectively. In summary, doubling the assumed probability of showing symptoms despite having received the first dose leads to a reduction in , showing that even in this case, switching to the extended in-label or even to the extended off-label protocol would be beneficial.
Second, we decrease the efficacy against death to values of for protection level 1 and for protection level 2. This is a 50-fold increase in the probability of death after infection as compared to the baseline configuration. For the extended in-label protocol, such a change leads to a reduction in prevented deaths. Regarding the extended off-label protocol, this reduction efficacy would yield an 11 to 15 reduction in prevented deaths (12 to 18 for a concurrent 10% reduction in adherence). In summary, even for extremely low values of vaccine efficacy against death, the number of lives saved by changing protocols remains positive and in the four- to low five-digit range.
Reduction in transmissibility (i.e. probability of transmission as quantified by viral shedding rates) for individuals that have been infected despite having received a vaccine is unknown at the time of writing. In the baseline configuration we have conservatively assumed that the vaccine causes no reduction in transmissibility for such individuals. Instead, in the following we want to analyze situations where the transmissibility reduction is large for both doses, as well as small for the first protection level and large for the second.
We find that implementing transmissibility reductions of lead to marginally improved results while reductions of and led to a slight reduction of prevented COVID-19 cases and deaths (see Fig. 8). For the in-label protocol, values of would lead to an % increase of prevented deaths and an 11% increase in prevented COVID-19 cases in the “high-risk” group (“improving” scenario), and to a 7% ( and 9% () increase for the “fast resurgence” scenario, respectively. For the extended off-label protocol these improvements range from 6% to 13% for both and for all pandemic scenarios. We further find that the negative consequences of a reduced adherence are not as pronounced in this configuration as they are for the baseline configuration.
Regarding transmission reductions of (first protection level) and (second protection level) we find a decrease of prevented “high-risk” group deaths and cases by 7% for all scenarios as compared to results using the baseline configuration (extended in-label protocol), see Fig 8. For the extended off-label protocol, the reduction in and ranges from 13% to 25% (max. 30% for a concurrent 10% reduction in adherence). Note that a situation where and represents an extreme and hence very unlikely scenario. Nevertheless, the number of saved lives and prevented cases in the “high-risk” group remains positive and in the four- to low five-digit range even in this extreme situation.
With decreased vaccine adherence in the high-risk population, the benefits of the extended off-label protocol are expected to vanish. For the baseline configuration, beginning at a 30% relative adherence reduction, switching to the extended off-label protocol causes negative net effects, i.e. negative numbers in the prevented deaths and cases (see Fig. 9). This corresponds to a willingness to get vaccinated of 55% in the high-risk group (from 78.4% pre-switch, i.e. a 23.4% reduction in the total willingness).
Appendix F Simulation code
The model has been implemented based on the “epipack” modeling package maier_epipack_2021 . Implementation and analysis code is available online maier_devacc_2021 .
Appendix G Dose distribution scenarios
We auto-generate distribution scenarios according to the following rules. We define the total number of high-risk individuals that will be vaccinated according to a chosen base adherence. We also define the number of high-priority low-risk individuals to be 7 million. Available doses are split between risk groups proportionally to the number of high-priority individuals in each group. Once all high-priority individuals have received two doses, all remaining doses are distributed to the low-risk group.
We further define one month to be 28 days long, in order to simplify distribution definitions in line with vaccine licensures. This implies that we integrate the model for 168 days, which according to our definitions amounts to 6 months.
Note that we round times to the nearest quarter of a day and in the tables, doses are rounded to the nearest integer.
All distribution scenarios that were generated according to these rules are displayed in Tabs. 3-10.
| [d] | [d] | prot. lev. 2nd dose | ||||||
|---|---|---|---|---|---|---|---|---|
| 0 | 84 | 8842105 | 0 | 0 | 5157894 | 0 | 0 | 2 |
| 84 | 168 | 8842105 | 0 | 0 | 5157894 | 0 | 0 | 2 |
| [d] | [d] | prot. lev. 2nd dose | ||||||
|---|---|---|---|---|---|---|---|---|
| 0 | 42 | 0 | 4421052 | 0 | 0 | 2578947 | 0 | 2 |
| 42 | 84 | 0 | 0 | 4421052 | 0 | 0 | 2578947 | 2 |
| 84 | 126 | 0 | 4421052 | 0 | 0 | 2578947 | 0 | 2 |
| 126 | 168 | 0 | 0 | 4421052 | 0 | 0 | 2578947 | 2 |
| [d] | [d] | prot. lev. 2nd dose | ||||||
|---|---|---|---|---|---|---|---|---|
| 0 | 84 | 0 | 8842105 | 0 | 0 | 5157894 | 0 | 1 |
| 84 | 168 | 0 | 0 | 8842105 | 0 | 0 | 5157894 | 1 |
| [d] | [d] | prot. lev. 2nd dose | ||||||
|---|---|---|---|---|---|---|---|---|
| 0 | 84 | 8842105 | 0 | 0 | 5157894 | 0 | 0 | 2 |
| 84 | 127.75 | 15131578 | 0 | 0 | 8826754 | 0 | 0 | 2 |
| 127.75 | 168 | 26315 | 0 | 0 | 22015350 | 0 | 0 | 2 |
| [d] | [d] | prot. lev. 2nd dose | ||||||
|---|---|---|---|---|---|---|---|---|
| 0 | 42 | 0 | 4421052 | 0 | 0 | 2578947 | 0 | 2 |
| 42 | 84 | 0 | 0 | 4421052 | 0 | 0 | 2578947 | 2 |
| 84 | 105.75 | 0 | 7522556 | 0 | 0 | 4388157 | 0 | 2 |
| 105.75 | 127.5 | 0 | 0 | 7522556 | 0 | 0 | 4388157 | 2 |
| 127.5 | 147.75 | 0 | 28195 | 0 | 0 | 11061090 | 0 | 2 |
| 147.75 | 168 | 0 | 0 | 28195 | 0 | 0 | 11061090 | 2 |
| [d] | [d] | prot. lev. 2nd dose | ||||||
|---|---|---|---|---|---|---|---|---|
| 0 | 84 | 0 | 8842105 | 0 | 0 | 5157894 | 0 | 1 |
| 84 | 97 | 0 | 3127819 | 1368421 | 0 | 1824561 | 798245 | 1 |
| 97 | 127.5 | 0 | 0 | 10548872 | 0 | 0 | 6153508 | 1 |
| 127.5 | 147.75 | 0 | 30075 | 0 | 0 | 11059210 | 0 | 2 |
| 147.75 | 168 | 0 | 0 | 30075 | 0 | 0 | 11059210 | 2 |
| [d] | [d] | prot. lev. 2nd dose | ||||||
|---|---|---|---|---|---|---|---|---|
| 0 | 84 | 0 | 8673913 | 0 | 0 | 5326086 | 0 | 1 |
| 84 | 95.5 | 0 | 2714285 | 1187500 | 0 | 1666666 | 729166 | 1 |
| 95.5 | 125.5 | 0 | 0 | 10178571 | 0 | 0 | 6250000 | 1 |
| 125.5 | 146.75 | 0 | 11801 | 0 | 0 | 11625103 | 0 | 2 |
| 146.75 | 168 | 0 | 0 | 11801 | 0 | 0 | 11625103 | 2 |
| [d] | [d] | prot. lev. 2nd dose | ||||||
|---|---|---|---|---|---|---|---|---|
| 0 | 84 | 0 | 8494382 | 0 | 0 | 5505617 | 0 | 1 |
| 84 | 93.5 | 0 | 2195826 | 960674 | 0 | 1423220 | 622659 | 1 |
| 93.5 | 122.5 | 0 | 0 | 9635634 | 0 | 0 | 6245318 | 1 |
| 122.5 | 145.25 | 0 | 109791 | 0 | 0 | 12348542 | 0 | 2 |
| 145.25 | 168 | 0 | 0 | 109791 | 0 | 0 | 12348542 | 2 |
Appendix H Full set of model equations
In the following, we show all model equations for a single phase in which the second, delayed dose only upholds the vaccine protection of the first dose, rather than increasing it.
| (6) | ||||
| (7) | ||||
| (8) | ||||
| (9) |
| (10) | ||||
| (11) | ||||
| (12) | ||||
| (13) |
| (14) | ||||
| (15) | ||||
| (16) | ||||
| (17) |
| (18) | ||||
| (19) | ||||
| (20) | ||||
| (21) |
| (22) | ||||
| (23) | ||||
| (24) | ||||
| (25) |
| (26) | ||||
| (27) | ||||
| (28) | ||||
| (29) |
| (30) | ||||
| (31) | ||||
| (32) | ||||
| (33) |
| (34) | ||||
| (35) | ||||
| (36) | ||||
| (37) |
| (38) | ||||
| (39) | ||||
| (40) | ||||
| (41) |
| (42) | ||||
| (43) | ||||
| (44) | ||||
| (45) |
| (46) | ||||
| (47) | ||||
| (48) | ||||
| (49) |
| (50) | ||||
| (51) | ||||
| (52) | ||||
| (53) |
| (54) | ||||
| (55) | ||||
| (56) | ||||
| (57) |
| (58) | ||||
| (59) | ||||
| (60) | ||||
| (61) |
| (62) | ||||
| (63) | ||||
| (64) | ||||
| (65) |
| (66) | ||||
| (67) | ||||
| (68) | ||||
| (69) |
| (70) | ||||
| (71) | ||||
| (72) | ||||
| (73) |
| (74) | ||||
| (75) | ||||
| (76) | ||||
| (77) |
| (78) | ||||
| (79) | ||||
| (80) | ||||
| (81) |
| (82) | ||||
| (83) | ||||
| (84) | ||||
| (85) |
| (86) | ||||
| (87) | ||||
| (88) | ||||
| (89) |
| (90) | ||||
| (91) | ||||
| (92) | ||||
| (93) |