Exploration of the Hg-based cuprate superconductors by Raman spectroscopy under hydrostatic pressure
Abstract
The superconducting phase of the (Hg-1201) and (Hg-1223) cuprates has been investigated by Raman spectroscopy under hydrostatic pressure. Our analysis reveals that the increase of with pressure is slower in Hg-1223 cuprate compared to the Hg-1201 due to a charge carrier concentration imbalance (accentuated by pressure) between the layers of Hg-1223. We find that the energy variation under pressure of the apical oxygen mode from which the charge carriers are transferred to the layers, is the same for both the Hg-1223 and Hg-1223 cuprates and it is controlled by the inter-layer compressibility. At last, we show that the binding energy of the Cooper pairs related to the maximum amplitude of the wave superconducting gap at the anti-nodes, does not follow with pressure. It decreases while increases. In the particular case of Hg-1201, the binding energy collapses from 10 to 2 as the pressure increases up to 10 GPa. These direct spectroscopic observations joined to the fact that the binding energy of the Cooper pairs at the anti-nodes does not follow either with doping, raises the question of its link with the pseudogap energy scale which follows the same trend with doping.
I I. Introduction
High-cuprate superconductors are one of the iconic quantum materials Norman (2011); Keimer et al. (2015). Although discovered more than 35 years ago, the complexity of their physics remains misunderstood. It calls for new concepts where the orders of matter are no longer independent of each other as in traditional materials but they are intertwined Fradkin et al. (2015). In order to understand their physics, many studies have already been carried out as a function of temperature and carriers concentration via the hole doping, , leading to their () phase diagram Lee et al. (2006); Keimer et al. (2015). It presents an insulating anti-ferromagnetic phase at low doping. As the doping increases, an intermediate phase between the insulator and the metal called the pseudogap phase emerges below which harbors many orders of matter that appear to be interconnected. Some of them break translational invariance (charge density wave order), others time reversal invariance (current loops order) or rotational invariance (nematic order)Hanaguri et al. (2004); Wu et al. (2011); Fujita et al. (2014); Comin and Damascelli (2016); Arpaia et al. (2019); Fauqué et al. (2006); Daou et al. (2010); Proust and Taillefer (2019); Sato et al. (2017); Auvray et al. (2019). At lower temperature below a critical temperature , the superconducting phase arises. exhibits a dome like shape. The top of the dome called the optimal doping, separates the under-doped from the over-doped regime. The physics behind this phase diagram remains widely debated and calls for the development of new experiments and theoretical investigations Lee et al. (2006); Scalapino (2012); Sachdev and La Placa (2013); Fradkin et al. (2015); Wang et al. (2015); Caprara et al. (2017); Wu et al. (2018); Chakraborty et al. (2019); Choubey et al. (2020).
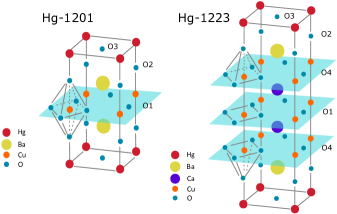
In order to get a better understanding of the cuprates physics and in particular their superconducting phase, we carried out Raman scattering measurements under hydrostatic pressure at low temperature on the Hg-based cuprates which have the most spectacular variation of with pressure. They exhibit an increase in of more than K for a pressure of , i.e. on average, an increase of K per GPa Chu et al. (1993); Nuñez-Regueiro et al. (1993); Gao et al. (1994); Antipov et al. (2002). We will focus on the (Hg-1201) and (Hg-1223) compounds which have respectively a maximum 95 K and 135 K at ambient pressure ( GPa) Putilin et al. (1993); Schilling et al. (1993). The structural unit cells are respectively made of one single and three contiguous planes, surrounded by blocks made up of and layers (cf. Fig. 1). These blocks are called charge reservoirs because the introduction of oxygen atoms within the plane generates a charge transfer via the plane towards the . This oxygen doping introduces hole charge carriers in the plane Antipov et al. (2002); Fukuoka et al. (1997); Kotegawa et al. (2002); Mukuda et al. (2012).
In the cuprates Raman scattering has been used extensively to track the energy scales of the phonons, the magnetic excitations, the superconducting gap, the pseudogap Devereaux and Hackl (2007); Blumberg et al. (1997); Opel et al. (2000); Le Tacon et al. (2006); Blanc et al. (2010); Li et al. (2012); Benhabib et al. (2015); Loret et al. (2017a, 2018) or more recently the charge density wave gap Loret et al. (2019); Li and Comin (2019); Loret et al. (2020); Wang et al. (2020). Since Raman is a two photon scattering process, by controlling the incoming and outgoing photon polarizations, one can selectively probe both the lattice and the electronic excitations in different symmetries. In the superconducting phase, we will be focusing on the relationships that can be unveiled with pressure between lattice dynamics and and also between the binding energy of the Cooper pairs associated with the -wave superconducting (SC) gap and . We will show that the increase of with pressure is reduced in Hg-1223 below 10 GPa in comparison to the Hg-1201 compound due to an increase of the charge carriers concentration imbalance between the inner and outer planes of Hg-1223 with pressure. We find that the evolution under pressure of frequency of the the apical oxygen, by which the charge transfer takes place, is mainly controlled by the inter-layer contraction. At last, we show that the binding energy of the Cooper pairs related to the maximum amplitude of the wave SC gap along the principal axis of the Brillouin zone (BZ) called the anti-nodal region, does not follow with pressure. It decrease while increases with pressure. Our findings, together with previous investigations that showed the binding energy of the Cooper pairs at the anti-nodes decreases as increases with doping and follows the same trend as the pseudogap energy scale Tallon and Loram (2001); Le Tacon et al. (2006); Kanigel et al. (2006); Fischer et al. (2007); Bernhard et al. (2008); Munnikes et al. (2011); Loret et al. (2020), raise the question of its link to the pseudogap energy scale.
II II. Experimental Methods
II.1 A. Crystal growth and characterization
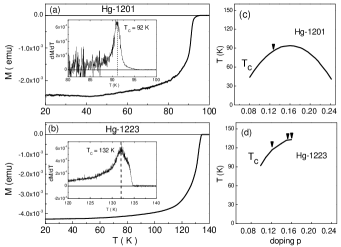
The crystals used for Raman measurements under hydrostatic pressure were prepared close to the optimal doping where the SC transition temperature is maximum. The Hg-1201 and Hg-1223 single crystals were synthesized and annealed following the method described in Legros et al. (2019) and Loret et al. (2017b) respectively. We sieved the batch immediately after annealing, in order to select crystals between and in size. Samples with a naturally clean surface were directly selected. Their critical temperature have been determined from DC magnetization susceptibility measurements under classical zero field cooling (ZFC) on a set of crystals of the same batch. A PPMS magnetometer (Quantum Design) was used and a magnetic field of Gauss was applied. The DC magnetization curves of the Hg-1201 and Hg-1223 single crystals at ambient pressure are displayed in Fig. 2 (a) and (b). The transition temperature and its width, , were estimated by taking the maximum and the full width at half maximum of the peak of the first derivative of each DC magnetization curves, giving and for Hg-1201 and Hg-1223 respectively. The two sets of samples are slightly under-doped and we name the ones selected for the Raman measurements under pressure (UD92K) for Hg-1201 and (UD132K) for Hg-1223 respectively. The values of the mercurate single crystals studied are reported in Fig. 2 (c) and (d).
II.2 B. Polarized Raman experiments under hydrostatic pressure at low temperature
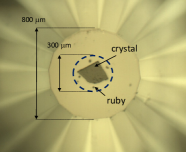
We have performed two different runs of Raman measurements under pressure for studying the Hg-1201 and Hg-1223 compounds. Crystals were loaded inside a diamond anvil cell with diamonds of diameter designed to withstand up to . The chamber between the diamonds is a cylindrical hole, cut by laser through a stainless steel gasket. Rubies were added in the cell to act as in-situ manometers through their fluorescence. Using several rubies allowed us to control the uniformity of the hydrostatic pressure in the chamber. After loading the chamber with ultra-pure helium and sealing it, the chamber size is approximately of diameter by of height (cf. Fig. 3).
The diamond anvil cell was then installed in a cryostat including a helium inlet allowing us to tune in-situ the pressure applied on the lower diamond, which indirectly changes the pressure in the chamber. Raman measurements were performed through the Boehler-designed upper diamond of the anvil, with a laser wavelength and of power (measured before going through the cryostat windows and the diamond). The spot size is around 40 microns in diameter with a slightly elliptical shape. According to our estimates, we can expect an upper limit for the laser heating to be around 1K/mW. Experiments were carried out using a JY-T64000 spectrometer in triple grating (1800 grooves/mm) configuration. The spectrometer is equipped with a nitrogen CCD detector. All the Raman spectra have been corrected for the Bose factor and the instrumental spectral response. They are thus proportional to the imaginary part of the Raman response function . The Raman responses in the different symmetries are obtained from incoming and outgoing light polarizations. The B1g and B2g symmetries were obtained respectively from crossed polarizations of the incoming and outgoing light at 45 degrees and along the Cu-O bond direction of the plane (cf. Fig. 4). The (A1g + B1g) geometry was got from parallel polarizations of the incoming and outgoing lights along the Cu-O bond direction. Raman scattering measurements at ambient pressure ( GPa) were additionally performed with crystals of the same batches, outside of the diamond anvil cell, with the same experimental setup.
III III. Overview of the superconducting and normal Raman responses of Hg-1201 and Hg-1223 crystals at ambient pressure
Our first objective is to disentangle the electronic excitations from the Raman-active optical phonons in order to study the electronic signatures of the superconducting phase of the Hg-1201 and Hg-1223 under hydrostatic pressure. The superconducting Raman responses at ambient pressure of a slightly under-doped (UD92K) Hg-1201 and an optimally doped (OP133K) Hg-1223 single crystals in three distinct geometries are reported in Fig. 5. They are made up of a broad electronic background superimposed by narrow peaks due to optical phonons. We focus first on the electronic background.
III.1 A. Electronic part of the Raman response
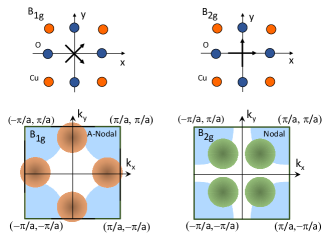
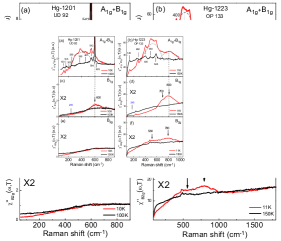
Electronic Raman scattering is a particularly useful probe for studying the cuprates because we can select distinct parts of the BZ, the anti-nodal and nodal regions well known to have quite different electronic properties Norman and Pépin (2003). In the geometry the Raman form factor is and it predominantly probes the anti-nodal region where the superconducting gap and the pseudogap are maximal. Here is the wave vector of the excited electron. Likewise, in the geometry the Raman form factor is and it probes mostly the nodal region where the superconducting gap and the pseudogap are minimal. In the A1g geometry, the Raman form factor is more isotropic, with no symmetry-imposed nodes. Experimentally, we cannot access the pure component using linear polarizations, as it is always associated with either a B1g or B2g component. The (A1g + B1g) SC Raman spectra of (UD92K) Hg-1201 and (OP133K) Hg-1223 single crystals (red curve at 10 K in Fig. 5 (a) and (b)) show an extended hump in energy made up of two broad peaks, the A1g and peaks. The A1g and peaks are respectively located around 400 and 600 in the Hg-1201 spectrum and centered around 500 and 800 in the Hg-1223 spectrum. These features are indicated by gray dashed lines in the spectra and extensively studied in previous works Gallais et al. (2004); Guyard et al. (2008); Le Tacon et al. (2006); Benhabib et al. (2015). The SC peak alone are displayed in Fig. 5 (c) and (d). It corresponds to the pairs breaking peak related to the maximum amplitude of the wave SC gap opening. No clear SC peak is detected in the Raman spectra of Hg-1201 and a relatively weak peak (close to 780 ) compared to the peak is detected in the Raman spectra of Hg-1223 (cf. Fig. 5 (e) and (f)). This is expected since the SC gap vanishes out in the nodal regions probed predominantly by the geometry. In particular, the remarkably flat SC Raman response of the (UD92K) Hg-1201 will be exploited later for the electronic Raman measurements under pressure. Notice that spectra of Hg-1223 contains an extra electronic contribution (around 580 ) stemming from the charge density wave order as already discussed in our previous investigations Loret et al. (2019, 2020).
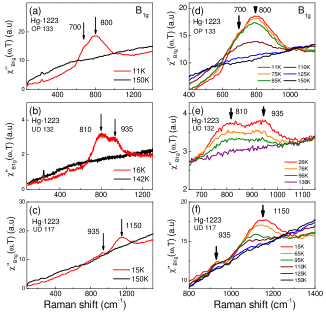
A more detailed analysis reveals that the superconducting peak in the Raman spectrum of the three-layer Hg-1223 cuprate presents a shoulder (around 700 ) on its left side that we do not observe in the Raman spectrum of the one-layer Hg-1201 cuprate (see panels (c) and (d) Fig. 5). To have a better understanding of its origin, we followed the evolution of this shoulder as a function of doping. The shoulder that we observe close to the optimal doping turns into a double peak with under-doping. This is displayed in Fig. 6 (a)-(c). The frequency difference between the two peaks increases with under-doping. These two peaks could be related to two superconducting gaps induced either by an inter, or by an intra-unit cell doping inhomogeneity of Hg-1223. Our experimental findings tend towards an intra-unit cell doping inhomogeneity due to a charge carrier concentration imbalance between the inner and the outer planes of one single unit cell. Indeed, the Raman spectra measured on the Hg-1223 crystal for a given doping level, are the same whatever the location of the laser spot on the crystal surface. This means there is no trace, at least at the scale of few ten microns, of inter cell inhomogeneity of the oxygen doping. Secondly, we always detect only two distinct superconducting peaks (cf. Fig. 6 (a)-(c)) and not more, which seems inconsistent with a distribution of spatial oxygen content over the area illuminated by the laser spot. The observation of only two peaks which deviate from each other in energy as the doping decreases is rather in favor of the existence of two SC gaps linked to the inner and outer planes which would have different carriers concentrations. This is in agreement with previous works on Bi-2223 three layers cuprate Ideta et al. (2010); Vincini et al. (2018). Thirdly, the two SC peaks detected in the Raman spectra seem to disappear simultaneously (within our temperature accuracy) as the temperature is raised (cf. Fig. 6(d)-(f)). This suggests that the two gaps are interconnected as it should be the case if they are originate from the inner and outer plane of the same unit cell and obviously not if the two gaps come from distinct regions of the crystal with different oxygen contents. The inner plane being more distant from the reservoir blocks by which the charge transfer takes place, earlier studies have concluded that the charge carriers concentration of the outer plane is higher than the one of the inner plane in the under-doped Hg-1223 Kotegawa et al. (2002); Julien et al. (1996); Mukuda et al. (2012, 2016); Mito et al. (2017); Iwai et al. (2014). The superconducting gap energy is known to be larger upon reduced doping in Hg-1223 Loret et al. (2019, 2020). We can thus assign the high energy peak to the SC gap related to the inner plane and the lower one to the SC gap of the outer plane.
III.2 B. Phononic part of the Raman response
In Fig. 5 (a) and (b)) few narrow peaks (marked by straight lines) are superimposed to the (A1g + B1g) electronic background. They correspond to Raman active phonons associated with the Hg-1201 and Hg-1223 structures as well as parasitic phases. Overall, we detect three types of phonons. The first type is associated with the vibrational modes of the ideal stoichiometric Hg-1201 and Hg-1223 structure that belong to the space group. We then expect and pristine Raman active even (gerade) modes for the Hg-1201 and Hg-1223 structure respectively. The second kind of vibrational modes is associated with defect stemming from symmetry breaking induced by insertion of oxygen atoms in the layers which makes Raman active some odd (ungerade) modes. At last, the third kind of vibrational modes come from parasitic phases which are deposited on the crystal’s surface. They stem from residual oxides of synthesis precursor phases that subsists even in the cleanest crystal surfaces we could select. A summary of these three kinds of phonons observed in Hg-1201 and Hg-1223 structures is reported in Table 1.
| Hg-1201 | ||||||
| Pristine mode | 165
(Ba) |
594 (O2) | ||||
| Defect mode | 130 (Cu-Ba-Hg’) | 260 (O1’) | 461 (O1) | 542 (O3) | ||
| Hg-1223 | ||||||
| Pristine mode | 120 (Ba) | 260 (O4’) | 483 (O4) | 585 (O2) | ||
| Defect mode | 130 (Cu-Ba-Hg’) | 400 (O1) | ||||
| Parasitic mode | 205 | 310 | 380 | 570 | 625 | |
| (Hg-Ba-O) | (Ca-Cu-O) | (Hg-O) | (Ba-Cu-O) | (Ba-Cu-O) |
IV IV. Overview of the superconducting and normal Raman responses of Hg-1201 and Hg-1223 crystals under hydrostatic pressure
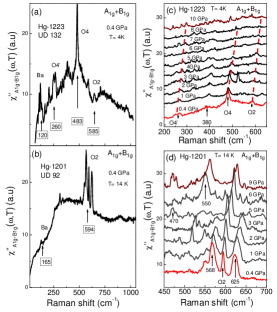
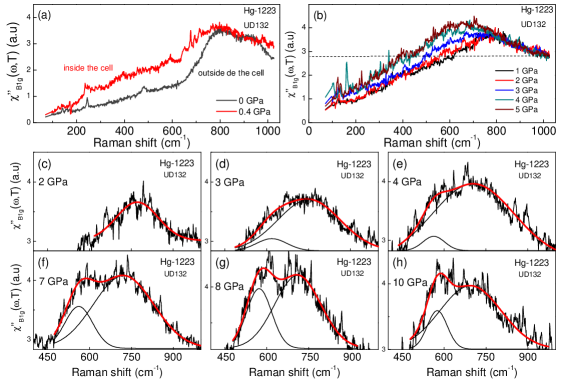
The Raman superconducting responses of (UD92K) Hg-1201 and (UD132K) Hg-1223 single crystals measured inside the anvil cell at 0.4 GPa are reported in Fig. 7. We have nearly the same spectra as those of Fig. 5 but with a poorer signal-to-noise ratio and few additionnal parasitic phonons (at 570 and 620 ). We see an asymmetric hump with a maximum around 400 in the Hg-1201 which is made of two components (cf. Fig. 5). The Hg-1223 spectrum exhibits two broad peaks, one centered around 480 and the second one around 760 which are assigned the and components of the spectrum (cf. Fig. 5). On the top of these broad electronic peaks few narrow peaks associated with vibrational modes are detected. The pristine phonons related to the oxygen motions of the Hg-1223 and Hg-1201 structures are indicated by black black arrows in panel (a) and (b) of Fig. 7.
IV.1 A. Study on the oxygen pristine modes of Hg-1223 and Hg-1201 with pressure.
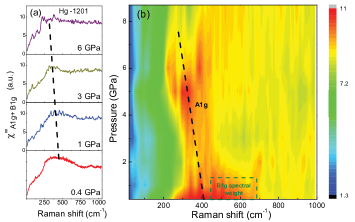
We displayed in Fig. 7 (c) and (d) a spectral range zoom of the Raman spectra of panels (a) and (b). The frequencies of the oxygen pristine modes of the Hg-1223 at 260, 483 and 585 (see Table 1) increase with pressure (see red dotted lines in panel (c)). The feature centered around 380 is probably a parasitic mode (see Table 1). In the Hg-1201 spectra (panel (d)), the apical oxygen mode at 594 (framed) increases with pressure. It is located in between two parasitic modes at 570 and 625 (see Table 1) whose the full width at half maximum is three time larger. These two peaks disappear at high pressure presumably because the structure of the parasitic phases evolves under pressure. We can also notice that two peaks at 470 and 550 appear with pressure (see arrows). They are likely defect modes that come out due to mechanical stress which induce a redistribution of mobile oxygen in the layer Lorenz and Chu (2005). They correspond to the defect modes located at 461 and 542 cm-1 (reported in Table 1) and whose frequencies increase with pressure. The normalized frequencies of the oxygen pristine modes of the Hg-1223 and Hg-1201 structure as a function of pressure, , are displayed in Fig. 8
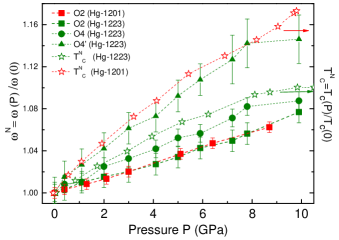
A clear trend emerges: the normalized frequencies of the oxygen vibrational modes of the Hg-1223 and Hg-1201 compounds increase almost linearly with pressure up to . This behavior is usually expected with pressure Goncharov et al. (1992); Goncharov and Struzhkin (2003); Cuk et al. (2008); Aupiais et al. (2018). The layer of Hg-1201 being a symmetry plane (cf. Fig. 1), the vibrational modes related to the (O4) and (O4’) oxygen motion in the are non Raman active in this structure. Therefore, we will focus on the (O2) vibrational mode which is present both in the Hg-1201 and Hg-1223 structure. Remarkably, the slopes () of the apical oxygen (O2) phonon over the entire pressure range are nearly the same in the Hg-1201 and Hg-1223 structures (see red and green full squares). On the contrary, the slopes of the normalized , associated with the Hg-1201 and Hg-1223 compounds are different (see red and green open stars). This means that the pressure evolution of in these structures cannot be attributed to the apical oxygen mode dynamics alone. The number of planes and their respective charge carrier concentration must also be taken into account. In particular, previous investigations Trokiner et al. (1991); Julien et al. (1996); Kotegawa et al. (2002); Mukuda et al. (2012); Iwai et al. (2014); Mito et al. (2017) revealed that the carriers concentration imbalance between the of multilayer superconductors such as Hg-1223 was limiting the increase of . This can be visualized in Fig. 8. The slope of Hg-1201 is much higher than the Hg-1223 likely due to the difficulty to perform an efficient charge transfer by pressure to the inner plane of Hg-1223 as it will be shown in the next section.
At this stage, it is interesting to make a comparison between the effects of pressure (P) and doping (p) on the dynamic of the apical oxygen mode in the Hg-1201 and Hg-1223 structure. The apical oxygen atom (O2) is the bridge between the and the planes (see Fig. 1) and its motion is along the axis. The apical oxygen mode hardens with pressure (cf. Fig. 8) while it softens with doping Sacuto et al. (1996); Zhou et al. (1996); Legros et al. (2019); Loret et al. (2017b). Its softening is due to its coupling with charge carriers which increases with doping Balkanski et al. (1975); Slakey et al. (1989); Friedl et al. (1990) and is a common feature of many cuprates such as Hg-1201, Y-123 and Hg-1223 Legros et al. (2019); Thomsen et al. (1988); Sacuto et al. (1993); Bakr et al. (2013); Sacuto et al. (1996); Loret et al. (2017b). On the other hand, its hardening with pressure is likely due to the inter-plane contraction along the axis Eggert et al. (1994); Mito et al. (2017) which is much stronger with pressure than with doping. A way to compare the axis contraction under pressure and doping is to evaluate it as a function of the change. According to the refs.Fukuoka et al. (1997); Antipov et al. (2002); Eggert et al. (1994); Mito et al. (2017); Loret et al. (2017b); Legros et al. (2019), the ratio is approximately one order of magnitude larger than the . Our estimate is ÅK-1 and ÅK-1. This justifies why the apical oxygen mode hardens under pressure even if applying pressure favor the charge transfer and an increase of the charge carriers which softens the apical oxygen mode in the case of chemical doping Ohta et al. (1991); Yamamoto et al. (2015); Mito et al. (2017). Despite these contrasting trends in the dynamics of the apical mode with pressure and doping, understanding the roles that pressure and doping play on remains a major issue. We can cite two emblematic experimental facts that show their effects are different on . First, applying a pressure on an under-doped Hg-1212 or Hg-1223 compound allows us to reach a much higher than that which can be obtained by doping Yamamoto et al. (2015). Secondly, starting from optimally doped Hg-1201 and Hg-1223, decreases with doping (over-doped regime) while it increases with pressure Antipov et al. (2002); Chu et al. (1993). Consequently, the effects of pressure and doping on are complex and additional parameters to the dynamics of the apical mode have to be considered such as the shortening of the oxygen bond lengths in the plane according to ref. Pavarini et al. (2001).
IV.2 B. Study on the bare electronic superconducting Raman response of Hg-1223 and Hg-1201 with pressure.
We focus now on the superconducting electronic Raman response under pressure. This is achieved by subtracting the most intense phonons after fitting them by lorentzian profiles Le Tacon et al. (2007). The bare electronic Raman responses in and geometries of Hg-1223 and Hg-1201 free of phonons are reported in Fig. 9. In Appendix A are shown the raw data with phonons.
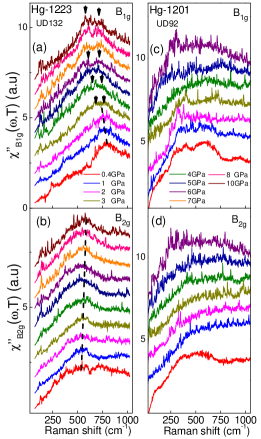
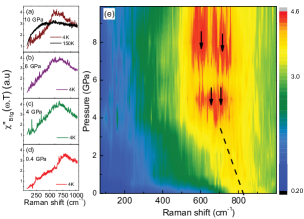
The B1g electronic response of the UD132 Hg-1223 compound (cf.Fig. 9 (a)) exhibits a hump which decreases in energy with pressure. This hump is the SC pair breaking peak and only appears below as shown in the Raman spectra at low and high pressure in Fig. 6 (b) and Fig. 10 (a) respectively. The pair breaking peak centered around 800 at has probably a double component like in Fig. 6 (b), but the lower signal-to-noise ratio and an additional background to the spectra measured inside the cell likely prevents us from detecting the weaker high energy shoulder (see Appendix B). However, as the pressure increases, the width of the pair breaking peak increases and the splitting appears (see black arrows in Fig. 9 (a)). This double component has already been identified (in section III) as the two gaps associated with the inner and outer CuO2 planes of the Hg-1223 structure when these two planes do not have the same charge carrier concentration. As the pressure increases up, the charge carrier concentration imbalance is accentuated between the inner and outer planes. This makes it possible to detect again (but this time inside the cell) the splitting of the hump related to two superconducting gaps. This can be seen by the two red trails in the color map which correspond to the two SC peaks, see Fig. 10 (e).
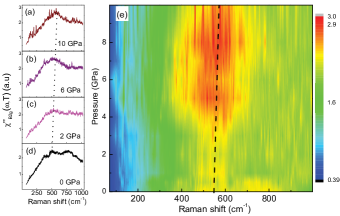
The Raman spectra of Hg-1223 under pressure and low temperature presents also a hump associated with a SC peak (see Fig. 9 (b)). It corresponds to the weaker SC gap feature associated with the nodal region (see section III). This hump is more and more visible as pressure increases and its frequency slightly increases as the pressure increases. This is highlighted in the colour map of Fig. 11 (e).
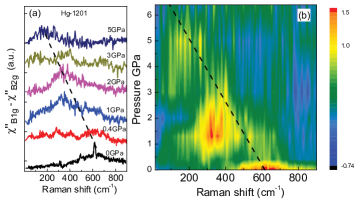
We focus now on the SC Raman response function of the Hg-1201 compound in Fig. 9 (c). The Raman response at 0.4 GPa (red curve) exhibits an unexpected broad peak centered around 380 in addition to the expected pair breaking peak at 600 (cf.Fig. 5 (c)). This extra peak is due to a leakage of an contribution to the Raman response. It likely comes from an increase in the birefringence of the pressurized diamonds. The and Raman spectra having been measured one after the other for each pressure value, this leakage also exists in the Raman spectra. The Raman response of Hg-1201 (cf. Fig. 5 (e)), being almost flat, here, it is mostly dominated by the leakage of the contribution and of an extrinsic background common to the and geometry. Using the Raman response as a reference spectrum, we can subtract these contributions from the one for each pressure (for more details, see Appendix C). The pressure evolution of the electronic Raman response free of leakage is displayed in Fig. 12. It is clear that the superconducting peak energy decreases by a factor of 3 with pressure from 600 to 200 (cf. Fig. 12 (a)and (b)). We can notice that the evolution of the SC peak does not seem to be continuous with pressure and it could be a pressure-plateau in between 1 and 2 GPa.
The evolution with pressure of the characteristic SC peaks of the UD132 Hg-1223 and UD92 Hg-1201 are summarized in Fig. 13. In panel (a), the SC peak associated with the Hg-1223 structure has two components detected by Raman measurements at 0 GPa (outside cell). The two components of the SC peak (inside the cell) appear above . Above this pressure, the inner plane component frequency decreases more slowly than the outer plane component. The frequency of the inner plane component does not decrease below while the one of the outer plane component continues to decrease down to at . We interpret these two distinct evolutions as a different efficiency of the charge transfer with pressure between the inner and the outer planes of Hg-1223. This energy decrease is much weaker than the one of the peak in the Hg-1201 structure (cf. panel (b)). It is likely due to a larger inertia of the charge transfer induced by pressure in the triple layers than in the single one. Still, as the pressure increases, increases for both the Hg-1201 and Hg-1223 structures. The increasing of with pressure is confirmed by Raman measurements at high pressure (cf. Appendix D) that show the SC peak is still resolved well above the value measured at ambient pressure. Consequently, it is clear that the SC peaks of Hg-1223 and Hg-1201 do not follow with pressure. The SC peak frequency detected on the Hg-1223 spectra slightly increases with pressure following (cf. panel (a) of Fig. 13) but the SC peak observed on the Hg-1201 spectra decreases with pressure (cf. panel (b) of Fig. 13). The Raman data are displayed in Appendix E.
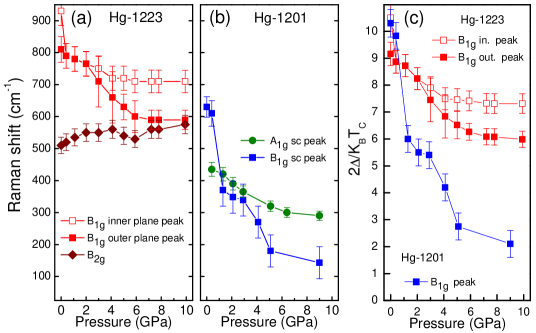
To summarize this part, the most important results are that (i) the SC peak for both Hg-1201 and Hg-1223 decreases drastically in frequency while increases with pressure, (ii) In the case of Hg-1201 single layer (whose charge transfer is not altered by multi-layers), the SC peak energy collapses from 10 to 2 (cf. panel (c) of Fig. 13). The two components of the SC peak of Hg-1223 also decreases in frequency but more slowly from 10 and 6 . These frequency changes are significantly larger than those obtained over the same pressure range for the SC peak of YBa2Cu3O7-δ (Y-123) Goncharov and Struzhkin (2003). This is due to the fact that mercury-based compounds are highly compressible along the -axis compared to the other cupratesEggert et al. (1994). It is therefore apparent that the binding energy of the Cooper pairs at its maximum value, corresponding to the pair breaking peak, does not scale with under pressure. It has already been shown than the peak energy scale detected in the Raman spectra decreases with doping like the pseudogap energy scale in several cuprate families Opel et al. (2000); Tallon and Loram (2001); Bernhard et al. (2008); Munnikes et al. (2011); Loret et al. (2020), suggesting that the peak energy scale and the pseudo-gap energy scale could be linked at least as a function of doping. Can such a link be made as a function of pressure ? The hypothesis was already considered in an earlier Raman study under pressure on Y-123 Goncharov and Struzhkin (2003) although at the time it had not been established that the SC peak did not follow with pressure as we report here. The authors had based themselves on the assumption that the pseudo-gap would be related to magnetic correlations Scalapino (2012, 1995); Lee et al. (2006); Anderson (2007); Chubukov and Norman (2008); Norman (2011); Keimer et al. (2015) which are weakened as the hole concentration increase with pressure and thus, the pseudogap energy scale should decrease. Based on this hypothesis, the peak softening with pressure was interpreted as a sign of its connection to the pseudogap. This scenario deserves to be explored. Unfortunately, there are very few pressure dependent studies of the pseudogap in the literature and the results are contradicting. Some data advocate in favor of as independent of pressure Doiron-Leyraud et al. (2017); Cyr-Choinière et al. (2018), while others that increases de Mello et al. (2002); Vovk and Solovjov (2018), or decreases with pressure Häfliger et al. (2006). Additionally, to our knowledge, no direct measurement of the pseudogap energy scale with pressure has been yet carried out so far. So, it appears that no definite link between SC gap at the anti-nodes and the pseudogap energy scale can yet be made as a function of pressure. Therefore, it would be interesting to investigate the pseudogap energy scale with pressure in order to clarify its relationship with the binding energy of the SC gap at the anti-nodes.
V V. Conclusion
In summary, we have performed Raman measurements under hydrostatic pressure on the Hg-1223 and Hg-1201 cuprate superconductors. Our analysis reveals that the increase with pressure is slowed down in the Hg-1223 multi-layers compared to the Hg-1201 single layer due to the inhomogeneous increase of the carrier concentration inside the three layers of the Hg-1223. We find that the frequency dependence under pressure of the apical mode from which the charge transfer operates, is the same for both the Hg-1223 and Hg-1201 cuprates and controlled by the inter-plane compressibility. Last but not least, we show that the binding energy of the Cooper pairs related to the maximum amplitude of the wave SC gap at the anti-nodes (the SC peak) decreases drastically while increases with pressure. In particular for Hg-1201, its energy collapses from 10 to 2 , intriguingly reaching values below the weak-coupling BCS limitBardeen et al. (1957). These new experimental facts added to the former one that the binding energy of the Cooper pairs at the anti-nodes also decreases as increases with doping, demonstrates that the binding energy of the Cooper pairs at the anti-nodes does not follow both with doping and pressure. It could be linked to the pseudogap energy scale which follows the same trend with doping Bernhard et al. (2008); Loret et al. (2020). However, a formal proof of this conjecture requires a measurement of the pseudogap energy scale as a function of pressure.
VI Acknowledgments
We are grateful to V. Brouet, I. Paul, M. Civelli, A. Georges, G. Ghiringhelli, M. Greven, M. Grilli, A. Chubukov, Marc-Henri Julien, C. Pépin, C. Proust, Y. Sidis, L. Taillefer and A.M. Tremblay for useful discussions. We thank the University of Paris, the Collège de France and the Canadian Institute for Advanced Research (CIFAR) for their support. We acknowledge support from the french national agency of research, grant NEPTUN ANR-19-CE30-0019-01. Correspondence and request for materials should be addressed to A.S. (alain.sacuto@univ-paris-diderot.fr).
Appendix A Raw Raman data of Hg-1223 and Hg-1201 under pressure
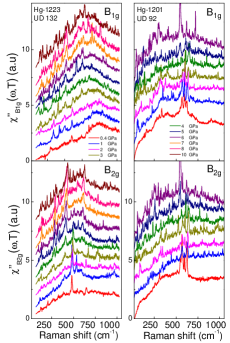
The Raman superconducting response of the slightly under-doped (UD92K) Hg-1201 and (UD132K) Hg-1223 single crystals under hydrostatic pressure in and geometries are reported in Fig. 14. Similarly to Fig. 5 we observe a broad electronic background superimposed by few weak narrow phonon peaks stemming from pristine, parasitic and defect modes.
Appendix B splitting under pressure in Hg-1223
We have superimposed in Fig. 15, the Raman spectrum measured outside the cell at 0 GPa and the one measured inside the cell at 0.4 GPa. See panel (a). We clearly see a lower signal to noise ratio and an additional background to the Raman spectrum inside the cell. These two effects hide the weaker high energy shoulder detected on the Raman spectrum measured outside the cell and prevent us to detect the splitting at low pressure up to 2 GPa. However, as the pressure increases from 1 to 5 GPa, the linewidth of the SC peak (defined by the intersections of the left and right sides of the SC peak with the base dotted line drawn in panel (b)) increases by a factor 1.5 with pressure (cf. panel(b)). This peak broadening is likely a precursor of the observation of the splitting detected by the eyes from 6 GPa. The splitting can be revealed by a deconvolution of the SC peak by two Gaussian peaks. Below 2 GPa included, the splitting is not detected inside the cell as mentioned above. On the other hand, above 2 GPa, the fitting of the SC peak shape can only be achieved by considering two Gaussian peaks as it is shown in panels (c) to (h) where the top of the peak (above the based dotted line) for several pressures is reported. This allows us to confirm that the splitting is detectable from 3 GPa in our spectra.
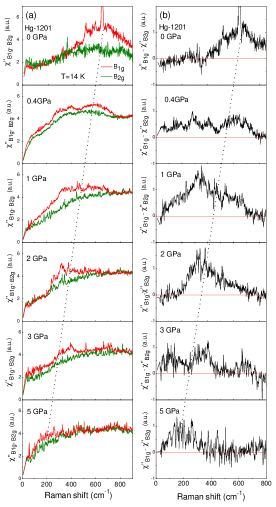
Appendix C Raman signal under pressure in Hg-1201
We display in Fig. 16, panel (a), both the and spectra of the (UD92K) Hg-1201 as a function of pressure measured in the superconducting state at 14 K. The subtraction of the spectra from the one (cf. panel (b)), allows us to eliminate the contribution associated with the polarization leakage induced by pressure. We see that the SC peak decreases rapidly with pressure. The 0 GPa spectra has been obtained outside the anvil cell and do not present any polarization leakage. Note that the spectrum at 0 GPa does not exhibit any feature is almost flat as expected for a slightly under-doped Hg-1201 compound close to the optimal doping level as mentioned previously.
Appendix D Raman experimental evidence of increase with pressure in Hg-1201 and Hg-1223
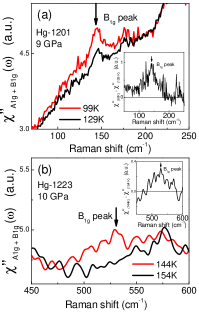
In Fig. 17 is reported the SC peak detected at 9 GPa and 10 GPa in Hg-1201 and Hg-1223 respectively. It is still observed above measured at ambient pressure (0 GPa) i.e: 92 K for Hg-1201 and 132 K for Hg-1223. Indeed, it is detected at 99 K and 144 K for Hg-1201 and Hg-1223 respectively. This means that of Hg-1201 at 9 GPa is at least greater than 99 K and that of Hg-1223 is greater than 144 K. The change in as a function of pressure for theses two compounds is then close to that found by transport measurements: namely 1 K/GPa Chu et al. (1993); Nuñez-Regueiro et al. (1993); Gao et al. (1994); Antipov et al. (2002).
Appendix E Evolution of the SC peak with pressure in Hg-1201
We display in Fig. 18, the Raman response of the (UD92K) Hg-1201 as a function of pressure. In this geometry, the SC peak is weak in intensity, this allows us to follow the SC peak which decreases in energy with pressure.
References
- Norman (2011) M. R. Norman, Science 332, 196 (2011), https://science.sciencemag.org/content/332/6026/196.full.pdf .
- Keimer et al. (2015) B. Keimer, S. A. Kivelson, M. R. Norman, S. Uchida, and J. Zaanen, Nature 518, 179 (2015).
- Fradkin et al. (2015) E. Fradkin, S. A. Kivelson, and J. M. Tranquada, Rev. Mod. Phys. 87, 457 (2015).
- Lee et al. (2006) P. A. Lee, N. Nagaosa, and X.-G. Wen, Rev. Mod. Phys. 78, 17 (2006).
- Hanaguri et al. (2004) T. Hanaguri, C. Lupien, Y. Kohsaka, D. H. Lee, M. Azuma, M. Takano, H. Takagi, and J. C. Davis, Nature 430, 1001 (2004).
- Wu et al. (2011) T. Wu, H. Mayaffre, S. Krämer, M. Horvatic, C. Berthier, W. N. Hardy, R. Liang, D. A. Bonn, and M.-H. Julien, Nature 477, 191 (2011).
- Fujita et al. (2014) K. Fujita, C. K. Kim, I. Lee, J. Lee, M. Hamidian, I. A. Firmo, S. Mukhopadhyay, H. Eisaki, S. Uchida, M. J. Lawler, E. A. Kim, and J. C. Davis, Science 344, 612 (2014).
- Comin and Damascelli (2016) R. Comin and A. Damascelli, Annual Review of Condensed Matter Physics 7, 369 (2016), https://doi.org/10.1146/annurev-conmatphys-031115-011401 .
- Arpaia et al. (2019) R. Arpaia, S. Caprara, R. Fumagalli, G. De Vecchi, Y. Y. Peng, E. Andersson, D. Betto, G. M. De Luca, N. B. Brookes, F. Lombardi, M. Salluzzo, L. Braicovich, C. Di Castro, M. Grilli, and G. Ghiringhelli, Science 365, 906 (2019), https://science.sciencemag.org/content/365/6456/906.full.pdf .
- Fauqué et al. (2006) B. Fauqué, Y. Sidis, V. Hinkov, S. Pailhès, C. T. Lin, X. Chaud, and P. Bourges, Phys. Rev. Lett. 96, 197001 (2006).
- Daou et al. (2010) R. Daou, J. Chang, D. LeBoeuf, O. Cyr-Choinière, F. Laliberté, N. Doiron-Leyraud, B. J. Ramshaw, R. Liang, D. A. Bonn, W. N. Hardy, and L. Taillefer, Nature 463, 519 (2010).
- Proust and Taillefer (2019) C. Proust and L. Taillefer, Annual Review of Condensed Matter Physics 10, 409 (2019), https://doi.org/10.1146/annurev-conmatphys-031218-013210 .
- Sato et al. (2017) Y. Sato, S. Kasahara, H. Murayama, Y. Kasahara, E.-G. Moon, T. Nishizaki, T. Loew, J. Porras, B. Keimer, T. Shibauchi, and Y. Matsuda, Nature Physics 13, 1074 (2017).
- Auvray et al. (2019) N. Auvray, B. Loret, S. Benhabib, M. Cazayous, R. D. Zhong, J. Schneeloch, G. D. Gu, A. Forget, D. Colson, I. Paul, A. Sacuto, and Y. Gallais, Nature Communications 10, 5209 (2019).
- Scalapino (2012) D. J. Scalapino, Rev. Mod. Phys. 84, 1383 (2012).
- Sachdev and La Placa (2013) S. Sachdev and R. La Placa, Phys. Rev. Lett. 111, 027202 (2013).
- Wang et al. (2015) Y. Wang, D. F. Agterberg, and A. Chubukov, Phys. Rev. Lett. 114, 197001 (2015).
- Caprara et al. (2017) S. Caprara, C. Di Castro, G. Seibold, and M. Grilli, Phys. Rev. B 95, 224511 (2017).
- Wu et al. (2018) W. Wu, M. S. Scheurer, S. Chatterjee, S. Sachdev, A. Georges, and M. Ferrero, Phys. Rev. X 8, 021048 (2018).
- Chakraborty et al. (2019) D. Chakraborty, M. Grandadam, M. H. Hamidian, J. C. S. Davis, Y. Sidis, and C. Pépin, Phys. Rev. B 100, 224511 (2019).
- Choubey et al. (2020) P. Choubey, S. H. Joo, K. Fujita, Z. Du, S. D. Edkins, M. H. Hamidian, H. Eisaki, S. Uchida, A. P. Mackenzie, J. Lee, J. C. S. Davis, and P. J. Hirschfeld, Proceedings of the National Academy of Sciences 117, 14805 (2020), https://www.pnas.org/content/117/26/14805.full.pdf .
- Chu et al. (1993) C. W. Chu, L. Gao, F. Chen, Z. J. Huang, R. L. Meng, and Y. Y. Xue, Nature 365, 323 (1993).
- Nuñez-Regueiro et al. (1993) M. Nuñez-Regueiro, J. L. Tholence, E. V. Antipov, J. J. Capponi, and M. Marezio, Science 262, 97 (1993).
- Gao et al. (1994) L. Gao, Y. Y. Xue, F. Chen, Q. Xiong, R. L. Meng, D. Ramirez, C. W. Chu, J. H. Eggert, and H. K. Mao, Physical Review B 50, 4260 (1994).
- Antipov et al. (2002) E. V. Antipov, A. M. Abakumov, and S. N. Putilin, Superconductor Science and Technology 15, R31 (2002).
- Putilin et al. (1993) S. N. Putilin, E. V. Antipov, O. Chmaissem, and M. Marezio, Nature 362, 226 (1993).
- Schilling et al. (1993) A. Schilling, M. Cantoni, J. D. Guo, and H. R. Ott, Nature 363, 56 (1993).
- Fukuoka et al. (1997) A. Fukuoka, A. Tokiwa-Yamamoto, M. Itoh, R. Usami, S. Adachi, and K. Tanabe, Phys. Rev. B 55, 6612 (1997).
- Kotegawa et al. (2002) H. Kotegawa, Y. Tokunaga, K. Ishida, G.-q. Zheng, Y. Kitaoka, A. Iyo, Y. Tanaka, and H. Ihara, Phys. Rev. B 65, 184504 (2002).
- Mukuda et al. (2012) H. Mukuda, S. Shimizu, A. Iyo, and Y. Kitaoka, Journal of the Physical Society of Japan 81, 011008 (2012), https://doi.org/10.1143/JPSJ.81.011008 .
- Devereaux and Hackl (2007) T. P. Devereaux and R. Hackl, Rev. Mod. Phys. 79, 175 (2007).
- Blumberg et al. (1997) G. Blumberg, M. Kang, M. V. Klein, K. Kadowaki, and C. Kendziora, Science 278, 1427 (1997).
- Opel et al. (2000) M. Opel, R. Nemetschek, C. Hoffmann, R. Philipp, P. F. Muller, R. Hackl, I. Tutto, A. Erb, B. Revaz, E. Walker, H. Berger, and L. Forro, Phys. Rev. B 61, 9752 (2000).
- Le Tacon et al. (2006) M. Le Tacon, A. Sacuto, A. Georges, G. Kotliar, Y. Gallais, D. Colson, and A. Forget, Nat Phys 2, 537 (2006).
- Blanc et al. (2010) S. Blanc, Y. Gallais, M. Cazayous, M. A. Méasson, A. Sacuto, A. Georges, J. S. Wen, Z. J. Xu, G. D. Gu, and D. Colson, Phys. Rev. B 82, 144516 (2010).
- Li et al. (2012) Y. Li, M. Le Tacon, M. Bakr, D. Terrade, D. Manske, R. Hackl, L. Ji, M. K. Chan, N. Barišić, X. Zhao, M. Greven, and B. Keimer, Phys. Rev. Lett. 108, 227003 (2012).
- Benhabib et al. (2015) S. Benhabib, A. Sacuto, M. Civelli, I. Paul, M. Cazayous, Y. Gallais, M. A. Méasson, R. D. Zhong, J. Schneeloch, G. D. Gu, D. Colson, and A. Forget, Phys. Rev. Lett. 114, 147001 (2015).
- Loret et al. (2017a) B. Loret, S. Sakai, S. Benhabib, Y. Gallais, M. Cazayous, M. A. Méasson, R. D. Zhong, J. Schneeloch, G. D. Gu, A. Forget, D. Colson, I. Paul, M. Civelli, and A. Sacuto, Phys. Rev. B 96, 094525 (2017a).
- Loret et al. (2018) B. Loret, Y. Gallais, M. Cazayous, R. D. Zhong, J. Schneeloch, G. D. Gu, A. Fedorov, T. K. Kim, S. V. Borisenko, and A. Sacuto, Phys. Rev. B 97, 174521 (2018).
- Loret et al. (2019) B. Loret, N. Auvray, Y. Gallais, M. Cazayous, A. Forget, D. Colson, M.-H. Julien, I. Paul, M. Civelli, and A. Sacuto, Nature Physics 15, 771 (2019).
- Li and Comin (2019) J. Li and R. Comin, Nature Physics 15, 736 (2019).
- Loret et al. (2020) B. Loret, N. Auvray, G. D. Gu, A. Forget, D. Colson, M. Cazayous, Y. Gallais, I. Paul, M. Civelli, and A. Sacuto, Phys. Rev. B 101, 214520 (2020).
- Wang et al. (2020) L. Wang, B. Yu, R. Jing, X. Luo, J. Zeng, J. Li, I. Bialo, M. Bluschke, Y. Tang, J. Freyermuth, G. Yu, R. Sutarto, F. He, E. Weschke, W. Tabis, M. Greven, and Y. Li, Phys. Rev. B 101, 220509 (2020).
- Tallon and Loram (2001) J. Tallon and J. Loram, Physica C 349, 53 (2001).
- Kanigel et al. (2006) A. Kanigel, M. R. Norman, M. Randeria, U. Chatterjee, S. Souma, A. Kaminski, H. M. Fretwell, S. Rosenkranz, M. Shi, T. Sato, T. Takahashi, Z. Z. Li, H. Raffy, K. Kadowaki, D. Hinks, L. Ozyuzer, and J. C. Campuzano, Nature Physics 2, 447 (2006).
- Fischer et al. (2007) O. Fischer, M. Kugler, I. Maggio-Aprile, C. Berthod, and C. Renner, Rev. Mod. Phys. 79, 353 (2007).
- Bernhard et al. (2008) C. Bernhard, L. Yu, A. Dubroka, K. Kim, M. Rössle, D. Munzar, J. Chaloupka, C. Lin, and T. Wolf, Journal of Physics and Chemistry of Solids 69, 3064 (2008), sNS2007.
- Munnikes et al. (2011) N. Munnikes, B. Muschler, F. Venturini, L. Tassini, W. Prestel, S. Ono, Y. Ando, D. C. Peets, W. N. Hardy, R. Liang, D. A. Bonn, A. Damascelli, H. Eisaki, M. Greven, A. Erb, and R. Hackl, Phys. Rev. B 84, 144523 (2011).
- Legros et al. (2019) A. Legros, B. Loret, A. Forget, P. Bonnaillie, G. Collin, P. Thuéry, A. Sacuto, and D. Colson, Materials Research Bulletin 118 (2019), 10.1016/j.materresbull.2019.05.004.
- Loret et al. (2017b) B. Loret, A. Forget, J.-B. Moussy, S. Poissonnet, P. Bonnaillie, G. Collin, P. Thuéry, A. Sacuto, and D. Colson, Inorganic Chemistry, Inorg. Chem. 56, 9396 (2017b).
- Norman and Pépin (2003) M. R. Norman and C. Pépin, Rep. Prog. Phys. 66, 1547 (2003).
- Gallais et al. (2004) Y. Gallais, A. Sacuto, and D. Colson, Physica C 408 - 410, 785 (2004).
- Guyard et al. (2008) W. Guyard, A. Sacuto, M. Cazayous, Y. Gallais, M. Le Tacon, D. Colson, and A. Forget, Phys. Rev. Lett. 101, 097003 (2008).
- Benhabib et al. (2015) S. Benhabib, Y. Gallais, M. Cazayous, M.-A. Méasson, R. D. Zhong, J. Schneeloch, A. Forget, G. D. Gu, D. Colson, and A. Sacuto, Phys. Rev. B 92, 134502 (2015).
- Ideta et al. (2010) S. Ideta, K. Takashima, M. Hashimoto, T. Yoshida, A. Fujimori, H. Anzai, T. Fujita, Y. Nakashima, A. Ino, M. Arita, H. Namatame, M. Taniguchi, K. Ono, M. Kubota, D. H. Lu, Z.-X. Shen, K. M. Kojima, and S. Uchida, Phys. Rev. Lett. 104, 227001 (2010).
- Vincini et al. (2018) G. Vincini, K. Tanaka, T. Adachi, L. Sobirey, S. Miyasaka, S. Tajima, S. Adachi, N. Sasaki, and T. Watanabe, Physical Review B 98, 144503 (2018).
- Julien et al. (1996) M.-H. Julien, P. Carretta, M. Horvatić, C. Berthier, Y. Berthier, P. Ségransan, A. Carrington, and D. Colson, Phys. Rev. Lett. 76, 4238 (1996).
- Mukuda et al. (2016) H. Mukuda, N. Shiki, N. Kimoto, M. Yashima, Y. Kitaoka, K. Tokiwa, and A. Iyo, Journal of the Physical Society of Japan, J. Phys. Soc. Jpn. 85, 083701 (2016).
- Mito et al. (2017) M. Mito, K. Ogata, H. Goto, K. Tsuruta, K. Nakamura, H. Deguchi, T. Horide, K. Matsumoto, T. Tajiri, H. Hara, T. Ozaki, H. Takeya, and Y. Takano, Phys. Rev. B 95, 064503 (2017).
- Iwai et al. (2014) S. Iwai, H. Mukuda, S. Shimizu, Y. Kitaoka, S. Ishida, A. Iyo, H. Eisaki, and S.-i. Uchida, in JPS Conference Proceedings, Vol. 1 (Journal of the Physical Society of Japan, 2014) pp. –.
- Popov and Hadjiev (1995) V. Popov and V. Hadjiev, in Lattice Dynamics of HgBa2CuO4+d, Fabrication, Properties and Applications of Low-Dimensional Semiconductors, NATO ASI Series, edited by M. Balkanski and I. Yanchev (Springer Netherlands, Dordrecht, 1995) p. 239.
- Krantz et al. (1994) M. C. Krantz, C. Thomsen, H. Mattausch, and M. Cardona, Phys. Rev. B 50, 1165 (1994).
- Sacuto et al. (1996) A. Sacuto, A. Lebon, D. Colson, A. Bertinotti, J.-F. Marucco, and V. Viallet, Physica C: Superconductivity 259, 209 (1996).
- Zhou et al. (1996) X. Zhou, M. Cardona, C. W. Chu, Q. M. Lin, S. M. Loureiro, and M. Marezio, Physical Review B 54, 6137 (1996).
- Wang et al. (2018) L. Wang, X. Luo, J. Li, J. Zeng, M. Cheng, J. Freyermuth, Y. Tang, B. Yu, G. Yu, M. Greven, and Y. Li, Physical Review Materials 2, 123401 (2018).
- Ren et al. (1993) Y. T. Ren, H. Chang, Q. Xiong, Y. Q. Wang, Y. Y. Sun, R. L. Meng, Y. Y. Xue, and C. W. Chu, Physica C: Superconductivity 217, 273 (1993).
- Hur et al. (1993) N. H. Hur, H.-G. Lee, J.-H. Park, H.-S. Shin, and I.-S. Yang, Physica C: Superconductivity 218, 365 (1993).
- Sacuto et al. (2000) A. Sacuto, D. Colson, A. Forget, and J. Cayssol, Proceedings of the International Conference on Materials and Mechanisms of Superconductivity High Temperature Superconductors VI, Physica C: Superconductivity 341-348, 2253 (2000).
- Lorenz and Chu (2005) B. Lorenz and C. Chu, in Frontiers in Superconducting Materials (Springer Berlin Heidelberg, Berlin, Heidelberg, 2005) pp. 459–497.
- Yamamoto et al. (2015) A. Yamamoto, N. Takeshita, C. Terakura, and Y. Tokura, Nature Communications 6, 8990 (2015).
- Goncharov et al. (1992) A. Goncharov, M. Muinov, T. Uvarova, and S. Stishov, High Pressure Research - HIGH PRESSURE RES 10, 500 (1992).
- Goncharov and Struzhkin (2003) A. F. Goncharov and V. V. Struzhkin, Journal of Raman Spectroscopy, J. Raman Spectrosc. 34, 532 (2003).
- Cuk et al. (2008) T. Cuk, V. V. Struzhkin, T. P. Devereaux, A. F. Goncharov, C. A. Kendziora, H. Eisaki, H.-K. Mao, and Z.-X. Shen, Phys. Rev. Lett. 100, 217003 (2008).
- Aupiais et al. (2018) I. Aupiais, M. Mochizuki, H. Sakata, R. Grasset, Y. Gallais, A. Sacuto, and M. Cazayous, npj Quantum Materials 3, 60 (2018).
- Trokiner et al. (1991) A. Trokiner, L. Le Noc, J. Schneck, A. M. Pougnet, R. Mellet, J. Primot, H. Savary, Y. M. Gao, and S. Aubry, Phys. Rev. B 44, 2426 (1991).
- Balkanski et al. (1975) M. Balkanski, K. P. Jain, R. Beserman, and M. Jouanne, Phys. Rev. B 12, 4328 (1975).
- Slakey et al. (1989) F. Slakey, S. L. Cooper, M. V. Klein, J. P. Rice, and D. M. Ginsberg, Phys. Rev. B 39, 2781 (1989).
- Friedl et al. (1990) B. Friedl, C. Thomsen, and M. Cardona, Phys. Rev. Lett. 65, 915 (1990).
- Thomsen et al. (1988) C. Thomsen, R. Liu, M. Bauer, A. Wittlin, L. Genzel, M. Cardona, E. Schönherr, W. Bauhofer, and W. König, Solid State Communications 65, 55 (1988).
- Sacuto et al. (1993) A. Sacuto, M. Balkanski, O. Gorochov, and R. Suryanarayanan, Journal of Alloys and Compounds 195, 359 (1993).
- Bakr et al. (2013) M. Bakr, S. M. Souliou, S. Blanco-Canosa, I. Zegkinoglou, H. Gretarsson, J. Strempfer, T. Loew, C. T. Lin, R. Liang, D. A. Bonn, W. N. Hardy, B. Keimer, and M. Le Tacon, Phys. Rev. B 88, 214517 (2013).
- Eggert et al. (1994) J. H. Eggert, J. Z. Hu, H. K. Mao, L. Beauvais, R. L. Meng, and C. W. Chu, Physical Review B 49, 15299 (1994).
- Ohta et al. (1991) Y. Ohta, T. Tohyama, and S. Maekawa, Phys. Rev. B 43, 2968 (1991).
- Pavarini et al. (2001) E. Pavarini, I. Dasgupta, T. Saha-Dasgupta, O. Jepsen, and O. K. Andersen, Phys. Rev. Lett. 87, 047003 (2001).
- Le Tacon et al. (2007) M. Le Tacon, A. Sacuto, Y. Gallais, D. Colson, and A. Forget, Phys. Rev. B 76, 144505 (2007).
- Scalapino (1995) D. Scalapino, Physics Reports 250, 329 (1995).
- Anderson (2007) P. W. Anderson, Science 316, 1705 (2007), https://science.sciencemag.org/content/316/5832/1705.full.pdf .
- Chubukov and Norman (2008) A. V. Chubukov and M. R. Norman, Phys. Rev. B 77, 214529 (2008).
- Doiron-Leyraud et al. (2017) N. Doiron-Leyraud, O. Cyr-Choinière, S. Badoux, A. Ataei, C. Collignon, A. Gourgout, S. Dufour-Beauséjour, F. F. Tafti, F. Laliberté, M.-E. Boulanger, M. Matusiak, D. Graf, M. Kim, J.-S. Zhou, N. Momono, T. Kurosawa, H. Takagi, and L. Taillefer, Nature Communications 8, 2044 (2017).
- Cyr-Choinière et al. (2018) O. Cyr-Choinière, D. LeBoeuf, S. Badoux, S. Dufour-Beauséjour, D. A. Bonn, W. N. Hardy, R. Liang, D. Graf, N. Doiron-Leyraud, and L. Taillefer, Phys. Rev. B 98, 064513 (2018).
- de Mello et al. (2002) E. V. L. de Mello, M. T. D. Orlando, J. L. González, E. S. Caixeiro, and E. Baggio-Saitovich, Phys. Rev. B 66, 092504 (2002).
- Vovk and Solovjov (2018) R. V. Vovk and A. L. Solovjov, Low Temperature Physics, Low Temperature Physics 44, 81 (2018).
- Häfliger et al. (2006) P. S. Häfliger, A. Podlesnyak, K. Conder, and A. Furrer, Europhysics Letters (EPL), Eur. Phys.Lett. 73, 260 (2006).
- Bardeen et al. (1957) J. Bardeen, L. N. Cooper, and J. R. Schrieffer, Phys. Rev. 108, 1175 (1957).