Breaking universality in random sequential adsorption on a square lattice with long-range correlated defects
Abstract
Jamming and percolation transitions in the standard random sequential adsorption of particles on regular lattices are characterized by a universal set of critical exponents. The universality class is preserved even in the presence of randomly distributed defective sites that are forbidden for particle deposition. However, using large-scale Monte Carlo simulations by depositing dimers on the square lattice and employing finite-size scaling, we provide evidence that the system does not exhibit such well-known universal features when the defects have spatial long-range (power-law) correlations. The critical exponents and associated with the jamming and percolation transitions, respectively, are found to be non-universal for strong spatial correlations and approach systematically their own universal values as the correlation strength is decreased. More crucially, we have found a difference in the values of the percolation correlation length exponent for a small but finite density of defects with strong spatial correlations. Furthermore, for a fixed defect density, it is found that the percolation threshold of the system, at which the largest cluster of absorbed dimers first establishes the global connectivity, gets reduced with increasing the strength of the spatial correlation.
I Introduction
The study of adsorption of particles onto solid surfaces is a subject of great interest in different disciplines of science and technology Evans (1993); Feder (1980); Torquato and Stillinger (2010); Kumacheva et al. (2002) due to its relevance in diverse applications, including protein adsorption Hlady and Buijs (1996), ion implantation in semiconductor Roman and Majlis (1983), and thin film deposition technologies for surface coatings and encapsulations Yu et al. (2016). In the simplest case of adsorption leading to monolayer formation, such as the binding of protein molecules on glass or metals Feder (1980), one considers that the process of adsorption takes place irreversibly and the particles have no mobility. Consequently, they remain at their position of adsorption forever. However, many complex dynamical phenomena, such as diffusion, desorption, and thermal expansion of particles are often found to be associated with the process of adsorption occurring in the real-world systems Privman (1994); Ramsden (1992); Joshi et al. (2016). It has been observed that such underlying mechanisms crucially affect the morphology of the growing monolayer formations. Apart from that, properties of the surface, for example, the surface roughness or the interfacial interaction play a significant role in the kinetics of adsorption Napolitano (2020). However, to our knowledge, the latter aspects have not been studied in great detail using theoretical models.
The theoretical study of monolayer formation in the limit of irreversible adsorption has been carried out quite intensively over the last several decades through the stochastic models of random sequential adsorption (RSA) Privman (2000); Cadilhe et al. (2007); Evans (1993). In the standard RSA, particles are absorbed sequentially and irreversibly at random positions onto an initially empty substrate, subject to a constraint that they only interact through excluded volume interaction. The kinetics of adsorption terminates when a jamming state is reached where no more vacant space is available to accommodate a single particle. The surface coverage , defined as the volume fraction of the surface occupied by the adsorbed particles, attains a non-trivial value at the jamming limit. The exact value of is known only for one-dimensional systems in both continuum and lattice spaces Flory (1939); Rényi (1958).
Another important aspect which has been studied using the RSA model is the phenomenon of percolation of polyatomic species Kondrat and Pȩkalski (2001); Cornette et al. (2003); Tarasevich et al. (2012); Gimenez and Ramirez-Pastor (2015). A group of adsorbed particles, occupying more than one lattice site, forms clusters through their neighboring connections. The percolation transition occurs when such a cluster connects two opposite boundaries of the system through a spanning path at a critical value of the surface coverage , known as the percolation threshold. Therefore the global connectivity exists in the system only in the percolating phase of . The system exhibits the generic scale-invariant features of a continuous phase transition right at Stauffer and Aharony (2018).
Furthermore, the role played by the shape and size of the depositing particles on the morphology of the growing structure has been studied Becklehimer and Pandey (1992); Kondrat and Pȩkalski (2001); Lebovka et al. (2011); Tarasevich et al. (2012); Cieśła et al. (2016). Different mechanisms of adsorption have also been introduced to explain various experimental observations comprehensively Guo et al. (1994); Joshi et al. (2016); Kundu et al. (2018); Furlan et al. (2020). It has been revealed that the jamming density and the percolation threshold depend non-trivially on all these factors. However, interestingly, the critical behavior of the system associated with the two transition points is found to be universal, meaning that it is characterized by a universal set of critical exponents that is independent of all these microscopic details. In all these cases, the percolation transition belongs to the ordinary percolation universality class Cornette et al. (2003); Tarasevich et al. (2012); Lebovka et al. (2011); Gimenez and Ramirez-Pastor (2015); Kundu et al. (2018); Furlan et al. (2020). Similarly, the jamming transition is characterized by the universal exponent relating to the size scaling of the width of the transition zone, which scales with linear size of the substrate in a spatial dimension as , with . The robustness of this universal scaling law has been examined on the Euclidean and fractal lattice geometries Pasinetti et al. (2019); Ramirez et al. (2019).
Although the effect of particle properties on the kinetics of adsorption have been extensively studied in the past, a theoretical investigation on the role of surface properties has remained almost unexplored. In this context, some previous studies have considered that the surface on which the adsorption is taking place is not ideal. It contains defects or impurities at random places Ramirez et al. (2019); Cornette et al. (2006); Kondrat (2006); Centres and Ramirez-Pastor (2015); Tarasevich et al. (2015); Palacios and Gomes (2020), indicating that the binding strength of particles at these locations is so negligible that they can not be attached there. Except for these places the adsorption is possible if the vacant space is large enough to accommodate a particle. Even in this case, the universal behavior of the RSA model is preserved. However, in many realistic situations, a surface shows spatially correlated properties Medina et al. (1989); Hewett and Behrens (1990); Lauritsen et al. (1993) and thus, the existence of spatial correlations among the defects is a more natural consideration than the randomly distributed defects. Surprisingly, this aspect has not been considered yet.
In this paper, we provide a detailed study on the jamming and percolation properties of the RSA model in the presence of spatially long-range (power-law) correlated defects. Our main interest is to see whether this spatial correlation affects the critical behavior of the transitions. We found that in the regime of non-vanishing spatial correlation among the defects, the model does not exhibit the well-known universal features of the RSA. The critical exponents associated with the jamming and percolation transitions are observed to vary systematically with the strength of the spatial correlation.
II Model
We consider the RSA model on a two dimensional square lattice of size with periodic boundary conditions along both directions. Particles in the form of -mers, occupying consecutive lattice sites along horizontal or vertical direction, are adsorbed one by one following the rules of the standard RSA onto the lattice consisting of defects which are spatially correlated. Specifically, the defective sites are located in such a manner that the correlation function between a pair of defected sites decays in the form of a power-law of the spacial distance between them. By imposing this prerequisite, sites of an empty lattice are occupied with probability and they are kept vacant with probability (the detailed method for generating such a correlated landscape is described later). The initial configuration of these sets of occupied sites act as defects and the adsorption of particles on these locations is completely forbidden. The remaining fraction of sites acts as the site for possible adsorption. By selecting an orientation, either horizontal or vertical with equal probability, one end of the particle is placed at a randomly selected position and absorbed irreversibly provided that there exists at least consecutive vacant sites along the chosen direction from the selected site. The surface coverage after adsorbing particles is thus given by . The adsorption process continues in this way until a jamming state is reached. The corresponding surface coverage is referred to as the jamming density.
During the process of adsorption, the depositing particles interact among the previously adsorbed particles as well as with the defects via excluded volume interaction. Consequently, they experience a “screening effect” and try to align parallel to each other and form domains whose typical sizes are of the order of the size of the particle. In addition, due to this interaction, a vacant region that is smaller than the size of the particle can not be occupied. As a result, the jamming density can not attain the close packing density, i.e., .
As an important step, besides the defect density parameter , the strength of the correlation among the defects is also a tunable parameter in our model and it is characterized by an exponent associated with the power-law decay of the correlation function (see Eq. (1)). For any arbitrary value of , the strength of the correlation decreases with increasing the value of and in the limit of the scenario of uncorrelated defects is obtained. Therefore, by varying the parameters and , the model is capable of capturing the behavior of a wide range of systems: from a system with correlated defects, uncorrelated defects to a pure (defect-free) system. In this paper, we report our simulation results for dimers .
Generating long-range correlated defects
To obtain a substrate that possesses defects with spatial long-range correlations, we utilize the idea of viewing the substrate as a landscape of random heights with desired height-height correlation Schrenk et al. (2013), where represents the height associated with the lattice site positioned at . Accordingly, we follow the scheme described in Ref. Makse et al. (1996), which is based on the Fourier filtering method Makse et al. (1996); Prakash et al. (1992); Zierenberg et al. (2017). The Wiener-Khintchine theorem is the basis of this method, which relates the autocorrelation function of a stationary time series to the Fourier transform of its power spectrum. The power spectral density in this case has a power-law form and it is calculated using the two-point correlation function imposing periodic boundary conditions in two dimensions. Therefore, decays at large distance as
| (1) |
where, denotes the strength of the correlation. The steps (i)–(iii) in Ref. Makse et al. (1996) are then executed to generate the correlated random numbers .
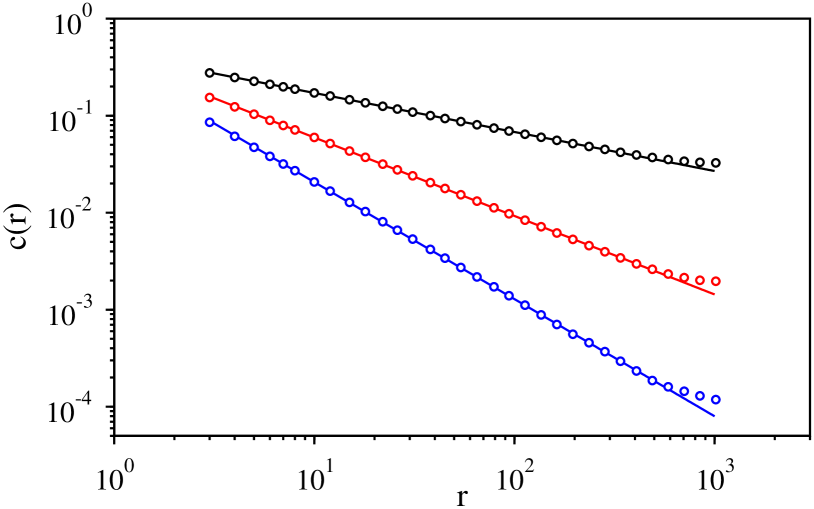
In our simulation we used Gaussian distributed uncorrelated random numbers with zero mean and unit variance to generate power-law correlated Gaussian distributed random numbers. To verify whether the obtained random numbers posses the desired correlations or not, the configuration averaged value of is plotted with on a double logarithmic scale in Fig. 1 for three different values of . Clearly, the measured slopes of the best fitted straight lines are consistent with the desired values of .
Finally, by following the idea of ranked surface Schrenk et al. (2012), the sites are occupied one by one according to the ascending order of their height values until the density of occupied sites representing the defects reaches a prefixed value .
 |
 |
| (a) | (b) |
III Results
III.1 Impact on the jamming coverage
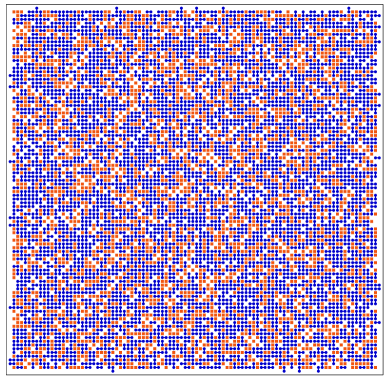
In Fig. 2, we have shown typical jamming configurations for a given defect density for both correlated and uncorrelated defects. We first observe that the defects form clusters via nearest neighbor connections, which become more and more compact for stronger correlations (small ). An idea of the compactness of the clusters may quantitatively be realized from the fact that in the subcritical regime of defect density, i.e., for , where the global connectivity through the clusters of defects is absent, the average size of the largest cluster of defects scales with as (not shown). It is found that the exponent for , which monotonically decreases with increasing the value of . This finally approaches , corresponding to the value for uncorrelated defects.
Naturally, the particles experience the strongest screening effect in the case of homogeneously distributed uncorrelated defects during the deposition, and it recedes as the strength of the correlation is increased. Thus, we expect to observe densely packed jamming states for stronger correlations. To demonstrate this, the filling fraction at the jamming state is plotted against in Fig. 3 for four different values of and for uncorrelated defects. Clearly, for any given value of , the filling fraction increases as the value of decreases.
III.2 Universality class of the jamming transition
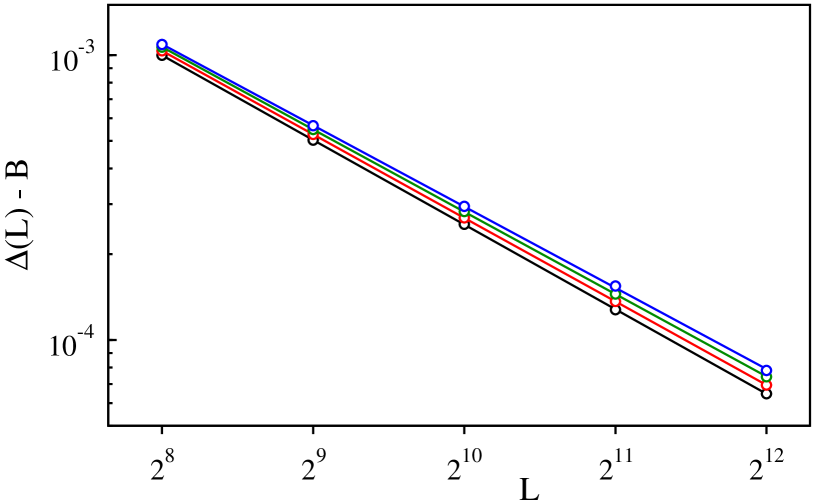
To investigate whether the universality class of the jamming transition is affected by the introduction of spatial correlations among the defects, we perform the scaling analysis of the width of the transition zone. Precisely, we calculate the standard deviation of the jamming densities for several values of , which generally scales as . Therefore, we plot versus on a log-log scale. We simulate up to and the averaging was done on (at least) , and independent configurations for = 256, 512, 1024, 2048, and 4096, respectively. It is observed that the curves for small have a certain amount of curvatures and they seem to approach a constant value in the limit . We thus consider a modified functional form
| (2) |
to fit our data. Indeed, a plot of against on a double logarithmic scale exhibits a straight line, as shown in Fig. 4. It is found that for , but its value increases monotonically as is decreased. To give an idea, the least-square fit of our data using Eq. (2) yields the values of , and for = 0.8, 0.6, and 0.4, respectively, using . As opposed to the case of uncorrelated defects, for which one obtains the universal value of in two dimensions at any arbitrary value of , it is evident from Fig. 4 that the exponent varies systematically with for a fixed .
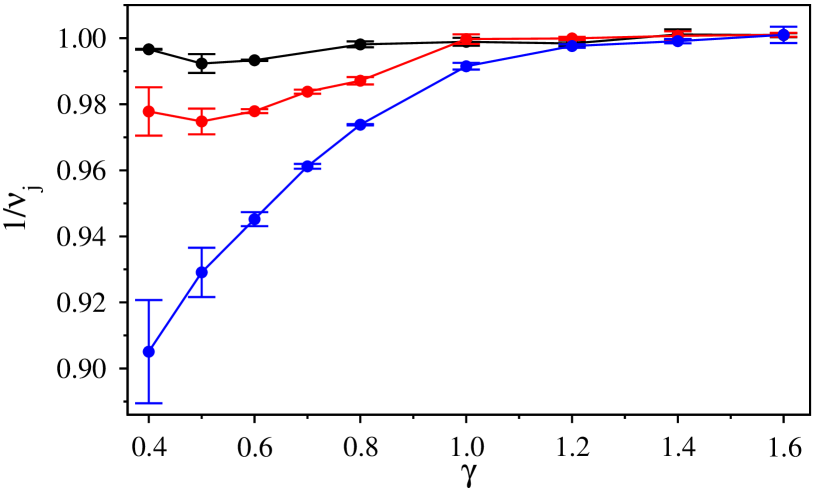
Similar plots are made, but now we keep fixed and vary . To show the effect of the spatial correlation more explicitly, we focus on the range of , where there exists no giant cluster of defects. It is found that the deviation of from its universal value becomes more and more prominent as (strong correlations). In Fig. 5, we have displayed such a plot for three different values of . Although, the non-universal behavior is not so obvious from this figure for as the exponent value is close to , the curves have apparent curvatures on the vs. plots for small . Precisely, the best fit using Eq. (2) yields a value of (e.g., for and ). This suggests that a small but finite amount of defects (i.e., ) is sufficient to change the universal behavior of the jamming transition if and only if the defects have strong spatial correlations.
What could be the reason behind the origin of this non-universal behavior? One may notice from Fig. 2 that for strong spatial correlations, the void space becomes fragmented into several isolated clusters and form islands surrounded by defects. This happens even for a small value of (e.g., ), while they are less likely to be formed in the case of uncorrelated defects at such small densities. The shapes and sizes of these islands vary for different configurations. The size distribution appears to be broad even for , and the tail of the distribution is observed to shift to the origin with increasing (weak correlations). Besides that, the total number of islands also varies for different configurations. Since the particle adsorption is occurring on these islands, one may think that the fluctuation of the jamming densities for a given system size is a collective contribution of the fluctuations arising from all those islands. Thus, the variability of the island sizes could be the source of breaking the universality class of the jamming transition.
Arguably, such a scenario also arises at the percolation point of void spaces in the presence of uncorrelated defects, where the size distribution of those islands follows a scale-free distribution. However, using extensive numerical simulations by setting = 0.592746050 (percolation threshold of the square lattice), we have obtained the universal value of (not shown). This suggests that the departure from the universal behavior for long-range spatially correlated defects is probably not due to the above mentioned fluctuations and could be related to some more complex details, such as spatial correlations between the sizes of the islands or the non-trivial interactions of particles in the close proximity to the complex inner and outer wall of the compact clusters of defects.
Furthermore, we have noticed that the distribution of deviates from a Gaussian distribution for strongly correlated defects for large system sizes.
III.3 Percolation transition of the jamming states
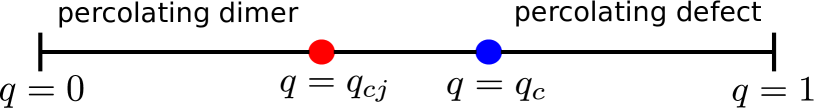
We now identify the clusters of absorbed dimers in the jamming state, where a cluster consists of a set of sites interconnected through their neighboring sites occupied by the dimers. For , the density of occupied sites is so high () that there always exists global connectivity through a cluster spanning the entire system. On the other hand, at , when a giant cluster of defects first appears in the system, the largest cluster of dimers becomes minuscule and it fails to establish such global connectivity. Consequently, in between and , one finds a threshold value of such that the system of dimers exhibits the global connectivity and thus remains in the percolating phase only when . In the range of , neither the largest cluster of dimers nor defects percolates. The schematic phase diagram in plane is shown in Fig. 6.
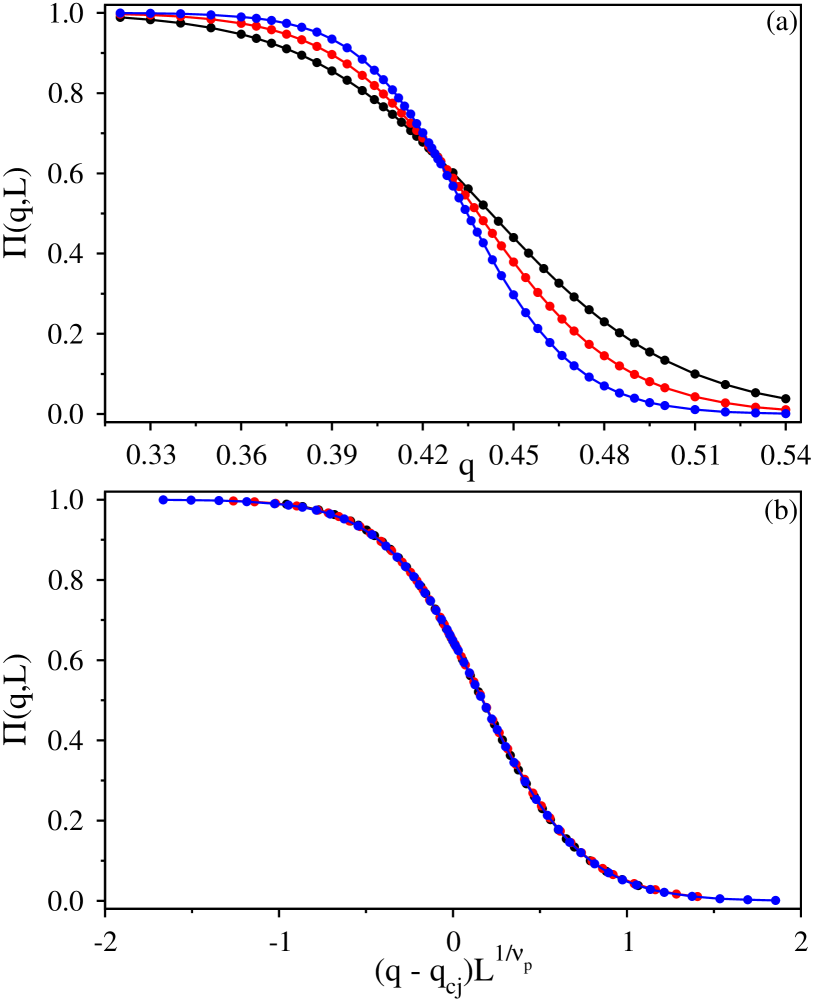
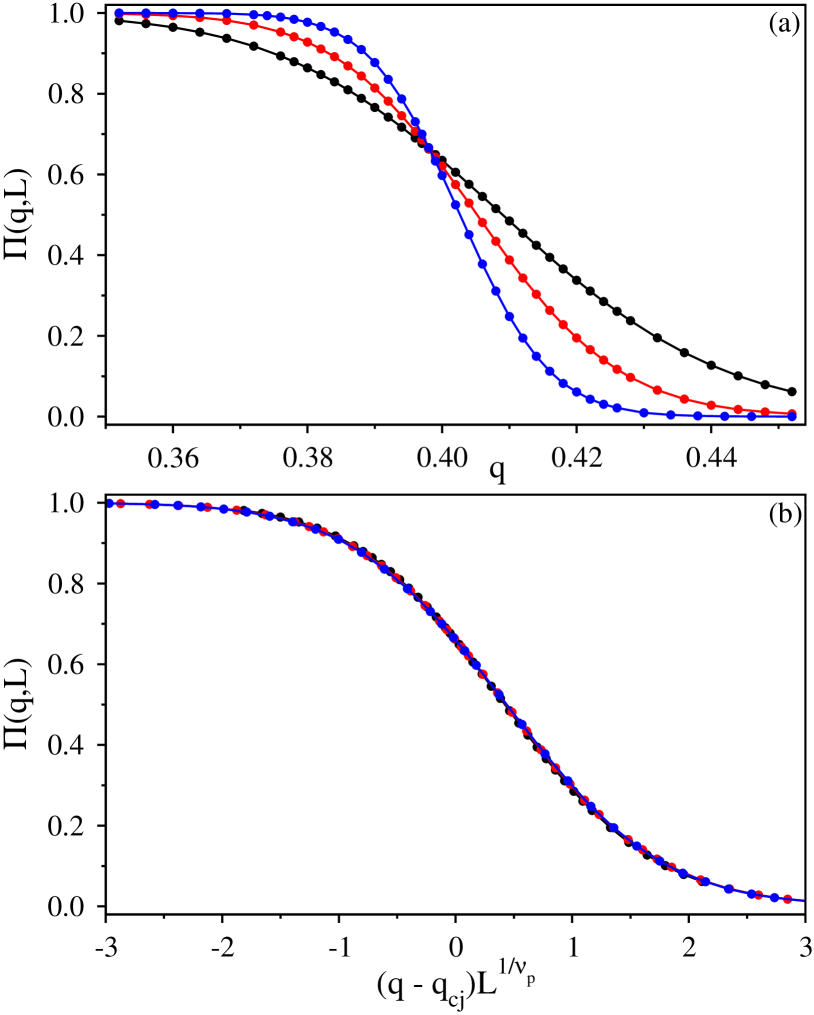
The most important question here is, whether the critical behavior of such a percolation transition occurring at belongs to the ordinary percolation universality class when the defects have spatial long-range correlations. To investigate this, we calculate the spanning probability that there exists a spanning cluster of adsorbed dimers in the system by varying the value of for three different system sizes . Then, by performing the finite-size scaling analysis of and estimating the scaling exponents we determine the universality class of the percolation transition. Once a jamming configuration is reached in our simulation, we check the top to bottom connectivity through the neighboring sites occupied by the dimers using the Burning algorithm Stauffer and Aharony (2018) imposing periodic (open) boundary conditions along the horizontal (vertical) direction. It may be noted that the dimers adsorbed in the isolated small islands of void space do not help in achieving the global connectivity. Only the largest island of void space holds a special importance for this purpose, whose size in its percolating phase scales as (not shown). In the context of percolation of adsorbed dimers, this may signify an effective change in the dimensionality of the problem. In general, for strong correlations, but its value decreases monotonically and approaches to zero (the value in the case of uncorrelated defects) as increases.
In Fig. 7(a), the variation of the spanning probability against has been shown for . By appropriately scaling the horizontal axis, when the same sets of data are re-plotted against we observe a nice data collapse [Fig. 7(b)], implying the finite-size scaling form
| (3) |
where is recognized as the correlation length exponent of the percolation transition. The analysis yields and for . We have also shown similar plots for in Figs. 8 (a) and 8(b). In this case we obtained and . It is evident that these exponent values are distinctly different from the value of for uncorrelated defects, for which such a transition belongs to the ordinary percolation universality class in two dimensions.
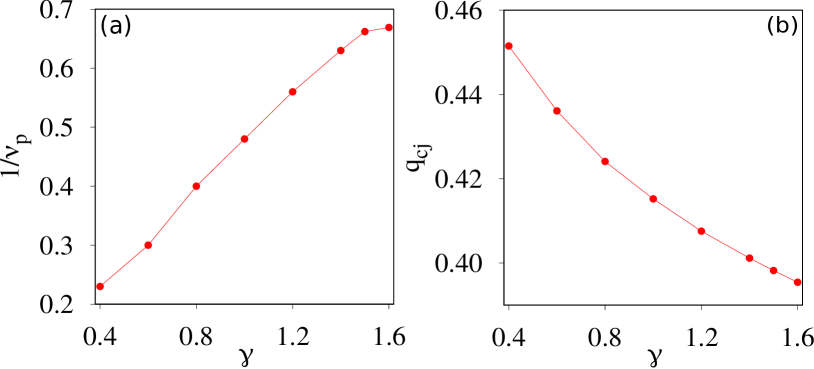
Repeating these analyses for many different values of , we see that the critical exponent increases with increasing and approaches to , as shown in Fig. 9(a). This dependency is approximately described by a relation in the range of . The percolation threshold decreases with increasing and approaches 0.3180(5), the value for uncorrelated defects, as shown in Fig. 9(b). Note that our results for uncorrelated defects are in good agreement with the previous numerical data in Ref. Tarasevich et al. (2015). The data used for all these plots are based on averages over (at least) , , and samples for = 256, 512, and 1024, respectively. Therefore, we believe that the above estimates are reasonably accurate.
III.4 Percolation transition before jamming
We have seen that for a given value of , the defect density separates between the percolating and nonpercolating jamming states. Specifically, all the jamming configurations for with density percolate in the limit of asymptotically large system sizes. This suggests that for all values of there should be a critical value of such that the system exhibits global connectivity for .
In Fig. 10(a), we have plotted the spanning probability against the surface coverage for three different system sizes using and . These curves cross each other approximately at a single point . From visual inspection, we estimate that and , which is quite lower than the value 0.636 454 001 of the crossing probability on a cylindrical geometry obtained using Cardy’s formula Cardy (2006); Ziff (2011) for defect-free systems. It is to be noted that the crossing probability has been obtained even for the system with uncorrelated defects.
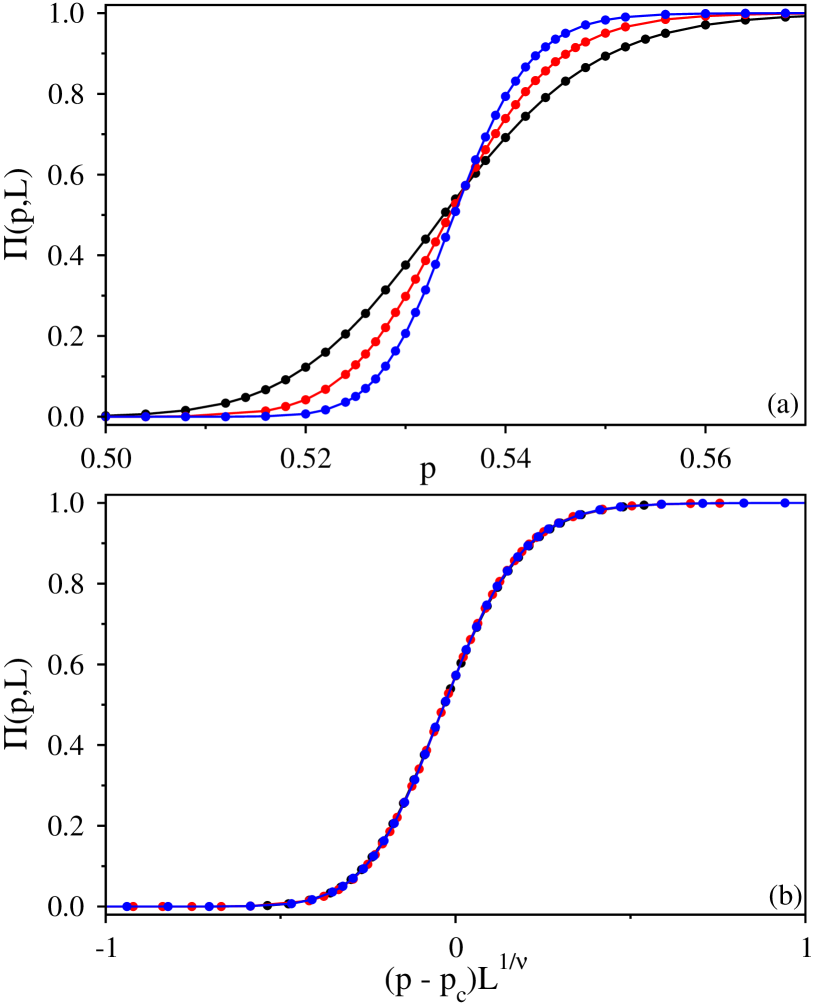
Now a finite-size scaling of the same data is performed. A plot of against the scaled variable exhibits the data collapse for all three system sizes [Fig. 10(b)], implying the scaling form
| (4) |
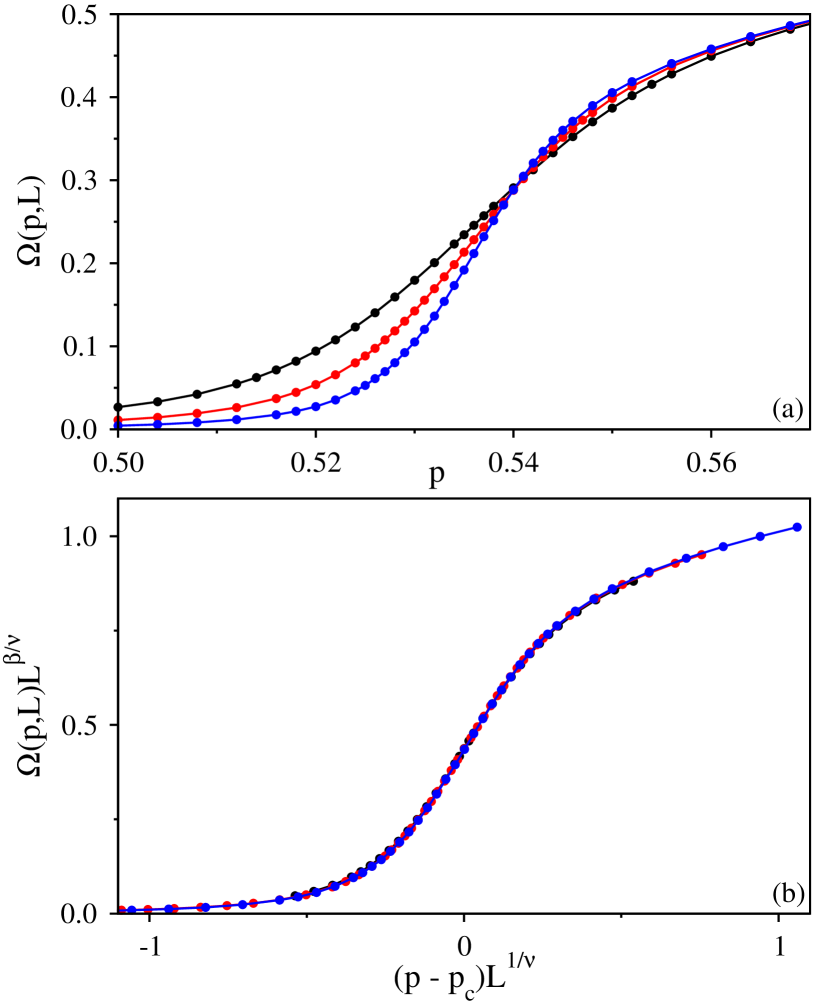
In percolation problems, the average size of the largest cluster per site is considered as the order parameter , where represents the size of the largest cluster of absorbed dimers. In Fig. 11(a), we have shown the variation of against for the same three system sizes. Again, by appropriately scaling the abscissa and ordinate, and re-plotting the data we observe data collapse of , as shown in Fig. 11(b), indicating the scaling form
| (5) |
The finite-size scaling analysis yields , , and . These values are compared with the known critical exponents for ordinary percolation in two dimensions, which are and .
| 0.6 | 0.01 | 0.55965(3) | 0.71(1) | 0.105(1) |
| 0.01 | 0.56022(3) | 0.718(5) | 0.104(1) | |
| 0.8 | 0.05 | 0.54986(3) | 0.587(5) | 0.104(1) |
| 0.10 | 0.53595(3) | 0.488(6) | 0.104(1) | |
| 0.01 | 0.56083(2) | 0.735(5) | 0.104(1) | |
| 1.2 | 0.05 | 0.55362(2) | 0.671(6) | 0.105(1) |
| 0.10 | 0.54329(3) | 0.621(5) | 0.104(1) |
The above set of calculations has been repeated for different pairs. Interestingly, we found that the critical exponent depends systematically with and , whereas always appears to be same as the value of the ordinary percolation in two dimensions, i.e., . The estimated values for different pairs are listed in Table 1. For strong correlations () and high , it is observed that the crossing points of the curves for vary over a much wider range. In these cases, the two-parameter scaling plot does not exhibit an excellent data collapse as seen for . Probably, logarithmic corrections are responsible for this. Further investigations using higher system sizes are thus needed for a precise understanding of this problem.
IV Conclusions
We have investigated the percolation and jamming properties of the random sequential adsorption of dimers on square lattice in the presence of defects with spatial long-range correlations. Accordingly, a fraction of the lattice sites are declared as defects, where the deposition of dimers is completely forbidden. The dimer adsorption takes place randomly at the available vacant space. The correlation strength among the defective sites is varied and its impact on the jamming and percolation transitions has been studied using extensive numerical simulations.
It has been observed that the jamming coverage for any arbitrary value of is increased with increasing correlation strength. More importantly, for strong correlations, the jamming transition is found to be non-universal even when is much smaller than its threshold value such that the connected clusters of defects are all minuscule. A continuously tunable value of characterizes the jamming transition, which approaches its universal value in two dimensions with decreasing correlation strength.
The percolation transition of the absorbed dimers takes place at a critical density of occupied sites only when the defect density is smaller than a critical value . The percolation threshold has been found to be dependent on the defect density as well as the strength of the spatial correlations. For a given defect density, decreases as the correlation strength is increased. Moreover, the finite-size scaling analysis reveals that the transition does not belong to the ordinary percolation universality class. The correlation length exponent changes systematically with the strength of the spatial correlation and approaches to its universal value in two dimensions when the defects become weakly correlated. Remarkably, the ratio of the exponents associated with the order parameter scaling appears to remain the same as the ordinary percolation.
Finally, by tuning the defect density a percolation transition is observed at , which separates the percolating jamming states from the non-percolating ones. Again, the percolation transition is characterized by a non-universal value of the correlation length exponent, which is found to be dependent on the strength of the spatial correlation among the defects.
In the future, apart from the obvious generalization of this model by considering different shapes and sizes of the particles on different lattice geometries or in higher dimensions, one may find it interesting to study precursor-mediated adsorption in such a correlated disordered environment.
We are hopeful that the results presented here will provide a framework for understanding various observations in different experimental conditions more coherently, since by tuning the parameters ( and ) of the model a system resembling the real one may be devised.
Acknowledgements
We sincerely thank Nuno A. M. Araújo for a critical review of the manuscript and A. J. Ramirez-Pastor for suggesting to us interesting papers on the subject.
S. K. acknowledges support from the Japan Society for the Promotion of Science (JSPS) Grants-in-Aid for Scientific Research (KAKENHI) Grants Nos. JP16H06478 and 19H01811. Additional support from the MEXT under “Exploratory Challenge on Post-K computer” (Frontiers of Basic Science: Challenging the Limits) and the “Earthquake and Volcano Hazards Observation and Research Program” is also gratefully acknowledged.
D.M. acknowledges the support from a EPSRC Programme Grant (Grant EP/R018820/1) which funds the Crystallization in the Real World consortium. In addition, D.M. gratefully acknowledges the use of the computational facilities provided by the University of Warwick Centre for Scientific Computing.
References
- Evans (1993) J. W. Evans, Rev. Mod. Phys. 65, 1281 (1993).
- Feder (1980) J. Feder, Journal of Theoretical Biology 87, 237 (1980).
- Torquato and Stillinger (2010) S. Torquato and F. H. Stillinger, Rev. Mod. Phys. 82, 2633 (2010).
- Kumacheva et al. (2002) E. Kumacheva, R. Golding, M. Allard, and E. Sargent, Advanced Materials 14, 221 (2002).
- Hlady and Buijs (1996) V. Hlady, V and J. Buijs, Current opinion in biotechnology 7, 72 (1996).
- Roman and Majlis (1983) E. Roman and N. Majlis, Solid State Communications 47, 259 (1983).
- Yu et al. (2016) D. Yu, Y.-Q. Yang, Z. Chen, Y. Tao, and Y.-F. Liu, Optics Communications 362, 43 (2016), polymer Photonics and Its Applications.
- Privman (1994) V. Privman, Trends in Stat. Phys. 1, 89 (1994).
- Ramsden (1992) J. J. Ramsden, The Journal of Physical Chemistry 96, 3388 (1992).
- Joshi et al. (2016) D. Joshi, D. Bargteil, A. Caciagli, J. Burelbach, Z. Xing, A. S. Nunes, D. E. Pinto, N. A. Araújo, J. Brujic, and E. Eiser, Science Advances (2016), 1603.05931 .
- Napolitano (2020) S. Napolitano, Soft Matter 16, 5348 (2020).
- Privman (2000) V. Privman, The Journal of Adhesion 74, 421 (2000).
- Cadilhe et al. (2007) A. Cadilhe, N. A. M. Araújo, and V. Privman, Journal of Physics: Condensed Matter 19, 065124 (2007).
- Flory (1939) P. J. Flory, Journal of the American Chemical Society 61, 1518 (1939).
- Rényi (1958) A. Rényi, Publ. Math. Inst. Hung. Acad. Sci 3, 109 (1958).
- Kondrat and Pȩkalski (2001) G. Kondrat and A. Pȩkalski, Phys. Rev. E 63, 051108 (2001).
- Cornette et al. (2003) V. Cornette, A. J. Ramirez-Pastor, and F. Nieto, Eur. Phys. J. B 36, 391 (2003).
- Tarasevich et al. (2012) Y. Y. Tarasevich, N. I. Lebovka, and V. V. Laptev, Phys. Rev. E 86, 061116 (2012).
- Gimenez and Ramirez-Pastor (2015) M. Gimenez and A. Ramirez-Pastor, Physica A: Statistical Mechanics and its Applications 421, 261 (2015).
- Stauffer and Aharony (2018) D. Stauffer and A. Aharony, Introduction To Percolation Theory (Taylor & Francis, 2018).
- Becklehimer and Pandey (1992) J. Becklehimer and R. B. Pandey, Physica A: Statistical Mechanics and its Applications 187, 71 (1992).
- Lebovka et al. (2011) N. I. Lebovka, N. N. Karmazina, Y. Y. Tarasevich, and V. V. Laptev, Phys. Rev. E 84, 061603 (2011).
- Cieśła et al. (2016) M. Cieśła, G. Paja̧k, and R. M. Ziff, The Journal of Chemical Physics 145, 044708 (2016).
- Guo et al. (1994) X.-C. Guo, J. Bradley, A. Hopkinson, and D. King, Surface Science 310, 163 (1994).
- Kundu et al. (2018) S. Kundu, N. A. M. Araújo, and S. S. Manna, Phys. Rev. E 98, 062118 (2018).
- Furlan et al. (2020) A. P. Furlan, D. C. dos Santos, R. M. Ziff, and R. Dickman, Phys. Rev. Research 2, 043027 (2020).
- Pasinetti et al. (2019) P. M. Pasinetti, L. S. Ramirez, P. M. Centres, A. J. Ramirez-Pastor, and G. A. Cwilich, Physical Review E 100, 052114 (2019).
- Ramirez et al. (2019) L. S. Ramirez, P. M. Centres, and A. J. Ramirez-Pastor, Journal of Statistical Mechanics: Theory and Experiment 2019, 033207 (2019).
- Cornette et al. (2006) V. Cornette, A. Ramirez-Pastor, and F. Nieto, Physics Letters A 353, 452 (2006).
- Kondrat (2006) G. Kondrat, The Journal of Chemical Physics 124, 054713 (2006).
- Centres and Ramirez-Pastor (2015) P. M. Centres and A. J. Ramirez-Pastor, Journal of Statistical Mechanics: Theory and Experiment 2015, P10011 (2015).
- Tarasevich et al. (2015) Y. Y. Tarasevich, V. V. Laptev, N. V. Vygornitskii, and N. I. Lebovka, Phys. Rev. E 91, 012109 (2015).
- Palacios and Gomes (2020) G. Palacios and M. A. F. Gomes, Journal of Physics A: Mathematical and Theoretical 53, 375003 (2020).
- Medina et al. (1989) E. Medina, T. Hwa, M. Kardar, and Y.-C. Zhang, Phys. Rev. A 39, 3053 (1989).
- Hewett and Behrens (1990) T. A. Hewett and R. A. Behrens, SPE Formation Evaluation 5, 217 (1990).
- Lauritsen et al. (1993) K. B. Lauritsen, M. Sahimi, and H. J. Herrmann, Phys. Rev. E 48, 1272 (1993).
- Schrenk et al. (2013) K. J. Schrenk, N. Posé, J. J. Kranz, L. V. M. van Kessenich, N. A. M. Araújo, and H. J. Herrmann, Phys. Rev. E 88, 052102 (2013).
- Makse et al. (1996) H. A. Makse, S. Havlin, M. Schwartz, and H. E. Stanley, Phys. Rev. E 53, 5445 (1996).
- Prakash et al. (1992) S. Prakash, S. Havlin, M. Schwartz, and H. E. Stanley, Phys. Rev. A 46, R1724 (1992).
- Zierenberg et al. (2017) J. Zierenberg, N. Fricke, M. Marenz, F. P. Spitzner, V. Blavatska, and W. Janke, Phys. Rev. E 96, 062125 (2017).
- Schrenk et al. (2012) K. J. Schrenk, N. A. M. Araújo, J. S. Andrade Jr, and H. J. Herrmann, Scientific Reports 2, 348 (2012).
- Cardy (2006) J. Cardy, Journal of Statistical Physics 125, 1 (2006).
- Ziff (2011) R. M. Ziff, Phys. Rev. E 83, 020107(R) (2011).