Discovery of Candidate X-ray Jets in High-Redshift Quasars
Abstract
We present Chandra X-ray observations of 14 radio-loud quasars at redshifts , selected from a well-defined sample. All quasars are detected in the 0.5–7.0 keV energy band, and resolved X-ray features are detected in five of the objects at distances of 1–12″ from the quasar core. The X-ray features are spatially coincident with known radio features for four of the five quasars. This indicates that these systems contain X-ray jets. X-ray fluxes and luminosities are measured, and jet-to-core X-ray flux ratios are estimated. The flux ratios are consistent with those observed for nearby jet systems, suggesting that the observed X-ray emission mechanism is independent of redshift. For quasars with undetected jets, an upper limit on the average X-ray jet intensity is estimated using a stacked image analysis. Emission spectra of the quasar cores are extracted and modeled to obtain best-fit photon indices, and an Fe K emission line is detected from one quasar in our sample. We compare X-ray spectral properties with optical and radio emission in the context of both our sample and other quasar surveys.
1 Introduction
Relativistic jet outflows from active galactic nuclei can transport significant energy from the central supermassive black hole to the surrounding intercluster medium (ICM; Scheuer1974; Scheuer1982; Begelman1984). Interactions between the jet and ICM will create radio lobes at kiloparsec-scale distances, making radio observations well suited for extragalactic jet studies (e.g., Blandford1974; Hargrave1974; Perley1984). Jets are responsible for feedback processes that prevent central gas from cooling in clusters of galaxies (Birzan2004; Rafferty2006; McNamara2007), consequently reducing star formation at the cluster centers (Fabian1994; Fabian2012). Thus, interactions between jets and the surrounding medium govern the overall evolution of these extragalactic systems.
| Object | aafootnotemark: | R.A.bbfootnotemark: | Decl.bbfootnotemark: | ObsIDccfootnotemark: | Observation | ddfootnotemark: | log()eefootnotemark: | log()eefootnotemark: | log()fffootnotemark: | |
|---|---|---|---|---|---|---|---|---|---|---|
| [J2000] | [J2000] | Date | [ks] | [log(] | [log()] | \@alignment@align | ||||
| J08014725 | 3.256 | 08:01:37.682 | +47:25:28.24 | 20405 | 2018 Jan 19 | 9.40 | 46.97 | \@alignment@align | ||
| J08056144 | 3.033 | 08:05:18.180 | +61:44:23.70 | 20399 | 2018 Jun 07 | 9.75 | – | – | – | |
| J08330959 | 3.713 | 08:33:22.514 | +09:59:41.14 | 20401 | 2019 Feb 04 | 9.57 | 47.10 | \@alignment@align | ||
| J09090354 | 3.288 | 09:09:15.915 | +03:54:42.98 | 20404 | 2018 Mar 03 | 9.57 | 46.88 | \@alignment@align | ||
| J09332845 | 3.431 | 09:33:37.298 | +28:45:32.24 | 20403 | 2018 Jun 10 | 9.57 | 47.27 | \@alignment@align | ||
| J10162037 | 3.114 | 10:16:44.322 | +20:37:47.30 | 20411 | 2018 Jan 24 | 9.57 | 47.08 | \@alignment@align | ||
| J11282326 | 3.042 | 11:28:51.701 | +23:26:17.35 | 20412 | 2019 Mar 10 | 9.57 | 47.07 | \@alignment@align | ||
| J12235038 | 3.491 | 12:23:43.169 | +50:37:53.40 | 20402 | 2018 Jul 31 | 9.57 | 47.86 | \@alignment@align | ||
| J14050415 | 3.215 | 14:05:01.120 | +04:15:35.82 | 20408 | 2018 May 08 | 9.57 | 46.97 | \@alignment@align | ||
| J14355435 | 3.810 | 14:35:33.779 | +54:35:59.31 | 20400 | 2018 Sep 07 | 9.57 | 46.63 | \@alignment@align | ||
| J16101811 | 3.122 | 16:10:05.289 | +18:11:43.47 | 20410 | 2018 May 24 | 9.09 | 47.31 | \@alignment@align | ||
| J16160459 | 3.212 | 16:16:37.557 | +04:59:32.74 | 20407 | 2018 May 08 | 9.48 | – | – | – | |
| J16553242 | 3.181 | 16:55:19.225 | +32:42:41.13 | 20409 | 2018 Nov 26 | 9.57 | 46.80 | \@alignment@align | ||
| J16551948 | 3.262 | 16:55:43.568 | +19:48:47.12 | 20406 | 2018 Jun 17 | 9.57 | 46.78 | \@alignment@align | ||
Redshift measurements from Sowards-Emmerd2005, Husband2015, and Paris2018. bbfootnotemark: Radio centroid coordinates from VLA positions reported in Gobeille2014. ccfootnotemark: Observations performed using Chandra ACIS-S instrument with the aimpoint on the S3 chip. ddfootnotemark: Total exposure time after flare removal reprocessing and dead time correction. eefootnotemark: Measurements from Rakshit2020. fffootnotemark: Eddington ratios for the quasar sample.
X-ray observations of extragalactic radio sources provide insights into fundamental physical processes present within these systems (e.g., Heinz1998; Harris2006; Stawarz2008; Worrall2008). Although the origin of the X-ray jet emission mechanism is not uniquely defined, one probable mechanism is that the X-rays are generated from inverse Compton upscattering of the cosmic microwave background radiation (IC/CMB; Tavecchio2000; Celotti2001). Under such an assumption, X-ray observations of jets may be used to measure the enthalpy flux, or “power,” transported by the jets to the radio lobes and the ICM (Scheuer1974; Heinz1998; Reynolds2001). IC/CMB is predicted to be the dominant X-ray emission mechanism for high-redshift radio jets as the cosmological diminution of surface brightness by the factor is offset by the increase in the CMB energy density. IC/CMB is additionally bolstered by the longer lifetimes of the 100 MeV electrons, which generate such emission, relative to the 10 GeV electrons required for radio synchrotron radiation. These emission properties make X-ray observations well suited for detecting high-redshift jets.
Although X-rays are uniquely suitable for investigating high-redshift jets, the only telescope presently capable of resolving extended X-ray structures from high-redshift radio sources is the Chandra X-ray Observatory. Previous Chandra observations have demonstrated this capability by resolving jets in luminous radio sources at redshifts up to (e.g., Siemiginowska2003; Cheung2012; McKeough2016; Simionescu2016). However, high-redshift X-ray jets remain vastly undersampled in comparison to nearby sources (Worrall2020). It is therefore the focus of this work to examine Chandra observations of additional high-redshift radio sources for evidence of X-ray structure(s) and to quantify the emission properties of these features, particularly in the context of IC/CMB radiation.
This paper is one in a series on Chandra observations of 14 radio-luminous quasars selected from GHz surveys where all targets are in the redshift range (Schwartz2020). Here, we investigated for X-ray emission from the sources while also analyzing the spectroscopic properties of both the quasar core and the extended features. The remainder of the paper is arranged as follows. Section 2 describes the sample selection criteria and X-ray data reprocessing. Section 3 describes the X-ray spectroscopic analysis of the sample, while Section LABEL:sect:extend covers the X-ray morphological analysis. Section LABEL:sect:outliers details the measured properties of the five sources from our sample where extended X-ray structure is detected, including relevant flux and surface brightness results. Optical and radio properties of the quasar cores with regard to both the sample and other quasar surveys are provided in Sections LABEL:sect:ox and LABEL:sect:radio, respectively. Our concluding remarks are provided in Section LABEL:sect:conclude.
For this paper, we adopted the cosmological parameters , , and (Hinshaw2013).
2 Sample Selection and Data Reduction
Targets for our analysis were selected from a catalog of 123 radio-bright quasars at redshifts (Gobeille2011; Gobeille2014) constructed from an overlapping region of the VLA-FIRST radio survey (Becker1995) and the Sloan Digital Sky Survey (Abazajian2003). All sources in the catalog have a spectroscopically measured redshift and a flux density in excess of 70 mJy at either 1.4 or 5 GHz. From this catalog, we focused on the 61 sources that possess resolved radio features at 1″ or better resolution. We also prioritized sources where the separation distance between the radio features exceeded 1″ as such spatial separations are resolvable with the Chandra X-ray Observatory, assuming comparable sizes for any X-ray counterparts. Lastly, we eliminated radio objects identified as triples because their jets are less likely to be at a line of sight that will achieve the relativistic beaming required for detection in X-rays. Of the remaining 31 sources that satisfied these criteria, 14 objects at redshifts with resolved radio structure that had previously not been observed in X-rays were selected for our survey.
Each target selected for our survey was observed with Chandra using the Advanced CCD Imaging Spectrometer (ACIS) with the aimpoint centered on the S3 chip. The instrument was placed in the 1/4 subarray timed exposure mode with vfaint telemetry enabled in an effort to mitigate pileup. Roll direction for each observation was defined such that the radio features did not coincide with the readout direction of the chip. We also confirmed that the known Chandra PSF artifact111See the PSF artifact caveat in the CIAO User Guide: https://cxc.harvard.edu/ciao/caveats/psf_artifact.html, which can create nonphysical X-ray features on a subarcsecond scale, was not coincident with any radio feature in our sample.
| Object | Exposure | Frequency | Observation | Beam | Beam | Beam Position | Minimum Contour | |
|---|---|---|---|---|---|---|---|---|
| [s] | [GHz] | Date | Maximum | Minimum | Angle | Intensity | ||
| [arcsec] | [arcsec] | [deg] | [mJy beam-1] | |||||
| J08014725 | 378.9 | 6.2 | 2012 Nov 18 | 0.36 | 0.31 | -16\@alignment@align.0 | 0.45 | |
| J08056144 | 319.1 | 6.2 | 2012 Nov 18 | 0.40 | 0.32 | -11\@alignment@align.5 | 0.68 | |
| J08330959 | 580.0 | 1.4 | 2008 Oct 23 | 1.95 | 1.41 | 2\@alignment@align.3 | 0.37 | |
| J09090354 | 319.1 | 6.2 | 2012 Nov 18 | 0.44 | 0.32 | -23\@alignment@align.5 | 0.10 | |
| J09332845 | 319.1 | 6.2 | 2012 Nov 18 | 0.37 | 0.34 | -57\@alignment@align.9 | 0.52 | |
| J10162037 | 398.9 | 6.2 | 2012 Nov 12 | 0.35 | 0.32 | 11\@alignment@align.4 | 0.13 | |
| J11282326 | 319.1 | 6.2 | 2012 Nov 12 | 0.34 | 0.32 | -7\@alignment@align.7 | 0.15 | |
| J12235038 | 299.2 | 6.2 | 2012 Nov 12 | 0.41 | 0.33 | 72\@alignment@align.3 | 0.12 | |
| J14050415 | 319.1 | 6.2 | 2012 Nov 18 | 0.39 | 0.32 | 7\@alignment@align.5 | 0.62 | |
| J14355435 | 319.1 | 6.2 | 2012 Nov 18 | 0.41 | 0.32 | -61\@alignment@align.4 | 0.40 | |
| J16101811 | 319.1 | 6.2 | 2012 Nov 08 | 0.34 | 0.31 | -16\@alignment@align.6 | 0.18 | |
| J16160459 | 259.2 | 6.2 | 2012 Nov 08 | 0.39 | 0.31 | -19\@alignment@align.7 | 0.85 | |
| J16553242 | 378.9 | 6.2 | 2012 Nov 08 | 0.24 | 0.21 | 63\@alignment@align.8 | 0.68 | |
| J16551948 | 319.1 | 6.2 | 2012 Nov 08 | 0.35 | 0.31 | -28\@alignment@align.9 | 0.34 | |
All X-ray observations were analyzed using the level 2 data products from the standard Chandra data processing pipeline together with the software analysis package CIAOv4.12 with CALDBv4.9.2.1. Each observation was reprocessed using the routine deflare to remove background flaring periods from the data, and the average cleaned exposure time per target is 9.53 ks. Pileup was estimated for each source using PIMMSv4.11a, and all sources had pileup over the 0.5–7.0 keV energy band. Thus, pileup was ignored for our X-ray analysis. Details on our Chandra observations are provided in Table 1.
In addition to the X-ray data, radio observations of the sample were included in our analysis. We obtained new Karl G. Jansky Very Large Array (VLA) A-array observations of these 14 quasars (see Table 2 for a summary) as part of a more extensive radio imaging and follow-up program of this sample (Gobeille2014). The data were calibrated and imaged using standard procedures in CASA and AIPS. The majority of the VLA maps (13/14) were obtained as single 4–6 minute snapshot observations in November 2012 (program 12B-230) using two 1 GHz wide intermediate-frequency bands centered at 4.9 and 7.4 GHz (effective center frequency of 6.2 GHz). The maps of J14050415 and J16101811 were previously published in Schwartz2020. For J08330959, we used an earlier VLA A-array 1.4 GHz map we obtained in October 2008 (program AW748) and published in Gobeille2014.
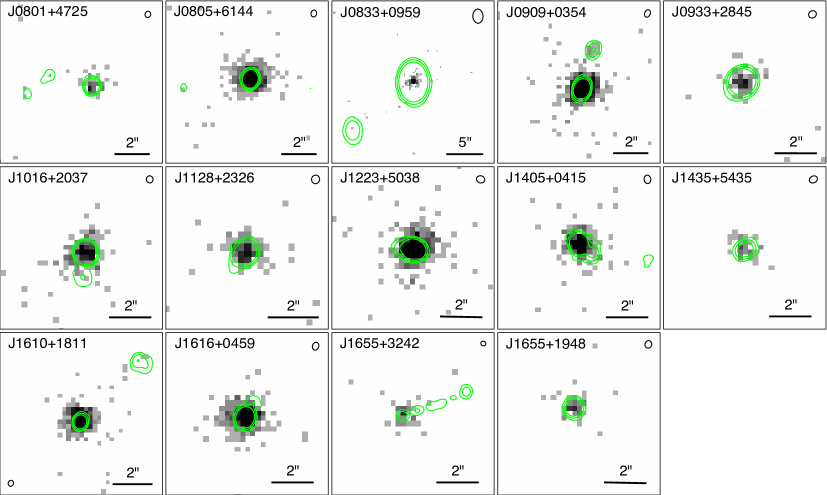
The X-ray and radio observations were aligned based on the centroid position of the core. Centroid position was measured in each observation using the dmstat routine in CIAO, and the 0.5–7.0 keV X-ray observation coordinates were shifted with wcs_update to agree with the radio data. The average astrometric translations for the sample were and , which are consistent with the overall 90% absolute position uncertainty of 08 for Chandra. We also generated radio contours from the available maps. The minimum contour level was defined as 3–5 times the rms noise measured in an off-source region on the image, and the contour levels were drawn at increasing factors of four intervals for all sources. The resulting X-ray–radio overlays are shown in Figure 1, where the 0.5–7.0 keV Chandra images are subpixel binned in 025 pixels. Additional details on the radio maps and contours used in our analysis are provided in Table 2.
3 X-ray Emission Spectra
| Object | Model | |||||||||||
|---|---|---|---|---|---|---|---|---|---|---|---|---|
| (1) | (2) | (3) | (4) | (5) | (6) | (7) | (8) | (9) | (10) | (11) | ||
| J08014725 | 48 | A | 0.0454 | \@alignment@align | – | – | +1.2 | |||||
| -1.0 | ||||||||||||
| +3.1 | ||||||||||||
| -1.9 | ||||||||||||
| +0.09 | ||||||||||||
| -0.09 | ||||||||||||
| +3.4 | ||||||||||||
| -3.4 | ||||||||||||
| +2.4 | ||||||||||||
| -2.2 | ||||||||||||
| +2.8 | ||||||||||||