Unusual anisotropic magnetic orbital moment obtained from X-ray magnetic circular dichroism in a multiferroic oxide system
Abstract
The electric-field control of -electron magnetism in multiferroic transition metal oxides is attracting widespread interest for the underlying fundamental physics and for next generation spintronic devices. Here, we report an extensive study of the magnetism in magnetoelectric Ga0.6Fe1.4O3 (GFO) epitaxial films by polarization dependent x-ray absorption spectroscopy. We found a non-zero integral of the x-ray magnetic circular dichroism, with a sign depending upon the relative orientation between the external magnetic field and the crystallographic axes. This finding translates in a sign-reversal between the average Fe magnetic orbital and spin moments. Large Fe-displacements, among inequivalent octahedral sites, lower the symmetry of the system producing anisotropic paths for the Fe-O bondings giving rise to a large orbital-lattice interaction akin to a preferential crystallographic direction for the uncompensated or averaged among different sites, magnetic orbital moment. The latter may lead to a partial re-orientation of the magnetic orbital moment under an external magnetic field that, combined to the ferrimagnetic nature of the GFO, can qualitatively explain the observed sign-reversal of the XMCD integral. The results suggest that a control over the local symmetry of the oxygen octahedra in transition metal oxides can offer a suitable leverage over the manipulation of the effective orbital and spin moments in magnetoelectric systems.
The emergent functionalities disclosed by transition metal oxides (TMOs) tokura2017emergent together with the latest advances in atomic-scale synthesis boschker2011optimized , are triggering a focus shift in the materials research panorama. The electric field control of the spin in ferromagnets (viz. spintronics), as envisaged in multiferroic TMOs banerjee2019oxide ; vaz2018oxide , is generating large interest for the potential high impact in technology. Multiferroics combine at least two ferroic order parameters (usually the ferroelectric polarization and the magnetization), which can conceptually lead to an efficient electric-field control of the d-electron magnetism. Recent propositions of devices based on the combination of multiferroic TMOs and large spin-orbit coupling (SOC) materials dowben2018towards ; manipatruni2018beyond would allow low dissipation writing and read-out processes within the same material stack, thus reducing the operational current in logic gates and memories, and enhancing the devices’ scalability manipatruni2019scalable . At the same time, recently it has been theoretically shown that some multiferroics, like BiCoO3, can exhibit a bulk Rashba SOC PhysRevB.100.245115 . It follows that understanding how SOC couples the electron spin angular momentum to the electron orbital angular momentum in multiferroic TMOs is a necessary step towards a rational design of novel ultralow-switching-energy multiferroic-based devices.
Fe3+-based oxides, being characterized by a electronic configuration, should exhibit a zero magnetic orbital moment () as it is found, for example, in the case of -Fe2O3 nanoparticles BRICEPROFETA2005354 . However, a non-zero , parallel to the magnetic spin moment (), was reported in the case of magnetoelectric gallium ferrite (GaFeO3) single crystals kim2006orbital where, Fe3+ ions occupy only octahedral (Oh) sites. This result was interpreted as a consequence of intrinsic FeO6 crystalline distortions, capable of removing the parity symmetry of the -orbitals via anisotropic Fe-O hybridization paths. Similarly, Tseng by using the sum-rules reported a non-zero parallel to in -Fe2O3 nanoparticles tseng2009nonzero .
In this work, we report polarization dependent X-ray absorption spectroscopy (XAS) measurements, and in particular Fe L3,2-edges X-ray magnetic circular dichroism (XMCD) data, on magnetoelectric Ga0.6Fe1.4O3(GFO) epitaxial films. The 0.4 excess of Fe increases the ferrimagnetic transition above room temperature. This Fe doping allows also a certain amount of Fe3+ in tetrahedral (Td) sites (see, for example, Table 1).
By applying the sum-rules to the XMCD data we find that the magnetic orbital moment is anisotropic with a direction parallel or antiparallel to the net magnetic spin moment depending on the orientation between magnetic field and crystallographic axes. We explain the non-zero value of the net and the abnormal change of orientation with respect to the average , as a consequence of a direction dependent compensation between and along different crystal axes of inequivalent (differently distorted) Fe sites. Here, the Fe ions moving away from the gravity center of the octahedral cage set a strong orbital-lattice interaction that, for large displacements may prevent the magnetic orbital moment to follow completely the externally applied magnetic field.
We studied 64 nm thick GFO films epitaxially grown onto (111) SrTiO3 (STO) single crystals by pulsed laser deposition technique. Details on the growth and structural characterization are provided elsewhere homkar2019ultrathin . The experiments were performed at DEIMOS beamline (SOLEIL Synchrotron facility - France) at 4 K in total electron yield mode (probing depth of 5 nm) with an energy resolution of . 0.15 eV Ohresser2014 ; Joly2014 . Each XMCD spectrum was obtained as the difference between an average of 8 XAS spectra acquired around the Fe L-edge, with a large pre- and post-edge energy range, and a magnetic field (H) parallel and antiparallel to the photon-helicity vector orientations. The 16 XAS data needed for each XMCD were collected in a sequence alternating reversal of field and circular polarization. This procedure ensures the best cancellation of spurious effects and experimental artifacts.
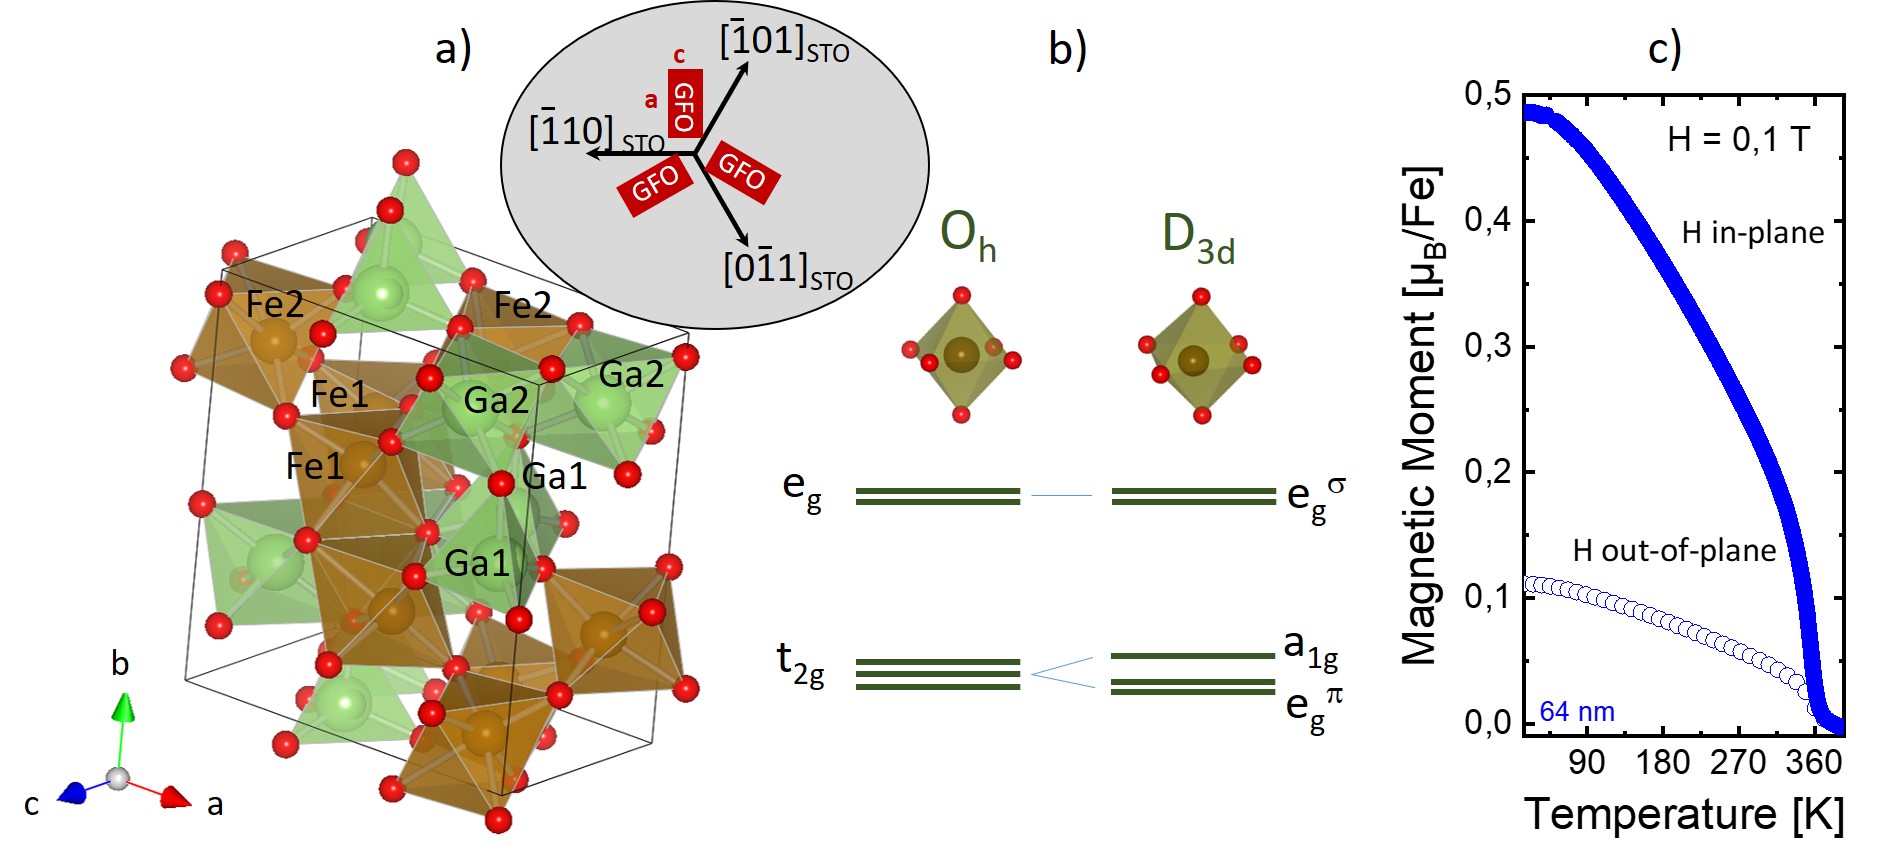
Gallium ferrite crystallizes in the orthorhombic (33) space group with four inequivalent cationic sites abrahams1965crystal : tetrahedral Ga1 and octahedral Fe1, Fe2, and Ga2 sites. The ferromagnetically aligned spins at Ga1 and Fe1 sites are antiparallel to the ones at Ga2 and Fe2 sites, and the net magnetic moment depends on their relative occupations bertaut1966etude . The conventional GFO unit cell is depicted in Figure 1a with - and -axis being the polar (ferroelectric) and magnetic (ferrimagnetic) easy axes, respectively.
| Ga1(Td) | Ga2(Oh) | Fe1(Oh) | Fe2(Oh) | Sum | Expected | ||
|---|---|---|---|---|---|---|---|
| Ga3+ | 0.60 | 0.25 | 0.15 | 0.05 | 1.10 | 1.20 | |
| Fe3+ | 0.40 | 0.75 | 0.85 | 0.95 | 2.95 | 2.80 |
The anisotropic magnetoelectric properties of bulk GFO are largely associated to a magnetic field-induced modulation of the Fe displacements which occur at both Fe1 and Fe2 sites in opposite directionArima2004a . The Fe ions are assumed to re-adjust their relative position within the distorted FeO6 octahedra mainly along the -axis when a magnetic field (H) is applied along the perpendicular direction ( the -axis). For the opposite situation, which sees H applied along the -axis, the Fe-displacements along the -axis are less energetically favorable and, most likely, controlled by the nature of the intrinsic distortion of the FeO6 octahedra. The latter have one of the eight-faces oriented in the -plane, and are trigonally distorted along the -axis which is also the three-fold rotational axis of the trigonal symmetry (D3d)khomskii2014transition . Here, the t2g Fe3+ orbitals are transformed into a and e states, and the eg doublet becomes a unique e state, as schematically shown in Figure 1b. The growth orientation of the GFO onto the STO is sketched in the Inset of Figure 1a, where the bulk -plane results stabilized on the substrate’s surface and the bulk -axis coincides with the surface normal.
To attest the quality of our GFO thin films we performed magnetic measurements via vibrating sample magnetometry (Quantum Design, MPMS). Figure 1c shows the temperature dependence of the magnetization acquired with a magnetic field of 0.1 T oriented in both in-plane (-plane) and out-of-plane (-axis) directions. While the Curie temperature of 356 K is the same for both geometries, the net magnetic moment is strongly anisotropic with the hard axis along the -axis (out-of-plane direction). The saturated magnetic moment measured at 10 K and 6.5 T is 0.78 0.08 /Fe (See Figure S2 of the SI file SI). The relative cationic distribution, and reported in Table 1, have been determined in previous resonant elastic X-ray scattering (REXS) measurements performed on GFO thin films obtained from the same ceramic target lefevre2016determination as this study. Oxygen K-edge XAS measurements as a function of the linear polarization were used to compare the electronic structure of our GFO films to stoichiometric GaFeO3 single-crystals. The spectra show a strong polarization dependence reflecting a strong orbital in-plane/out-of-plane anisotropy. XAS at the O-K edge is related to the degree of covalency in the system, hence, reflecting the oxygen projected unoccupied density of states de1989oxygen . In Figure 2a we show O-K edge XAS spectra acquired with linear horizontal (LH) and vertical (LV) polarized light with an incidence angle of 60∘ (grazing incidence (GI) geometry), with respect to the sample normal (see Inset of Figure 2a). In this geometry, the spectra acquired with LH polarization give mostly information regarding the unoccupied O levels oriented out-of-plane ( parallel to the -axis of the film), while with LV we collect information of the unoccupied O states oriented in the sample plane, parallel to the - and the -axes, as both directions are essentially indistinguishable ( Inset of Figure 1a). Indeed, LH and LV O-K edge spectra acquired in normal incidence (NI) geometry are identical (See Figure S3 of the SI file SI), hence, confirming the GFO growth mode as sketched in the inset of Figure 1a.
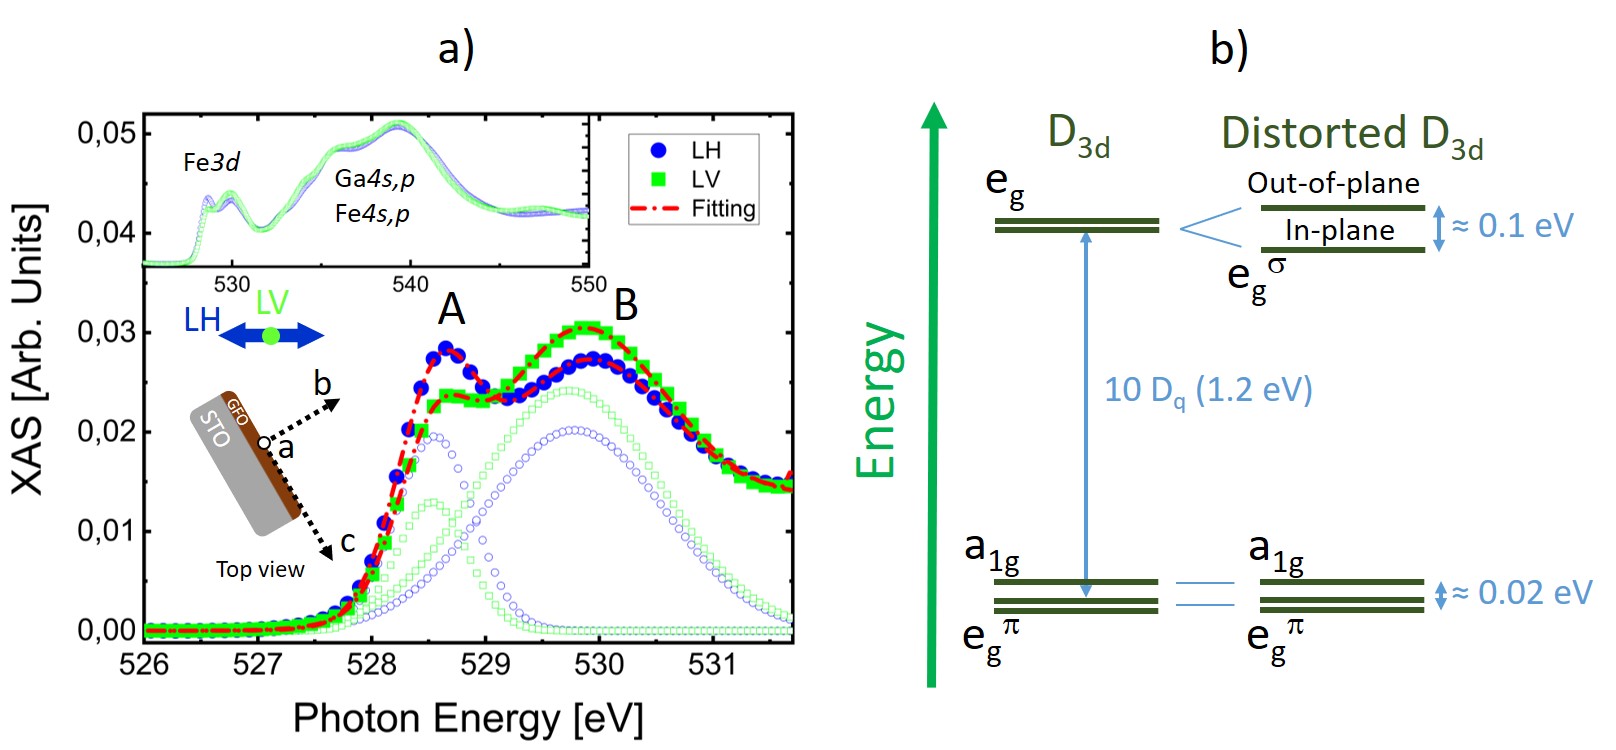
The high energy region, above 532 eV, is characterized by broad peaks due to the hybridization between O and , Ga and Fe orbitals. On the other side, the pre-peak region, up to 532 eV, being related to the O hybridization with Fe orbitals is the one we analyzed. The two main features, labelled A- and B-, are roughly associated to the Fe t2g and eg-bands, which within the trigonal crystal field can be linked to (a, e) and e orbitals derived bands (Figure 2b). Thus, the peak A is a convolution between in-plane (e) and out-of-plane (a) derived bands. If the symmetry is further lowered, the e peak can also split. As matter of fact, the data acquired with LH and LV polarizations show a shift in the position of the A and B features which can be quantified by two-peaks Voigt profile (open symbols), shown as red dashed lines in Figure 2a. The analysis reveals that the average distance between A and B features, roughly corresponding to the 10Dq crystal field splitting, is of the order of 1.2 eV, while the energy splitting between a and e bands is of the order of 0.02 eV. Larger is the shift of the B-peaks (0.1 eV), which demonstrates also a removal of the e degeneracy. Furthermore, the strong intensity variation of the A and B peaks measured with LH and LV polarizations, suggests a strong anisotropic hybridization among Fe and O orbitals for both in-plane and out-of-plane directions. In Figure 2b we show a tentative energy diagram of the orbital hierarchy derived from the O K-edge XAS spectra analysis. In particular, it emerges that the out-of-plane (a) orbitals set higher in energy compared to in-plane ones (e), pointing at a trigonal elongation of the FeO6 octahedra (See Figure S4 of the SI file SI). Summarizing, our O-K edge measurements confirming the removal of the e orbitals degeneracy with an anisotropic Fe-O hybridization path, point at a net non-zero value also for our GFO thin films, as already inferred for GaFeO3 single-crystals kim2006orbital . Here, the result of inner movements of Fe ions brings to a parity symmetry breaking of the electron clouds with a subsequent apparition of a measurable magnetic orbital moment. Finally, it should be mentioned also that while O-K edge spectra cannot be used to precisely determine the values of the crystal field splitting parameters they can give, nevertheless, a good estimation.
In order to determine if the observed anisotropic Fe-O hybridization network induces an orbital moment in our films, we performed XAS and XMCD measurements at the Fe L3,2-edges in both NI and GI geometries. Figure 3a shows the area-normalized XAS spectra corrected from saturation effects nakajima1999electron (more details are present in the SI file SI). This correction is fundamental when a quantitative analysis of the magnetic orbital moment is required, and one of the most important parameters to consider is the X-ray penetration depth that depends upon the material density.
In the case of our GFO thin films we calculated the X-ray penetration depth values from our XAS spectra as reported in the SI file SI. As a result of this calculation we used in NI (GI) the values of 19.3 (24.5) nm and 83.2 (76.8) nm for the L3 and L2 edges, respectively. The overall acquired XAS signal well reproduces the features of the Fe L3,2-edges of GaFeO3 single crystals kim2006orbital demonstrating the high-quality of our thin films. However, by a closer look to the XAS spectra (see inset of Figure 3a), in NI the relative intensities of the two peaks at L2 is opposite to the spectrum acquired in GI, possibly reflecting the spatial anisotropy of the spin/orbital density on each of the Fe ions due to their relative displacements within the FeO6 octahedra.
To get some basic information regarding the valence state of the Fe ions from the XAS spectra we resorted to atomic multiplet calculations by using the freely-available CTM4XAS software ctm4xas . The simulations were performed neglecting the symmetry lowering provoked by the Fe displacements. While no substantial changes in the spectral line shape are expected from this approximation, it is strictly necessary to implement the off-centering of the Fe ions within the FeO6 octahedra for a correct reproduction of the XMCD spectra and related integrals. Charge transfer (CT) mechanism was also implemented which, describing a dynamic charge fluctuation among the O2p and Fe3d bands, accounted for the large Fe-O hybridization degree as demonstrated by O-K edge measurements. Simulations of the XAS spectra were implemented starting from the work of Chen about magnetite thin films chen2004magnetic . Crystal field (10Dq), CT (, Udd, Upd, Te, Tab) and relative occupations of Fe3+ in both Oh and Td sites are listed in Table 2. We considered a reduction of the Slater-Condon integrals of 70%. The core-level spin-orbit coupling for the Td (Oh) simulation was set to 0.97 (1).
| 10Dq | Udd | Upd | Te | Tab | Weight | ||
| for XAS | |||||||
| Fe3+(Oh) | 1.2 | 3.0 | 6.0 | 7.5 | 0.5 | 1 | 92% |
| Fe3+(Td) | 1.2 | 3.0 | 6.0 | 7.5 | 0.5 | 1 | 8% |
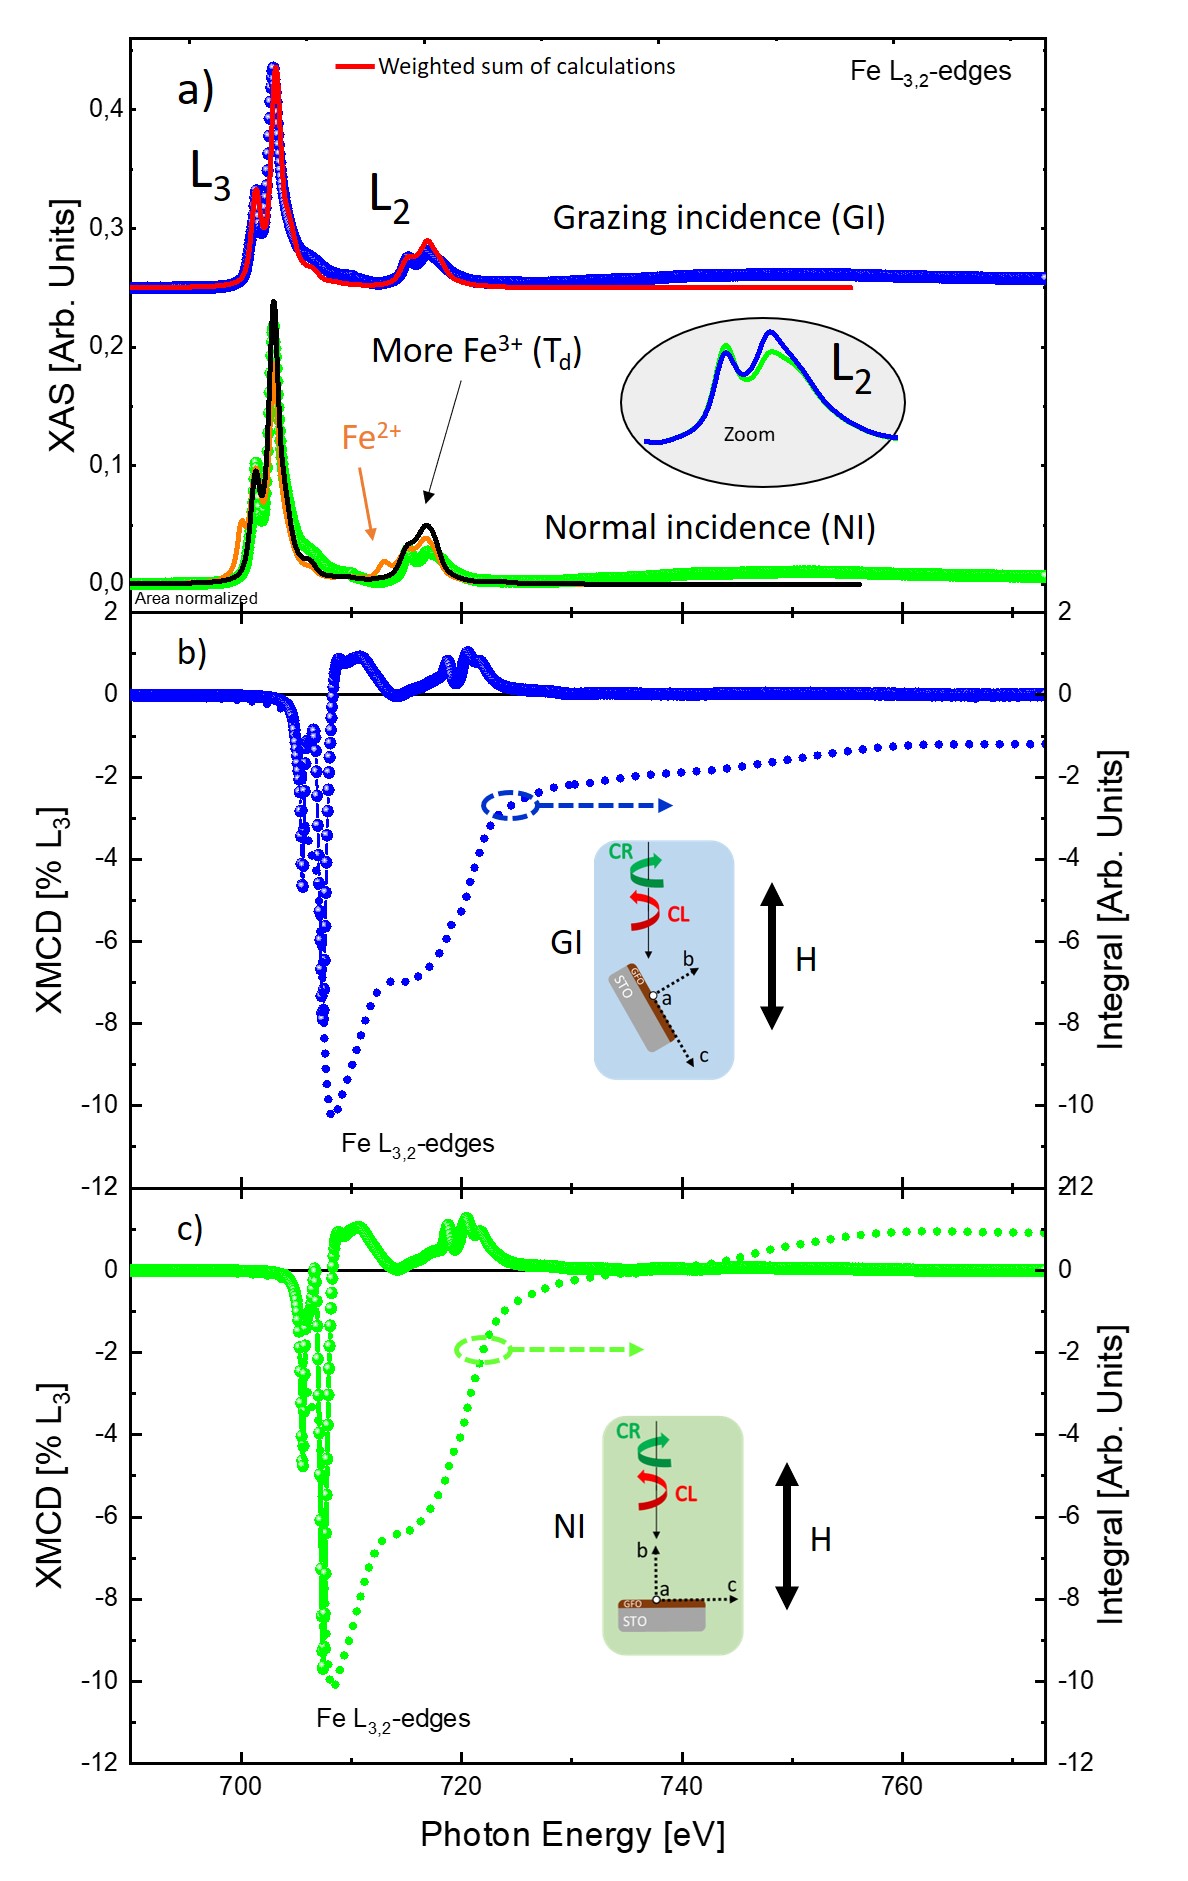
The spectral line features of the XAS data in GI are overall reproduced (red solid line of Figure 3a) accounting for Fe3+ ions in both Oh and Td sites with the expected proportion (see Tables 1,2). In NI we could not reproduce the exact L2 doublet profile most likely because the relative intensities might depend on details of the crystal field. Still, we can exclude a different sites occupations, e.g. a larger amount (20%) of Fe3+ in Ga1 (Td) sites (solid black line of Figure 3a), as-well-as the presence of a fraction of Fe2+ in the system (orange line in Figure 3a). The overall good match between XAS data and simulation suggests that spurious effects, indeed, mainly attributable to a reduction of the Fe valence state and/or altered sites occupations, can be neglected for the following discussions.
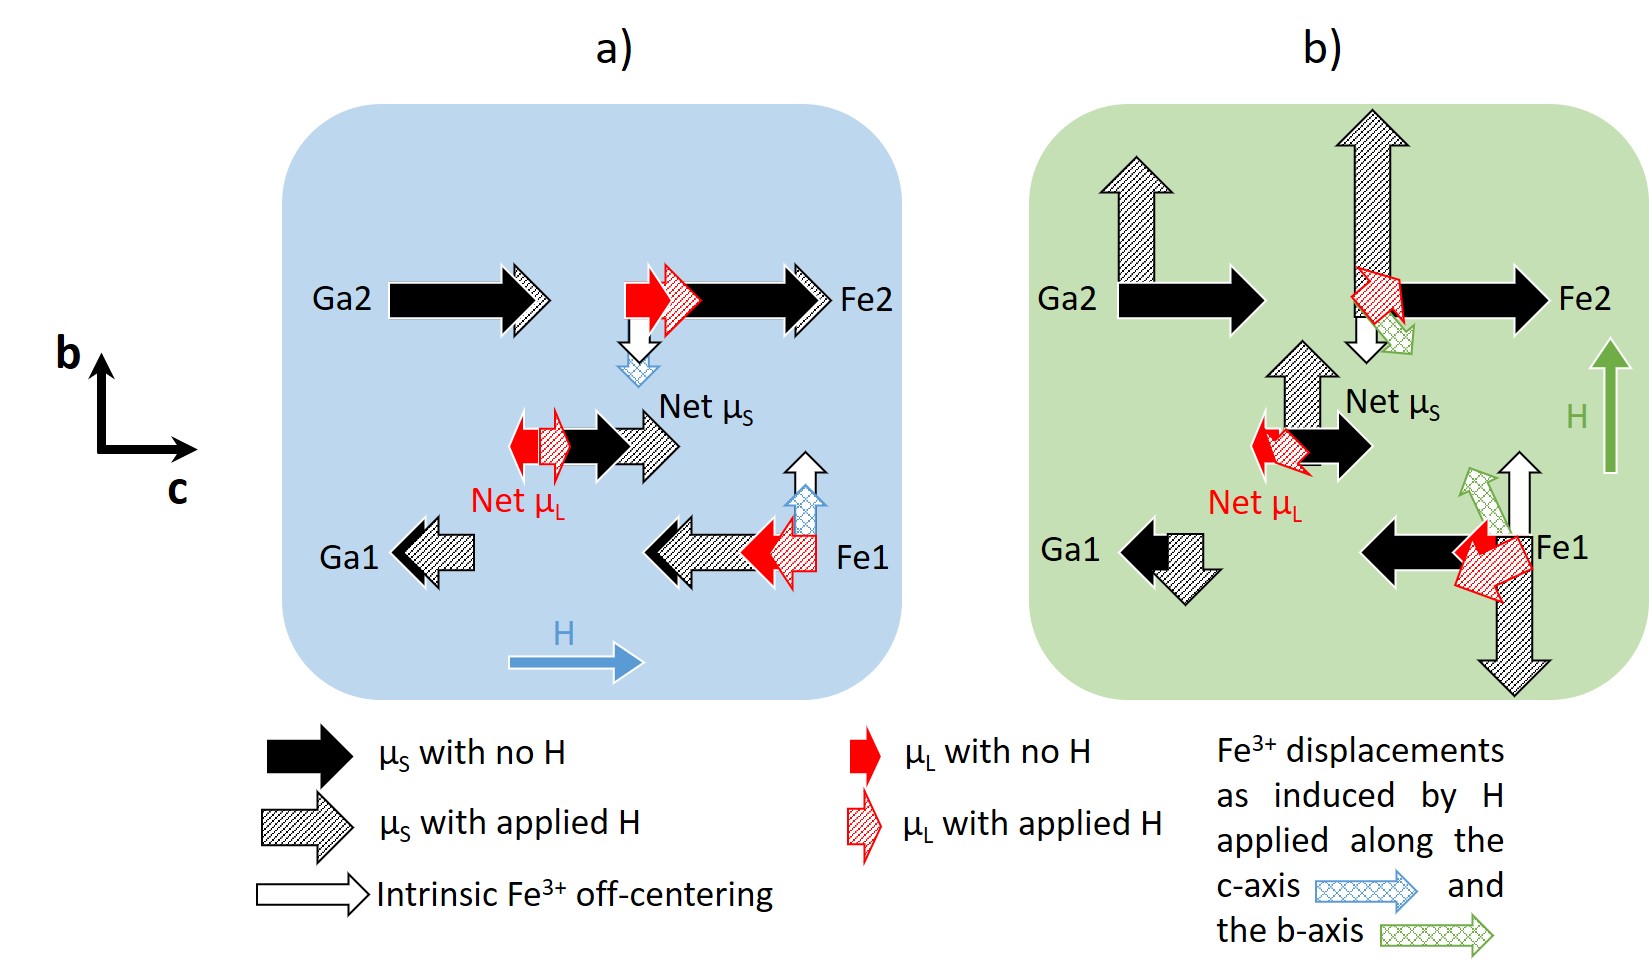
Figures 3b,c report the XMCD spectra acquired for both NI and GI geometries after the saturation correction. Also in this case we can highlight a good agreement with data reported for GaFeO3 single-crystals showing similar features, alike the two negative peaks at L3 and a positive feature at L2 (Figure S5 of the SI file SI shows the two XMCD spectra superimposed). By focusing on the integral sign of the XMCD, while in GI we recover a negative value (corroborating the reported results for bulk GaFeO3), in NI we surprisingly observe a positive integral value. To guarantee a quantitative analysis of this finding any drawbacks linked to the practical application of the sum-rules need to be excluded. Indeed, the extrapolation of absolute values for orbital and spin moments is particularly challenging Elnaggar2020 , especially in the case of materials containing the magnetic ions in the same nominal oxidation state but in different coordination and symmetry wu1993first (, mixed occupation of Td and Oh sites), as it is for GFO. XMCD measurements performed on undoped GFO thin films, for which the Fe3+ occupation of Td sites is practically zero lefevre2016determination , rendered the same integral sign variation as for doped GFO thin films (See Figure S1 of the SI file for more details SI). Importantly, we obtain the result that sum-rules can formally hold also for our doped GFO thin films. In this framework, the integral of the XMCD is proportional to the average orbital moment Chen1995 ; thole1992x , and we get the unexpected result that the relative orientation of the calculated average orbital and spin moments depends upon the crystallographic direction. Table 3 reports the average and values, as obtained from sum-rules, for both NI and GI geometries. Within the systematic error that accompanies the application of the sum-rules of about 10-20%, we found that the external magnetic field is strong enough to align along both crystallographic directions, but this does not hold for which, within the error, has values that do not overlap. As already discussed by Kim , intrinsic Fe-displacements within the most distorted Oh sites of the GFO orthorhombic crystal structure are responsible of a non-zero . The latter extending perpendicular to the off-centering direction is a result of the anisotropic electron cloud around the Fe ionskim2006orbital . In this picture is linked to the magnitude/direction of the Fe off-centering with respect to the FeO6 center of gravity, and to fully orient it along H, one should assume that the Fe-displacements can take place along all the crystallographic directions within the distorted FeO6 octahedra. As a matter of fact, our XMCD data ( Figure 3c), verified on several samples and showing a sign-reversal of the XMCD integrals, tell us that this is not the case and, on the contrary, inform about a possible large lattice-orbital effect characterizing the most distorted Fe1 and Fe2 sites of our GFO thin films.
| ] | [ | [] | |
| NI | +0.72 0.07 | -0.023 0.002 | 0.70 0.07 |
| GI | +0.68 0.07 | +0.016 0.002 | 0.70 0.07 |
As discussed above, the off-centering of the Fe3+ ions determines a different degree of hybridization between Fe and O states along the main crystallographic axes for each distorted sites, hence, establishing anisotropic Fe-O hybridization paths. As already shown by Arima , Fe3+ ions sitting in the most distorted Fe1 and Fe2 sites move along the -axis in opposite directions Arima2004a (plain white arrows sketched in Figure 4). In the absence of H such intrinsic off-centering sets a net along the -axis, opposed to the net for which the contribution from Fe2 and Ga2 sites prevails over the one of Fe1 and Ga1 sites, the latter being mostly occupied by Ga ions. When we measure the XMCD in GI geometry, being H mostly oriented in the sample plane, the Fe ions re-adjust their position in the perpendicular direction Arima2004a , as exemplified by the blue shaded arrows of Figure 4a. As a direct consequence of this, the orbital moment weakens (expands) at Fe1 (Fe2) site, hence, promoting a net parallel to the net and confirming our experimental finding in GI geometry. On the other side, in NI geometry, H is directed out-of-plane along the -axis which represents the magnetic hard axis and, at high enough field (6.5 T), the spin structure can be modified as sketched in Figure 4b (See Figure S2 of the SI file SI). One then expects the orbital magnetic moment to follow this rotation. This means that, since is largely controlled by the anisotropic displacements of the Fe3+ ions within the distorted FeO6 octahedra at Fe1 and Fe2 sites, the Fe3+ off-centering should go mainly along the -axis foreseeing a complete re-orientation of the distortions within the GFO crystal structure. Without considering the energy scale associated to this process, if this happens, the sign between and would not change, since we will meet the same situation as introduced and explained for GI geometry (Figure 4a), with no possibility to distinguish among the - and -axes anymore. On the contrary, if we consider that the Fe3+ ions displacements have a large component along the -axis, which implies that at each Fe1 and Fe2 site only slightly rotates, as sketched in Figure 4b by the green shaded arrows, the net along H is now oriented antiparallel to as, indeed, expected from our XMCD results in NI geometry (Figure 3c).
This scenario explains the anomalous change of the average orbital moment with the crystallographic direction and has important implication for the physics of this system. In particular, it shows that a strongly correlated oxide may have a direction-dependent average magnetic orbital moment as a result of anisotropic distortions and related lattice-orbital effects, which geometrically control the relative orientation between the spin and orbital moments. Thus, a control over the distortions at each site of the GFO crystal structure would then offer an adjustment knob over the spin-orbit coupling in the system. Furthermore, Elnaggar showed that a non-collinearity between spin and orbital magnetic moments is possible also in magnetite (Fe3O4) single crystals Elnaggar2020 . There, an intimate interplay between trigonal distortions, spin-orbit coupling and exchange interaction were assumed to be at the origin of the non-collinear orbital and spin ordering direction. In GFO thin films, this non-collinearity is mainly linked to the intrinsic Fe off-centering within the distorted FeO6 octahedra with direct consequences on the magnetoelectric and magnetic properties. We believe that our results will encourage the study of TMOs materials exhibiting multiferroic properties to assess their potential in spintronics by performing experiments, such as spin-pumping, ferromagnetic resonance and/or spin-Seebeck effects, taking into account the relative orientation between H and crystallographic axes.
Acknowledgements.
This work was funded by the French National Research Agency (ANR) through the ANR MISSION ANR-18-CE-CE24-0008-01. DP has benefited support from the initiative of excellence IDEX-Unistra (ANR-10-IDEX-0002-02) from the French national program Investment for the future. S.H. acknowledges financial support from ANR through Grant ANR-17-EURE-0024 EUR QMat. The synchrotron experiments were performed at SOLEIL synchrotron facility in France under proposal number 20180460. The authors wish to thank F. Choueikani for the scientific and technical support at DEIMOS and L. Joly, J.P. Kappler for preliminary measurements performed at SLS. P. Ohresser, M. Alouani, and P. Sainctavit are also deeply acknowledged for fruitful and inspiring discussions regarding the possible mechanism explaining our XMCD data. F. de Groot is acknowledged for advice regarding the atomic multiplet calculations. Finally, the authors are very grateful to S. Grenier for the implementation of the DYNA code used for the calculation of X-ray penetration depths.References
- 1 Tokura, Y., Kawasaki, M., and Nagaosa, N. Nature Physics 13(11), 1056–1068 (2017).
- 2 Boschker, H., Huijben, M., Vailionis, A., Verbeeck, J., van Aert, S. v., Luysberg, M., Bals, S., van Tendeloo, G. v., Houwman, E. P., Koster, G., et al. Journal of physics D: applied physics 44(20), 205001 (2011).
- 3 Banerjee, T. Oxide Spintronics. Pan Stanford, (2019).
- 4 Vaz, D. C., Barthélémy, A., and Bibes, M. Japanese Journal of Applied Physics 57(9), 0902A4 (2018).
- 5 Dowben, P. A., Binek, C., Zhang, K., Wang, L., Mei, W.-N., Bird, J. P., Singisetti, U., Hong, X., Wang, K. L., and Nikonov, D. IEEE Journal on Exploratory Solid-State Computational Devices and Circuits 4(1), 1–9 (2018).
- 6 Manipatruni, S., Nikonov, D. E., and Young, I. A. Nature Physics 14(4), 338–343 (2018).
- 7 Manipatruni, S., Nikonov, D. E., Lin, C.-C., Gosavi, T. A., Liu, H., Prasad, B., Huang, Y.-L., Bonturim, E., Ramesh, R., and Young, I. A. Nature 565(7737), 35–42 (2019).
- 8 Yamauchi, K., Barone, P., and Picozzi, S. Physical Review B 100(24), 245115 (2019).
- 9 Brice-Profeta, S., Arrio, M.-A., Tronc, E., Menguy, N., Letard, I., dit Moulin, C. C., Noguès, M., Chanéac, C., Jolivet, J.-P., and Sainctavit, P. J. Magn. Magn. Mater. 288, 354–365 (2005).
- 10 Kim, J.-Y., Koo, T., and Park, J.-H. Physical Review Letters 96(4), 047205 (2006).
- 11 Tseng, Y.-C., Souza-Neto, N. M., Haskel, D., Gich, M., Frontera, C., Roig, A., Van Veenendaal, M., and Nogués, J. Physical Review B 79(9), 094404 (2009).
- 12 Homkar, S., Preziosi, D., Devaux, X., Bouillet, C., Nordlander, J., Trassin, M., Roulland, F., Lefèvre, C., Versini, G., Barre, S., et al. Physical Review Materials 3(12), 124416 (2019).
- 13 Ohresser, P., Otero, E., Choueikani, F., Chen, K., Stanescu, S., Deschamps, F., Moreno, T., Polack, F., Lagarde, B., Daguerre, J.-P., Marteau, F., Scheurer, F., Joly, L., Kappler, J.-P., Muller, B., Bunau, O., and Sainctavit, P. Rev. Sci. Instrum. 85(1), 13106 (2014).
- 14 Joly, L., Otero, E., Choueikani, F., Marteau, F., Chapuis, L., and Ohresser, P. J. Synchrotron Radiat. 21(3), 502–506 (2014).
- 15 Abrahams, S., Reddy, J., and Bernstein, J. The Journal of Chemical Physics 42(11), 3957–3968 (1965).
- 16 Bertaut, E., Bassi, G., Buisson, G., Chappert, J., Delapalme, A., Pauthenet, R., Rebouillat, H., and Aleonard, R. Journal de Physique 27(7-8), 433–448 (1966).
- 17 Lefevre, C., Thomasson, A., Roulland, F., Favre-Nicolin, V., Joly, Y., Wakabayashi, Y., Versini, G., Barre, S., Leuvrey, C., Demchenko, A., et al. Journal of Applied Crystallography 49(4), 1308–1314 (2016).
- 18 Arima, T., Higashiyama, D., Kaneko, Y., He, J. P., Goto, T., Miyasaka, S., Kimura, T., Oikawa, K., Kamiyama, T., Kumai, R., and Tokura, Y. Physical Review B 70(6), 1–8 (2004).
- 19 Khomskii, D. Transition metal compounds. Cambridge University Press, (2014).
- 20 De Groot, F., Grioni, M., Fuggle, J. C., Ghijsen, J., Sawatzky, G. A., and Petersen, H. Physical Review B 40(8), 5715 (1989).
- 21 Nakajima, R., Stöhr, J., and Idzerda, Y. U. Physical Review B 59(9), 6421 (1999).
- 22 Stavitski, E. and De Groot, F. M. Micron 41(7), 687–694 (2010).
- 23 Chen, J., Huang, D., Tanaka, A., Chang, C., Chung, S., Wu, W., and Chen, C. Physical Review B 69(8), 085107 (2004).
- 24 Elnaggar, H., Sainctavit, P., Juhin, A., Lafuerza, S., Wilhelm, F., Rogalev, A., Arrio, M.-A., Brouder, C., van der Linden, M., Kakol, Z., Sikora, M., Haverkort, M. W., Glatzel, P., and de Groot, F. M. F. Phys. Rev. Lett. 123(20), 207201 nov (2019).
- 25 Wu, R., Wang, D., and Freeman, A. J. Physical review letters 71(21), 3581 (1993).
- 26 Chen, C. T., Idzerda, Y. U., Lin, H. J., Smith, N. V., Meigs, G., Chaban, E., Ho, G. H., Pellegrin, E., and Sette, F. Physical Review Letters 75(1), 152–155 (1995).
- 27 Thole, B., Carra, P., Sette, F., and van der Laan, G. Physical Review Letters 68(12), 1943 (1992).