A Multi-Band Forced-Photometry Catalog in the ELAIS-S1 Field
Abstract
The ELAIS-S1 field will be an LSST Deep Drilling field, and it also has extensive multiwavelength coverage. To improve the utility of the existing data, we use The Tractor to perform forced-photometry measurements in this field. We compile data in 16 bands from the DeepDrill, VIDEO, DES, ESIS, and VOICE surveys. Using a priori information from the high-resolution fiducial images in VIDEO, we model the images in other bands and generate a forced-photometry catalog. This technique enables consistency throughout different surveys, deblends sources from low-resolution images, extends photometric measurements to a fainter magnitude regime, and improves photometric-redshift estimates. Our catalog contains over 0.8 million sources covering a area in the VIDEO footprint and is available at10.5281/zenodo.4540178 (catalog 10.5281/zenodo.4540178).
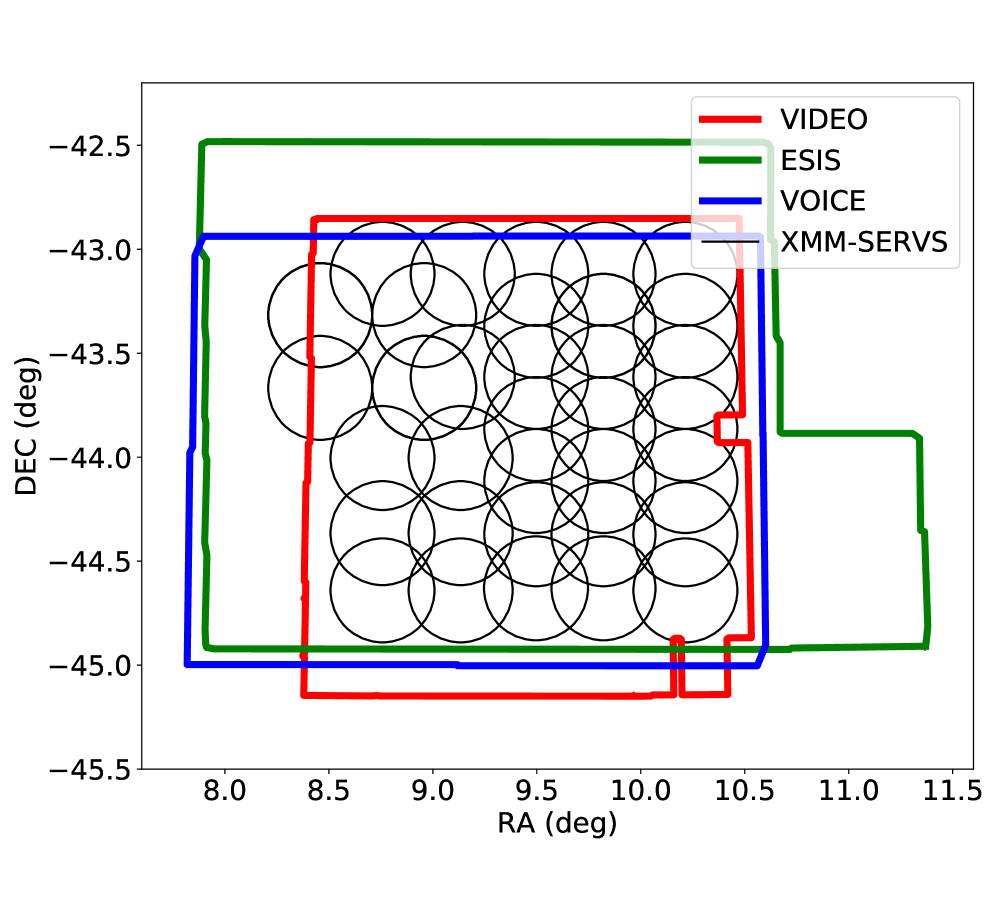
To aid counterpart characterization for the XMM-SERVS survey111http://personal.psu.edu/wnb3/xmmservs/xmmservs.html (Chen et al. 2018; Ni et al., in preparation) and help prepare for the upcoming Deep Drilling Fields (e.g., Brandt et al. 2018) of the Vera C. Rubin Observatory Legacy Survey of Space and Time (LSST), we generate a multi-band photometric catalog in the European Large-Area ISO Survey-S1 (ELAIS-S1) field from the Spitzer DeepDrill (3.6 and ; Lacy et al. 2021)222https://irsa.ipac.caltech.edu/data/SPITZER/DeepDrill/, VIDEO (; Jarvis et al. 2013)333http://horus.roe.ac.uk/vsa/, DES DR2 (; Abbott et al. 2021)444https://des.ncsa.illinois.edu/releases/dr2, ESIS (; Berta et al. 2006; Vaccari et al. 2016)555http://www/mattiavaccari.net/esis/, and VOICE (; Vaccari et al. 2016)666http://www.mattiavaccari.net/voice/ surveys using The Tractor (Lang et al. 2016) forced-photometry approach (see below). The coverages of these surveys are displayed in Fig. 1. Compared to the conventional single-band photometric measurements, this forced-photometry technique can distinguish blended sources in low-resolution surveys (e.g., DeepDrill) and enables much more reliable photometric-redshift measurements (e.g., Lang et al. 2014; Nyland et al. 2017; Wold et al. 2019).
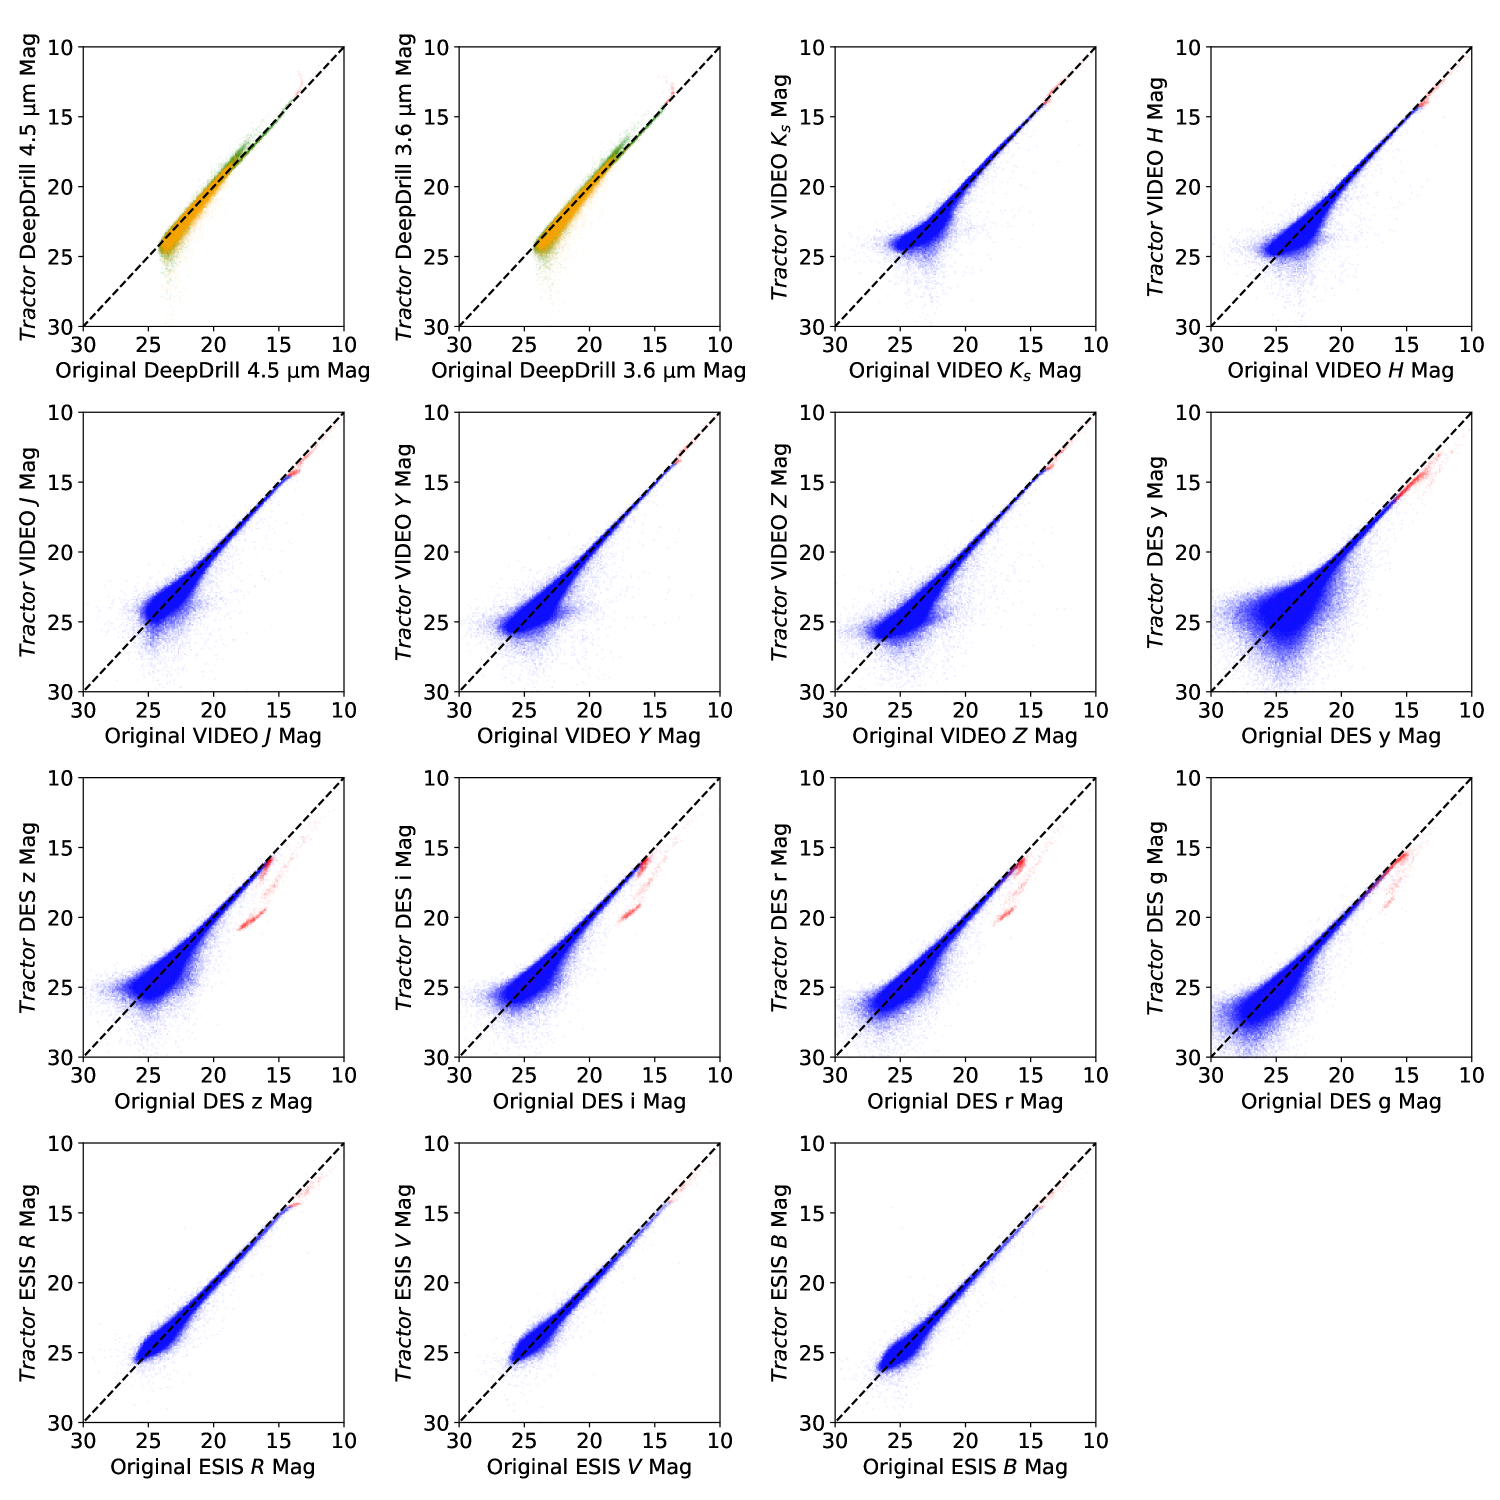
We follow the same approach to make The Tractor photometric measurements as Nyland et al. (2017) for VIDEO-detected sources in the full VIDEO area. We only briefly outline the procedures here, and interested readers can refer to Nyland et al. (2017) for more details. For each source, we adopt the band with the longest wavelength among the VIDEO bands in which the source is detected as the fiducial band and then obtain the source position and intrinsic surface-brightness profile (point-like, deVaucouleurs, or exponential profile) from the corresponding VIDEO catalog and image. We fix this prior position and intrinsic surface-brightness profile, only allowing the fluxes to vary, and fit the images in other bands, where the intrinsic profile is convolved with the corresponding PSFs to match the observed profiles. This procedure returns forced photometry. The photometric errors are derived using the equations in the Appendix of Nyland et al. (2017). The astrometric errors and image offsets of our data are smaller than the sizes of single pixels (), and thus do not considerably downgrade our photometric accuracy (Nyland et al. 2017). We flag possibly saturated sources as those with magnitudes smaller than 13.5 (), 14.0 (), 14.0 (), 14.2 (), 14.5 (), 13.6 (), 14.0 (), 14.5 (), 14.2 (), and 14.6 (). These thresholds are similar to those in Nyland et al. (2017). After comparing The Tractor photometry and original photometry for DES, we find that there are some significant outliers. These outliers are not a result of The Tractor fitting; instead, their original DES - or -band magnitudes also show significant deviations compared to their original VIDEO - or -band magnitudes, indicating that their DES images may be problematic (e.g., saturated), and thus these sources are flagged.777See, e.g., part 3 in https://herschel-vos.phys.sussex.ac.uk/vo-data/dmu6/dmu6_v_ELAIS-S1/help_elais-s1_checks.html, and we follow the same approach to define outliers.
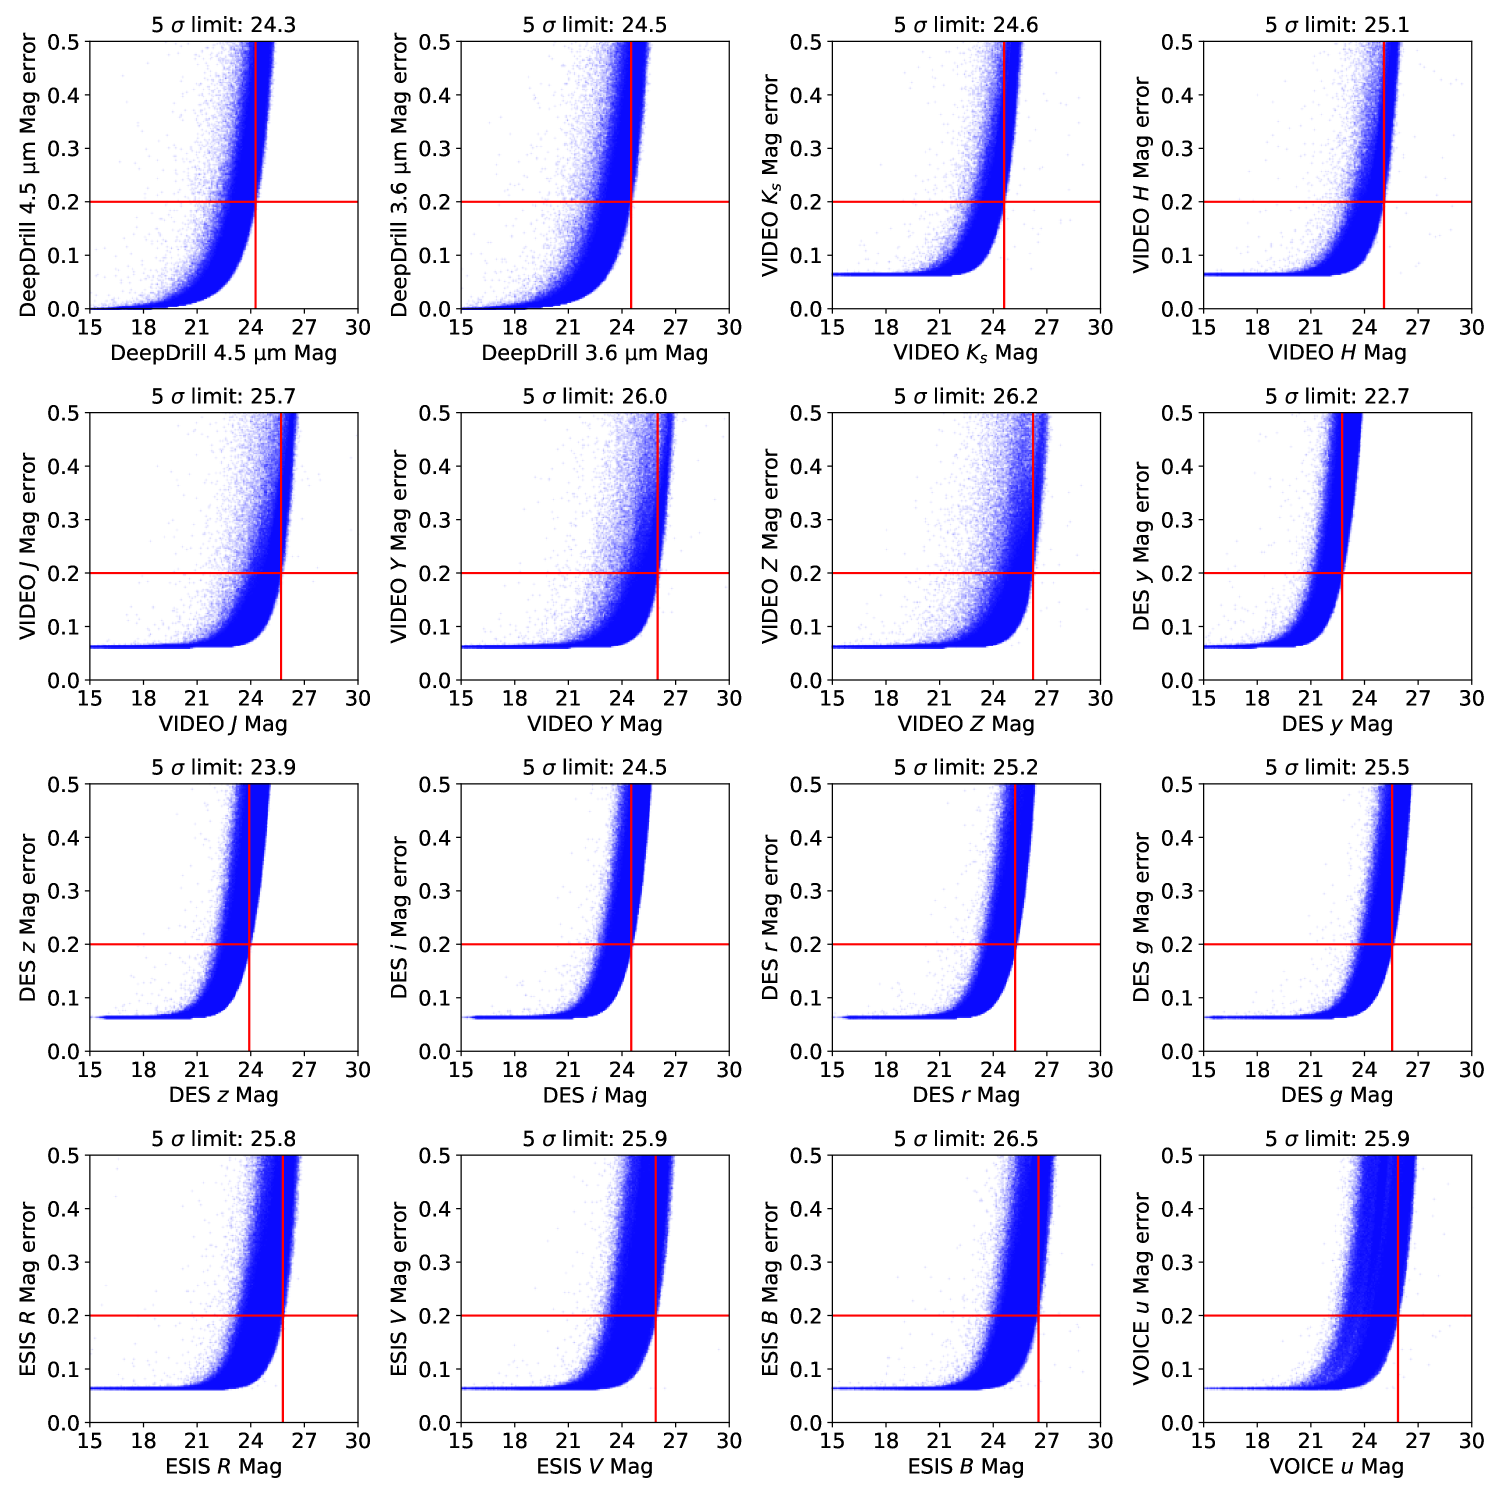
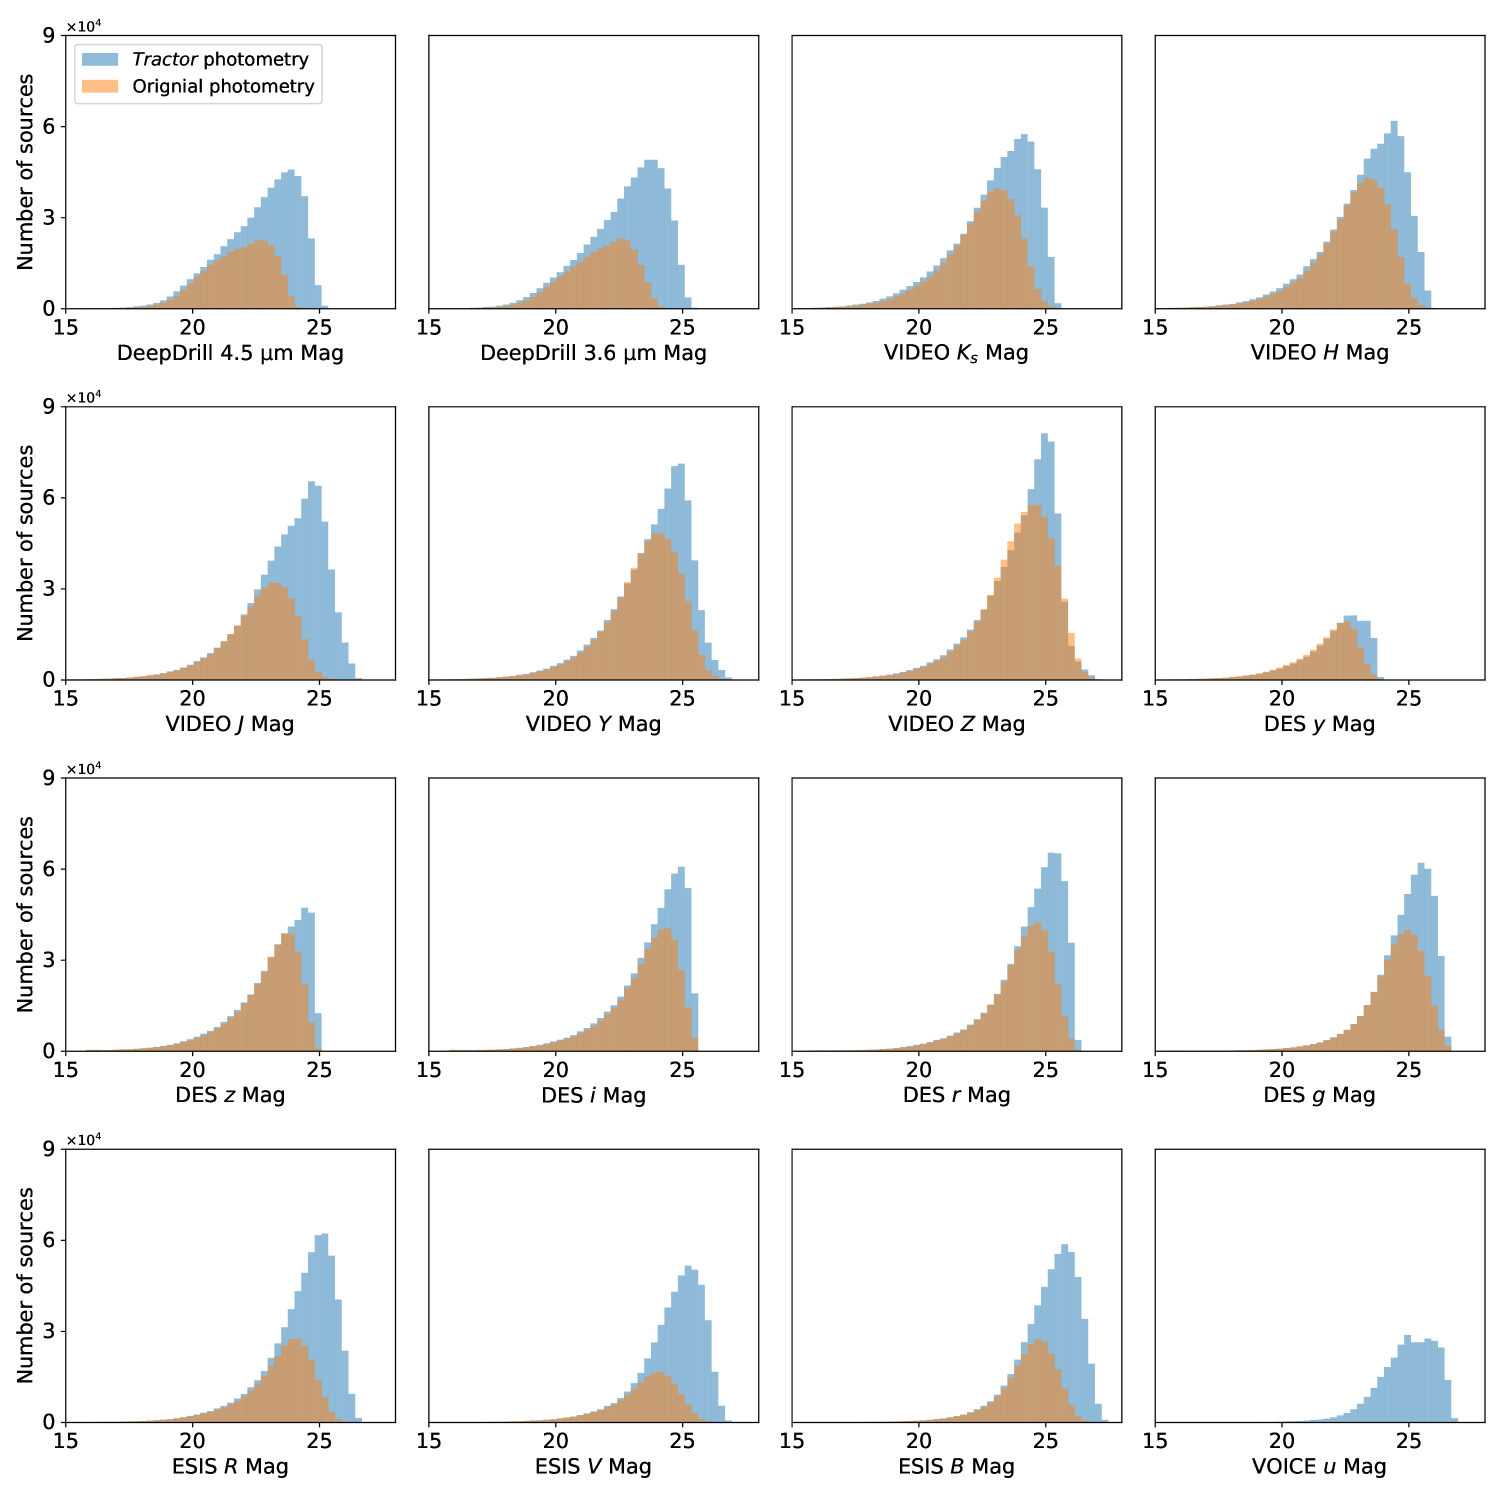
We release our catalog online.888https://doi.org/10.5281/zenodo.4540178 It contains fiducial bands, intrinsic surface-brightness profile, AB magnitudes, magnitude errors, flags, reduced values, and nearest-neighbor angular separations. The separations can be used as a basic indication for possible blending issues in DeepDrill images. A “readme.txt” file along with the catalog provides detailed explanations of the catalog columns. Our released data also include several diagnostic figures to characterize the reliability of our catalog: Fig. S1 compares the forced photometry and the original photometry, with flagged sources displayed explicitly. Fig. S2 plots The Tractor magnitude errors versus magnitudes for all sources, based on which the nominal magnitude limits are estimated. The limits are estimated to be 24.3 (), 24.5 (), 24.6 (), 25.1 (), 25.7 (), 26.0 (), 26.2 (), 22.7 (), 23.9 (), 24.5 (), 25.2 (), 25.5 (), 25.8 (), 25.9 (), 26.5 (), and 25.9 (). Fig. S3 displays the magnitude distributions for both the original catalogs and our catalog after applying a cut and demonstrates that we are able to place photometric constraints on a considerable number of faint sources not formally detected in single-band images.
Our catalog greatly improves the photometric-redshift () results, which was a primary motivation for our work. We use EAZY (Brammer et al. 2008) to estimate , following an iterative method of magnitude zero-point correction (Yang et al. 2014), and then compare values and spectroscopic redshifts () for sources with measurements (typically with magnitudes ), where the compilation is described in Ni et al. (in preparation). Using publicly available SERVS, VIDEO, and DES cross-matched catalogs, the normalized median absolute deviation () and the outlier fraction (; defined as ) are 0.071 and 17.4%, respectively. After utilizing our catalog, the values drop to and . Interested readers can refer to Ni et al. (in preparation) for more details on the measurements as well as the official release of the corresponding catalog.
The forced-photometry catalogs in the other parts of XMM-SERVS are or will be publicly available as well; see Nyland et al. (2017) and Nyland et al. (in preparation).
Acknowledgements. We acknowledge support from NASA grant 80NSSC19K0961. Basic research in radio astronomy at the U.S. Naval Research Laboratory is supported by 6.1 Base Funding. FEB acknowledges support from ANID-Chile Basal AFB-170002, FONDECYT Regular 1200495 and 1190818, and Millennium Science Initiative – ICN12_009. MV acknowledges support from the Italian Ministry of Foreign Affairs and International Cooperation (MAECI Grant Number ZA18GR02) and the South African Department of Science and Technology’s National Research Foundation (DST-NRF Grant Number 113121) as part of the ISARP RADIOSKY2020 Joint Research Scheme.
References
- Abbott et al. (2021) Abbott, T. M. C., Adamow, M., Aguena, M., et al. 2021, arXiv e-prints, arXiv:2101.05765
- Berta et al. (2006) Berta, S., Rubele, S., Franceschini, A., et al. 2006, A&A, 451, 881
- Brammer et al. (2008) Brammer, G. B., van Dokkum, P. G., & Coppi, P. 2008, ApJ, 686, 1503
- Brandt et al. (2018) Brandt, W. N., Ni, Q., Yang, G., et al. 2018, arXiv e-prints, arXiv:1811.06542
- Chen et al. (2018) Chen, C.-T. J., Brandt, W. N., Luo, B., et al. 2018, MNRAS, 478, 2132
- Jarvis et al. (2013) Jarvis, M. J., Bonfield, D. G., Bruce, V. A., et al. 2013, MNRAS, 428, 1281
- Lacy et al. (2021) Lacy, M., Surace, J. A., Farrah, D., et al. 2021, MNRAS, 501, 892
- Lang et al. (2016) Lang, D., Hogg, D. W., & Mykytyn, D. 2016, The Tractor: Probabilistic astronomical source detection and measurement
- Lang et al. (2014) Lang, D., Hogg, D. W., & Schlegel, D. J. 2014, arXiv e-prints, arXiv:1410.7397
- Mauduit et al. (2012) Mauduit, J. C., Lacy, M., Farrah, D., et al. 2012, PASP, 124, 714
- Nyland et al. (2017) Nyland, K., Lacy, M., Sajina, A., et al. 2017, ApJS, 230, 9
- Vaccari et al. (2016) Vaccari, M., Covone, G., Radovich, M., et al. 2016, in The 4th Annual Conference on High Energy Astrophysics in Southern Africa (HEASA 2016), 26
- Wold et al. (2019) Wold, I. G. B., Kawinwanichakij, L., Stevans, M. L., et al. 2019, ApJS, 240, 5
- Yang et al. (2014) Yang, G., Xue, Y. Q., Luo, B., et al. 2014, ApJS, 215, 27
Here are some supplementary notes:
-
•
Fig. S1. The slightly tilted trends in the DeepDrill panels may be due to calibration differences for extended sources and also exist in other work (e.g., Nyland et al. 2017). The small “antenna-shaped” structures in the VIDEO panels, where the original magnitudes are higher than The Tractor magnitudes for some faint sources, are mainly composed of sources around bright stars, and we attribute much of these source fluxes to the backgrounds contributed by the adjacent stars. The degree to which the plots appeal to “funnel” out in the faint regime depends on the detection significance thresholds of the original catalogs as well as the total number of plotted sources (or the plotting settings). For example, the original ESIS catalog has a relatively higher threshold and fewer sources, and thus the noise of the ESIS panels is less.
-
•
DES DR2 outliers. DES outliers are selected by comparing VIDEO and DES magnitudes (see Footnote 7). Fig. S1 further shows that The Tractor magnitudes of these outliers also deviate from the corresponding DES magnitudes in all the DES bands, and thus we suggest applying the DES outlier flags to all the DES bands. Although many of these outliers present clearly saturated images (i.e., with trapezoidal brightness profiles), the others do not show abnormal images. The actual causes for these outliers, however, are still unclear.