UniverseMachine: Predicting Galaxy Star Formation over Seven Decades of Halo Mass with Zoom-in Simulations
Abstract
We apply the empirical galaxy–halo connection model UniverseMachine to dark matter-only zoom-in simulations of isolated Milky Way (MW)–mass halos along with their parent cosmological simulations. This application extends UniverseMachine predictions into the ultra-faint dwarf galaxy regime () and yields a well-resolved stellar mass–halo mass (SMHM) relation over the peak halo mass range to . The extensive dynamic range provided by the zoom-in simulations allows us to assess specific aspects of dwarf galaxy evolution predicted by UniverseMachine. In particular, although UniverseMachine is not constrained for dwarf galaxies with , our predicted SMHM relation is consistent with that inferred for MW satellite galaxies at using abundance matching. However, UniverseMachine predicts that nearly all galaxies are actively star forming below and that these systems typically form more than half of their stars at , which is discrepant with the star formation histories of Local Group dwarf galaxies that favor early quenching. This indicates that the current UniverseMachine model does not fully capture galaxy quenching physics at the low-mass end. We highlight specific improvements necessary to incorporate environmental and reionization-driven quenching for dwarf galaxies, and provide a new tool to connect dark matter accretion to star formation over the full dynamic range that hosts galaxies.
1 Introduction
Hierarchical structure formation via cold-dark-matter (CDM) collapse in a flat-CDM cosmology model (White & Rees, 1978; Blumenthal et al., 1984; Lahav et al., 1991; Cole et al., 1994) has become the standard paradigm for galaxy formation over the past few decades. Dwarf galaxies, which are tracers of the small-scale structures of CDM (with peak halo mass ), have shown diverse and initially surprising features in observations compared to the predictions from cold-dark-matter (CDM) theory and numerical simulations (see Bullock & Boylan-Kolchin 2017 for a review). It is crucial to understand the detailed formation mechanisms of dwarf galaxies, as well as the evolution of dwarf galaxies and the (sub)halos in which they form. This understanding could have a profound impact on our ability to test galaxy formation and the flat-CDM paradigm by fully harnessing observations across the full range of galaxy mass scales. Key features of dwarf galaxies such as star formation histories (Mateo, 1998; Gallazzi et al., 2005; Tolstoy et al., 2009; Geha et al., 2012; Weisz et al., 2014a, b, 2015) and quenched (not-star-forming) fractions as a function of stellar mass (McConnachie, 2012; Karachentsev & Kaisina, 2013; Fillingham et al., 2016; Mao et al., 2021) have been studied extensively in observations.
To connect the observed properties of galaxies to the dark matter (sub)halos in which they reside, two approaches of modeling the galaxy–halo connection have been widely adopted: (i) models that are motivated by the underlying physics related to galaxy formation and gravity governing both dark matter and baryons (gas and stars), such as hydrodynamic simulations (see Vogelsberger et al. 2020 for a review) and semi-analytic models (SAMs; see Henriques et al. 2015; Yates et al. 2020; Jiang et al. 2021 for some recent examples), or (ii) models that are motivated by empirical relations between galaxies and dark matter halos such as subhalo abundance matching and halo occupation distribution methods (see Somerville & Davé 2015; Wechsler & Tinker 2018 for reviews). Although these classes of models have each been effective for studying many aspects of galaxy–halo connection modeling, they possess different limitations when applied to the low-mass end of the observable galaxy population. The former approach relies on the assumed underlying physical subgrid or semi-analytic models for baryons, that require high resolution (and thus demanding computational resources to resolve dwarf galaxies in cosmological volumes), and that are less easily adaptable to be improved by observational constraints. The latter approach is more flexible due to its statistical description and thus can more easily adapt to new measurements, but makes strong assumptions on the number and density of central and satellite galaxies in connection to their host (sub)halos. All approaches can require calibration of systematics such as orphan galaxies (e.g., Springel et al., 2005b; Pujol et al., 2017; Nadler et al., 2019), although the numerical aspects of this are different for the different modeling types.
The empirical forward modeling approach (e.g.,, Behroozi et al. 2013a; Moster et al. 2013; Rodríguez-Puebla et al. 2017; Moster et al. 2018; Behroozi et al. 2019) has inherited some merits from both branches above (we refer to this approach as an ‘empirical model’ in the rest of the paper). Current empirical models paint the star formation rates (SFRs) of galaxies onto dark matter halos in -body simulations using flexible mathematical formulae. These have the advantage of requiring fewer assumptions about the underlying galaxy formation processes than do hydrodynamic simulations and semi-analytic models. They are also more flexible in connecting galaxy and halo properties than standard abundance matching and halo occupation distribution models.
In this work, we use the empirical model UniverseMachine (Behroozi et al. 2019, B19 hereafter) to study the galaxy–halo connection in the low-mass dwarf galaxy regime. The model parameterizes the distribution of galaxies’ SFRs as a function of halo mass (maximum circular velocity ), halo accretion rate (change in over time), and redshift. The SFRs of galaxies are drawn randomly from these distributions and then painted onto halos. This process is conducted self-consistently to match a comprehensive set of observational constraints at the intermediate- to high-mass end: stellar mass functions (stellar mass , redshift ), galaxy quenched fractions (, ), the cosmic star formation history (), specific SFRs (SFR per unit stellar mass, , ), UV luminosity functions (, ), and galaxy clustering information from auto- and cross- correlations of different galaxy populations (, redshift ) (see Section 3 and Appendix C in B19 for more details), among others. The model also accounts for short-timescale SFR variations, stellar population mass loss, galaxy mergers, evolution of the intra-cluster-light (ICL) stellar population, orphan galaxies due to subhalo disruption, dust and metallicity, and observational systematics.
The UniverseMachine Data Release 1 (UM DR1) was calibrated using the cosmological simulation Bolshoi-Planck (Klypin et al., 2016; Rodríguez-Puebla et al., 2016) with the above-mentioned set of observational data with stellar masses (corresponding to peak halo masses ). The dark matter resolution of for the Bolshoi–Planck simulation is not ideal for studying the dwarf galaxy regime ( and ). The UniverseMachine can be run on higher-resolution large-volume cosmological simulations, as was done in Behroozi et al. (2020) to predict observables for the JWST, but this approach cannot gain much resolution without an equivalent sacrifice in volume and sample statistics.
We take an exploratory approach in this work, that extrapolates the UniverseMachine model into the dwarf galaxy regime by applying it to zoom-in simulations of MW-sized halos (). These simulations resolve subhalos down to , corresponding to the halos that host the smallest known galaxies, ultra-faint dwarf galaxies with stellar masses as low as . By qualitatively comparing the extrapolated UniverseMachine predictions to observational constraints, we can identify specific limitations—especially pertaining to quenching physics—that the DR1 model failed to capture. Thus, we provide a framework for exploring the impact of reionization and environmental quenching mechanisms on dwarf galaxies in the context of a dark matter accretion-based model for galaxy assembly.
Since UniverseMachine is currently constrained only at the intermediate- to high-mass end, quenching mechanisms for dwarf galaxies are not explicitly included in the DR1 version of the model. In particular, the model assumption that correlates galaxy star formation rate with halo accretion rate may break down at the epoch of reionization; in this epoch, photo-ionization in dwarfs with likely prevents gas from cooling (Thoul & Weinberg, 1996; Bullock et al., 2000; Benson et al., 2002; Alvarez et al., 2012; Brown et al., 2014). It is also important to investigate if the current modeling of environmental quenching primarily through parameterized galaxy quenched fractions constrained at high stellar masses is sufficient to capture galaxy evolution in the dwarf regime. Recent and ongoing observations of dwarf galaxies in the low-redshift Universe (e.g., from the SAGA Survey, Geha et al. 2017; Mao et al. 2021, and satellites in the Local Volume Carlsten et al. 2021, 2020a; Davis et al. 2021) as well as near the Milky Way (MW) (e.g., from the Dark Energy Survey Drlica-Wagner et al. 2015, 2020; Nadler et al. 2020a), along with upcoming observations that will extend such observations in both the local and distant universe (e.g., from campaigns including the Vera C. Rubin Observatory, JWST, and the Nancy Grace Roman Space Telescope), promise to deliver tighter observational constraints on the model assumptions regarding dwarf galaxy evolution.
This paper is organized as follows: in Section 2, we introduce the dark matter simulations underlying this work. We describe our method for applying UniverseMachine to zoom-in and cosmological simulations in Section 3, and describe the halo mass functions, stellar mass–halo mass relations, and matched evolution histories of systems in both resolution levels. In Section 4, we study the low-mass end of the stellar mass–halo mass relation, its redshift evolution, the star formation histories matched across our simulation resolution levels, and the predicted quenched fractions for central and satellite galaxies. We discuss future modeling directions in Section 5 and we summarize our main findings and discuss the outlook for empirically modeling the low-mass end of the galaxy–halo connection in Section 6.
2 Simulations
2.1 The Chinchilla suite
We begin by introducing the dark matter-only simulations on which we base our UniverseMachine analyses. The Chinchilla simulation suite is a set of dark-matter-only -body simulations run with the L-Gadget code (an -body only variation of the Gadget-2 code, Springel 2005) under a flat CDM cosmology with parameters (), , , , and . Dark matter halos are identified using the phase-space halo finder Rockstar (Behroozi et al., 2013b) with a virial overdensity threshold of at , while merger trees are constructed using Consistent-Trees (Behroozi et al., 2013c). Halos contained within the virial radius of a more massive nearby halo are defined as subhalos, other halos are defined as host halos.
Here we use only the two smallest cosmological boxes in the suite, first introduced in Mao et al. 2015. These boxes both have a side length of 125 with periodic boundary conditions. The higher resolution box has resolution elements with dark matter particle mass of (denoted as c125-2048 hereafter), and a softening length of (Plummer-equivalent force softening scale). The lower resolution box has resolution elements with particle masses of (denoted as c125-1024 hereafter), and a softening length of . The boxes are initialized with the same set of initial conditions generated using 2LPTic (Crocce et al., 2006) implementing the matter power spectrum from camb111https://camb.info/, although c125-2048 starts at , while c125-1024 starts at . Their halo catalogs and merger trees both start from a scale factor of () with 100 snapshots down to ().
2.2 The MW zoom-ins
The 45 MW-size halos chosen for the zoom-in re-simulations were isolated hosts selected from the parent box c125-1024, with host halo masses in the range of (Mao et al., 2015). This mass range is consistent with the latest halo mass constraints of the MW inferred from the proper motion of Globular Clusters in Gaia DR2 ( from Posti & Helmi 2019, from Watkins et al. 2019). The initial conditions for each individual zoom-in halo are then generated with Music (Hahn & Abel, 2011) to achieve the equivalent resolution of elements in an initial (at ) Lagrangian region of centered on the MW host, while matching to the parent box on large scales. The high resolution particles in the zoom-in region have masses of and softening lengths of .
The halo catalogs and merger trees for the zoom-ins begin at () with 236 snapshots down to (). At , roughly of the total mass within of each MW host halo consists of high-resolution particles. Thus, the zoom-in simulations provide well-resolved subhalos in their infalling, splashback, accreted, and disrupted evolution phases far beyond the MW virial radius ( kpc). We summarize the key properties of our 45 MW zoom-in simulations and their two parent boxes in Table 1.
| Simulation | Box size [] | Resolution elements | Particle mass [] | Softening scale [] |
|---|---|---|---|---|
| Zoom-ins | - | () | 0.17 | |
| c125-2048 | 125 | 0.50 | ||
| c125-1024 | 125 | 1.00 |
3 Methods and Validation
We now overview the fundamental aspects of the empirical galaxy–halo connection model UniverseMachine (Section 3.1). We present the halo mass function and the UniverseMachine-predicted stellar mass–halo mass (SMHM) relation across the three simulation resolutions in Section 2, highlighting our procedure for applying UniverseMachine to zoom-in simulations (Section 3.2). We study the dark matter halo evolution and predicted star formation histories of matched objects in the zoom-in re-simulations and their parent boxes (Section 3.3).
3.1 UniverseMachine Model
UniverseMachine222https://bitbucket.org/pbehroozi/universemachine (B19) is an empirical galaxy–halo connection model that self-consistently predicts the star formation rates (SFRs) of galaxies inside dark matter halos given the halo mass (parameterized by the maximum circular velocity ), assembly history (parameterized by halo formation time and dark matter accretion rate), and redshift. It is empirical in the sense that the probability distribution of galaxy SFR as a function of halo properties and evolution is informed by observational constraints as opposed to assumptions about galaxy physics (Wechsler & Tinker, 2018).
The model starts by choosing a point from the parameter space of redshift-dependent analytic relations between SFR and the quenched galaxy fraction versus halo . This leads to a probability distribution of SFR at each set of fixed and redshift values. The model then integrates the assigned SFRs of the different halos from high redshift down to along the halo merger trees to obtain the full stellar mass evolution history. Afterwards, intrinsic observables of the baryonic properties corresponding to the halo population including the stellar mass functions, galaxy quenched fractions, cosmic star formation history, and galaxy auto- and cross- correlations as a function of redshift are constructed from the SFR and stellar mass histories. Corrections to these intrinsic observables are applied to mimic observational biases and uncertainties. The corrected observable values are compared to observations to obtain a likelihood for the parameters governing the analytic SFR() and relations, which are then sampled in a Monte Carlo Markov Chain (MCMC) framework to derive the posterior distribution over the UniverseMachine model parameters.
Here we implement the ‘best-fit’ UM DR1 model from B19, using the set of 44 parameters that maximize the likelihood including the SFR() and relations, cosmic star formation history, specific star formation rate as a function of stellar mass, galaxy auto- and cross- correlations given the constraints of observed SFR distributions in halos. The assumed cosmic baryon fraction is . We emphasize that the UM DR1 model was calibrated using the Bolshoi-Planck simulation (Klypin et al., 2016; Rodríguez-Puebla et al., 2016) which has a particle resolution of (box size of 250 Mpc and particles). Thus, the majority of the predicted stellar mass function and quenched fraction constraints were derived in the stellar mass range of (corresponding to a peak halo mass range of ), while the galaxy auto- and cross- correlation constraints were largely in the range (corresponding to ).
A major aim of this work is therefore to apply the UM DR1 model to zoom-in re-simulations in a mass range that was unresolved and unconstrained in B19. We refer the reader to Section 3 and Appendix C of B19 for a detailed description of the UniverseMachine model, observational constraints, systematics, and uncertainties. In the following, unless stated explicitly to be the intrinsic values (e.g., in Fig. 3 and Fig. 5), we use the corrected observable values of the UniverseMachine output SFR and . Because the parent boxes and the zoom-ins cover a vast dynamic range in mass resolution, we set the thresholds for orphans (subhalos above which are resolved and traced for their orphan galaxy after disruption) 333The fiducial UniverseMachine orphan model and mass-loss prescription is described in B19 and is similar to the model in Jiang & van den Bosch (2016). to , , and for the joint 45 zoom-ins, c125-2048, and c125-1024, respectively, following the resolution cuts defined in Appendix B.
3.2 Applying UniverseMachine to Zoom-ins and Chinchilla
We present the halo mass function and the SMHM relation derived from applying the UM DR1 model to 45 MW zoom-ins and their Chinchilla parent boxes. We also discuss challenges involved in applying UniverseMachine to zoom-in simulations and the steps taken to overcome them.
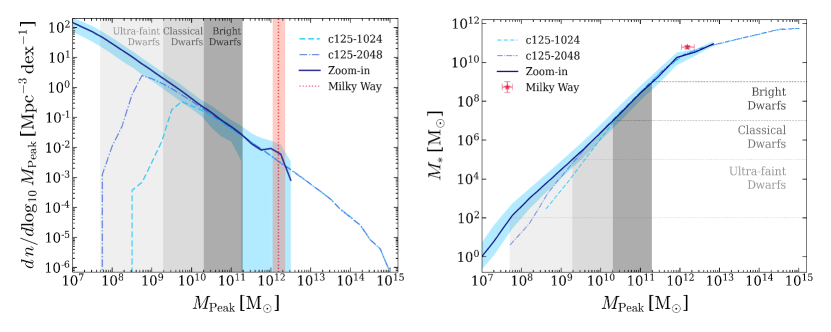
The left panel of Fig. 1 shows the halo mass functions of the three simulation resolutions. We follow previous works (e.g., Behroozi et al. 2013a; Garrison-Kimmel et al. 2014) by using peak halo mass, the maximum value of the halo virial mass along the main progenitor branch in its merger tree, for all halo masses. The peak halo mass does not depend on subhalo mass loss due to tidal stripping after infall and correlates better with stellar mass than present-day virial mass (e.g., Behroozi et al. 2013a; Moster et al. 2013; Reddick et al. 2013). The joint zoom-in halo number density is calculated as the average number density in the 45 zoom-in regions set by the zoom-in region volume factors in the initial Lagrangian spaces. We note that our 45 zoom-in MW halos are isolated and they tend to live in slightly underdense environments, with the average matter density (measured within a sphere with radius of centered on the host halo) the mean matter density of the parent cosmological boxes.
The three resolution boxes show overall consistent halo mass functions in the peak halo mass range of [, ], and the two cosmological boxes extend all the way up to the cluster mass scale of (with their Lagrangian volumes same as their box sizes). At the low-mass end, the joint mass function of the 45 MW zoom-in re-simulations extends the dynamic range of our joint halo mass function far below , where both cosmological boxes are poorly resolved. The zoom-ins cut off right above the MW halo mass of a few times , and the hump at that mass reflects the selection of MW-sized host halos in the zoom-in regions. An estimate of the MW halo mass derived from Gaia data (Watkins et al., 2019), which is consistent with other recent MW halo mass constraints, is shown for comparison.
In the right panel of Fig. 1, we show the SMHM relations for the three simulation resolutions with the UM DR1 model applied to each box. The median SMHM relations coincide well (for both the normalization and slope) in the halo mass range [, ], where the halo mass functions are also converged. The most striking feature of the SMHM relation at the low-mass end is that all three resolutions follow a power-law relation with the same slope that extends from the knee of the relation at around down to the resolution limit of each simulation. This suggests that the SMHM relation in the zoom-ins is an extrapolation of the SMHM relation in the UM DR1 model, which is constrained down to . We discuss the implications of our predicted SMHM relation in Section 4. We also quote and show the observational value of the MW stellar mass (Licquia & Newman, 2015) along with the three dwarf galaxy regimes as defined in Bullock & Boylan-Kolchin (2017) for comparison. This work defines bright dwarfs as galaxies with stellar mass in the range of , classical dwarfs with stellar masses of , and ultra-faint dwarfs with stellar masses of . We convert the stellar masses in these three regimes back to the peak halo mass intervals using the median SMHM relation in the joint zoom-ins, and show them as the shaded regions in the left panel of Fig. 1. The MW zoom-ins provide sufficient resolution to model the smallest-known galaxies, down to the lower mass limit of the ultra-faint dwarfs (UFDs), a regime that is crucial for studies of galaxy formation (Willman, 2010; McConnachie, 2012; Bechtol et al., 2015) and dark matter microphysics (Nadler et al., 2020b).
Applying the UniverseMachine model to zoom-in simulations is non-trivial for several technical reasons. In particular, individual zoom-in realizations of single host halos lead to poor sampling of the halo mass function at halo masses around the MW host, and also provide only a few realizations of the most massive subhalos. This renders the UniverseMachine’s ranking algorithm, which assigns higher SFR to halos with higher accretion rates (, the change in over one dynamical timescale) based on the full span of accretion rates at fixed halo mass, more susceptible to stochasticity, leading to biased rank predictions. We illustrate in Appendix A how we overcome this by joining 45 MW zoom-ins together to achieve a halo distribution that is largely consistent with the parent cosmological boxes. In summary, we implement two important changes when applying UniverseMachine to zoom-in simulations as opposed to cosmological boxes444Detailed steps can be found in the ‘Running on Different Simulations’ section on: https://bitbucket.org/pbehroozi/universemachine/src/main/. The two changes mentioned in the text are made in step 1 and step 4.:
-
1.
We join the Rockstar halo catalogs together for a large sample of zoom-in boxes at every simulation snapshot, such that each distinct (sub)halo is included exactly once in the joint halo catalog. In our case, this is equivalent to packing all 45 MW zoom-in halos together into one cosmological box with the same size as their parent boxes.
-
2.
UniverseMachine performs halo ranking with a spline interpolation step. We carry out this step with the joint halo catalog. Ranks produced in this manner will be more accurate due to the more comprehensive sampling of the halo mass function, especially at the high-mass end.
In this way, we join a large number of zoom-in simulations to self-consistently extend UniverseMachine predictions into the ultra-faint dwarf galaxy regime. We note that the rank distributions, described in Appendix A and shown in Fig. A.1, are approximately self-similar when expressed in terms of particle number. Thus, step 1 could potentially be circumvented by scaling a given rank distribution to match those shown in Fig. A.1. This analytic procedure would yield approximate, unbiased ranks for halos in higher-resolution simulations and is useful for simulation suites that do not include a substantial number of high-resolution simulations.
3.3 Validation: Matched Subhalo Evolution
In the previous subsection, we showed that the halo mass function and the SMHM relation are consistent across the zoom-in and cosmological boxes. Since our three different resolution simulations share the same initial conditions, we now illustrate UniverseMachine predictions in detail by studying the dark matter growth and star formation histories of matched (sub)halos across the three boxes.
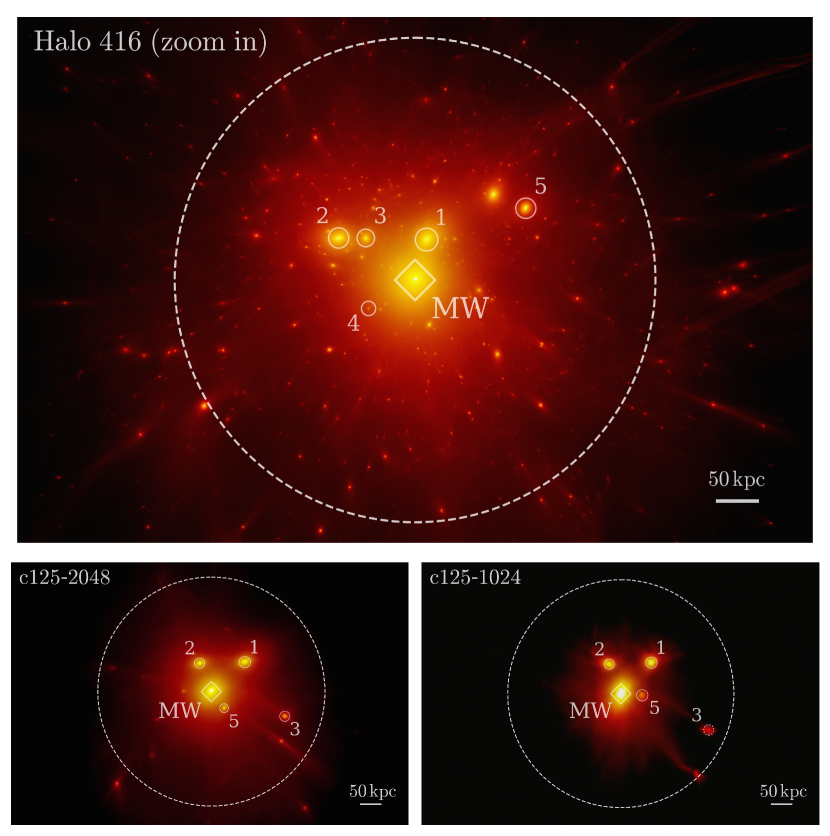
Fig. 2 shows the projected dark matter density maps for the zoom-in MW halo No. 416 and its matched counterparts in the two parent boxes.555This is one of the MW-like halos that includes a realistic Large Magellanic Cloud (LMC) analog system, and was used in Nadler et al. (2020a) to fit the observed MW satellite galaxy population. The images were made assuming the MW host halo center at an angular diameter distance of 1.75 from the observer, and the vertical aperture of the images is . The images were created using the state-of-the-art multi-transparent-layer phase-space tessellation method described in Kaehler (2017, 2018).
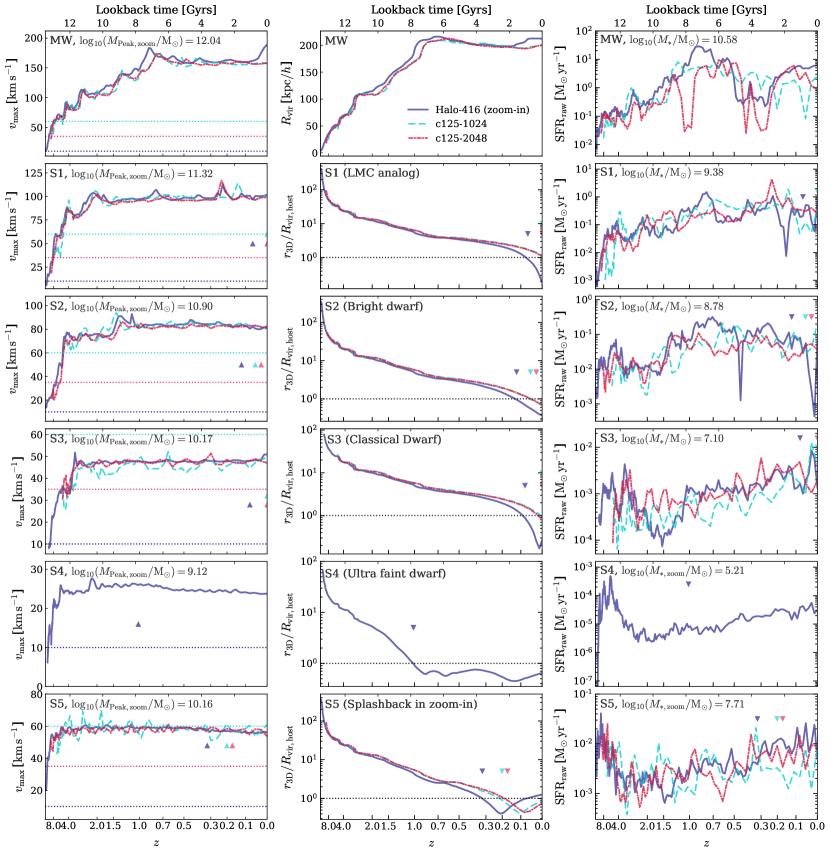
To demonstrate the consistency in the evolution history of individual (sub)halos, we select five different subhalos in the zoom-in simulation along with the MW host halo and match them to corresponding low-resolution counterparts in the parent boxes. Particularly, our selection of (sub)halos in the zoom-in consists of the MW host halo with , while our subhalos (numbered 1 to 5) have peak halo masses , respectively. Our choice of the subhalos cover a variety of different dwarf galaxy regimes: Subhalo 1 is an LMC analog (Nadler et al., 2020a), Subhalo 2 is another bright dwarf, Subhalo 3 is a bound (within of the MW host) classical dwarf dimmer than the LMC, Subhalo 4 is an ultra-faint dwarf (UFD) with no counterparts in the parent boxes, and Subhalo 5 is a splashback classical dwarf (i.e., a system previously inside but currently outside of the MW , which appears to be inside in projection). Since we selected these subhalos based on their values and classified them using the halo mass range in the left panel of Fig. 1, their stellar masses as labeled in the right column of Fig. 3 do not strictly follow the definition in Bullock & Boylan-Kolchin (2017) due to scatter in the SMHM relation. Seen in the dark matter density maps in Fig. 2, the locations of the matched subhalos in the projected dark matter density maps agree well in the two parent boxes, but are noticeably different in the zoom-in, which could be explained by the differences in the orbital phases of subhalos across different resolutions as discussed below.
In Fig. 3, we present the evolution history of the six individual (sub)halos selected in the zoom-in along with their matched counterparts in the two parent boxes. The left column shows the evolution of (a halo mass proxy free from pseudo-evolution due to cosmic expansion; e.g., Conroy et al. 2006; Diemer et al. 2013), the middle column shows the evolution of of the MW host and the 3D distance of the subhalos to the host in units of the MW virial radius , and the right column shows the evolution of the intrinsic SFR values (uncorrected for observational effects) given by UniverseMachine. The triangles in the left and right panels with the same color as the evolution curves indicate the infall times (the first crossing of the MW host , shown by the horizontal line in the middle column) of the subhalos in each resolution. The horizontal lines in the left column indicate the resolution limits in that we estimate for the zoom-in (), c125-2048 (), and c125-1024 () boxes based on the analysis in Appendix B.
For the MW host and Subhalos No. 1, 2, 3, and 5, the matched counterparts in the parent boxes have generally consistent evolution features on timescales Gyr. The history of Subhalo 4 (UFD) is well resolved in the zoom-in, but not so in the two parent boxes. Peaks in the evolution curve generally indicate mergers, and this is captured well across the three resolution for the MW host, Subhalo 1, and Subhalo 2. The lower-mass Subhalo 3 (which is unresolved in c125-1024) and 5 (which is marginally resolved in c125-1024) show less correspondence in the short timescale variability of across different resolutions. Since the intrinsic SFR at fixed and redshift is mostly determined by , the SFR history in the right panel also shows short timescale differences (uncorrelated between time steps to model local variations in the ISM) in the three resolutions, while the long-term evolution agrees to first order as a result of the convergence in halo growth (long-term correlation dominated by the evolution).
We note that the growth of the MW host as well as the infall times of the subhalos in the zoom-in are systematically earlier than their counterparts in the parent boxes. The of the MW host in the zoom-in appears to suddenly increase due to the infall of Subhalo 1, which crosses the MW at . Although this could potentially bias the values of the zoom-in subhalos from row two to six, we have checked and confirmed that itself also evolves systematically earlier in the zoom-in. Given that the evolution of objects in c125-2048 is not coherently ahead of their counterparts in c125-1024, the phenomenon of earlier-evolving zoom-in (sub)halos is not a pure resolution effect. Furthermore, it results in changes to the orbital phases and subhalo identity between the zoom-in and cosmological boxes (i.e., Subhalo 1 is within the MW virial radius in the zoom-in but has not accreted in the parent boxes, and Subhalo 5 is a splashback subhalo in the zoom-in but is found within the MW host halo’s virial radius in the parent boxes). Since the UM DR1 model does not explicitly model environmental quenching using tidal or ram-pressure stripping, our results are only minutely affected by this artifact thanks to the agreement in the evolution across the three resolutions. Nevertheless, future improvements of the UM DR1 model and other semi-analytical models of satellite galaxy evolution based on zoom-in simulations would be affected by this evolution systematic. We leave a careful numerical investigation of this issue to future work.
In summary, UniverseMachine applied to the Mao et al. (2015) MW zoom-ins and parent cosmological simulations agree well in different resolutions on a halo-to-halo basis for the halo () and galaxy () growth, with the caveat that host halo growth and subhalo accretion times are systematically earlier in the zoom-ins. This difference does not significantly affect the main results in this work.
4 Results
We now focus on the galaxy properties derived from applying UniverseMachine to zoom-ins, including the predicted SMHM relation and evolution (Section 4.1), star formation histories (Section 4.2), and quenched fraction of galaxies as a function of stellar mass (Section 4.3). We summarize the main takeaways in Section 4.4.
4.1 Stellar Mass–Halo Mass Relation
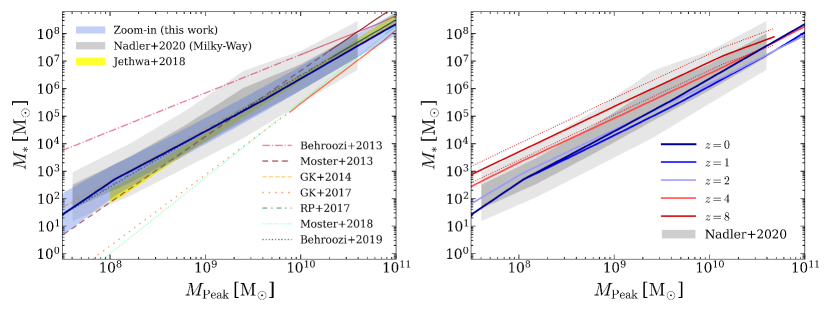
Fig. 4 shows the low-mass end of the SMHM relation obtained by applying UniverseMachine to the 45 MW zoom-in simulations (solid blue line and shaded region), compared to other recent models and inferences of the low-mass SMHM relation. The SMHM relation predicted by running UniverseMachine on our zoom-in simulations is almost an exact power-law extrapolation of the high-mass-constrained UM DR1 model down to the zoom-in halo mass resolution limit ().
The slope and scatter of the SMHM for the UM DR1 model applied to zoom-ins is in excellent agreement with the SMHM relation inferred from state-of-the-art MW satellite observations using the Dark Energy Survey (DES) and Pan-STARRS combined with an abundance matching approach (Nadler et al., 2020a). This agreement might have been expected, given that UniverseMachine is tuned to match the global stellar mass function (down to ), and Nadler et al. (2020a) find that the MW satellite luminosity function is consistent with a power-law extrapolation of the faint end of the GAMA luminosity function (Loveday et al., 2015). However, this agreement does not imply that the UM DR1 model captures all of the relevant physical processes that lead to this SMHM relation in the real Universe. As we discuss in Section 5, the predicted star formation histories (Section 4.2) and quenched fractions (Section 4.3) for dwarf galaxies indicate that the UniverseMachine faint-end SMHM relation evolves too strongly at late times.
We also compare our result for the SMHM relation to the results of several other models, including other abundance matching models (Garrison-Kimmel et al. 2014, 2017, labeled as GK14 and GK17) informed by the Local Group satellite and field galaxy populations, as well as several recent empirical modeling results (Behroozi et al. 2013a; Moster et al. 2013, 2018; Jethwa et al. 2018, and Rodríguez-Puebla et al. 2017 labeled RP). The UniverseMachine SMHM prediction has a shallower slope at the low-mass end compared to models that introduce a large scatter in the faint-end SMHM relation (Garrison-Kimmel et al., 2017). This is encouraging, as recent observational analyses (Carlsten et al., 2020b) find that the steep faint-end SMHM relation of Garrison-Kimmel et al. (2017) tends to under-predict the abundance of bright satellites () in the local universe. The UM DR1 model agrees reasonably well with most of models that are constrained at higher masses and extrapolated down to the dwarf galaxy mass range. Our result has a steeper SMHM relation slope than the Behroozi et al. (2013a) slope extrapolated from higher masses, but is shallower than the Moster et al. (2013, 2018) slopes, which are close to Garrison-Kimmel et al. (2017).
As demonstrated in Section 3.3 (Fig. 3), the dark matter halo assembly history is well resolved for objects in the MW zoom-in simulations up to redshift .666In particular, the values of these halos are always above the resolution floor as defined in Appendix B. Therefore, we can robustly trace the the SMHM relation back in time to visualize its evolution (Fig. 4, right panel). The median SMHM relation ( at fixed ) evolves over an order of magnitude from to for peak halo masses below , and there is a mild trend for the slope to steepen with decreasing redshift. We note that the upper limit on the scatter in galaxy luminosity at fixed halo properties inferred from MW satellite observations (Nadler et al., 2020a) can be used to inform the maximum degree of evolution allowed in the SMHM relation. In Sections 4.4 and 5, we discuss how the SMHM relation evolution is meaningful even though there are limitations in the star formation histories predicted by the UM DR1 model.
At all redshifts we consider, the SMHM relations for the zoom-ins shown here are consistent with direct power-law extrapolations of the high-mass end SMHM relations that result from applying UniverseMachine to the Bolshoi-Planck simulation (B19). This results from the fact that UniverseMachine scales the SFR of star forming galaxies as a double-power-law with , which reduces to a single power-law with respect to at the low-mass end (, ). Naturally, the time integration of the SFR (evaluating ) will preserve a power-law relation of the total stellar mass and the peak halo mass , while the change in the SMHM relation slope reflects the time evolution of the underlying halo growth rate. At fixed (halo mass) and redshift, the scatter in SFR is determined by the instantaneous accretion rate of the halo (), which in turn leads to scatter in the SMHM relation at fixed halo mass.
These results extend the peak halo mass range of the SMHM evolution from in Behroozi et al. (2020) to . As shown in Figure 12 of Behroozi et al. (2020), the trend of decreasing at fixed that we observe from to in the right panel of Fig. 4 begins as early as and is mainly driven by the different evolution rates of halo and galaxy number densities at high redshifts. Upcoming JWST observations will significantly reduce the uncertainties in halo and galaxy number density evolution as early as , providing unprecedented constraints on the amplitude and evolution of the high-redshift SMHM relation. However, the progenitors of systems with present-day absolute UV magnitudes fainter than are not observable at early times, even with JWST (Boylan-Kolchin et al., 2015a). Our framework for predicting galaxy growth at the faint end is therefore crucial for understanding the evolution of these extreme systems and its interplay with the onset, duration, and strength of reionization.
4.2 Star Formation Histories
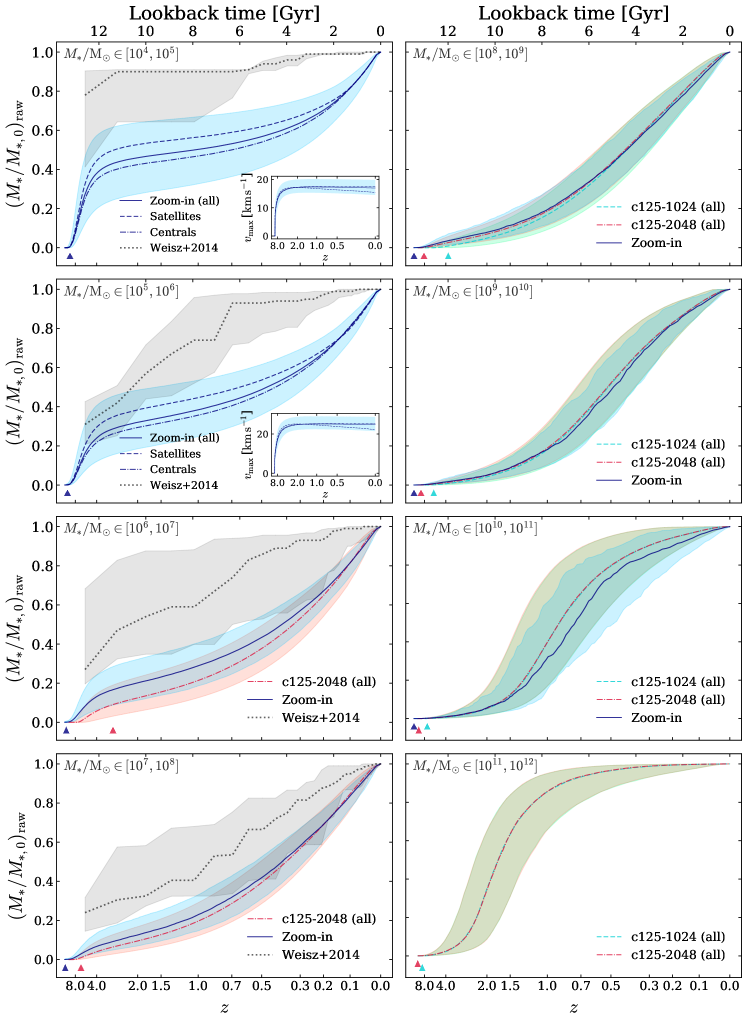
We break down the evolution of the SMHM relation discussed above by studying the star formation histories (SFH) for galaxies of different masses as predicted by UniverseMachine. The cumulative star formation histories (all stars ever formed in the galaxy, not accounting for stellar mass loss, quantified by , the evolution of the galaxy stellar mass in units of their final stellar mass) for galaxies in eight different stellar mass bins are shown in Fig. 5. The galaxies binned based on their stellar mass, and we trace their total stellar mass evolution back along their Consistent-Trees accounting for their full merger history. In the inset panels, we only include galaxies from the simulations with well-resolved low-mass halos or sufficient statistics for high-mass halos. The median and 68% scatter of the SFHs (modeled as all stars ever formed) inferred for dwarf galaxies in the Local Group (Weisz et al., 2014a) are shown in the left column panels for comparison.
The SFH at the three resolution levels agree well in the high-stellar-mass bins for both the median and the scatter (right column). In the bin, the zoom-in galaxies tend to systematically form stars later than their counterparts in the parent boxes. A factor that leads to this difference is that there are no massive MW-mass satellites in the joint 45 MW zoom-ins (prevalent in hosts much more massive than the MW) compared to the parent boxes. We have checked that the consistency between the three resolutions improves in this stellar mass bin if we only include central galaxies from the two parent boxes. Another contribution to this difference might come from our selection of isolated MW-mass halos only, as a recent study using the FIRE simulation found earlier SFH for central galaxies in Local Group-like environments compared to isolated MW halos, due to earlier halo mass accretion in the former (Garrison-Kimmel et al., 2019).
For lower stellar mass galaxies (left column), we compare the joint zoom-in SFHs and the SFHs from the lower resolution c125-2048 box. We also plot the observed SFHs of dwarf galaxies from Weisz et al. (2014a) (starting from , lookback time Gyrs). The zoom-in galaxies tend to show earlier star formation than their parent box counterparts when we go from the bin to the bin. Here, resolution effects kick in such that the zoom-in simulations resolve halo growth earlier than the parent box, while their late-time star formation converges at low redshift. Compared to the inferred SFHs of Local Group dwarf galaxies from Weisz et al. (2014a), the rapid early star formation of the zoom-in dwarf galaxies at is marginally consistent with these observed galaxies.
The UM DR1 model predicts that the zoom-in dwarf galaxies only form of their present-day stellar mass in this early phase, and their star formation gets stalled by the slackened halo growth from to 1, before forming the other half of their stellar mass at low redshift (). This finding is valid for centrals and satellites alike, and is discrepant with the inferred late-time SFHs of dwarf galaxies in the Local Group within the similar stellar mass ranges, especially for ultra-faint dwarfs () which are thought to quench their star formation at high redshifts () via reionization (e.g., Bullock et al. 2000; Barkana & Loeb 2001; Benson et al. 2002; Rodriguez Wimberly et al. 2019). The differences of UniverseMachine with the Local Group observations in the ultra-faint dwarf regime is robust; their object-to-object scatter does not overlap, and it cannot be accounted for by observational uncertainties ( in ) at (Weisz et al., 2014a). Even though updated stellar evolution models (e.g., Dotter et al. 2017) that account for atomic diffusion and gravitational settling could lead to slightly younger stellar ages, the tension between our SFHs and the Local Group dwarf SFHs cannot be fully resolved. It is not surprising that UniverseMachine predicts a different SFH than observed dwarfs since no constraints were placed on the cosmic star formation histories of low-mass galaxies () in the fitting of the UM DR1 model. Similar late-time star formation that is discrepant from the Local Group dwarfs was predicted in Leitner (2012) when the observed SFR- relation was extrapolated down to the dwarf galaxy regime.
In the top two panels of the left column in Fig. 5, we also show the evolution of for all galaxies, centrals-only, and satellites-only samples in the two lowest SFH stellar mass bins. At , increases steadfastly in both stellar mass bins and fuels the rapid early star formation due to halo growth. However, at , remains almost constant for centrals, and it decreases mildly on average for the subhalos hosting satellite galaxies due to tidal stripping after infall, which leads to an almost non-evolving distribution for all galaxies in both stellar mass bins. This suggests that the late-time star formation observed at in these low-mass bins is not driven by (sub)halo dark matter accretion at late times. Instead, the late-time star formation in these small halos results from a significant increase in the efficiency of their star formation while little change occurs in their halo mass.
This phenomenon is due to the specific form of coupling that the UniverseMachine model assumes between SFR and , which behaves unreasonably when extrapolated to the low halo masses we examine here. The UniverseMachine model parameterizes the SFR coupling to of star-forming galaxies in the form of a broken power-law (see Equation 4 in B19):
| (1) |
where , , are model parameters, and we have assumed since is almost constant at . The power-law slopes and account for the different star formation efficiencies in low- and high-mass galaxies due to different feedback and quenching mechanisms, whereas the normalization sets the location of that transition. The evolution of the and values in the UM DR1 model are mostly constrained by the decreasing specific SFR (star formation efficiency) of observed galaxies with (see Figure 3 right panel in B19), which corresponds to halo masses of . The underlying physics here encompasses the AGN feedback (Wyithe & Loeb, 2003; Di Matteo et al., 2005; Springel et al., 2005a; Fabian, 2012; Kormendy & Ho, 2013) and merger-driven quenching in massive galaxies (Nipoti et al., 2009b, a; Remus et al., 2013; Wellons et al., 2016), which becomes more effective in massive halos at low redshift and reduces the efficiency at which a halo can convert its gas into stars.
The best-fit UM DR1 model values for (, , ) are (, , ) at . At , remains almost constant, while both and increase steadily towards . For the galaxies in the three highest stellar mass bins () in Fig. 5, most of their host (sub)halos satisfy , i.e. . With the parameterization in Equation 1, even if remains almost constant at for these massive galaxies, the UM DR1 model predicts that SFRs decrease with time towards due to the increase in and values, which is evident the right column of Fig. 5.
However, directly extrapolating this model down to lower-mass galaxies () could result in , which would lead to increasing SFR values from to due to increasing values of and even though remains constant at low redshift. This effect can be seen in Fig. 5 (left panel) and becomes stronger as stellar mass decreases. As the model predicts all galaxies to be star forming below (see Section 4.3 and Fig. 6), the late-time star formation is evident for both centrals and satellites. This effect is smaller for satellites due to the mild decrease of their at , due to tidal stripping after being accreted.
These findings reflect the fact that the global stellar mass function extends smoothly from down to , leading to a realistic SMHM relation (Fig. 4). However, extending the SFR() coupling constrained by high-mass-galaxy star formation efficiency, where quenching is driven by AGN feedback and mergers, does not fit in the dwarf galaxy regime, where quenching is driven by stripping, stellar feedback, and reionization (e.g., Bullock et al., 2000; Barkana & Loeb, 2001; Benson et al., 2002; Rodriguez Wimberly et al., 2019)), and results in the unrealistic SFHs at (Fig. 5, left column). We discuss the implications of model improvements based on this discrepancy along with the quenched fractions (next section) predicted by UniverseMachine for dwarf galaxies in Section 5.
4.3 Quenched Fractions
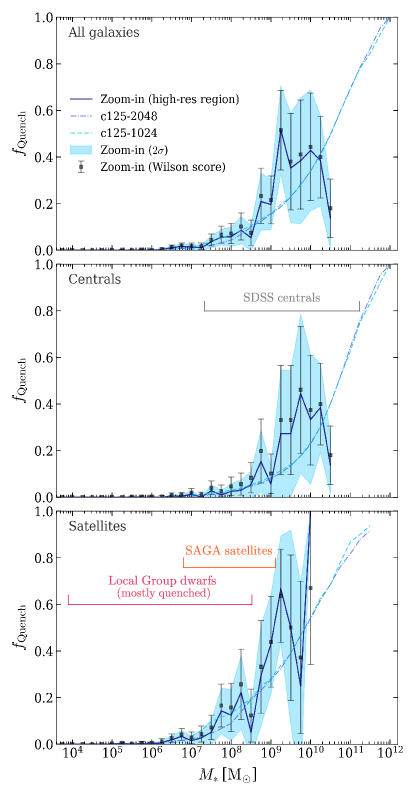
Another crucial observational constraint used to constrain the UM DR1 model is the quenched fraction () of galaxies as a function of stellar mass, which sets the transition from the star-forming main sequence to the quenched red sequence of galaxies (Dekel & Birnboim, 2006; Faber et al., 2007; Noeske et al., 2007). The definition of “quenched” in the model is given by a set of redshift-dependent criteria that depend on both the specific star formation rate (SFR per unit stellar mass, hereafter sSFR; Moustakas et al. 2013) and UVJ-band colors (Muzzin et al., 2013). We follow the definition in Appendix C6 of B19 and adopt as the criterion for classifying quenched galaxies at .
The - relations for all galaxies, centrals, and satellites are shown from in Fig. 6. The classification of galaxies into ‘star forming’ or ‘quenched’ forms a binomial distribution in each stellar mass bin. We show bootstrap errors (from 500 re-samplings), as well as the confidence Wilson score interval (Wilson, 1927) for the three categories of zoom-in galaxies. For brevity, the small bootstrap standard deviations in the two parent boxes are not shown due to the abundant sampling of galaxies at the well-resolved halo masses. The three resolutions agree in the overall trend of the - relation, although the zoom-in results show significant scatter towards high masses due to limited statistics. Similar to the bin in Fig. 5, the zoom-ins begin to miss out on MW-mass satellites and lead to an value that is biased high, although the Wilson score interval remains consistent at the level with the parent boxes. This also leads to the spike at in the top panel when combined with the centrals.
The - relation including both central and satellite galaxies in the top panel of Fig. 6 suggests that the - relation is a simple extension of the UM DR1 model constrained at higher masses down to the ultra-faint dwarf regime in the form of an error function (see Section 3.2 in B19). Comparing the lower two panels, the satellites generally have higher quenched fractions at fixed stellar mass compared to centrals above in both the zoom-ins and the parent boxes. However, the classical and ultra-faint dwarfs below this mass are all predicted to be star forming regardless of their central or satellite identity. Recent observations (McConnachie, 2012; Karachentsev & Kaisina, 2013; Weisz et al., 2015; Mao et al., 2021) suggest that satellite galaxies around MW-mass hosts in the Local Group and low-redshift Universe are at least quenched at , with higher quenched fractions towards lower stellar masses. This trend around MW-hosts is also reproduced in hydrodynamic zoom-in simulations (Simpson et al., 2018; Akins et al., 2020), although these simulations have their own issues of over-quenching field galaxies compared to observations (Dickey et al., 2020). We indicate the mass ranges of specific datasets (field centrals, Geha et al. 2012; SAGA Survey satellites, Mao et al. 2021, and Local group dwarfs, Weisz et al. 2014a) that could be used to constrain future UniverseMachine model improvements.
The discrepancy between UniverseMachine and observations reveals that extending the error function-like parameterization of - for higher-mass galaxies to lower stellar masses is insufficient to capture the correct satellite quenched fractions in the dwarf regime. Because the UM DR1 model predicts that all low-mass galaxies are star forming, a more realistic treatment of observational selection functions is not expected to ease this tension. This implies that a different parameterization for the dwarf galaxy quenched fractions is necessary, in addition to the single-error-function module that fully described the observational constraints at in B19. As a consequence of not quenching dwarf galaxies with , the DR1 model fails to decouple SFR from halo growth scaled as Equation 1, and forces these low-mass galaxies into a late star forming epoch () to match the global stellar mass function at different redshifts, which would have been otherwise prevented if most of these dwarfs were quenched (quenched galaxies in UniverseMachine takes on a median SFR of with a 0.3 dex scatter, regardless of halo mass or halo accretion rate).
4.4 Discussion
Summarizing the main results of this section, UniverseMachine predicts a low-mass SMHM relation that is a power-law extrapolation of the SMHM relation at . This relation is already in place at and evolves over an order of magnitude to a slope and scatter consistent with abundance matching-inferred MW satellite SMHM relation at . The consistency in the SMHM relation with the SMHM relation inferred from MW satellite observations (Nadler et al., 2020a) follows from the fact that the UM DR1 model matches global stellar mass functions across different redshifts. However, as the SFR() coupling is mostly constrained by the specific SFR evolution of high-mass galaxies (), the model forces all dwarf galaxies () to be actively star forming below , regardless of their central or satellite identity. As a consequence, the path through which the dwarfs evolve onto this SMHM relation is inconsistent with that for observed dwarf galaxies.
Although the dwarf galaxy star formation histories predicted by UniverseMachine are not realistic, the predicted evolution of the SMHM relation is reasonable given that UniverseMachine matches the global stellar mass function down to . As shown in the right panel of Fig. 4, the SMHM relation evolves by an order of magnitude in stellar mass at fixed from to . Even if we implement improvements to the DR1 model to enforce SFHs that resemble those for observed dwarf galaxies, stellar masses at are only required to change by factor of at these high redshifts due to the very rapid early-phase star formation (Fig. 5 left column). Therefore, future improvements to the predicted dwarf galaxy SFHs will not significantly affect the predicted faint-end SMHM evolution.
Preliminary results using the predicted SFHs in Section 4.2 indicate that the present-day UFDs’ progenitors were not the major contributors () to the ionizing-photon budget during reionization. This subdominant role is consistent with empirical modeling that connects Local Group dwarf galaxies to high-redshift progenitors based on their abundances and star formation histories (Boylan-Kolchin et al., 2015b; Weisz & Boylan-Kolchin, 2017). Since the current UM model may under-predict SFRs during reionization (more discussion in Section 5), this predicted reionization contribution may slightly increase in future work but is expected to remain subdominant.
Thus, UniverseMachine arrives at a faint-end SMHM relation in agreement with the SMHM relation inferred from MW satellites (4.1) despite its unrealistic predictions for dwarf galaxy star formation histories (4.2) and quenched fractions (4.3). This implies that the DR1 model does not fully capture the physical processes that govern dwarf galaxy evolution, which is unsurprising given that it was only constrained using data for higher-mass galaxies. We now discuss how UniverseMachine might be improved to account for the physics that quenches star formation in the low-mass regime.
5 Implications for Model Improvements
The results in the previous section demonstrate specific shortcomings of the UM DR1 model when applied to lower mass objects that previously investigated. In particular, although UniverseMachine predicts an SMHM relation in good agreement with that inferred from abundance matching and other empirical models, it arrives at this SMHM relation in an unrealistic manner, with all dwarf galaxies actively forming stars at . To more fully constrain the diverse range of physical processes that influence galaxy formation and evolution, UniverseMachine and other empirical models must self-consistently predict both the slope and scatter of the SMHM relation and the detailed evolution of particular galaxies along this relation over time.
Given the factors summarized in Section 4.4, further improvements of the UM DR1 model call for at least implicit incorporation of environmental quenching effects to produce nonzero values for dwarf satellites, thereby decoupling their SFR from halo growth at late times. This change would in principle mostly affect classical and bright dwarfs () in a mass-dependent fashion, and should also accommodate the short quenching timescale ( Gyrs) inferred for galaxies with from Local Group dwarfs (Wetzel et al., 2015). Meanwhile, for ultra-faint dwarfs (), an effective model that captures quenching due to reionization physics (e.g.,, UV heating which prevents gas cooling) could likewise decouple dark matter accretion and star formation. Implementing such a model and constraining it by comparing to the early-quenching SFHs of Local Group dwarf galaxies will offer insights into the timing and efficiency of reionization quenching. Both the environmental and the reionization quenching effects can potentially be modeled by an - parameterization that increases with decreasing stellar mass for , opposite to the parameterization at higher masses () in B19.
With these two changes implemented, the stellar masses of dwarf galaxies could be underestimated due to the removal of late-time () star formation. To maintain a SMHM relation that matches constraints from Local Group dwarf galaxies, these changes necessitate that low-mass (sub)halos form stars more efficiently than high-mass halos at high redshifts (), superseding the fiducial scaling of SFR with halo growth assumed in the UM DR1 model. This is consistent with the efficient high-redshift star formation inferred from Local Group dwarf galaxies (Madau et al., 2014). However, even if we consider the ultra-faint dwarfs that should be most affected by reionization and quench before , they already form of their present-day stellar mass in the early star formation phase predicted by the UM DR1 model due to rapid halo growth. Thus a slight increase (a factor of few) in the early SFR would be sufficient to reproduce SFH consistent with Weisz et al. (2014a) while largely maintaining the SMHM relation. Additional information for the galaxy stellar age distribution as a function of halo mass may also provide quantitative constrains on the star formation efficiency of dwarf (sub)halos relative to their more massive counterparts at high redshift (Khimey et al., 2020).
As discussed in Section 4.4, the current UM model predicts that local UFDs’ progenitors contributed only to the total ionization budget during reionization. This may represent a slight underestimate due to the finite resolution of our simulations and the current UM model under-predicting UFD star formation efficiencies at . However, even with improved modeling and increased resolution, we anticipate that the UFD progenitors’ contribution to reionization will be as the required increase in SFR to match Local Group SFHs is only factor at . In order to make robust predictions for the UFD contribution to reionization, it is necessary to account for systematics in the mass dependence of the IMF as well as the spatial and temporal stochasticity of the UV photon escape fraction. These effects will be investigated further in future work.
In all, more accurate predictions of the earliest star formation epoch in the Universe given by UM will rely on incorporating dwarf galaxy constraints to the model. To emphasize, we advocate that SFH and are essential factors that impact the galaxy–halo connection at the low-mass end, and empirical models that build upon the UniverseMachine framework need to carefully account for their mass-dependent behavior to predict galaxy evolution consistent with the real universe. Although we do not attempt to directly constrain the UniverseMachine model on dwarf galaxy scales in this work, we summarize two future directions for this work motivated by our current findings:
-
•
Re-fitting the UniverseMachine model: We plan to carry out a detailed exploration of the UM DR1 model posterior space, including a study of parameter covariances as well as the flexibility of the current model to allow for early star formation in dwarf galaxies while maintaining appropriate scaling relations at higher masses (e.g.,, stellar mass functions, cosmic star formation history, quenched fractions, and auto- and cross-correlations).
-
•
Implementing dwarf galaxy quenching mechanisms: In parallel, we plan to explore effective models of environmental quenching and reionization by implementing a more sophisticated model of the redshift-dependent - relation. Environmental quenching could potentially be constrained with observed quenched fractions in SDSS field centrals (Geha et al., 2012) and SAGA+Local Group satellites (Weisz et al., 2014a; Mao et al., 2021) hand in hand, while the impact of reionization could potentially be constrained by Local Group ultra-faint dwarfs (Weisz et al., 2014a). This approach can be generalized to improve other aspects of the model at low masses that are inflexible due to the current parameterization based on high-mass galaxies only.
In addition to these plausible improvements, upcoming JWST observations will significantly reduce uncertainties on the high-redshift SMHM relation for the progenitors of the brightest dwarf galaxies (Behroozi et al., 2020). Boosting the SFRs of dwarf galaxies at early times compared to the UM DR1 model as required by this study would suggest an increase the detectability of these systems at redshifts, thereby impacting predictions for JWST. Combined with our methodology to extend galaxy evolution predictions down to the ultra-faint dwarf galaxy regime, these high-redshift observations will further constrain the strength and timing of reionization, which holds far-reaching consequences for our understanding of dwarf galaxy formation and evolution.
6 Conclusions and Outlook
We applied the empirical galaxy–halo connection model UniverseMachine (Behroozi et al., 2019) to cosmological zoom-in simulations of MW-mass halos along with their parent boxes. Our study is based on a joint sample of 45 MW halo zoom-in re-simulations in the halo mass range of selected from the parent cosmological boxes of the Chinchilla simulations (c125-1024 and c125-2048, Mao et al. 2015). This work provides a framework for studying the galaxy–halo connection over the full range of observed galaxy masses, and it exposes specific aspects of the UM DR1 model that break down in the dwarf galaxy regime. The main findings of this work can be summarized as follows:
-
•
We have applied the empirical galaxy–halo connection model UniverseMachine to a set of 45 MW-mass zoom-in simulations, achieving seven decades of halo mass resolution and modeling star formation histories for the full range of galaxy masses when combined with their parent cosmological simulations (Fig. 1).
-
•
The UM DR1 model predicts a SMHM relation that is consistent with observational constraints from MW satellites at , including for ultra-faint dwarf galaxies (Fig. 4, left panel).
-
•
Our predicted SMHM relation evolves roughly an order of magnitude from to , and evolves more mildly from to the present (Fig. 4, right panel).
- •
-
•
We identify modifications to UniverseMachine, including environmental and reionization-driven quenching mechanisms for dwarf galaxies, that must be implemented in specific stellar mass regimes (). Such models may simultaneously yield star formation history and SMHM relation predictions in agreement with dwarf galaxy observations (Section 5).
This work lays crucial methodological foundations (especially for ranking subhalos, Section 3.3 and Appendix A) for applying UniverseMachine to zoom-in simulations and constraining it at the low-mass end. Our work demonstrates that scaling galaxy SFR with (sub)halo dark matter accretion rate can yield reasonably realistic stellar mass–halo mass relations and match the evolution of the global stellar mass function down to the ultra-faint dwarf galaxy regime. However, as discussed in Sections 4 and 5, our findings also reveal that this comes at the cost of predicting significant late-time star formation in dwarfs and not quenching the dwarf satellites at low redshifts (). These limitations arise due to the unconstrained nature of the UM DR1 model in the dwarf galaxy regime. Identifying these limitations in the current version of the UniverseMachine model demonstrates that it is necessary to model quenching differently in low-mass dwarfs () than in their more massive counterparts (), marking a significant transition of the underlying quenching physics with halo mass. As a major focus of upcoming work, a more comprehensive picture that captures the life cycle of star formation in dwarf galaxies will be built using detailed modeling of environmental and reionization quenching mechanisms as well as exploring the flexibility of the UM DR1 model to encompass diverse SFHs in dwarfs.
Apart from these two pertinent directions, comparison with hydrodynamic simulations (see Vogelsberger et al. 2020 for a review) on both cosmological and zoom-in scales could also provide valuable information. For example, recent results (Garrison-Kimmel et al., 2019) from the FIRE Simulation reproduce the stellar mass function and star formation histories of dwarf galaxies around MW-mass hosts reasonably well, while showing minimal environmental dependence in their SFHs. Comparing UniverseMachine to these results can shed light on the details regarding the diversity of SFHs and quenching processes given their power to self-consistently follow the baryonic evolution in galaxies with hydrodynamics.
Another prospect of our future work is to account for the systematic biases introduced into the stellar mass–halo mass relation by stochastically populating the stellar initial mass function (IMF) in ultra-faint dwarfs (Applebaum et al., 2020). Determining the origin of the earlier evolution of subhalos (Figs. 2 and 3) in zoom-in simulations is also crucial for understanding the systematics of environmental quenching effects due to the change in subhalo orbital phases.
The methodology we have developed can easily be generalized to other mass scales (e.g., using cluster scale zoom-in re-simulations), enabling empirical studies of the galaxy–halo connection that benefit from the dynamic range achieved by zoom-in simulations. We have demonstrated that combining the UniverseMachine model with zoom-in dark matter simulations offers a powerful, high-resolution approach to study the relation between dark matter accretion and star formation. We expect that this methodology, combined with the model improvements highlighted here and with new observations that inform the abundance and evolution of dwarf galaxies, will play a key role in future studies of the galaxy–halo connection over large dynamic ranges.
Acknowledgements
We thank the anonymous reviewer for valuable comments that improved the work. We thank Matt Becker for his work on the Chinchilla simulation suite used in this work. We thank Ralf Kaehler for making the brilliant rendition of the projected dark matter density maps shown in Fig. 2. We thank Pratik Gandhi, Andrey Kravtsov, Phil Mansfield, Dan Weisz, and Andrew Wetzel for helpful discussions and comments on the manuscript. YW acknowledges the support of a Stanford-KIPAC Chabolla Fellowship. This research received support from the National Science Foundation (NSF) under grant No. NSF DGE-1656518 through the NSF Graduate Research Fellowship received by EON, by the U.S. Department of Energy contract to SLAC No. DE-AC02-76SF00515, and by Stanford University. Y-YM is supported by NASA through the NASA Hubble Fellowship grant No. HST-HF2-51441.001 awarded by the Space Telescope Science Institute, which is operated by the Association of Universities for Research in Astronomy, Inc., under NASA contract NAS5-26555. SA’s research was partially supported by the U.S. Department of Energy (DOE) Office of Science Distinguished Scientist Fellow Program. PB was partially funded by a Packard Fellowship, Grant #2019-69646. This research made use of computational resources at SLAC National Accelerator Laboratory, a U.S. Department of Energy Office, and the Sherlock cluster at the Stanford Research Computing Center (SRCC); the authors are thankful for the support of the SLAC and SRCC computing teams. This research made extensive use of arXiv.org and NASA’s Astrophysics Data System for bibliographic information.
References
- Akins et al. (2020) Akins, H. B., Christensen, C. R., Brooks, A. M., et al. 2020, arXiv e-prints, arXiv:2008.02805. https://arxiv.org/abs/2008.02805
- Alvarez et al. (2012) Alvarez, M. A., Finlator, K., & Trenti, M. 2012, ApJ, 759, L38, doi: 10.1088/2041-8205/759/2/L38
- Applebaum et al. (2020) Applebaum, E., Brooks, A. M., Quinn, T. R., & Christensen, C. R. 2020, MNRAS, 492, 8, doi: 10.1093/mnras/stz3331
- Barkana & Loeb (2001) Barkana, R., & Loeb, A. 2001, Phys. Rep., 349, 125, doi: 10.1016/S0370-1573(01)00019-9
- Bechtol et al. (2015) Bechtol, K., Drlica-Wagner, A., Balbinot, E., et al. 2015, ApJ, 807, 50, doi: 10.1088/0004-637X/807/1/50
- Behroozi et al. (2019) Behroozi, P., Wechsler, R. H., Hearin, A. P., & Conroy, C. 2019, MNRAS, 488, 3143, doi: 10.1093/mnras/stz1182
- Behroozi et al. (2020) Behroozi, P., Conroy, C., Wechsler, R. H., et al. 2020, MNRAS, 499, 5702, doi: 10.1093/mnras/staa3164
- Behroozi et al. (2013a) Behroozi, P. S., Wechsler, R. H., & Conroy, C. 2013a, ApJ, 770, 57, doi: 10.1088/0004-637X/770/1/57
- Behroozi et al. (2013b) Behroozi, P. S., Wechsler, R. H., & Wu, H.-Y. 2013b, ApJ, 762, 109, doi: 10.1088/0004-637X/762/2/109
- Behroozi et al. (2013c) Behroozi, P. S., Wechsler, R. H., Wu, H.-Y., et al. 2013c, ApJ, 763, 18, doi: 10.1088/0004-637X/763/1/18
- Benson et al. (2002) Benson, A. J., Lacey, C. G., Baugh, C. M., Cole, S., & Frenk, C. S. 2002, MNRAS, 333, 156, doi: 10.1046/j.1365-8711.2002.05387.x
- Blumenthal et al. (1984) Blumenthal, G. R., Faber, S. M., Primack, J. R., & Rees, M. J. 1984, Nature, 311, 517, doi: 10.1038/311517a0
- Boylan-Kolchin et al. (2015a) Boylan-Kolchin, M., Weisz, D. R., Johnson, B. D., et al. 2015a, MNRAS, 453, 1503, doi: 10.1093/mnras/stv1736
- Boylan-Kolchin et al. (2015b) —. 2015b, MNRAS, 453, 1503, doi: 10.1093/mnras/stv1736
- Brown et al. (2014) Brown, T. M., Tumlinson, J., Geha, M., et al. 2014, ApJ, 796, 91, doi: 10.1088/0004-637X/796/2/91
- Bullock & Boylan-Kolchin (2017) Bullock, J. S., & Boylan-Kolchin, M. 2017, ARA&A, 55, 343, doi: 10.1146/annurev-astro-091916-055313
- Bullock et al. (2000) Bullock, J. S., Kravtsov, A. V., & Weinberg, D. H. 2000, ApJ, 539, 517, doi: 10.1086/309279
- Carlsten et al. (2020a) Carlsten, S. G., Greco, J. P., Beaton, R. L., & Greene, J. E. 2020a, ApJ, 891, 144, doi: 10.3847/1538-4357/ab7758
- Carlsten et al. (2021) Carlsten, S. G., Greene, J. E., Peter, A. H. G., Beaton, R. L., & Greco, J. P. 2021, ApJ, 908, 109, doi: 10.3847/1538-4357/abd039
- Carlsten et al. (2020b) Carlsten, S. G., Greene, J. E., Peter, A. H. G., Greco, J. P., & Beaton, R. L. 2020b, ApJ, 902, 124, doi: 10.3847/1538-4357/abb60b
- Cole et al. (1994) Cole, S., Aragon-Salamanca, A., Frenk, C. S., Navarro, J. F., & Zepf, S. E. 1994, MNRAS, 271, 781, doi: 10.1093/mnras/271.4.781
- Conroy et al. (2006) Conroy, C., Wechsler, R. H., & Kravtsov, A. V. 2006, ApJ, 647, 201, doi: 10.1086/503602
- Crocce et al. (2006) Crocce, M., Pueblas, S., & Scoccimarro, R. 2006, MNRAS, 373, 369, doi: 10.1111/j.1365-2966.2006.11040.x
- Davis et al. (2021) Davis, A. B., Nierenberg, A. M., Peter, A. H. G., et al. 2021, MNRAS, 500, 3854, doi: 10.1093/mnras/staa3246
- Dekel & Birnboim (2006) Dekel, A., & Birnboim, Y. 2006, MNRAS, 368, 2, doi: 10.1111/j.1365-2966.2006.10145.x
- Di Matteo et al. (2005) Di Matteo, T., Springel, V., & Hernquist, L. 2005, Nature, 433, 604, doi: 10.1038/nature03335
- Dickey et al. (2020) Dickey, C. M., Starkenburg, T. K., Geha, M., et al. 2020, arXiv e-prints, arXiv:2010.01132. https://arxiv.org/abs/2010.01132
- Diemer & Kravtsov (2015) Diemer, B., & Kravtsov, A. V. 2015, ApJ, 799, 108, doi: 10.1088/0004-637X/799/1/108
- Diemer et al. (2013) Diemer, B., More, S., & Kravtsov, A. V. 2013, ApJ, 766, 25, doi: 10.1088/0004-637X/766/1/25
- Dotter et al. (2017) Dotter, A., Conroy, C., Cargile, P., & Asplund, M. 2017, ApJ, 840, 99, doi: 10.3847/1538-4357/aa6d10
- Drlica-Wagner et al. (2015) Drlica-Wagner, A., Bechtol, K., Rykoff, E. S., et al. 2015, ApJ, 813, 109, doi: 10.1088/0004-637X/813/2/109
- Drlica-Wagner et al. (2020) Drlica-Wagner, A., Bechtol, K., Mau, S., et al. 2020, ApJ, 893, 47, doi: 10.3847/1538-4357/ab7eb9
- Faber et al. (2007) Faber, S. M., Willmer, C. N. A., Wolf, C., et al. 2007, ApJ, 665, 265, doi: 10.1086/519294
- Fabian (2012) Fabian, A. C. 2012, ARA&A, 50, 455, doi: 10.1146/annurev-astro-081811-125521
- Fillingham et al. (2016) Fillingham, S. P., Cooper, M. C., Pace, A. B., et al. 2016, MNRAS, 463, 1916, doi: 10.1093/mnras/stw2131
- Gallazzi et al. (2005) Gallazzi, A., Charlot, S., Brinchmann, J., White, S. D. M., & Tremonti, C. A. 2005, MNRAS, 362, 41, doi: 10.1111/j.1365-2966.2005.09321.x
- Garrison-Kimmel et al. (2014) Garrison-Kimmel, S., Boylan-Kolchin, M., Bullock, J. S., & Lee, K. 2014, MNRAS, 438, 2578, doi: 10.1093/mnras/stt2377
- Garrison-Kimmel et al. (2017) Garrison-Kimmel, S., Bullock, J. S., Boylan-Kolchin, M., & Bardwell, E. 2017, MNRAS, 464, 3108, doi: 10.1093/mnras/stw2564
- Garrison-Kimmel et al. (2019) Garrison-Kimmel, S., Wetzel, A., Hopkins, P. F., et al. 2019, MNRAS, 489, 4574, doi: 10.1093/mnras/stz2507
- Geha et al. (2012) Geha, M., Blanton, M. R., Yan, R., & Tinker, J. L. 2012, ApJ, 757, 85, doi: 10.1088/0004-637X/757/1/85
- Geha et al. (2017) Geha, M., Wechsler, R. H., Mao, Y.-Y., et al. 2017, ApJ, 847, 4, doi: 10.3847/1538-4357/aa8626
- Hahn & Abel (2011) Hahn, O., & Abel, T. 2011, MNRAS, 415, 2101, doi: 10.1111/j.1365-2966.2011.18820.x
- Henriques et al. (2015) Henriques, B. M. B., White, S. D. M., Thomas, P. A., et al. 2015, MNRAS, 451, 2663, doi: 10.1093/mnras/stv705
- Jethwa et al. (2018) Jethwa, P., Erkal, D., & Belokurov, V. 2018, MNRAS, 473, 2060, doi: 10.1093/mnras/stx2330
- Jiang et al. (2021) Jiang, F., Dekel, A., Freundlich, J., et al. 2021, MNRAS, 502, 621, doi: 10.1093/mnras/staa4034
- Jiang & van den Bosch (2016) Jiang, F., & van den Bosch, F. C. 2016, MNRAS, 458, 2848, doi: 10.1093/mnras/stw439
- Kaehler (2017) Kaehler, R. 2017, Astronomy and Computing, 20, 68, doi: 10.1016/j.ascom.2017.05.005
- Kaehler (2018) Kaehler, R. 2018, Electronic Imaging, Visualization and Data Analysis, 333, 1 , doi: https://doi.org/10.2352/ISSN.2470-1173.2018.01.VDA-333
- Karachentsev & Kaisina (2013) Karachentsev, I. D., & Kaisina, E. I. 2013, AJ, 146, 46, doi: 10.1088/0004-6256/146/3/46
- Khimey et al. (2020) Khimey, D., Bose, S., & Tacchella, S. 2020, arXiv e-prints, arXiv:2010.10520. https://arxiv.org/abs/2010.10520
- Klypin et al. (2016) Klypin, A., Yepes, G., Gottlöber, S., Prada, F., & Heß, S. 2016, MNRAS, 457, 4340, doi: 10.1093/mnras/stw248
- Kormendy & Ho (2013) Kormendy, J., & Ho, L. C. 2013, ARA&A, 51, 511, doi: 10.1146/annurev-astro-082708-101811
- Lahav et al. (1991) Lahav, O., Lilje, P. B., Primack, J. R., & Rees, M. J. 1991, MNRAS, 251, 128, doi: 10.1093/mnras/251.1.128
- Leitner (2012) Leitner, S. N. 2012, ApJ, 745, 149, doi: 10.1088/0004-637X/745/2/149
- Licquia & Newman (2015) Licquia, T. C., & Newman, J. A. 2015, ApJ, 806, 96, doi: 10.1088/0004-637X/806/1/96
- Loveday et al. (2015) Loveday, J., Norberg, P., Baldry, I. K., et al. 2015, MNRAS, 451, 1540, doi: 10.1093/mnras/stv1013
- Madau et al. (2014) Madau, P., Weisz, D. R., & Conroy, C. 2014, ApJ, 790, L17, doi: 10.1088/2041-8205/790/2/L17
- Mao et al. (2021) Mao, Y.-Y., Geha, M., Wechsler, R. H., et al. 2021, ApJ, 907, 85, doi: 10.3847/1538-4357/abce58
- Mao et al. (2015) Mao, Y.-Y., Williamson, M., & Wechsler, R. H. 2015, ApJ, 810, 21, doi: 10.1088/0004-637X/810/1/21
- Mateo (1998) Mateo, M. L. 1998, ARA&A, 36, 435, doi: 10.1146/annurev.astro.36.1.435
- McConnachie (2012) McConnachie, A. W. 2012, AJ, 144, 4, doi: 10.1088/0004-6256/144/1/4
- Moster et al. (2013) Moster, B. P., Naab, T., & White, S. D. M. 2013, MNRAS, 428, 3121, doi: 10.1093/mnras/sts261
- Moster et al. (2018) —. 2018, MNRAS, 477, 1822, doi: 10.1093/mnras/sty655
- Moustakas et al. (2013) Moustakas, J., Coil, A. L., Aird, J., et al. 2013, ApJ, 767, 50, doi: 10.1088/0004-637X/767/1/50
- Muzzin et al. (2013) Muzzin, A., Marchesini, D., Stefanon, M., et al. 2013, ApJ, 777, 18, doi: 10.1088/0004-637X/777/1/18
- Nadler et al. (2019) Nadler, E. O., Mao, Y.-Y., Green, G. M., & Wechsler, R. H. 2019, ApJ, 873, 34, doi: 10.3847/1538-4357/ab040e
- Nadler et al. (2020a) Nadler, E. O., Wechsler, R. H., Bechtol, K., et al. 2020a, ApJ, 893, 48, doi: 10.3847/1538-4357/ab846a
- Nadler et al. (2020b) Nadler, E. O., Drlica-Wagner, A., Bechtol, K., et al. 2020b, arXiv e-prints, arXiv:2008.00022. https://arxiv.org/abs/2008.00022
- Nipoti et al. (2009a) Nipoti, C., Treu, T., Auger, M. W., & Bolton, A. S. 2009a, ApJ, 706, L86, doi: 10.1088/0004-637X/706/1/L86
- Nipoti et al. (2009b) Nipoti, C., Treu, T., & Bolton, A. S. 2009b, ApJ, 703, 1531, doi: 10.1088/0004-637X/703/2/1531
- Noeske et al. (2007) Noeske, K. G., Weiner, B. J., Faber, S. M., et al. 2007, ApJ, 660, L43, doi: 10.1086/517926
- Posti & Helmi (2019) Posti, L., & Helmi, A. 2019, A&A, 621, A56, doi: 10.1051/0004-6361/201833355
- Pujol et al. (2017) Pujol, A., Skibba, R. A., Gaztañaga, E., et al. 2017, MNRAS, 469, 749, doi: 10.1093/mnras/stx913
- Reddick et al. (2013) Reddick, R. M., Wechsler, R. H., Tinker, J. L., & Behroozi, P. S. 2013, ApJ, 771, 30, doi: 10.1088/0004-637X/771/1/30
- Remus et al. (2013) Remus, R.-S., Burkert, A., Dolag, K., et al. 2013, ApJ, 766, 71, doi: 10.1088/0004-637X/766/2/71
- Rodríguez-Puebla et al. (2016) Rodríguez-Puebla, A., Behroozi, P., Primack, J., et al. 2016, MNRAS, 462, 893, doi: 10.1093/mnras/stw1705
- Rodríguez-Puebla et al. (2017) Rodríguez-Puebla, A., Primack, J. R., Avila-Reese, V., & Faber, S. M. 2017, MNRAS, 470, 651, doi: 10.1093/mnras/stx1172
- Rodriguez Wimberly et al. (2019) Rodriguez Wimberly, M. K., Cooper, M. C., Fillingham, S. P., et al. 2019, MNRAS, 483, 4031, doi: 10.1093/mnras/sty3357
- Simpson et al. (2018) Simpson, C. M., Grand, R. J. J., Gómez, F. A., et al. 2018, MNRAS, 478, 548, doi: 10.1093/mnras/sty774
- Somerville & Davé (2015) Somerville, R. S., & Davé, R. 2015, ARA&A, 53, 51, doi: 10.1146/annurev-astro-082812-140951
- Springel (2005) Springel, V. 2005, MNRAS, 364, 1105, doi: 10.1111/j.1365-2966.2005.09655.x
- Springel et al. (2005a) Springel, V., Di Matteo, T., & Hernquist, L. 2005a, MNRAS, 361, 776, doi: 10.1111/j.1365-2966.2005.09238.x
- Springel et al. (2005b) Springel, V., White, S. D. M., Jenkins, A., et al. 2005b, Nature, 435, 629, doi: 10.1038/nature03597
- Thoul & Weinberg (1996) Thoul, A. A., & Weinberg, D. H. 1996, ApJ, 465, 608, doi: 10.1086/177446
- Tolstoy et al. (2009) Tolstoy, E., Hill, V., & Tosi, M. 2009, ARA&A, 47, 371, doi: 10.1146/annurev-astro-082708-101650
- Vogelsberger et al. (2020) Vogelsberger, M., Marinacci, F., Torrey, P., & Puchwein, E. 2020, Nature Reviews Physics, 2, 42, doi: 10.1038/s42254-019-0127-2
- Watkins et al. (2019) Watkins, L. L., van der Marel, R. P., Sohn, S. T., & Evans, N. W. 2019, ApJ, 873, 118, doi: 10.3847/1538-4357/ab089f
- Wechsler et al. (2002) Wechsler, R. H., Bullock, J. S., Primack, J. R., Kravtsov, A. V., & Dekel, A. 2002, ApJ, 568, 52, doi: 10.1086/338765
- Wechsler & Tinker (2018) Wechsler, R. H., & Tinker, J. L. 2018, ARA&A, 56, 435, doi: 10.1146/annurev-astro-081817-051756
- Weisz & Boylan-Kolchin (2017) Weisz, D. R., & Boylan-Kolchin, M. 2017, MNRAS, 469, L83, doi: 10.1093/mnrasl/slx043
- Weisz et al. (2014a) Weisz, D. R., Dolphin, A. E., Skillman, E. D., et al. 2014a, ApJ, 789, 147, doi: 10.1088/0004-637X/789/2/147
- Weisz et al. (2014b) —. 2014b, ApJ, 789, 148, doi: 10.1088/0004-637X/789/2/148
- Weisz et al. (2015) —. 2015, ApJ, 804, 136, doi: 10.1088/0004-637X/804/2/136
- Wellons et al. (2016) Wellons, S., Torrey, P., Ma, C.-P., et al. 2016, MNRAS, 456, 1030, doi: 10.1093/mnras/stv2738
- Wetzel et al. (2015) Wetzel, A. R., Tollerud, E. J., & Weisz, D. R. 2015, ApJ, 808, L27, doi: 10.1088/2041-8205/808/1/L27
- White & Rees (1978) White, S. D. M., & Rees, M. J. 1978, MNRAS, 183, 341, doi: 10.1093/mnras/183.3.341
- Willman (2010) Willman, B. 2010, Advances in Astronomy, 2010, 285454, doi: 10.1155/2010/285454
- Wilson (1927) Wilson, E. B. 1927, Journal of the American Statistical Association, 22, 209 , doi: https://doi.org/10.1080/01621459.1927.10502953
- Wyithe & Loeb (2003) Wyithe, J. S. B., & Loeb, A. 2003, ApJ, 595, 614, doi: 10.1086/377475
- Yates et al. (2020) Yates, R. M., Henriques, B. M. B., Fu, J., et al. 2020, arXiv e-prints, arXiv:2011.04670. https://arxiv.org/abs/2011.04670
Appendix A Subhalo ranking
As briefly discussed in Section 3.3, correctly ranking subhalos in zoom-in simulations is non-trivial and is a crucial step for applying UniverseMachine. This involves mapping the halo accretion rate to galaxy SFR at fixed halo mass (). The definition of follows from Equation 1 in B19:
| (A1) |
where is the redshift when is measured, is the redshift one dynamical timescale ago from , and is the redshift at . The ranks of are essentially their probits according to the cumulative distribution function (CDF), which is assumed to be Gaussian. The probits are further mapped to the ranked percentiles of SFR by the UM DR1 model via a rank correlation parameter (see Equation 18 in B19) with some random Gaussian scatter.
Shown in Fig. A.1 are the rank distributions of as a function of the peak halo particle number () for the 45 joint zoom-ins (left panel) and the individual MW zoom-in halo No. 416 (right panel). The colored curves denote the isodensity contours of the rank distributions in the three resolutions, while the grey-scale color map shows the binned rank versus peak halo particle number for the zoom-ins (all subhalos in the left panel, and only those in Halo no. 416 on the right). We notice from the left panel that the contours for the subhalo ranks we obtain in the joint zoom-ins are close to those obtained in the two parent boxes. This is an interesting feature that could be useful when multiple zoom-ins are not available for ranking (sub)halos, and one could potentially use ranks obtained for (sub)halos with the same particle number from the parent box(es) as ranks assigned to zoom-in (sub)halos. However, this might only apply to low-mass subhalos () in MW zoom-ins due to the weak mass-dependence of halo concentration (e.g., Wechsler et al. 2002; Diemer & Kravtsov 2015) in this mass regime. We leave a quantitative investigation of this ranking feature to future work.
Comparing the left and right panels, the most significant difference comparing the rank distributions of the joint and individual zoom-ins is that the joint zoom-ins’ ranks have a much better coverage at the high () and low () particle number numbers, where the individual zoom-ins easily miss out on these rare objects due to finite sampling for high-mass objects or halo finder cut off for low-mass objects. In the range of particles where most (sub)halos dwell, the joint zoom-ins also sample the tails of the CDF more accurately (). In practice, if the tails are not sampled properly by applying UniverseMachine to an individual zoom-in, the code can break down due to the presence of rapidly growing () or heavily tidal-stripped () (sub)halos before fully evolving to . Therefore, it is crucial to join multiple zoom-in realizations for obtaining unbiased ranks of the subhalos when applying empirical models like UniverseMachine to zoom-in simulations in general.
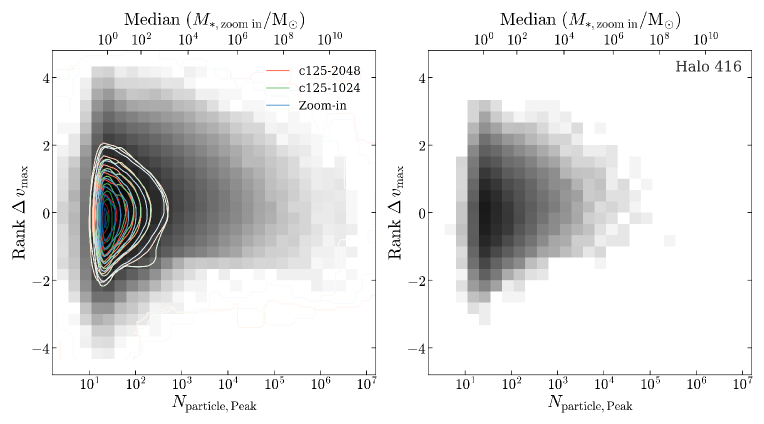
Appendix B Resolution cuts
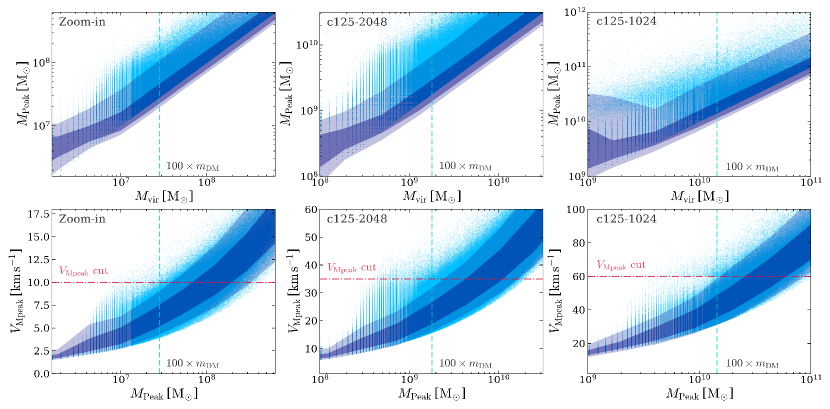
Although our results are hardly affected by resolution effects on our galaxy and halo samples, we emphasize that one should be cautious when interpreting the results involving a significant proportion of (sub)halos near the resolution limit of the simulation. Numerical resolution mainly affect the density profiles of dark matter halos by decreasing the central region density and henceforth decreasing the . In Fig. B.1 we show the - and - relations for our three different resolution simulations. Scattered dots indicate individual (sub)halos, while the dark and light shaded regions indicate the and intervals of the corresponding distributions.
Conventionally, halos with more than 100 particles at are thought to be well resolved. However, (sub)halos may experience mass loss due to tidal interactions in the cosmic environment, therefore one must also include (sub)halos that have well-resolved evolution histories but currently stripped below the traditional resolution limit. We propose that a reasonable resolution cut for our set of simulations is to select (sub)halos above the upper bound of the interval of at the peak halo mass, which is 100 times that of the particle mass resolution. These values are indicated by the red dotted dashed lines in the lower panels of Fig. B.1 (c125-1024 km/s, c125-2048 km/s, and zoom-ins km/s). This procedure deliberately selects subhalos with stellar mass () that up-scatters in the SMHM relation (which is acceptable for dark matter related properties). One could potentially also cut conservatively on with the particle mass resolution if one is particularly interested in (sub)halos with stellar masses near the resolution limit.