11email: lizhaosheng@xtu.edu.cn 22institutetext: SRON-Netherlands Institute for Space Research, Sorbonnelaan 2, 3584 CA, Utrecht, The Netherlands 33institutetext: International Space Science Institute (ISSI), Hallerstrasse 6, 3012 Bern, Switzerland 44institutetext: Department of Physics and Astronomy, University of Turku, FI-20014, Finland 55institutetext: Space Research Institute of the Russian Academy of Sciences, Profsoyuznaya str. 84/32, 117997 Moscow, Russia 66institutetext: Nordita, KTH Royal Institute of Technology and Stockholm University, Roslagstullsbacken 23, SE-10691 Stockholm, Sweden 77institutetext: School of Physics and Astronomy, Monash University, Australia, VIC 3800, Australia 88institutetext: OzGRav-Monash, School of Physics and Astronomy, Monash University, Victoria 3800, Australia 99institutetext: University of Geneva, Department of Astronomy, Chemin d’Ecogia 16, 1290, Versoix, Switzerland 1010institutetext: Key Laboratory of Particle Astrophysics, Institute of High Energy Physics, Chinese Academy of Sciences, 19B Yuquan Road, Beijing 100049, China
Broadband X-ray spectra and timing of the accreting millisecond pulsar Swift J1756.92508 during its 2018 and 2019 outbursts
The accreting millisecond X-ray pulsar Swift J1756.92508 launched into an outburst in April 2018 and June 2019 – 8.7 years after the previous period of activity. We investigated the temporal, timing, and spectral properties of these two outbursts using data from NICER, XMM-Newton, NuSTAR, INTEGRAL, Swift, and Insight-HXMT. The two outbursts exhibited similar broadband spectra and X-ray pulse profiles. For the first time, we report the detection of the pulsed emission up to keV that was observed by Insight-HXMT during the 2018 outburst. We also found the pulsation up to keV that was observed by NICER and NuSTAR during the 2019 outburst. We performed a coherent timing analysis combining the data from the two outbursts. The binary system is well described by a constant orbital period over a time span of years. The time-averaged broadband spectra are well fitted by the absorbed thermal Comptonization model compps in a slab geometry with an electron temperature, –50 keV, Thomson optical depth , blackbody seed photon temperature 0.7–0.8 keV, and hydrogen column density of cm-2. We searched the available data for type-I (thermonuclear) X-ray bursts, but found none, which is unsurprising given the estimated low peak accretion rate ( of the Eddington rate) and generally low expected burst rates for hydrogen-poor fuel. Based on the history of four outbursts to date, we estimate the long-term average accretion rate at roughly for an assumed distance of 8 kpc. The expected mass transfer rate driven by gravitational radiation in the binary implies the source may be no closer than 4 kpc. Swift J1756.92508 is the third low mass X-ray binary exhibiting “double” outbursts, which are separated by much shorter intervals than what we typically see and are likely to result from interruption of the accretion flow from the disk onto the neutron star. Such behavior may have important implications for the disk instability model.
Key Words.:
pulsars: individual: Swift J1756.92508– radiation mechanisms: non-thermal – stars: neutron – X-rays: general – X-rays: binaries1 Introduction
Swift J1756.92508 was discovered by Swift-BAT during its 2007 outburst (Krimm et al., 2007a; Linares et al., 2008). Coherent X-ray pulsations at a frequency of 182 Hz confirmed the compact object to be an accreting millisecond X-ray pulsar (AMXP) (Markwardt et al., 2007). In the following observations, carried out by Swift and RXTE, an orbital period of 54.7 min was measured and, based on its mass function, the mass of the companion star – a highly evolved white dwarf – was determined to be in the range of (Krimm et al., 2007b).
The AMXPs are rapidly spinning, old, recycled neutron stars (NSs) hosted in low-mass X-ray binaries (LMXB). As a binary system evolves through phases of accretion onto the NS, it gains angular momentum from the accreted material, which is sufficient to spin-up the NS to a rotation period equilibrium in the millisecond range, that is, the recycling of old radio-pulsars to millisecond periods (Alpar et al., 1982; Wijnands & van der Klis, 1998; Falanga et al., 2005b; Papitto et al., 2013). On the other hand, between the outbursts, long-term monitoring shows some AMXPs to exhibit spin-down in quiescence (see, e.g., Hartman et al., 2009; Patruno et al., 2010; Papitto et al., 2010). For reviews of the properties of these objects, we refer to Wijnands (2006), Poutanen (2006), Patruno & Watts (2021), Campana & Di Salvo (2018), Papitto et al. (2020), and Di Salvo & Sanna (2020).
The source, Swift J1756.92508, was shown to have undergone another three outbursts: in 2009 (Patruno et al., 2009a), 2018 (Sanna et al., 2018c; Bult et al., 2018a; Rai & Paul, 2019; Chakraborty & Bhattacharyya, 2018), and 2019 (Sanna et al., 2019). For the first three recurrent outbursts between 2007 and 2018, there was no orbital period variation detected (Krimm et al., 2007b; Patruno et al., 2010; Bult et al., 2018a; Sanna et al., 2018c). Moreover, the upper limit on the orbital period derivative is from the total 11-year span of the observations, which is consistent with the prediction of a conservative mass transfer in the binary system (Bult et al., 2018a). Swift J1756.92508 exhibited long-term spin-down behavior with a spin frequency derivative of , measured by Patruno et al. (2010), by Bult et al. (2018a) and a smaller value by Sanna et al. (2018c). Assuming that the rotational energy loss due to the magnetic dipole emission dominated the spin evolution of Swift J1756.92508, the magnetic field strength at the stellar magnetic poles was constrained to the range of (see, e.g., Patruno et al., 2010; Bult et al., 2018a; Sanna et al., 2018c, and references therein).
Most NSs hosted in LMXB systems exhibit type I X-ray bursts (Galloway et al., 2020). Type I bursts are thermonuclear explosions on the surface of the accreting NS, triggered by unstable hydrogen or helium burning. They are typically characterized by a fast rise time of s, followed by exponential-like decays, as well a gradual softening due to the cooling of the NS photosphere, with durations ranging from seconds to minutes and recurrence times from a few hours to days (see, e.g., Lewin et al., 1993; Strohmayer & Bildsten, 2006; Galloway & Keek, 2021, for reviews). The burst spectra are described by a blackbody with peak temperatures reaching keV, where the luminosity can reach the Eddington limit, erg s-1, and the total burst energy release is on the order of erg (see Lewin et al., 1993; Strohmayer & Bildsten, 2006; Galloway et al., 2008, for a review). Several thousand bursts have been observed to date (see, e.g., Galloway et al., 2008, 2020). However, 7 sources (including Swift J1756.92508) out of 21 known AMXPs, including 20 AMXPs mentioned in Table 1 from Di Salvo & Sanna (2020) as well as the newly confirmed AMXP IGR J174943030 (Ng et al., 2021), have not shown type-I X-ray bursts during their outbursts. Hence, the distance to Swift J1756.92508 is still unknown. Below, for a number of estimates, we assume a distance of 8 kpc (since the source lies close to the direction to the Galactic center).
In this paper, we report on the broadband (1–300 keV) spectral and timing results using the available high-energy data, including INTEGRAL ( keV), two NuSTAR ( keV), one XMM-Newton ( keV), eight NICER ( keV), nine Swift, and five Insight-HXMT ( keV) observations during the 2018 outburst from Swift J1756.92508, as well as one NuSTAR, one Swift, and seven NICER observations during its 2019 outburst. All the monitoring observations have been applied to shed light on the physical processes acting upon Swift J1756.92508.
2 Observations and data reduction
We reduce the data from Swift J1756.92508 collected during its 2018 and 2019 outbursts. For the 2018 outburst, INTEGRAL was the first to detect the enhanced X-ray emission from Swift J1756.92508 (Mereminskiy et al., 2018). Several high-energy facilities carried out the follow-up observations covering the whole outburst (Bult et al., 2018b; Krimm et al., 2018; Mazzola et al., 2018; Bult et al., 2018c; Kuiper et al., 2018). During the 2019 outburst, NICER, NuSTAR, and Swift observed Swift J1756.92508 (Sanna et al., 2019). Below, we introduce the data reduction part for all instruments. In addition, we provide in Table 1 a log of all observations during the 2018 and 2019 outbursts. We adopted Solar System ephemeris DE405 and the X-ray position of Swift J1756.92508 (Krimm et al., 2007b) to apply the barycentering corrections for the timing analysis using INTEGRAL (Sect. 2.1), NICER (Sect. 2.2), NuSTAR (Sect. 2.3), XMM-Newton (Sect. 2.4), and Insight-HXMT (Sect. 2.5) observations.
| Mission | Obs. ID | Instrument | Datea𝑎aa𝑎aThe start time of the observations since MJD 58208 and 58644.5 for the 2018 and 2019 outbursts, respectively. | Exposure |
|---|---|---|---|---|
| (d) | (ks) | |||
| 2018 outburst | ||||
| NuSTAR | 90402313002 | FPMA/FPMB | 8.36 | 39.5 |
| 90402313004 | FPMA/FPMB | 14.13 | 61.0 | |
| NICER | 1050230101 | XTI | 3.64 | 7.5 |
| 1050230102 | XTI | 4.61 | 7.1 | |
| 1050230103 | XTI | 7.89 | 2.4 | |
| 1050230104 | XTI | 8.02 | 10.7 | |
| 1050230105 | XTI | 9.33 | 4.1 | |
| 1050230106 | XTI | 10.02 | 6.2 | |
| 1050230107 | XTI | 11.06 | 5.0 | |
| 1050230108 | XTI | 25.85 | 1.5 | |
| XMM-Newton | 0830190401 | RGS/MOS/PN | 8.09 | 66 |
| INTEGRAL | 1936, 1937 | ISGRI | -1.23, 1.42 | 129 |
| 1939 (ToO) | ISGRI | 7.68 | 85 | |
| 1940 | ISGRI | 10.01 | ||
| 1942 | ISGRI | 14.91 | 190b𝑏bb𝑏bThe total exposure time of Rev. 1940, 1942, and 1944. | |
| 1944 | ISGRI | 20.20 | ||
| Insight-HXMT | P011469200101 | ME & HE | 5.13 | 4.3 |
| P011469200102 | ME & HE | 5.33 | 1.1 | |
| P011469200103 | ME & HE | 5.47 | 0.3 | |
| P011469200104 | ME & HE | 5.60 | 1.2 | |
| P011469200105 | ME & HE | 5.71 | 5.9 | |
| Swift | 00030952018 | XRT | 2.67 | 1.0 |
| 00088662001 | XRT | 8.77 | 2.2 | |
| 00030952019 | XRT | 9.78 | 1.0 | |
| 00030952020 | XRT | 10.38 | 0.4 | |
| 00030952021 | XRT | 12.59 | 1.3 | |
| 00088662002 | XRT | 14.82 | 2.1 | |
| 00030952022 | XRT | 18.75 | 1.0 | |
| 00030952023 | XRT | 24.59 | 1.2 | |
| 00030952024 | XRT | 27.44 | 1.4 | |
| 2019 outburst | ||||
| NuSTAR | 90501329001 | FPMA/FPMB | 11.85 | 37.7 |
| NICER | 2050230101 | XTI | 9.10 | 1.5 |
| 2050230102 | XTI | 9.56 | 3.6 | |
| 2050230103 | XTI | 11.10 | 5.4 | |
| 2050230104 | XTI | 11.50 | 11.7 | |
| 2050230105 | XTI | 16.51 | 1.1 | |
| 2050230106 | XTI | 19.02 | 1.7 | |
| 2050230107 | XTI | 21.16 | 1.1 | |
| Swift | 00030952025 | XRT | 10.53 | 0.9 |
2.1 INTEGRAL
Our INTEGRAL (Winkler et al., 2003) data set comprises all the observations covering the 2018 outburst. It consists of 160 stable pointings (science windows, ScWs) with a source position offset from the center of the field of view . The different satellite pointings in the direction of Swift J1756.92508, each lasting ks, were performed between March 29 and April 20, 2018. Specifically, the satellite revolutions included in the analysis were: 1936–1937, 1939–1940, 1942, and 1944. This includes also a dedicated Target of Opportunity (ToO) observation during revolution 1939 beginning on April 7 (MJD 58215.81170). The data reduction was performed using the standard Offline Science Analysis (OSA222http://www.isdc.unige.ch/integral/analysis) version 10.2, distributed by the Integral Science Data Center (Courvoisier et al., 2003). The algorithms used for the spatial and spectral analysis are described in Goldwurm et al. (2003). We analyzed data from the IBIS-ISGRI coded mask telescope (Ubertini et al., 2003; Lebrun et al., 2003), at energies between 22 and 300 keV, and from the JEM-X monitor, module 1 and 2 (Lund et al., 2003) between 5 and 20 keV. Because most of the pointings were not aimed at Swift J1756.92508 as the primary target, the source was rarely within the JEM-X field of view of . Therefore, we did not use the JEM-X data for the spectral analysis.
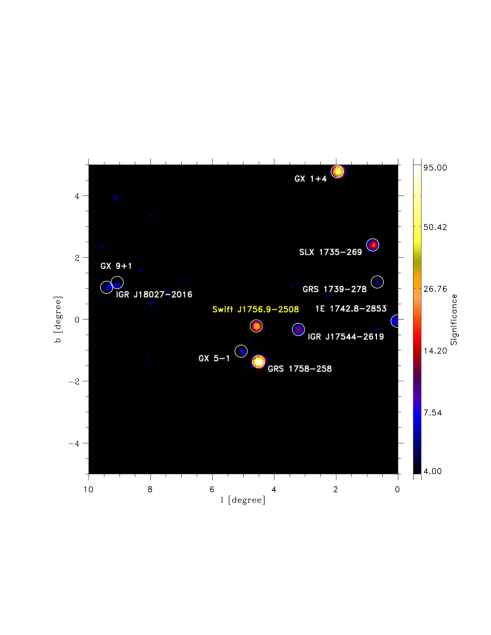
We show in Fig. 1 part of the ISGRI field of view for 20–50 keV energy range (significance map) centered on the position of Swift J1756.92508. The source was clearly detected in the mosaic at a significance of in the 20–50 keV energy range and still significant with in the higher 100–150 keV energy range. The best-determined position is at and , with an associated uncertainty of at the 90% c.l. (20–50 keV; Gros et al. 2003).
We extracted the IBIS-ISGRI light curve of Swift J1756.92508 at the resolution of one ScW for the entire observational period covered by INTEGRAL (see Sect. 3). However, the ISGRI spectra were extracted only using the dedicated continuous ToO observation in revolution 1939, as these occurred nearly simultaneously with the NICER NuSTAR and XMM-Newton observations (see Sect. 2.2, 2.3, 2.4) and permitted the most accurate description of the source averaged broadband high-energy emission. The outburst profile is described in Sect. 3 and the averaged broadband spectrum of the source, as it was measured almost simultaneously by all these instruments, is described in Sect. 4. We note that INTEGRAL did not carry out observations of Swift J1756.92508 during its 2019 outburst.
2.2 NICER
The Neutron star Interior Composition ExploreR (NICER), launched on June 3, 2017, is an International Space Station payload dedicated to (spectral) timing studies in the 0.2–12 keV band at an unprecedented time resolution of ns (Arzoumanian et al., 2014). During the 2018 outburst, NICER started regular observations of Swift J1756.92508 on April 3, 2018 (MJD 58211.6; obs. ID 1050230101), namely, a few days after the detection by INTEGRAL, and it ended on April 25, 2018 (MJD 58233.8; obs. ID 1050230108) when the source reached undetectable levels. During the 2019 outburst, NICER observed Swift J1756.92508 seven times, including obs. ID 2050230101 through 2050230107.
We carried out standard data processing using the NICER Data Analysis Software (NICERDAS). The default filtering criteria were applied to extract the cleaned event data. The spectra and light curves were obtained by xselect. The spectrum from obs. ID 1050230104 was used together with those from the other instruments in the 2018 outburst. The background spectrum is adopted from obs. ID 1050230107, when Swift J1756.92508 was in a quiescent state with negligible X-ray emission. In the pulse-profile analysis of the 2018 NICER data (see Sect. 5.2) we used obs. ID 1050230108 for the estimation of the background to obtain background corrected fractional amplitudes.
For the 2019 outburst, the NICER observation with obs. ID 2050230104 overlapped with the (single) NuSTAR observation. In order to obtain a simultaneous broadband spectrum, the data between MJD 58656.3485 and 58656.9060 were analyzed; in this case, the background spectrum was from obs. ID 2050230107. The redistribution matrix file and ancillary response file were taken from the official webpage.333https://heasarc.gsfc.nasa.gov/docs/nicer/tools/nicer_bkg_est_tools.html For details on the timing analysis of NICER data we refer to Sect. 5.
2.3 NuSTAR
NuSTAR observed Swift J1756.92508 on April 8, 2018 (obs. ID 90402313002; MJD ), April 14, 2018 (obs. ID 90402313004; MJD ), and on June 22, 2019 (obs. ID 90501329001; MJD ). The second observation during the 2018 outburst was carried out when Swift J1756.92508 returned into quiescent state, so it was not considered in this work. For the first 2018 observation, we cleaned the event file using the NuSTAR pipeline tool nupipeline for both FPMA and FPMB. The light curves and spectra were extracted from a circular region with a radius of centered on the location of Swift J1756.92508 (source region) by using nuproducts, and the response files were produced simultaneously. To extract the background spectra, we chose a source-free circular background region located on the same chip with a radial aperture of .
In the timing analysis, we barycentered event data from the source region using HEASOFT multi-mission tool barycorr v2.1, with NuSTAR fine clock-correction file #110, yielding time tags accurate at 60–100 s level (Bachetti2021). To obtain background corrected timing characteristics, such as fractional amplitudes, we used the above mentioned background region. For the observation carried out during the 2019 outburst, similar procedures were applied as for the 2018 outburst, except that the spectra were cut in the same interval as the NICER obs. ID 2050230104. For more details, see Sect. 2.2.
2.4 XMM-Newton
On April 8, 2018, XMM-Newton started an observation of Swift J1756.92508 (MJD 58216.07). The (imaging) EPIC-pn instrument (Strüder et al., 2001, 0.15–12 keV) on board XMM-Newton was operated in timing mode (TM), allowing for timing studies at a s time resolution. The other (imaging) EPIC instrument equipped with two cameras, MOS-1 and MOS-2 (Turner et al., 2001), were set to full window (FW) and TM, respectively.
We ran the XMM-SAS pipeline analysis scripts (SAS-version 18.0) for all EPIC and RGS instruments on board XMM-Newton. We verified that the background flares were not detected, therefore, it was not necessary to perform further cleaning. We extracted the source spectrum from MOS-2 in TM from the RAWX interval [285, 325], while the background spectrum was extracted from MOS-2 in the image mode from a circle region with a radius of . The response matrix file and ancillary response file were generated using rmfgen and arfgen, respectively.
For the timing analysis, we used data from the XMM-Newton EPIC pn. These were subsequently barycentered using the SAS barycen 1.21 script. Furthermore, we selected the one-dimensional spatial parameter RAWX by defining the source-region as RAWX interval [31,44] and the background region as the combination of RAWX [11,19] and [55,63], chosen far from the source region. The latter has been used in the estimation of background corrected fractional amplitudes in the pulse-profile analysis.
The (non-imaging) Reflection Grating Spectrometers (RGS) (den Herder et al., 2001), on board XMM-Newton, operated in default mode (HighEventRate with Single Event Selection; HER + SES), collecting spectral information in the 0.35–2.5 keV band. Two RGS spectra were extracted using rgsproc and the corresponding response files were created using rgsrmfgen. In order to increase the signal-to-noise ratio (S/N), we combined the spectra of two RGS data in first order. XMM-Newton did not observe Swift J1756.92508 during its 2019 outburst.
2.5 Insight-HXMT
The first Chinese X-ray telescope, the Hard X-ray Modulation Telescope (HXMT), was launched on June 15, 2017 and later dubbed Insight-HXMT (Zhang et al., 2020). Three slat-collimated instruments, the Low Energy X-ray telescope (LE, 1–15 keV, 384 cm2; Chen et al., 2020), the Medium Energy X-ray telescope (ME, 5–30 keV, 952 cm2; Cao et al., 2020) and the High Energy X-ray telescope (HE, 20–250 keV, 5100 cm2; Liu et al., 2020) on board Insight-HXMT provide the capability for the broadband X-ray timing and spectroscopy. Insight-HXMT observed Swift J1756.92508 during its 2018 outburst on MJD 58213.1–58213.8. We employed the HE and ME data to investigate the timing properties of the source because of their relatively good time resolution ( 2 s for HE, 20 s for ME). We analyzed the data using the Insight-HXMT Data Analysis Software package (HXMTDAS) version 2.01. The ME and HE data were calibrated by using the scripts mepical and hepical, respectively. The good time intervals were individually selected from the scripts megtigen and hegtigen with the loose criteria, that is, ELV ¿ 0 and the satellite located outside the SAA region. Finally, the events were obtained using mescreen and hescreen and were barycentered by the tool hxbary. Insight-HXMT did not observe Swift J1756.92508 during its 2019 outburst.
2.6 Swift
In total, nine and one observations, respectively, are available for the 2018 and 2019 outbursts from Swift/XRT, respectively. The Swift/XRT light curves were only reduced to construct the outburst profiles during the 2018 and 2019 outbursts. We reduced the Swift/XRT data in the photon counting mode. The pipeline xrtpipeline was operated for each observation and the light curve was extracted from a circle region centered on the source position with a radius of and corrected by the Swift tool xrtlccorr.
3 The outburst profiles
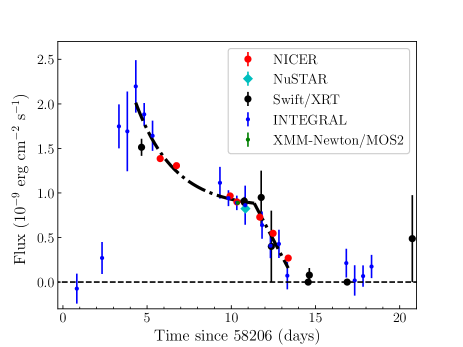
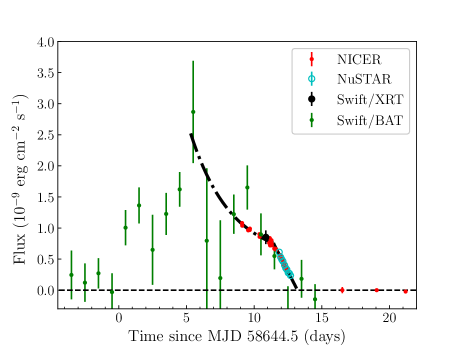
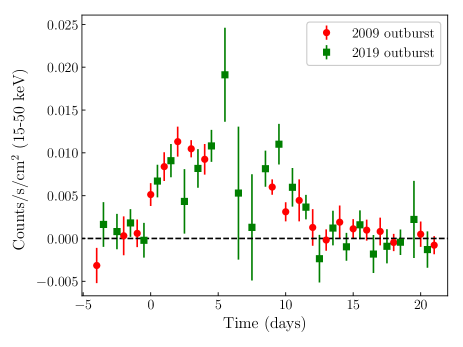
The light curves of Swift J1756.92508, as obtained from all available X-ray data, show the entire 2018 and 2019 outbursts both lasting about 15 d (from March 31 to April 14, 2018 and June 10 to 25, 2019) are shown in Fig. 2. Because the 2019 outburst was observed at the last stage during its decay phase, the flux in one-day bins was estimated using the Swift-BAT data. The count-rates measured from all instruments were converted to bolometric flux (0.1–300 keV) using the spectral analysis results obtained in Sect. 4 for the respective outbursts.
The profile of the outburst observed from Swift J1756.92508 is not too dissimilar from those shown by other AMXPs, which are typically characterized by a swift rise time (2–3 d), followed by 7 d exponential and 2 d linear decay down to the quiescence level (see e.g., Falanga et al., 2005a, 2011, 2012; Ferrigno et al., 2011; Bozzo et al., 2016; De Falco et al., 2017a, b; Kuiper et al., 2020). Using the best covered 2018 outburst profile, we estimate the outburst peak flux around in the 0.1–300 keV energy range (see Fig. 2); this value is similar to that for all other observed outbursts, considering the same energy band (Krimm et al., 2007a; Linares et al., 2008; Patruno et al., 2009a; Sanna et al., 2018c).
| Parameter | Unit | 2018 outburst | 2019 outburst |
|---|---|---|---|
| ( cm-2) | |||
| (keV) | |||
| (keV) | |||
| (km2) | |||
| 1.11/1644 | 1.01/858 | ||
| a𝑎aa𝑎aUnabsorbed flux in the 0.1–300 keV energy range. | ( erg cm-2 s-1) |
Such outbursts are typically described by the disk instability model (see King & Ritter, 1998, for more details), which predicts that both linear and exponentially decaying outbursts can be produced. Typically, for such outbursts, the flux decays from the maximum exponentially until it reaches a break (“knee”), in our case around MJD 58217 (2018 outburst) or MJD 58656 (2019 outburst), and then linearly drops to the quiescent level. Following Powell et al. (2007), the outer disk radius can be estimated by fitting the decay profile (see Fig. 2) with the expression:
| (1) |
where (the limit luminosity of the exponential decay), (the break time), (the luminosity at the break time ), and (exponential decay time) are all free parameters. The outer disk radius is cm, where the value of the viscosity near the outer disk edge cm2 s-1 is adopted (see King & Ritter, 1998; Powell et al., 2007, for more details). In the 2019 outburst, we obtain the outer disk radius of cm. For the binary inclination of and the NS mass of , the companion mass is . We adopted the relation
| (2) |
where is the distance between the NS and the Lagrange point, , of the binary system and is the binary separation, which has an accuracy of 0.5% for between 0.0025 and 0.11 (Iaria et al., 2021). The circularization radius can be estimated from (see e.g., Frank et al., 2002):
| (3) |
We found that the outer disk radii in the 2018 and 2019 outbursts satisfy the condition , where cm and cm.
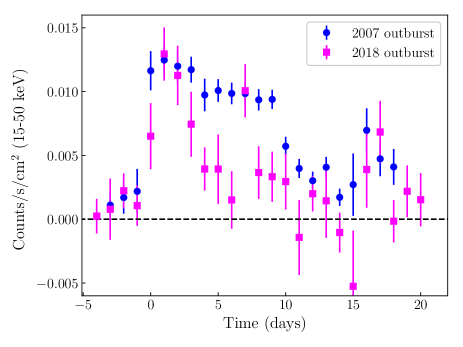
In Fig. 3, an inspection of all the Swift-BAT outburst data shows that the period of activity in 2018–19 broadly follows the pattern of the previous outbursts, with two more closely-spaced outbursts separated by a longer interval. The 2009 outburst followed the discovery outburst in 2007 by 2.1 yr; the 2019 outburst came 1.2 yr after 2018. However, the 2018 outburst came after a much longer quiescent interval, of 8.7 yr.
Such pairs of outbursts have only previously been observed from the low-mass X-ray binaries IGR J00291+5934 and XTE J1118+480 Hartman et al. (2011), although in those systems, the inter-outburst separation was 30 d. Those authors attributed the secondary outburst to leftover material in the accretion disk that was not deposited on the NS during the first outburst. The atypical mass distribution left in the disk when the accretion stalls during the first outburst, leads to the unusual slow-rise shape of the second outburst; this pattern is very similar to what is observed in Swift J1756.92508.
Similarly, for those sources, the wide variation in outburst separation in Swift J1756.92508 is not consistent with a steady accretion rate into the disk, unless the bulk of the fuel for the second outburst in each pair was leftover material that was not accreted during the first outburst. We estimate here the fraction of fuel leftover, and the lower limit on the steady accretion rate, as follows. By integrating the flux measurements over each outburst, the fluences for the 2018 and 2019 outbursts are erg cm-2 and erg cm-2, respectively. The fluence of each outburst arises from an accreted mass of:
| (4) |
where is the gravitational potential energy liberated during accretion. For each of the 2018 and 2019 outbursts, the accreted mass is , where is the distance in units of 8 kpc, the NS radius in units of 10 km, and the NS mass in units of . Assuming a constant accretion rate over the interval between the 2009 and 2019 outbursts, we can solve for this quantity as well as the amount of fuel left over following the 2018 outburst. We find a steady accretion rate of , implying about 45% of the material in the disk remaining after the end of the 2018 outburst.
We can estimate a lower limit for the distance to the source by equating the implied long-term accretion rate above, with the expected accretion rate driven by gravitational-wave radiation from the binary orbit (e.g. Bildsten & Chakrabarty, 2001). Adopting the minimum companion mass of for a NS Krimm et al. (2007b), we find that , so that kpc. This limit is consistent with our assumed distance of 8 kpc.
4 Broadband spectral analysis of the 2018 and 2019 outbursts
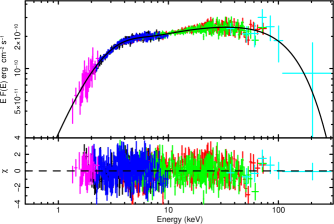
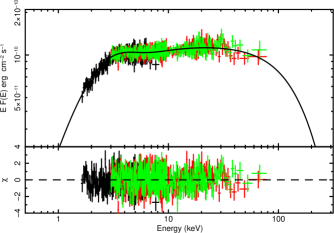
We studied the broadband X-ray spectra of the 2018 and 2019 outbursts individually. For the 2018 outburst, we fit the quasi-simultaneous spectra, including the INTEGRAL-ISGRI (20-250 keV) ToO data between MJD 58215.8–58216.8, the NuSTAR FPMA/FPMB (3.5–79 keV) data starting on MJD 58216.4 (obs. ID 90402313002), NICER (1.5–10 keV) data starting on MJD 58216.0 (obs. ID 1050230104), XMM-Newton MOS (2–10 keV), and RGS (1–2.4 keV) data starting on MJD 58216.1. We note that the MOS spectrum showed a strong excess below 2 keV, which may be affected by the straylight. For the 2019 outburst, we consider the simultaneous observations from NICER (1.5–10 keV, obs. ID 2050230104) and NuSTAR FPMA/FPMB (3–79 keV, obs. ID 00033646004), respectively. All spectra are grouped to make sure that each channel has more than 25 photons. For each instrument, a multiplication factor is included in the fit to account for the uncertainty in the cross-calibration of the instruments. For all fits, the factor is fixed at 1 for the NuSTAR FPMA instrument. All uncertainties in the spectral parameters are given at a confidence level for a single parameter. The spectral analysis were carried out using Xspec version 12.10 (Arnaud, 1996).
We fit all the spectra by using the thermal Comptonization model, compps, in the slab geometry (Poutanen & Svensson, 1996), with the interstellar absorption described by model phabs. This model has been used previously to fit the broadband spectra of AMXPs (see e.g., De Falco et al., 2017b, a; Li et al., 2018; Kuiper et al., 2020, and references therein). The main parameters are the Thomson optical depth across the slab, , the electron temperature, , the temperature of the soft seed photons (assumed to be injected from the bottom of the slab), , the normalization factor for the seed blackbody photons, (with being distance in units of 10 kpc), and the inclination angle (fixed at 60°) between the slab normal and the line of sight to the observer. The interstellar absorption is described by the hydrogen column density, . The best-fit parameters for all models are reported in Table 4. For the distance of 8 kpc, the size of the blackbody emitting region km. This is very similar to IGR J174982921 (Falanga et al., 2012), which was also assumed to be situated at the same distance, but much larger, for instance, than in XTE J1751305 (Gierliński & Poutanen, 2005). Such a large size is hardly consistent with the hotspot at the NS surface and might indicate that the distance to the source is smaller. The bolometric fluxes are calculated by the convolution model cflux in the 0.1–300 keV energy range. In Fig. 4, we show the best-fit spectra.
We find that all multiplication cross-calibration factors are around unity, which means the flux calibration of these instruments is well established and the source did not vary much between the quasi-simultaneous observations. The 2018 and 2019 outbursts can be characterized by similar hard spectra (see Table 4). This indicates that even thought the 2019 outburst was observed at a later outburst stage, namely, at a flux level lower by a factor 1.9 , the decay of the outburst is characterized by a nearly constant spectral shape described by similar electron temperature, , soft seed photons temperature, , and the optical depth, . The spectral parameters are similar to those of many other AMXPs (see e.g., Falanga et al., 2011, and references therein). The spectra for the 2018 and 2019 outbursts in narrower energy ranges are well described by a power-law with a photon index in the range of 1.8–2.0, which is compatible to those measured in the 2007 and 2009 outbursts (Krimm et al., 2007a; Linares et al., 2008; Patruno et al., 2009a). Also, the hydrogen column density was similarly high, namely, . This also confirms that all four observed outbursts are very similar (see also Sect. 3). We note that our estimate of the blackbody normalization is at least factor of 30 larger than the normalization quoted by Sanna et al. (2018c), who used a phenomenological blackbody plus cutoff power-law model. The difference comes from the facts that in the compps model, only a small fraction, that is, , of the seed blackbody photons pass through the Comptonizing slab unaffected; the rest is scattered and produce the hard tail extending to 100 keV. Also, in our model, a large fraction of the flux below 3 keV comes from the blackbody, whereaws in the model of Sanna et al. (2018c), the power law contributes most of the flux.
| Parameter | Units | Values |
| JPL Ephemeris | DE405 | |
| s | ||
| lt-s | ||
| Outburst - 2018 | ||
| Hz | ||
| Epoch, | MJD; TDB | |
| Validity range | MJD; TDB | |
| MJD; TDB | ||
| Outburst - 2019 | ||
| Hz | ||
| Epoch, | MJD; TDB | |
| Validity range | MJD; TDB | |
| MJD; TDB | ||
5 Timing analysis
Irrespective of the instrument, in timing analyses, we had to convert the Terrestial Time (TT) arrival times of the (selected) events to arrival times at the solar system barycenter (in a TDB time scale). For this process, throughout in this work we used: 1) the JPL DE405 solar system ephemeris; 2) the instantaneous spacecraft position with respect to the Earth’s center; and 3) the X-ray celestial position of Swift J1756.92508, and obtained by the Swift-XRT telescope (Krimm et al., 2007b).
5.1 NICER timing analysis of the 2018 and 2019 outbursts
For our timing analysis, we selected ”cleaned” barycentered NICER XTI events, collected during the 2018 and 2019 outbursts, from the standard pipeline analysis with measured energies between 0.5 and 10 keV. Events with energies between 12–15 keV, however, were used to flag periods with high-background levels (e.g., South Atlantic Anomaly ingress or egress, etc.) as bad, and these intervals have been ignored in further analyses. Moreover, events from noisy or malfunctioning detectors were ignored. The screened events were subsequently barycentered using a (multi-instrument serving) idl procedure.
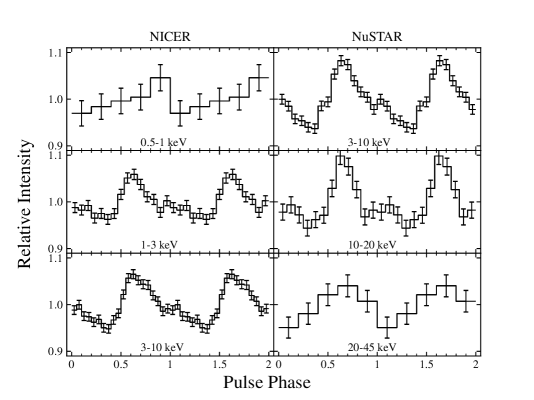
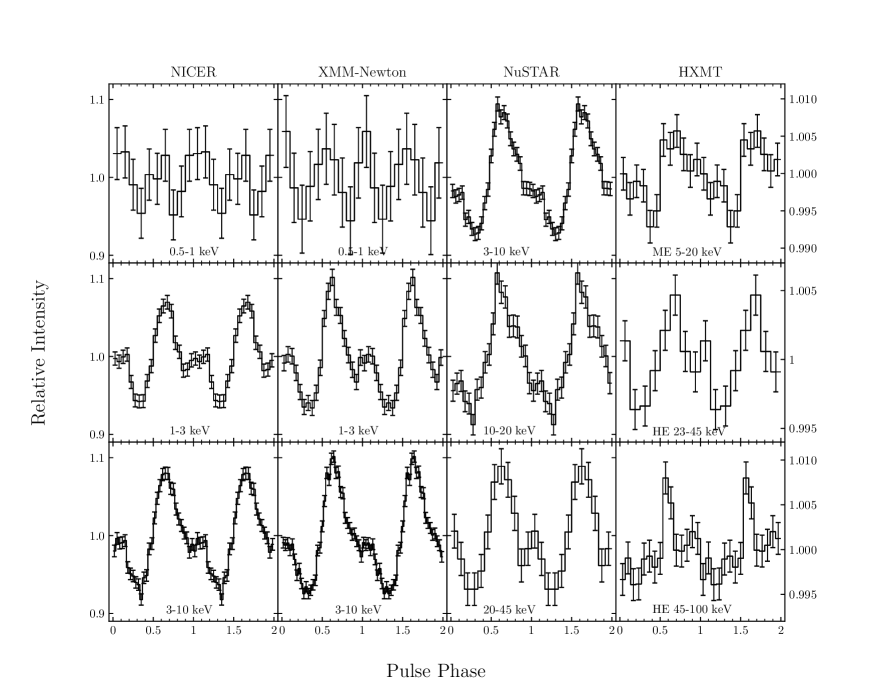
For each outburst, we individually determined the pulse frequency, and time of ascending node, , in a 2d-optimization scheme based on a SIMPLEX algorithm (see, e.g., De Falco et al., 2017b; Kuiper et al., 2020, for more details), finding the global maximum of the -test statistics (Buccheri et al., 1983). In this approach we kept the orbital period, , projected semi major axis, , fixed at the optimum values given by Patruno et al. (2010) (see their Table 4). We verified that using updated orbital ephemeris information (Bult et al., 2018a) had no impact on the values derived here. The best fit values for and , along with the validity interval and epoch for both outbursts, are individually listed in Table 3 and are used later in this work in estimating the orbital period derivative combining information from all registered outbursts (see Sect. 6). Equipped with accurate timing models for both outbursts (see Table 3), we phase-folded the barycentered event times from different instruments for different energy bands both for the 2018 and 2019 outbursts. The results are shown in Figs. 5 and 6 for the 2018 and 2019 outbursts, respectively.
During the 2018 (also for the 2019) outburst, no pulsed emission was detected below 1 keV using NICER and XMM-Newton data. NuSTAR detected pulsed emission up to keV during the 2018 outburst. Folding INTEGRAL-ISGRI barycentered data of the 2018 outburst for the 20-60 keV band did not result in a detection of the pulsed emission in line with the expectations given the moderate total outburst flux, low exposure, and low pulsed fraction of (see Sect. 5.2). However, with the Insight-HXMT HE instrument, significant pulsed emission has been detected up to keV (see lower right panel of Fig. 5) in spite of relatively low exposure. This suggests great prospects for future observations with Insight-HXMT of the AMXP outbursts.
5.2 Harmonics analysis: Pulsed amplitudes and phase lags
We produced pulse-phase distributions in narrow energy bands for NICER, XMM-Newton, and NuSTAR, covering the 1–60 keV band, to obtain quantitative information about morphology changes of the pulse-profile as a function of energy. For this purpose, we fit these measured distributions with a truncated Fourier series given by
| (5) |
For each harmonic, the maxima occur at (in radians).
The results of these fits are shown in Fig. 7. The left panel shows the fractional amplitude, , and the right panel the phase angle, , converted from radians to pulse phase, for both the fundamental (, in black) and the first overtone (, in red). The different symbols indicated different instruments (NICER, 1–10 keV, squares; XMM-Newton EPIC-pn 1–12 keV, circles, and NuSTAR, 3–60 keV, triangles). The pulsed fraction of the fundamental component increases from 4% up to % from 1 to 5 keV, from where it more or less saturates at a level of %. The first overtone fluctuates around 3.5% with an indication for a depression down to 1% around 12 keV. These results are consistent with those reported by Sanna et al. (2018c) (e.g. their Fig. 5). Such a behavior was also observed in other sources (see, e.g., Patruno et al., 2009b) and is likely related to an increasing contribution of an unpulsed emission from the accretion disk. The phase angle plot (Fig. 7 right panel) shows that the location of both harmonics is stable up to at least 10 keV (see also bottom panel of Fig. 2 of Bult et al., 2018a, for equivalent results), aside from the occurence of a possible small drift to smaller values: from 0.7 to 0.65 for the fundamental and from 0.12 to 0.07 for the first overtone.
6 Orbital period
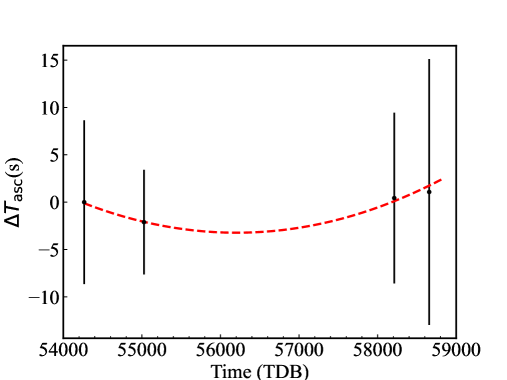
From the outburst in 2019, we have an additional well-determined value. It allows us to perform a coherent analysis of the orbital period evolution across a longer baseline, as compared with Bult et al. (2018a) and Sanna et al. (2018c). Following the procedure introduced in Hartman et al. (2008), we calculate the residual time of passage through the ascending node:
| (6) |
where is the time of ascending node determined from the -th outburst, is the reference time, is the integer number of orbital cycles between the -th outburst and , and is the orbital period. We use the orbital period reported in Table 3 and the reference time as the time of ascending node in the 2007 outburst (Krimm et al., 2007b) to obtain the values of for four outbursts. The errors of are from the uncertainties of . In Fig. 8, we fit the evolution with a parabolic function, and obtain a best fit value of the orbital period derivative of , which is consistent with the results reported in Sanna et al. (2018c) and Bult et al. (2018a). Hence, we conclude that the binary is well described by a constant period over a time span of nearly twelve years.
7 Non-detection of type-I X-ray bursts
We searched for type-I X-ray bursts in all available Swift J1756.92508 light curves during its 2018 and 2019 outbursts and detected none. The non-detection is consistent with the observations covering the 2007 and 2009 outbursts (Patruno et al., 2009a; Sanna et al., 2018c; Bult et al., 2018a; Rai & Paul, 2019).
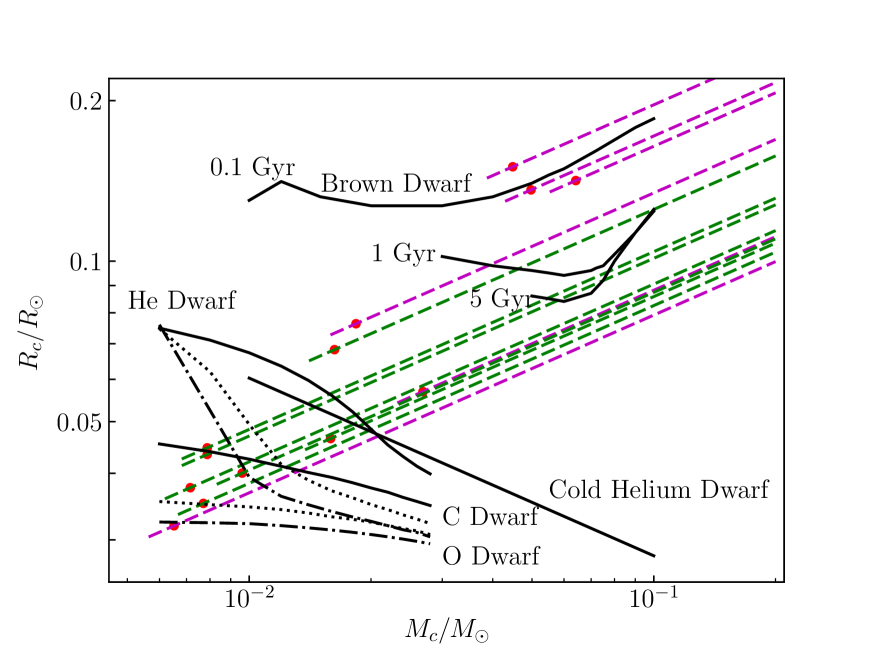
The non-detection of bursts in Swift J1756.92508 is likely a consequence of a low burst rate coupled with a low observational duty cycle in the X-ray observations, such that any bursts that might occur would fall within data gaps. The thermonuclear burst rate depends on the composition of the accreted fuel and the local mass accretion rate, , which, in turn, determine how much fuel must be accreted prior to ignition and the ignition depth. The known AMXPs can be divided into two distinct groups based on their orbital periods; either around 40 min or within the range of 2–11 h (see e.g., Campana & Di Salvo, 2018). Stellar evolution models predict that AMXPs with an orbital period longer than one hour should host a highly evolved, hydrogen-rich brown dwarf companion star, and the heating from steady burning of the accreted H fuel prior to ignition will lead to burst recurrence times of hours to days (see e.g., Galloway & Cumming, 2006; Heger et al., 2007; Falanga et al., 2011; Ferrigno et al., 2011; De Falco et al., 2017b, a; Li et al., 2018; Kuiper et al., 2020). However, “ultracompact” X-ray binaries (UCXBs) with orbital periods min are expected to have low-temperature C, O or He white dwarf companions, that is, hydrogen-poor, highly evolved dwarfs (Deloye & Bildsten, 2003). The mass-radius relation of AMXPs are shown in Fig. 9, by the assumption of a Roche lobe-filling companion (Paczyński, 1971). The corresponding versus relations for different stellar evolution models are also provided in Fig. 9. The expected burst recurrence time for such systems, even if reaching the same accretion rates during outbursts as the H-rich systems, are substantially lower, significantly reducing the chance of detecting bursts (e.g., Cumming, 2003).
We can roughly estimate the likely burst recurrence time based on the persistent flux of the source during the outburst The local mass accretion rate per unit area onto the NS is , i.e., and for the 2018 and 2019 outbursts, respectively. If the accreted matter is pure helium, the expected recurrence time for type-I X-ray bursts is , where is the ignition depth of a helium burst (see e.g., in’t Zand et al., 2007). For Swift J1756.92508, during its 2018 and 2019 outbursts, we estimate a burst recurrence time at the peak of the outburst of 30 d, longer than the total duration of the outbursts. If the accreted matter is composed of C and O, the X-ray bursts would be expected to occur at even larger ignition depths. We expect that the recurrence time should be much longer. Given recurrence times in excess of the outburst duration, it is questionable whether sufficient material would accrete to produce even a single burst.
While no type-I burst events were detected during outbursts of transient ultracompact AMXPs, including Swift J1756.92508, we note that some UCXBs can sustain accretion persistently and exhibit type I bursts (e.g Cumming, 2003; in’t Zand et al., 2007; Falanga et al., 2008). This property may explain the recent detection of a presumed type I X-ray burst in the AMXP MAXI J0911655 (Nakajima et al., 2020; Bult et al., 2020), and two intermediate duration X-ray bursts in IGR J170626143 (Degenaar et al., 2013; Keek et al., 2017). The transient AMXPs spend most of the time in a quiescent phase, with X-ray luminosities of erg s-1 corresponding to accretion rates that are likely far too low to produce thermonuclear bursts.
8 Summary
In this work, we analyze all public high-energy data and report the outburst profiles and the spectral and timing properties of Swift J1756.92508 observed by INTEGRAL, XMM-Newton, NuSTAR, NICER, and Insight-HXMT, during its 2018 and 2019 outbursts. We found these two outbursts showed quite similar behavior in several aspects. The outburst profiles showed a similar shape, which can be explained by the disk instability models. The broadband spectra – in the energy range of 1–250 keV for the brighter 2018 outburst and in the range of 1.5–80 keV for the fainter 2019 outbursts – were well fitted by the thermal Comptonization model compps with a similar set of parameters: the electron temperature –50 keV, Thomson optical depth , and blackbody seed photon temperature 0.7–0.8 keV. The spectral shape is very similar to those observed in many other AMXPs (Papitto et al., 2020).
We performed a coherent timing analysis for the 2018 and 2019 outbursts together. Pulsed emission has been detected from Swift J1756.92508 in the energy range of 1–10 keV using NICER and XMM-Newton data, in 3–60 keV using NuSTAR during both outbursts, and in the 5–100 keV range using Insight-HXMT during the 2018 outburst. We detected an increase of the pulse fraction from 4% to 7.5% from 1 to 5 keV saturating at higher energies. We found no evidence for a change in the spin frequency from our data set. Comparing the observed times of ascending node passage with the predicted values, we concluded that the binary system had a constant orbital period since the first outburst in 2007.
Swift J1756.92508 is the third LMXB that has exhibited pairs of closely-spaced outbursts, which (assuming a steady accretion rate onto the disk) must arise from incomplete accretion of the fuel accumulated in the disk, during the first outburst Hartman et al. (2011). Those authors explained the outburst pairs observed in IGR J00291+5934 as the result of a “quasi-propeller” regime, which shut off the accretion before the disk was exhausted. There are a number of differences between the outburst pairs in the two systems; in Swift J1756.92508 the pairs of outbursts were separated by 2.1 and 1.2 yr, whereas for the other systems, it was 30 d. IGR J00291+5934 has a brown dwarf donor, whereas Swift J1756.92508 probably has a He WD donor. Hence, the size and composition of the disk are very different in these two systems. Furthermore, IGR J00291+5934 rotates at 599 Hz, substantially faster than Swift J1756.92508 at 182 Hz; the other system exhibiting outburst pairs, XTE J1118+480, has a black hole primary.
While an assessment of the outburst behavior in Swift J1756.92508 in the context of the disk instability model is beyond the scope of this paper, the accumulated outburst history of the three sources that have been observed to exhibit such double outbursts appears to offer an excellent opportunity for a more in-depth and comprehensive comparison, which may provide significant new insights into the disk instability mechanism.
Acknowledgements.
We thank the anonymous referee for valuable comments. ZL thanks the International Space Science Institute in Bern for the hospitality. This work is supported by the National Key R&D Program of China (2016YFA0400800). ZL was supported by National Natural Science Foundation of China (U1938107, 11703021, U1838111, 11873041), and Scientific Research Fund of Hunan Provincial Education Department (18B059). JP and SST were supported by the grant 14.W03.31.0021 of the Ministry of Science and Higher Education of the Russian Federation and the Academy of Finland grants 317552, 322779, 324550, 331951, and 333112. SZ and SNZ were supported by National Natural Science Foundation of China (Nos. U1838201 and U1838202). This research has made use of data obtained from the High Energy Astrophysics Science Archive Research Center (HEASARC), provided by NASA’s Goddard Space Flight Center, and also from the HXMT mission, a project funded by the China National Space Administration (CNSA) and the Chinese Academy of Sciences (CAS).References
- Alpar et al. (1982) Alpar, M. A., Cheng, A. F., Ruderman, M. A., & Shaham, J. 1982, Nature, 300, 728
- Altamirano et al. (2010) Altamirano, D., Patruno, A., Heinke, C. O., et al. 2010, ApJ, 712, L58
- Arnaud (1996) Arnaud, K. A. 1996, in ASP Conf. Ser., Vol. 101, Astronomical Data Analysis Software and Systems V, ed. G. H. Jacoby & J. Barnes, 17
- Arzoumanian et al. (2014) Arzoumanian, Z., Gendreau, K. C., Baker, C. L., et al. 2014, in Society of Photo-Optical Instrumentation Engineers (SPIE) Conference Series, Vol. 9144, Space Telescopes and Instrumentation 2014: Ultraviolet to Gamma Ray, 914420
- Bachetti et al. (2020) Bachetti, M., Markwardt, C. B., Grefenstette, B. W., et al. 2020, ApJ, in press, arXiv:2009.10347
- Bildsten & Chakrabarty (2001) Bildsten, L. & Chakrabarty, D. 2001, ApJ, 557, 292
- Bozzo et al. (2016) Bozzo, E., Pjanka, P., Romano, P., et al. 2016, A&A, 589, A42
- Buccheri et al. (1983) Buccheri, R., Bennett, K., Bignami, G. F., et al. 1983, A&A, 128, 245
- Bult et al. (2018a) Bult, P., Altamirano, D., Arzoumanian, Z., et al. 2018a, ApJ, 864, 14
- Bult et al. (2020) Bult, P. M., Arzoumanian, Z., & Gendreau, K. C. 2020, The Astronomer’s Telegram, 13760, 1
- Bult et al. (2018b) Bult, P. M., Gendreau, K. C., Ray, P. S., et al. 2018b, The Astronomer’s Telegram, 11502, 1
- Bult et al. (2018c) Bult, P. M., Gendreau, K. C., Ray, P. S., et al. 2018c, The Astronomer’s Telegram, 11581, 1
- Campana & Di Salvo (2018) Campana, S. & Di Salvo, T. 2018, in ASSL, Vol. 457, The Physics and Astrophysics of Neutron Stars, ed. L. Rezzolla, P. Pizzochero, D. I. Jones, N. Rea, & I. Vidaña (Berlin, Heidelberg: Springer), 149–184
- Campana et al. (2003) Campana, S., Ravasio, M., Israel, G. L., Mangano, V., & Belloni, T. 2003, ApJ, 594, L39
- Cao et al. (2020) Cao, X., Jiang, W., Meng, B., et al. 2020, Science China Physics, Mechanics, and Astronomy, 63, 249504
- Chakraborty & Bhattacharyya (2018) Chakraborty, M. & Bhattacharyya, S. 2018, The Astronomer’s Telegram, 11566, 1
- Chen et al. (2020) Chen, Y., Cui, W., Li, W., et al. 2020, Science China Physics, Mechanics, and Astronomy, 63, 249505
- Courvoisier et al. (2003) Courvoisier, T. J.-L., Walter, R., Beckmann, V., et al. 2003, A&A, 411, L53
- Cumming (2003) Cumming, A. 2003, ApJ, 595, 1077
- De Falco et al. (2017a) De Falco, V., Kuiper, L., Bozzo, E., et al. 2017a, A&A, 603, A16
- De Falco et al. (2017b) De Falco, V., Kuiper, L., Bozzo, E., et al. 2017b, A&A, 599, A88
- Degenaar et al. (2013) Degenaar, N., Miller, J. M., Wijnands, R., Altamirano, D., & Fabian, A. C. 2013, ApJ, 767, L37
- Deloye & Bildsten (2003) Deloye, C. J. & Bildsten, L. 2003, ApJ, 598, 1217
- den Herder et al. (2001) den Herder, J. W., Brinkman, A. C., Kahn, S. M., et al. 2001, A&A, 365, L7
- Di Salvo & Sanna (2020) Di Salvo, T. & Sanna, A. 2020, arXiv e-prints, arXiv:2010.09005
- Falanga et al. (2005a) Falanga, M., Bonnet-Bidaud, J. M., Poutanen, J., et al. 2005a, A&A, 436, 647
- Falanga et al. (2008) Falanga, M., Chenevez, J., Cumming, A., et al. 2008, A&A, 484, 43
- Falanga et al. (2005b) Falanga, M., Kuiper, L., Poutanen, J., et al. 2005b, A&A, 444, 15
- Falanga et al. (2011) Falanga, M., Kuiper, L., Poutanen, J., et al. 2011, A&A, 529, A68
- Falanga et al. (2012) Falanga, M., Kuiper, L., Poutanen, J., et al. 2012, A&A, 545, A26
- Ferrigno et al. (2011) Ferrigno, C., Bozzo, E., Falanga, M., et al. 2011, A&A, 525, A48
- Frank et al. (2002) Frank, J., King, A., & Raine, D. J. 2002, Accretion Power in Astrophysics: Third Edition, 398
- Galloway et al. (2002) Galloway, D. K., Chakrabarty, D., Morgan, E. H., & Remillard, R. A. 2002, ApJ, 576, L137
- Galloway & Cumming (2006) Galloway, D. K. & Cumming, A. 2006, ApJ, 652, 559
- Galloway et al. (2020) Galloway, D. K., in’t Zand, J., Chenevez, J., et al. 2020, ApJS, 249, 32
- Galloway & Keek (2021) Galloway, D. K. & Keek, L. 2021, in ASSL, Vol. 461, Timing Neutron Stars: Pulsations, Oscillations and Explosions, ed. T. M. Belloni, M. Méndez, & C. Zhang (Berlin, Heidelberg: Springer), 209–262
- Galloway et al. (2005) Galloway, D. K., Markwardt, C. B., Morgan, E. H., Chakrabarty, D., & Strohmayer, T. E. 2005, ApJ, 622, L45
- Galloway et al. (2008) Galloway, D. K., Muno, M. P., Hartman, J. M., Psaltis, D., & Chakrabarty, D. 2008, ApJS, 179, 360
- Gierliński & Poutanen (2005) Gierliński, M. & Poutanen, J. 2005, MNRAS, 359, 1261
- Goldwurm et al. (2003) Goldwurm, A., David, P., Foschini, L., et al. 2003, A&A, 411, L223
- Gros et al. (2003) Gros, A., Goldwurm, A., Cadolle-Bel, M., et al. 2003, A&A, 411, L179
- Hartman et al. (2011) Hartman, J. M., Galloway, D. K., & Chakrabarty, D. 2011, ApJ, 726, 26
- Hartman et al. (2008) Hartman, J. M., Patruno, A., Chakrabarty, D., et al. 2008, ApJ, 675, 1468
- Hartman et al. (2009) Hartman, J. M., Patruno, A., Chakrabarty, D., et al. 2009, ApJ, 702, 1673
- Heger et al. (2007) Heger, A., Cumming, A., Galloway, D. K., & Woosley, S. E. 2007, ApJ, 671, L141
- Iaria et al. (2021) Iaria, R., Sanna, A., Di Salvo, T., et al. 2021, A&A, 646, A120
- in’t Zand et al. (2007) in’t Zand, J. J. M., Jonker, P. G., & Markwardt, C. B. 2007, A&A, 465, 953
- Kaaret et al. (2006) Kaaret, P., Morgan, E. H., Vanderspek, R., & Tomsick, J. A. 2006, ApJ, 638, 963
- Keek et al. (2017) Keek, L., Iwakiri, W., Serino, M., et al. 2017, ApJ, 836, 111
- King & Ritter (1998) King, A. R. & Ritter, H. 1998, MNRAS, 293, L42
- Krimm et al. (2007a) Krimm, H. A., Barthelmy, S. D., Barbier, L., et al. 2007a, The Astronomer’s Telegram, 1105, 1
- Krimm et al. (2018) Krimm, H. A., Barthelmy, S. D., Cummings, J. R., et al. 2018, The Astronomer’s Telegram, 11505, 1
- Krimm et al. (2007b) Krimm, H. A., Markwardt, C. B., Deloye, C. J., et al. 2007b, ApJ, 668, L147
- Kuiper et al. (2018) Kuiper, L., Tsygankov, S., Falanga, M., Galloway, D., & Poutanen, J. 2018, The Astronomer’s Telegram, 11603, 1
- Kuiper et al. (2020) Kuiper, L., Tsygankov, S. S., Falanga, M., et al. 2020, A&A, 641, A37
- Lebrun et al. (2003) Lebrun, F., Leray, J. P., Lavocat, P., et al. 2003, A&A, 411, L141
- Lewin et al. (1993) Lewin, W. H. G., van Paradijs, J., & Taam, R. E. 1993, Space Sci. Rev., 62, 223
- Li et al. (2018) Li, Z., De Falco, V., Falanga, M., et al. 2018, A&A, 620, A114
- Linares et al. (2008) Linares, M., Wijnands, R., van der Klis, M., et al. 2008, ApJ, 677, 515
- Liu et al. (2020) Liu, C., Zhang, Y., Li, X., et al. 2020, Science China Physics, Mechanics, and Astronomy, 63, 249503
- Lund et al. (2003) Lund, N., Budtz-Jørgensen, C., Westergaard, N. J., et al. 2003, A&A, 411, L231
- Markwardt et al. (2007) Markwardt, C. B., Krimm, H. A., & Swank, J. H. 2007, The Astronomer’s Telegram, 1108, 1
- Mazzola et al. (2018) Mazzola, S., Bozzo, E., Kuulkers, E., et al. 2018, The Astronomer’s Telegram, 11523, 1
- Mereminskiy et al. (2018) Mereminskiy, I. A., Grebenev, S. A., Krivonos, R. A., & Sunyaev, R. A. 2018, The Astronomer’s Telegram, 11497, 1
- Nakajima et al. (2020) Nakajima, M., Sugita, S., Serino, M., et al. 2020, The Astronomer’s Telegram, 13754, 1
- Ng et al. (2021) Ng, M., Ray, P. S., Bult, P., et al. 2021, ApJ, 908, L15
- Paczyński (1971) Paczyński, B. 1971, ARA&A, 9, 183
- Papitto et al. (2020) Papitto, A., Falanga, M., Hermsen, W., et al. 2020, New Astronomy Reviews, 91, 101544
- Papitto et al. (2013) Papitto, A., Ferrigno, C., Bozzo, E., et al. 2013, Nature, 501, 517
- Papitto et al. (2010) Papitto, A., Riggio, A., di Salvo, T., et al. 2010, MNRAS, 407, 2575
- Patruno et al. (2010) Patruno, A., Altamirano, D., & Messenger, C. 2010, MNRAS, 403, 1426
- Patruno et al. (2009a) Patruno, A., Markwardt, C. B., Strohmayer, T. E., et al. 2009a, The Astronomer’s Telegram, 2130, 1
- Patruno et al. (2009b) Patruno, A., Rea, N., Altamirano, D., et al. 2009b, MNRAS, 396, L51
- Patruno & Watts (2021) Patruno, A. & Watts, A. L. 2021, in ASSL, Vol. 461, Timing Neutron Stars: Pulsations, Oscillations and Explosions, ed. T. M. Belloni, M. Méndez, & C. Zhang (Berlin, Heidelberg: Springer), 143–208 (arXiv:1206.2727)
- Poutanen (2006) Poutanen, J. 2006, Advances in Space Research, 38, 2697
- Poutanen & Svensson (1996) Poutanen, J. & Svensson, R. 1996, ApJ, 470, 249
- Powell et al. (2007) Powell, C. R., Haswell, C. A., & Falanga, M. 2007, MNRAS, 374, 466
- Rai & Paul (2019) Rai, B. & Paul, B. C. 2019, MNRAS, 489, 5858
- Sanna et al. (2018a) Sanna, A., Bahramian, A., Bozzo, E., et al. 2018a, A&A, 610, L2
- Sanna et al. (2018b) Sanna, A., Ferrigno, C., Ray, P. S., et al. 2018b, A&A, 617, L8
- Sanna et al. (2017) Sanna, A., Papitto, A., Burderi, L., et al. 2017, A&A, 598, A34
- Sanna et al. (2019) Sanna, A., Pintore, F., Riggio, A., et al. 2019, The Astronomer’s Telegram, 12882, 1
- Sanna et al. (2018c) Sanna, A., Pintore, F., Riggio, A., et al. 2018c, MNRAS, 481, 1658
- Strohmayer & Bildsten (2006) Strohmayer, T. & Bildsten, L. 2006, in Compact stellar X-ray sources, Cambridge Astrophysics Series, No. 39, ed. W. Lewin & M. van der Klis (Cambridge: Cambridge University Press), 113–156
- Strohmayer et al. (2018) Strohmayer, T. E., Arzoumanian, Z., Bogdanov, S., et al. 2018, ApJ, 858, L13
- Strüder et al. (2001) Strüder, L., Briel, U., Dennerl, K., et al. 2001, A&A, 365, L18
- Turner et al. (2001) Turner, M. J. L., Abbey, A., Arnaud, M., et al. 2001, A&A, 365, L27
- Ubertini et al. (2003) Ubertini, P., Lebrun, F., Di Cocco, G., et al. 2003, A&A, 411, L131
- Wijnands (2006) Wijnands, R. 2006, in Trends in Pulsar Research, ed. J. A. Lowry, 53
- Wijnands & van der Klis (1998) Wijnands, R. & van der Klis, M. 1998, Nature, 394, 344
- Winkler et al. (2003) Winkler, C., Courvoisier, T. J.-L., Di Cocco, G., et al. 2003, A&A, 411, L1
- Zhang et al. (2020) Zhang, S.-N., Li, T., Lu, F., et al. 2020, Science China Physics, Mechanics, and Astronomy, 63, 249502