enhancement as a signature of chiral symmetry restoration in heavy ion collisions
Hae-Som Sung
ioussom@yonsei.ac.krDepartment of Physics and Institute of Physics and Applied Physics, Yonsei University, Seoul 03722, Korea
Sungtae Cho
sungtae.cho@kangwon.ac.krDivision of Science Education, Kangwon National
University, Chuncheon 24341, Korea
Juhee Hong
juhehong@yonsei.ac.krDepartment of Physics and Institute of Physics and Applied Physics, Yonsei University, Seoul 03722, Korea
Su Houng Lee
suhoung@yonsei.ac.krDepartment of Physics and Institute of Physics and Applied Physics, Yonsei University, Seoul 03722, Korea
Sanghoon Lim
shlim@pusan.ac.krDepartment of Physics, Pusan National University, Pusan, Korea
Taesoo Song
t.song@gsi.deGSI Helmholtzzentrum für Schwerionenforschung GmbH, Planckstrasse 1, 64291 Darmstadt, Germany
Abstract
Based on the fact that the mass difference between the chiral
partners is an order parameter of chiral phase transition and that
the chiral order parameter reduces substantially at the chemical
freeze-out point in ultra-relativistic heavy ion collisions, we
argue that the production ratio of over in such
collisions should be substantially larger than that predicted in
the statistical hadronization model. We further show that while
the enhancement effect might be contaminated by the relatively
larger decrease of meson than meson during the
hadronic phase, the signal will be visible through a systematic
study on centrality as the kinetic freeze-out temperature is
higher and the hadronic life time shorter in peripheral collisions
than in central collisions.
I Introduction
A recent lattice calculation finds the pseudo-critical temperature
for QCD chiral crossovers at zero baryon chemical potential to be
around MeV Bazavov:2018mes , a value that
is consistent with previous results Borsanyi:2010bp . This
temperature is close to the chemical freeze-out temperature
obtained from the statistical hadronization model analysis based
on the yields of hadrons produced in heavy ion collisions at both
Relativistic Heavy Ion Collider (RHIC) and Large Hadron Collider
(LHC) Andronic:2012dm ; Stachel:2013zma . Near this
temperature, the chiral order parameter associated with the
transition is substantially reduced from its vacuum value
Ding:2013lfa . While the quark condensate is the standard
chiral order parameter, so is the difference between the vector
and axial vector correlation function. That is to say, the mass
difference between the and is due to the chiral
symmetry breaking as is well represented in the Weinberg relation
Weinberg:1967kj . Hence, when hadrons are produced at the
chemical freeze-out point in heavy ion collisions, the chiral
partners will have masses much closer to each other than their
vacuum values. This does not mean that the masses should vanish at
the chemical freeze-out point. In fact, a recent study shows that
while chiral symmetry breaking is responsible for the mass
difference between the and meson, it only accounts
for a small fraction of the common mass Kim:2020zae .
Statistical hadronization model analysis indicates that the
abundances of hadrons are determined at the chemical freeze-out
point Andronic:2005yp . This suggests that the production of
chiral partners at the chemical freeze-out point will be similar.
Unfortunately, has a large vacuum decay width and a large
dissociation cross section so that many of the produced at
the chemical freeze-out will not survive during the hadronic
phase.
Indeed, the measured yields of resonances with large decay widths tend to be smaller than the
statistical hadronization model predictions.
On the other hand, recently it has been emphasized by one of us
that the and are also chiral partners and that both
have vacuum widths that are smaller than 100 MeV, making them ideal
objects to study the effects of partial chiral symmetry restoration in
a nuclear target experiment Song:2018plu . In this work, we
will show that the enhancement of the ratio in heavy ion
collisions can be used as a signature of chiral symmetry
restoration in the early stages of heavy ion collisions. Effects
of chiral symmetry restoration in heavy ion collisions were
studied in , ratios
Cassing:2015owa . Here, we will study the ratio as
their properties are direct order parameters of spontaneous
chiral symmetry breaking.
II couplings in an effective Lagrangian
From a symmetry argument alone, one expects to be the chiral
partner of . In fact, arguments based solely on chiral symmetry
predict that when chiral symmetry is restored, the vector
and axial particles become degenerate Lee:2019tvt . For
these effects to be observable in heavy ion collisions, the vacuum
widths as well as the hadronic dissociation of both vector and
axial particles should be small so that the signal will not be
smeared out during the hadronic phase. Since the vacuum widths of
both the and meson are already smaller than 100 MeV,
we focus here on their hadronic absorptions during the hadronic
phase as well as on the centrality dependence of these effects in
a heavy ion collision. Still, in order to work out the suppression
of the initially produced mesons during the hadronic phase of
heavy ion collisions, we need to estimate the hadronic cross
sections with other hadrons.
For that purpose, we use the Lagrangian involving spin-1 and
spin-0 mesons following the massive Yang-Mills approach
Meissner:1987ge :
(1)
where with
the octet of pseudoscalar mesons
and = 132 MeV. The covariant
derivative and the field strength tensor are given by
(2)
where
and with the vector and axial-vector
mesons and .
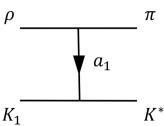
From the first term of Eq. (1), we can read off
the and the interaction terms.
(3)
Specifically,
(4)
with ,
and being the strange pseudoscalar, vector and
axial-vector meson isospin doublets, respectively. and
, with Pauli matrices , are the pion and
meson isospin triplets.
As it stands, the interaction terms for and
have a common coupling as given from Eq.
(3). This leads to a larger calculated decay width of
compared with that of , because the
phase space for the former two-body decay is larger than that for
the latter. On the other hand, experimentally one finds
MeV and
MeV. The resolution of
this puzzles comes from mixing effects. In the vacuum, the
low-lying modes that couple to the vector current are
and while those for the axial vector current are
and . There is a subtlety in the nature of
the two states: they are assumed to be a mixture of the
and quark-antiquark pair in the quark model
Suzuki:1993yc . We therefore introduce two mixing angles
and so that the chiral Lagrangian in Eq. (4) and (LABEL:eq:LagAVP) are
constructed for both and that
are related to the physical mesons as follows:
(6)
Now, we re-express the sum of the two chiral Lagrangians in terms of
and mesons and the two independent couplings
so that the SU(2) chiral symmetry is still preserved.
(7)
(8)
where
Using the above interaction Lagrangians, we determine the mixing
angle () and coupling constant
() to best fit the experimental data for the six
decay processes given in Table
1. The table also summarizes the best fit couplings and the
experimental data as well as the calculated decay widths of the
six processes.
ABC
3.17
0.9
2.9 (GeV)
(GeV)
0.649 (GeV)
(GeV)
(experiment)
50.0 (MeV)
15.6 (MeV)
37.8 (MeV)
5.2 (MeV)
14.4 (MeV)
163 (MeV)
(calculated)
48.4 (MeV)
14.8 (MeV)
39.7 (MeV)
14.7 (MeV)
9.42 (MeV)
98.6 (MeV)
Table 1: The coupling constants are calculated with =15.5, = -10.4, =0.6469, =0.7626, =0.724 and = -0.6898. With these parameters we also find four point couplings 7.67(GeV-1) and (GeV-1).
III The cross section of the meson
We assume that mesons are in thermal equilibrium when they
are produced at the chemical freeze-out. Then mesons
interact with other particles until the kinetic freeze-out point. We
consider the hadronic effect on the meson due to
interactions with light mesons such as pions and rho mesons;
, , , and . In addition to the interaction terms given in Eq. (7) and (8), the Lagrangian describing the
interaction between the meson and pions and rho mesons is
given as follows:
(10)
The coupling constant is determined by fitting the
experimental decay width of , from which we find
and
. In the strange vector and
axial-vector mesons, we apply the mixing angle and coupling
constants and , which were determined to give the coupling
constants as given in Table 1 and additionally ,
, and
(GeV).
(1-a)
(1-b)
(1-c)
(1-d)
(2-a)
(2-b)
(2-c)
(2-d)
(2-e)
(3-a)
(3-b)
(3-c)
(3-d)
(4-a)
(4-b)
(4-c)
(4-d)
(4-e)
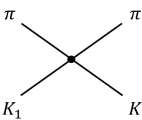
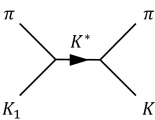
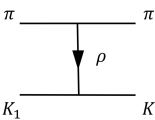
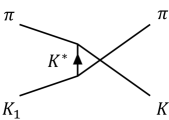
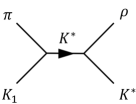
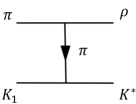
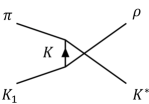
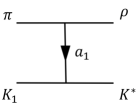
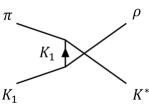
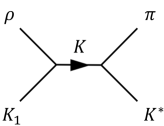
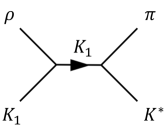
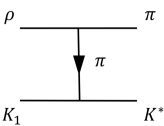
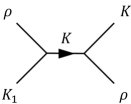
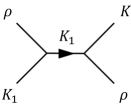
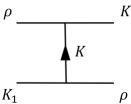
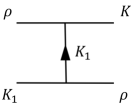
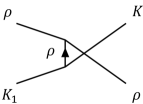
Figure 1: Feynman diagrams for the meson absorption by mesons. (1) , (2) , (3) and (4) .
The amplitude for each scattering of different charge
states can be written as two isospin channels because of isospin
conservation. For example, the scattering of consists of the following charge states :
,
,
, , and . These five processes are described by two
independent scattering amplitudes and for
isospin and channels, respectively, so that
(11)
It should be noted that squaring and adding all five amplitudes,
one finds that the sum is proportional to
reflecting the degeneracy of the isospin.
Using the interaction terms in the Lagrangian discussed above, we
evaluated the amplitudes for all diagrams shown in Fig.
1. These represent the absorption amplitudes of
the meson by and mesons. First, the
amplitudes for absorption by mesons are represented by
the processes and . The amplitude for definite isospin
channels of the are given as
and
for isospin 1/2 and 3/2, respectively. Here, , , and , where the subscript in the right hand side
represents the diagrams in Fig. 1. The matrix
elements are given as
The two independent amplitudes for the are respectively given as
and . Here,
and , with
Second, the amplitudes for absorption by mesons are and .
The isospin channels of are and . Here, , and
are given as follows:
(14)
The isospin channels of are
and . Here,
,
,
and are given as
follows:
We keep the convention where particles 1 and 2 stand for
initial-state mesons, and particles 3 and 4 stand for final-state
mesons shown on the left and right sides of the diagrams,
respectively. The Mandelstam variables ,
, and have also been
used.
To take into account the finite size of the hadrons when
calculating amplitudes, we introduce form factors shown below at
each interaction vertex for the channel and the
channel, respectively,
(16)
with being the mass of the exchanging particle at each
diagram. In Eq. (16) is the
squared three-momentum transfer at channels, and
is the total energy of the incoming particles at the
channel in the center of mass frame. On the other hand, we
apply the following form factor for the four point contact
interaction,
(17)
where is the average of the squared three-momenta from
the form factors for the given channels at each process. We set
the cut off parameter 1.8 GeV Brown:1991ig .
The cross section after spin averaging is given by
(18)
with being the squared amplitude of
all processes evaluated by averaging and summing over the
degeneracies of the initial and final particles, respectively.
in Eq. (18) represents for the three
momenta of the initial particles in the center of mass frame. Fig.
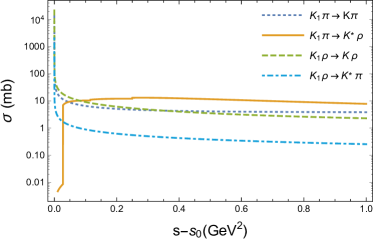
2 shows the cross section for the absorption of the
meson by and mesons.
Figure 2: The cross sections for the dissociation of the meson by and mesons via processes
,
,
and .
For the hadronic production cross section of the meson
during the hadronic stage in heavy-ion collisions, we will use
detailed balance relation in the rate equation.
IV Time evolution of the meson abundance
We now investigate the time evolution of the meson
abundance using the cross sections evaluated in the previous
section. We construct an evolution equation, similar to that in
Ref. Cho:2015qca , composed of densities and abundances for
mesons participating in all the processes shown in Fig.
2: the dissociation processes of are due to
and mesons.
(19)
with being the density of the light meson in the
hadronic phase at proper time .
, where is the volume of the hadronic
matter given in Eq. (V). The ones with the
superscript are the thermal abundance at temperature ,
which depends on the proper time as given in Eq.
(V).
(20)
where is the modified Bessel function of the second kind.
We take for pions and mesons.
We use the following two constraint equations involving the
dependence for the numbers of and .
(21)
(22)
where is a constant determined at the chemical freeze-out
point. Eq. (21) follows from neglecting strangeness
annihilation during the hadronic phase. BR=0.16 is the branching
ratio of decaying into so that the ratio in Eq.
(22) is the ratio between the final and numbers
when these mesons freeze-out at temperature . This equation is
motivated by the experimental observation that show the
approximately linear decrease in the observed ratio between
and numbers as a function of the cube root of multiplicity in
heavy ion collision Acharya:2019qge , which can be
understood in a hadronic model calculation Cho:2015qca
that finds the ratio to decreases linearly with the temperature of
the hadronic phase. The coefficients and b in Eq. (22)
were determined to reproduce the statistical model prediction for
the ratio at and its linear reduction to 0.158 at
MeV, which are the observed values for the ratio and the extracted
freeze-out temperature Acharya:2019yoi for the lowest and
highest centrality Pb-Pb collision Acharya:2019qge ,
respectively. 1.816 GeV-1 and 0.005444 are obtained
for the first scenario, where we assume that the number of
is equal to that of at the chemical freeze-out point,
whereas 2.272 GeV-1 and 0.04643 in the second
scenario, where we assume that both yields of and
follow statistical model values at the chemical freeze-out point.
Solving Eq. (19) with the two constraints given in
Eq. (21) and Eq. (22), we can determine the
dependence and the final freeze-out numbers of
.
When substituting in the rate equation, we take the degeneracy
factor , where is the spin, as the isospin
effect is taken into account in the cross section which includes
the contribution from all charge states. The production
contribution has been taken into account by a detailed balance
condition, which requires each square bracket in
Eq. (19) to be zero in thermal equilibrium.
In Eq. (19), we have considered the thermally averaged
cross section,
given below for initial two particles in a two-body process
,
(23)
with , and
being the modified Bessel function of the second kind. The integration limits are = .
Here, we approximate to be the Boltzmann momentum
distribution of a particle , . is the relative
velocity of particles of species and , .
is the thermally averaged decay width of the
meson Cho:2015qca .
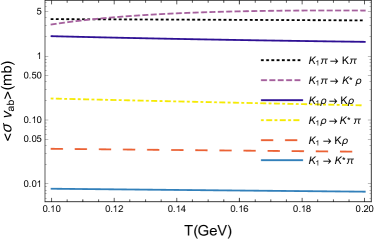
Figure 3: Thermally averaged cross sections for the absorption of a meson via processes , , , , , and .
V initial temperature and time evolution in heavy ion collision
The initial temperature inside the nuclear matter produced
from heavy ion collisions is studied with hydro simulation. We
will consider Pb-Pb collision at TeV in
different centrality ranges: 0–5 %, 40–50 % and 70–80 %. The
initial energy density in the transverse plane is calculated by
using a two-dimensional Gaussian distribution of
for each participating nucleon obtained
from the Monte Carlo Glauber framework Miller:2007ri . A
scale factor as a function of the number of participating nucleons
is multiplied to the initial density for a hydrodynamic evolution
with the sonic model Habich:2014jna . This tune is
required to match the multiplicity with the measured data in
various centrality ranges Adam:2016ddh .
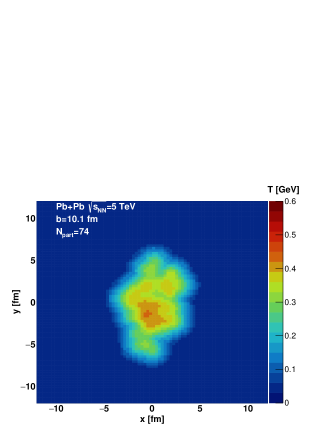
Figure 4 shows the initial temperature distribution at
of example events in three centrality
ranges from the hydrodynamic simulation. As can be seen in the
figure, the fraction of area where initial temperature is higher
than 156 MeV is 84 %, 75 %, and 67 % in the 0–5 %, 40–50 %,
and 70–80 % centrality ranges, respectively. Furthermore, the
fraction of initial energy that comes from regions where the
temperature is higher than 156 MeV is larger than 98% in all
three centrality ranges. Therefore we can assume that almost all
and are produced through the QGP phase even in 70–80
% central collisions.
Figure 4: Initial temperature distribution for example events in 0–5%, 40–50% and 70–80% centrality ranges of Pb-Pb collisions at TeV.
For calculation of the number of and mesons inside
the expanding medium, a more simple approach is used by assuming
an isentropic expansion of uniform matter as
follows Song:2010fk :
(24)
(25)
where is the energy momentum tensor in
the Milne coordinate system with , and being the fluid
velocity, energy density and pressure, respectively. is the
entropy density,
with being the radial velocity of fluid cell, with
being the transverse radius of the uniform matter and
denotes average over the transverse area.
Eq. (25) clearly shows that the total entropy is conserved
during the expansion with Lorentz contraction of transverse area
due to the flow velocity taken into account.
It should be noted that while the entropy conservation is a reasonable approximation for the QGP phase, the effect of larger viscosity has to be taken into account for the hadronic phaseDemir:2008tr .
While the simple hydrodynamic model could be supplemented through hadronic transport models to take into account the increase of entropy during the hadronic phaseXu:2017akx , we will leave such improvements for later study and neglect such effects in this work as the main tendency of the enhancement as a function of centrality will remain valid.
Assuming that the radial flow velocity is a linear function of the
radial distance from the center, i.e., , where and
, we then have Song:2010fk
(26)
Since the energy density and pressure are related by the
equation of state of the matter through its temperature
Borsanyi:2010cj , Eqs.(24)-(25)
are thus simultaneous equations for , .
The results of the numerical calculations can be
parametrized in the following form for the hadronic phase:
(27)
with and being the hadronization and kinetic
freeze-out temperature. We take = 156 to be the same
as the cross over temperature . Eq. (V)
can be thought to describe the system of the hadronic phase of the nuclear matter expanding with transverse velocity and transverse acceleration
starting from its transverse size at the chemical
freeze-out time . The values of according to
centrality are taken from Ref. Acharya:2019yoi . The values
used in Eq. (V) are summarized in Table
2.
The schematic hydrodynamics in Eqs. (24) - (26) assumes the expansion of a uniform matter whose temperature or particle density is the same anywhere in the local rest frame.
In the Lab. frame, however, the particle density increases with the radial distance due to Lorentz contraction.
We note that Eq. (27) is not the parametrization for the volume in the Lab frame but for the volume with the Lorentz contraction taken into account, that is, in Eq. (25).
Table 2: Values for the volume and temperature profiles in the phenomenological model Eq.(V).
Centrality
R
v
a
(%)
(MeV)
(fm/c)
(fm/c)
(fm)
(c)
()
90
8.7
28.1
14.9
0.93
0.04
0.835
108
4.9
13
7.8
0.78
0.052
0.9
147
2.2
2.9
4.43
0.481
0.161
0.847
VI The abundance of mesons in heavy-ion collisions
Table 3 shows the abundance of the strange mesons
at the chemical freeze-out point for different centrality ranges.
The yield ratio between the and mesons at the kinetic
freeze-out point is also given. is the solution of the
rate equation Eq. (19) with the initial number equal to
at MeV in the presence of chiral
symmetry restoration. On the other hand, is the
expected yield without chiral symmetry restoration when the
initial number is given by its thermal equilibrium number at
. Hence, at the kinetic freeze-out point is the
number expected in the statistical model when hadronic
dissociation is taken into account. For a clear signature of
chiral symmetry restoration at , we want at
the kinetic freeze-out temperature to be sufficiently larger than
at , which is the standard statistical
model prediction for the ratio.
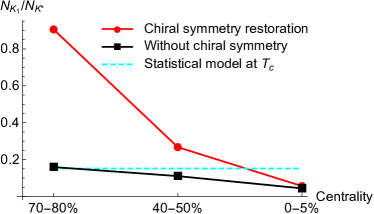
One notes that this is true for 40-50 % and
70-80 % centrality ranges. In fact, as can be seen in the last
column of Table 3, for 70-80 %, one finds that
at the kinetic freeze-out point is 0.905, which
is much larger than at any time for all
centralities: the time dependencies of and
are given in Fig. 5. Fig. 6
summarizes the yield ratios between and mesons for
different centralities with (red dots) and without (black
squares) chiral symmetry restoration at . As can be seen in
the figure, the ratio increases sharply as the centrality
decreases (because of the higher kinetic freeze-out temperature
and thus the shorter lifetime of the hadronic phase at more
peripheral collisions Cho:2015exb ; Motornenko:2019jha ) when
chiral symmetry restoration at is taken into account. It is
possible that at the chemical freeze-out point, the chiral order
parameter will partly acquire its vacuum value. Then, the initial
ratio of at would be slightly less than 1.
Furthermore, the number of pions and rho mesons should be larger than estimated in Eq. (20) due to the effective chemical potential during the hadronic phaseRapp:2000gy , leading to slightly larger dissociation cross sections than estimated in this work.
Nevertheless, the large increase in the yield ratio towards
peripheral collisions would still be visible so that one can
identify chiral symmetry restoration. Hence, a systematic study of
the ratio for different centralities in a heavy
ion collision will unambiguously show the evidence of chiral
symmetry restoration at .
Table 3: The kaon, and meson abundances under hadronic interaction at chemical and kinetic freeze out temperatures. is the number of meson assuming thermal equilibrium while is the abundance assuming chiral symmetry at . The last column shows our prediction when chiral symmetry is restored.
Centrality
T(MeV)
156
80.5
37.0
5.62
37.0
0.152
1.00
90
0.157
1.37
0.006
0.057
156
12.4
5.72
0.867
5.72
0.152
1.00
108
0.149
1.17
0.034
0.268
156
1.80
0.827
0.125
0.827
0.152
1.00
147
0.108
0.714
0.137
0.905
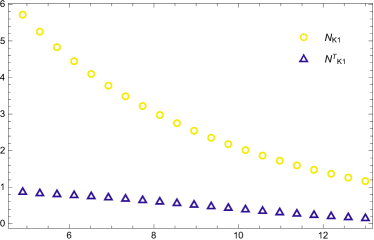
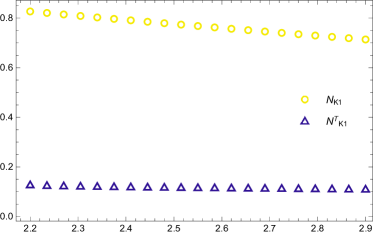
Figure 5: The time evolution of the meson abundance under hadronic interaction when the initial number is equal to (circle) or (triangle) at for 40-50%(upper graph) and 70-80%(lower graph) centrality ranges. Figure 6:
The yield ratio of over with and without chiral symmetry
restoration for 70-80%, 40-50%, and 0-5% centrality ranges. feed down to should be added when comparing to experiment.
VII Summary
We studied effects of chiral symmetry restoration at the chemical
freeze-out point in a relativistic heavy ion collision. As the
mass differences between the chiral partners are order parameters
of the chiral symmetry restoration, the production of the chiral
pairs will be degenerate at the chemical freeze-out point, where
the chiral order parameter is found to be substantially reduced
from the vacuum value in lattice calculations. For the effects to
be observable, the vacuum width as well as the hadronic
dissociation of both particles should be small so that the signal
will not be smeared out during the hadronic phase. The vacuum
widths of both the and meson are smaller than 100 MeV
and thus potential candidates to be studied. We have performed a
systematic study on their hadronic absorption during the hadronic
phase as well as on the centrality dependence
of these effects in a heavy ion collision. Our findings suggest
that while the anomalously large initial ratio between the
and meson compared to that of the statistical model
prediction will most likely be smeared out in a central collision,
the signal will be visible in a peripheral heavy ion collision due
to the shorter life time of the hadronic phase and higher
freeze-out temperature.
The chiral partnership between the and exists between
the same charge states when the baryon chemical potential is
non-zero Song:2018plu . In ultra-relativistic heavy ion
collisions, the initial state will have almost zero baryon chemical
potential. Hence, one can compare the production of any of the
charge states through the decay products given below or their
charge conjugation. For the meson they are
and for
A systematic study of the production of these states depending on the centrality will lead us
to identify chiral symmetry restoration in heavy ion collision.
Acknowledgments
This work was supported by Samsung Science and Technology
Foundation under Project Number SSTF-BA1901-04. S. Lim acknowledge
support from the National Research Foundation of Korea (NRF) grant
funded by the Korea government (MSIT) under Contract No.
NRF-2008-00458. S. Cho was supported by the National Research
Foundation of Korea (NRF) grant funded by the Korea government
(MSIT) (No. 2019R1A2C1087107).
References
(1)
A. Bazavov et al. [HotQCD],
Phys. Lett. B 795, 15-21 (2019).
(2)
S. Borsanyi et al. [Wuppertal-Budapest],
JHEP 09, 073 (2010).
(3) A. Andronic, P. Braun-Munzinger, K. Redlich and
J. Stachel, Nucl. Phys. A 904-905, 535c (2013).
(4) J. Stachel, A. Andronic, P. Braun-Munzinger and
K. Redlich, J. Phys. Conf. Ser. 509, 012019 (2014).
(5)
H. T. Ding, A. Bazavov, F. Karsch, Y. Maezawa, S. Mukherjee and P. Petreczky,
PoS LATTICE2013, 157 (2014).
(6)
S. Weinberg,
Phys. Rev. Lett. 18, 507 (1967).
(7)
J. Kim and S. H. Lee,
Phys. Rev. D 103, no.5, L051501 (2021).
(8) A. Andronic, P. Braun-Munzinger, J. Stachel,
Nucl. Phys. A 772, 167 (2006).
(9)
T. Song, T. Hatsuda and S. H. Lee,
Phys. Lett. B 792, 160-169 (2019).
(10)
W. Cassing, A. Palmese, P. Moreau and E. L. Bratkovskaya,
Phys. Rev. C 93, 014902 (2016).
(11)
S. H. Lee,
JPS Conf. Proc. 26, 011012 (2019).
(12)
U. G. Meissner,
Phys. Rept. 161, 213 (1988).
(13)
M. Suzuki,
Phys. Rev. D 47, 1252 (1993).
(14)
G. E. Brown, C. M. Ko, Z. G. Wu and L. H. Xia,
Phys. Rev. C 43, 1881-1892 (1991).
(15)
S. Cho and S. H. Lee,
Phys. Rev. C 97, no.3, 034908 (2018).
(16)
S. Acharya et al. [ALICE],
Phys. Lett. B 802, 135225 (2020)
(17)
M. L. Miller, K. Reygers, S. J. Sanders, and P. Steinberg,
Ann. Rev. Nucl. Part. Sci. 57, 205 (2007).
(18)
M. Habich, J. L. Nagle, and P. Romatschke, Eur. Phys. J. C 75, 15
(2015).
(19)
ALICE Collaboration, J. Adam, et al., Phys. Lett. B 772, 567
(2017).
(20)
T. Song, K. C. Han and C. M. Ko,
Phys. Rev. C 83, 024904 (2011).
(21)
N. Demir and S. A. Bass,
Phys. Rev. Lett. 102, 172302 (2009).
(22)
J. Xu and C. M. Ko,
Phys. Lett. B 772, 290-293 (2017).
(23)
S. Borsanyi, G. Endrodi, Z. Fodor, A. Jakovac, S. D. Katz, S. Krieg, C. Ratti and K. K. Szabo,
JHEP 11, 077 (2010).
(24)
S. Acharya et al. [ALICE],
Phys. Rev. C 101, no.4, 044907 (2020).
(25) S. Cho, T. Song and S. H. Lee, Phys. Rev. C 97, no. 2,
024911 (2018).
(26) A. Motornenko, V. Vovchenko, C. Greiner and H. Stoecker,
Phys. Rev. C 102, no. 2, 024909 (2020).
(27)
R. Rapp and E. V. Shuryak,
Phys. Rev. Lett. 86, 2980-2983 (2001).