Distance and mass of the NGC 253 galaxy group
Abstract
Two dwarf galaxies: WOC2017-07 and PGC 704814 located in the vicinity of the nearby luminous spiral galaxy NGC 253 were observed with the Advanced Camera for Surveys on the Hubble Space Telescope. Their distances of 3.620.18 Mpc and 3.660.18 Mpc were derived using the tip of the red giant branch method. These distances are consistent with the dwarf galaxies being members of the NGC 253 group. Based on the radial velocities and projected separations of seven assumed dwarf companions, we estimated the total mass of NGC 253 to be , giving a total-mass-to--luminosity ratio . A notable property of NGC 253 is its declined rotation curve. NGC 253 joins four other luminous spiral galaxies in the Local Volume with declined rotation curves (NGC 2683, NGC 2903, NGC 3521 and NGC 5055) that together have the low average total-mass-to-luminosity ratio, . This value is only 1/5 of the corresponding ratio for the Milky Way and M 31.
1 Introduction
Bright spiral galaxies in Sculptor constellation form a diffuse association marked by de Vaucouleurs (1959) and Arp (1985). According to Jerjen et al. (1998) and Karachentsev et al. (2003), these galaxies: NGC 24, NGC 45, NGC 55, NGC 247, NGC 253, NGC 300, NGC 7793 and their dwarf companions are located in a filamentary structure, which extends along the line of sight from the Local Group to a distance Mpc. The Sculptor filament itself lies in the Local Sheet (Tully 1988), residing also in the Local Supercluster plane. The central part of the filament is the group of dwarf galaxies around the luminous spiral NGC 253. At the apparent magnitude of (Jarrett et al. 2003) and the distance of 3.70 Mpc (Anand et al. 2021), the luminosity of NGC 253 corrected for Galactic and internal extinction is dex, that exceeds the luminosity of the Milky Way or M 31.
In the vicinity of NGC 253 within a radius of 15 Mpc) there are a dozen dwarf galaxies with radial velocities close to the radial velocity of NGC 253 of km s-1 (Koribalski et al. 2004). Accurate distances for most of them have been measured via the luminosity of the tip of red giant branch (TRGB) (Karachentsev et al. 2003; Cannon et al. 2003; Sand et al. 2014; Toloba et al. 2016). Only two assumed dwarf satellites of NGC 253: WOC2017-07 (Westmeier et al. 2017) and 2DFGRS-S431Z = PGC 704814 (Colless et al. 2003) have not had reliable distance estimates. In 2 we present estimates of their distances, made by the TRGB method from the images of these galaxies obtained with the Advanced Camera for Surveys (ACS) on the Hubble Space Telescope (HST). The distances measured by us confirm the association of both galaxies with the NGC 253 group. In 3, updated information on the group membership is used to evaluate the mass of the NGC 253 group.
2 TRGB distances to WOC2017-07 and PGC 704814
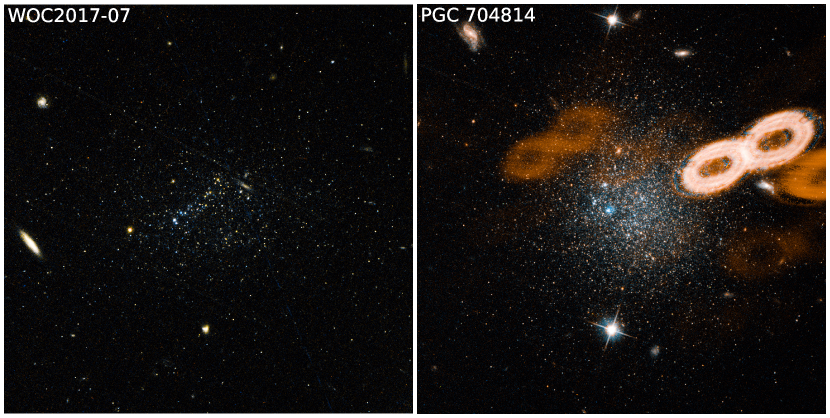
We obtained HST ACS imaging of WOC2017-07 and PGC 704814 in both F606W and F814W bands (760s each) as part of the Every Known Nearby Galaxy survey (SNAP-15922, PI R. Tully). Color cutouts of these two galaxies produced with this data are shown in Figure 1. Both galaxies contain visible young and older stellar populations. WOC2017-07 is irregular and lacks clear definition, whereas PGC 704814 is roughly spherical in shape with at least one very prominent young star cluster. The image for PGC 704814 contains numerous artifacts (“figure-eight ghosts”), that are caused by an extremely bright foreground star located in the ACS field of view (but not shown in the cutouts in Figure 1). For each galaxy, we used DOLPHOT (Dolphin 2000, 2016) to produce PSF photometry with the .flc images, using the drizzled F814W image as the alignment reference frame. We cull these photometric catalogs to ensure only resolved sources of the highest quality remain. For this work, we use the quality cuts modified from McQuinn et al. (2017), selecting stars with a signal-to-noise ratio 5 in both bands, type 2 (good or faint star), an error flag 0 (well-recovered stars), (, and (. Since the two dwarf galaxies only take up a small portion of the ACS field of view, we isolate the dwarfs to produce a color-magnitude diagram (CMD) that has reduced contamination from background objects.
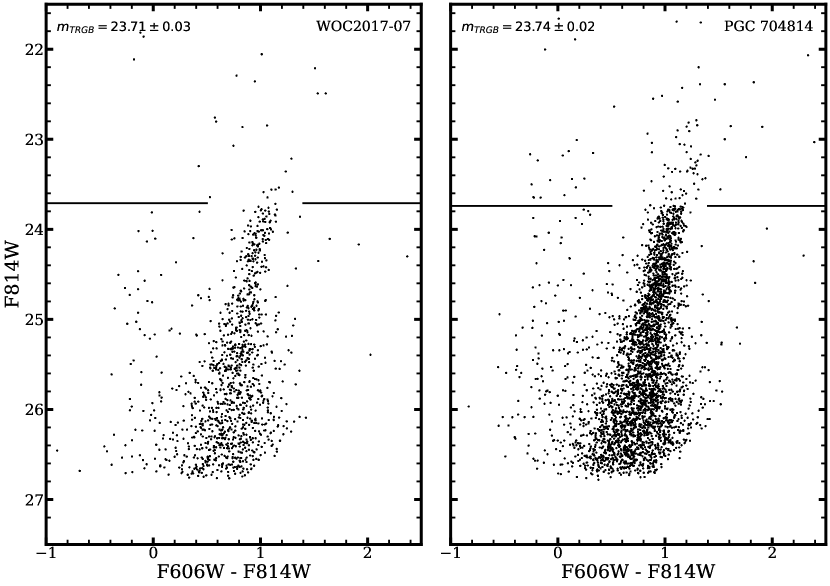
It is seen in Figure 2 that the main feature present in both of the CMDs is the red giant branch. Both galaxies also have a small population of upper main-sequence stars, indicating there is some ongoing star formation present in both targets. To determine the location of the TRGB, we use the methods described in detail by Makarov et al. (2006) and Wu et al. (2014). Briefly, we perform artificial star experiments with DOLPHOT to quantify the levels of photometric errors, bias, and completeness present in the measured photometry. The results from these experiments allow us to fit the observed luminosity function of red giant branch (RGB) and brighter asymptotic giant branch (AGB) stars with a broken power-law, with the break signifying the location of the TRGB. The physical reason for this parametrization lies in the fact that after undergoing the helium flash and leaving the TRGB, these stars immediately drop down on to the horizontal branch where they are significantly less luminous. This leaves a sharp break on the observed luminosity function at the location of the TRGB– an in-depth explanation of the method can be found in the original references (Makarov et al. 2006, Wu et al. 2014). We find 23.71 0.03 for WOC2017-07, and 23.74 0.02 for PGC 704814. The TRGB in the F814W band is slightly sensitive to the metallicity and age of the underlying stars, so we adopt the absolute magnitude and color calibration of the TRGB presented by Rizzi et al. (2007). Taking into account the (small) foreground extinction (Schlafly & Finkbeiner 2011), we find Mpc for WOC2017-07, and D 3.660.18 Mpc for PGC 704814. The reduced photometry, full-field CMDs, and list of underlying parameters are available on the CMDs/TRGB catalog of the Extragalactic Distance Database111edd.ifa.hawaii.edu (Jacobs et al. 2009; Anand et al. 2021).
3 The total mass of the NGC 253 group
A summary of data on 18 galaxies belonging to the NGC 253 group and its vicinity is presented in Table 1. Its columns contain: (1) galaxy name; (2) supergalactic coordinates; (3) morphological type on the de Vaucouleurs scale; (4) radial velocity in km s-1 relative to the Local Group centroid as given in HypeLEDA (Makarov et al. 2014, http://leda.univ-lyon1.fr) with the standard error; (5) galaxy distance in Mpc from Extragalactic Distance Database, EDD (Anand et al. 2021, http://edd.ifa.hawaii.edu); distances for Scl-MM-Dw1 and Scl-MM-Dw2 were derived by Sand et al. (2014) and Toloba et al. (2016), respectively; (6) method used to determine the distance; a typical error of distance measurement via TRGB is 5%; we also added in the table a dwarf galaxy of low surface brightness “SculptorSR” = GALEXASC J003351.79-275024.4 found by astro-amateur Sakib Rasool (personal information); judging by its texture the galaxy is a probable member of the NGC 253 group; (7) - band luminosity of galaxy in the units of solar luminosity given from Updated Nearby Galaxy Catalog (Karachentsev et al. 2013 (http://www.sao.ru/lv/lvgdb); (8) projected separation from NGC 253 in degrees; (9) projected searation in kpc assuming the galaxy is at the same distance as NGC 253; (10) the “tidal index”
where is a luminosity of the neighboring galaxy in the -band, is its separation from the neighbor; ranking the surrounding galaxies by the magnitude of their tidal force, . The most significant neighbor is the “Main Disturber”, MD, where the constant is chosen so that a galaxy with is located at the “zero velocity sphere” relative to its MD. Consequently, the unrelated galaxies with a negative are referred to as the population of the “general field”. (11) name of the Main Disturber; (12) orbital mass estimate via the given satellite, described below. All galaxies in Table 1 are ranked according to their angular separation from NGC 253.
As seen from Table 1, the luminosity of principal galaxy NGC 253 exceeds the luminosity of its neighbors by more than one order of magnitude. In a case when a group is dominated by one massive galaxy surrounded by a set of light test particles, one can use the “orbital” mass estimate (Karachentsev & Kudrya 2014):
Here, is the gravitation constant, e is the prevailing orbit eccentricity, and is the radial velocity difference of a companion “i” at the projected separation relative to the principal galaxy. Basing on N-body simulations, Barber et al. (2014) estimated the typical eccentricity value of that yields
or
where and are expressed in km s-1 and kpc, respectively. Individual values of derived via different companions are given in the last column of Table 1 in units of .
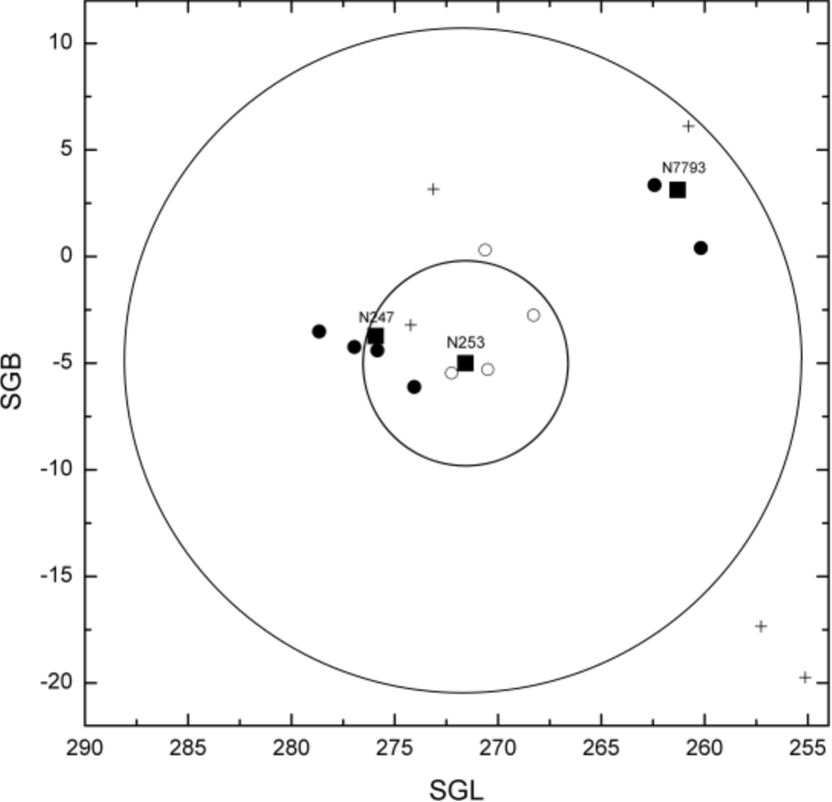
The distribution of galaxies in the vicinity of NGC 253 is presented in Fig.3 in supergalactic coordinates. Assumed satellites of NGC 253 with measured radial velocities are shown with solid symbols and assumed companions without radial velocities are indicated with open circles. The field galaxies with are shown with crosses. For a galaxy with the luminosity of , the typical virial radius is kpc, and the radius of zero-velocity sphere is (Tully 2015b). The minor and the major circles in Fig.3 corresponds to and . In the sphere of the gravitational dominance of NGC 253 (i.e. inside ) there are 8 satellites with measured radial velocities. For one of them, PGC 704814, the velocity error is too large and we ignore this galaxy. For the 7 remaining companions of NGC 253, the mean radial velocity difference is km s-1, the radial velocity dispersion is km s-1, and the mean projected separation is kpc. The average estimate of orbital mass via 7 satellites is , that yields the mass-to-luminosity ratio . The latter value is four times less than the ratios of ( for the Milky Way and for M 31 (Karachentsev & Kudrya 2014).
With such a low halo mass for NGC 253, the expected virial radius should not be 300 kpc, but rather 200 kpc (Tully 2015a). Then only 5 satellites are inside of the sphere of a radius kpc. For them, the dispersion of radial velocities, km/,s-1, and the orbital mass estimate, is little changed, although the average projected separation of 5 satellites drops to kpc. It should be noted that the location of these satellites appears to be very asymmetric with respect to the principal galaxy.
Interestingly, the field galaxies with around NGC 253 follow the cold unperturbed Hubble flow with the Hubble parameter km s-1Mpc-1 and km s-1. According to Karachentsev et al. (2003), the Hubble flow around NGC 253 is characterized by the zero-velocity radius Mpc, which corresponds to the total mass of the group in agreement with the mass estimate via internal (orbital) motions.
Lucero et al. (2015) performed HI observations of NGC 253 with the Karoo Array Telescope and determined its rotation curve out to the projected separation of kpc from the galaxy center. These observations show that the rotation velocity reaches a maximum of km s-1 at kpc, and than decreases systematically down to 185 km s-1. A similar result was obtained earlier by Hlavacek-Larrondo et al. (2011) from observations in the H and [NII] lines using Fabry-Perot interferometry. The declining rotation curve of NGC 253 can serve as an independent indication of a small size for the halo of this galaxy.
NGC 253 is not the only case of a luminous spiral galaxy with a falling rotation curve at the periphery. Casertano & van Gorkom (1991) and Zobnina & Zasov (2020) identified four more such galaxies in the Local Volume: NGC 2683, NGC 2903, NGC 3521 and NGC 5055. All of these are located in areas of low cosmic density and have a small number of dwarf satellites. Karachentsev et al. (2020) estimated orbital masses of these galaxies, using radial velocities and separations of their companions. Data on 5 galaxies in the Local Volume with declined rotation curves are presented in Table 2. As one can see, all these spirals are characterized by high luminosities and low relative masses of their dark halos. The average dispersion of radial velocities of their satellites is 46 km s-1 at the average projected separation of 225 kpc. The low average value of is comparable to the cosmic baryon abundance, at the stellar mass-to-- luminosity ratio of (Bell et al. 2003).
It is implied that the galaxies with a declined rotation curve form a special category among the spiral galaxies of high luminosity. In the Local Volume with the distance Mpc there are 19 spiral galaxies with the luminosity . If we exclude five galaxies seen nearly face-on with indefinite rotation curves: NGC 628, IC 342, NGC 3184, M 101 and NGC 6946, then the relative number of cases with quasi- Keplerian is 36%.
Zobnina & Zasov (2020) noted that spiral galaxies with a declined rotation curve do not deviate from the general Tully-Fisher relation, vs. , if used as an argument, and not . Cosequently, the identification of galaxies with relatively low mass dark halos is a nontrivial observational problem, requiring data on the kinematics of their distant periphery.
4 Concluding remarks
We measured accurate TRGB-distances of 3.62 Mpc and 3.66 Mpc for WOC2017-07 and PGC 704814, respectively, two dwarf galaxies in the vicinity of the bright spiral galaxy NGC 253, confirming their physical association with NGC 253 at 3.70 Mpc. Basing on the data on radial velocities and separations of 7 salellites of NGC 253, we determined its ratio of the total (orbital) mass to K- band luminosity, , which is 34 times less than the analogous ratio for the Milky Way or M 31. A notable feature of NGC 253 is the presence of a descending rotation curve at the periphery. This feature is shown by 4 more galaxies in the Local Volume: NGC 2683, NGC 2903, NGC 3521 and NGC 5055. All of them are characterized by a low radial velocity dispersion of satellites, km s-1, and a low mass of dark halo, . The mean total mass-to-- luminosity ratio for them is ( on the scale of kpc.
It is suggested that there is a special population of galaxies with quasi-Keplerian rotation curves, which are found mainly in regions of low cosmic density. In the Local Volume, their relative number is 1/3 among luminous spiral galaxies. The dark halos of these galaxies appear to be restricted in mass an extent.
Recently, Correa & Schaye (2020) and Seo et al. (2020) studied the dark-to-stellar mass ratio, , depending on the morphology of galaxies from Sloan Digital Sky Survey. Both teams reported systematically lower values of for disc-dominated (blue) galaxies than bulge- dominated (red) ones. A similar effect was found for 2MASS isolated galaxies by Karachentseva et al. (2011). Correa & Schaye (2020) explain this difference by the assumption that the stellar discs are more massive because they had more time for gas accretion and star formation. Also, according to Seo et al. (2020), “the system velocity dispersion of satellite galaxies show a remarkably tight correlation with the central velocity dispersion of their primary galaxies for both red and blue samples.” The study of the relationship between the kinematics of satellites and inner kinematics of isolated luminous galaxies seems to be an important observational problem.
Acknowledgements. This work is based on observations made with the NASA/ESA Hubble Space Telescope. STScI is operated by the Association of Universities for Research in Astronomy, Inc. under NASA contract NAS 5-26555. IDK is suported by RNF grant 19-12-00145.
References
Anand, G.S., Rizzi, L., Tully, R.B., et al., 2021, in preparation
Arp H., 1985, Astron. J. 90, 1012
Barber C., Starkenburg E., Navarro J.F., et al, 2014, MNRAS, 437, 959
Bell E.F., McIntosh D.H., Katz N., Weinberg M.D., 2003, ApJ Suppl., 149, 289
Cannon J.M., Dohm-Palmer R.C., Skillman E.D., et al, 2003, AJ, 126, 2806
Casertano S., van Gorkom J.H., 1991, AJ, 101, 1231
Colless, M., Peterson, B.A., Jackson, C.A. et al. 2003, arXiv:2003.6581
Correa C.A., Schaye J., 2020, MNRAS, 499, 3578
de Vaucouleurs G., 1959, Astrophys. J. 130, 718
Dolphin, A.E. 2000, PASP, 112, 1383
Dolphin, A.E. 2016, DOLPHOT: Stellar photometry, ascl:1608.013
Hlavacek-Larrondo J., Carignan C., Daigle O., et al, 2011, MNRAS, 411, 71
Jacobs, B.A., Rizzi, L., Tully, R.B., et al., 2009, AJ, 138, 332
Jarrett, T. H.; Chester, T.; Cutri, R.; Schneider, S. E.; Huchra, J. P., 2003, Astron. J. 125, 525
Jerjen H., Freeman K.C., Binggeli B., 1998, Astron. J. 116
Karachentsev I.D., Neyer F., Spani R., Zilch T., 2020, AN, 341, 1037
Karachentsev I.D., Kudrya Y.N., 2014, AJ, 148, 50
Karachentsev I.D., Makarov D.I., Kaisina E.I.2013, Astron. J., 145, 101
Karachentsev I.D., Grebel E.K. Sharina M.E., et al, 2003, A&A, 404, 93
Karachentseva V.E., Karachentsev I.D., Melnyk O.V., 2011, AstBu, 66, 389
Koribalski, B.S., Staveley-Smith, L., Kilborn, V.A. et al., 2004, Astron. J., 128, 16
Lucero D.M., Carignan C., Elson E.C., et al, 2015, MNRAS, 450, 3935
Makarov, D.I., Makarova, L.N., Rizzi, L. et al., 2006, AJ, 132, 2729
Makarov, D.I., Prugniel P., Terekhova N., et al, 2014, A&A, 570A, 13
McQuinn, K.B.W., Skillman, E.D., Dolphin, A.E., Berg, D., Kennicutt, R., 2017, AJ, 154, 51
Rizzi, L., Tully, R.B., Makarov, D.I. et al. 2007, ApJ, 661, 815
Sand D.J., Crnojevich D., Strader J., et al, 2014, ApJ, 793L, 7
Schlafly, E.F., Finkbeiner, D.P. 2011, ApJ, 737, 103
Seo G., Sohn J., Lee M.G., 2020, ApJ, 903, 130
Toloba E., Sand D.J., Spekkens K., et al, 2016, ApJ, 816L, 5
Tully R.B., 1988, Nearby Galaxy Catalog, Cambridge Univ. Press
Tully, R.B., 2015a, Astron. J. 149, 54
Tully, R.B., 2015b, Astron. J. 149, 171
Westmeier T., Obreschkow D., Calabretta M., et al, 2017, MNRAS, 472, 4832
Wu, P.-F., Tully, R.B., Rizzi, L. et al. 2014, AJ, 148, 7
Zobnina D.I., Zasov A.V., 2020, Astronomy Reports, 64, 295
| Name | SGL SGB | T | e | D | meth | MD | |||||
|---|---|---|---|---|---|---|---|---|---|---|---|
| (1) | (2) | (3) | (4) | (5) | (6) | (7) | (8) | (9) | (10) | (11) | (12) |
| NGC 253 | 271.5705.01 | 5 | 2762 | 3.70 | trgb | 10.98 | 0 | 0 | 0.1 | N 247 | |
| Scl-MM-Dw2 | 272.2505.47 | 2 | 3.12 | trgb | 7.36 | 0.82 | 53 | 0.7 | N 253 | ||
| Scl-MM-Dw1 | 270.5005.30 | 2 | 3.94 | trgb | 6.77 | 1.11 | 72 | 1.8 | N 253 | ||
| WOC2017-07 | 274.0606.12 | 10 | 288 5 | 3.62 | trgb | 6.17 | 2.73 | 176 | 2.1 | N 253 | 0.3 |
| DDO 226 | 274.2303.21 | 10 | 412 2 | 4.92 | trgb | 7.71 | 3.21 | 207 | 0.3 | N 253 | |
| SculptorSR | 268.2802.75 | 10 | 3.70 | mem | 6.36 | 3.99 | 258 | 1.2 | N 253 | ||
| DDO 6 | 275.8404.40 | 10 | 347 2 | 3.43 | trgb | 7.08 | 4.31 | 278 | 1.3 | N 253 | 16.5 |
| NGC 247 | 275.9203.73 | 7 | 210 2 | 3.71 | trgb | 9.50 | 4.53 | 293 | 1.6 | N 253 | 15.1 |
| Sc 22 | 270.6200.31 | 3 | 4.29 | trgb | 7.15 | 5.40 | 349 | 0.5 | N 253 | ||
| ESO 540-032 | 276.9504.24 | 10 | 285 7 | 3.63 | trgb | 6.83 | 5.43 | 351 | 1.4 | N 247 | 0.3 |
| KDG 2 | 278.6603.52 | 10 | 290 7 | 3.56 | trgb | 6.85 | 7.24 | 468 | 1.0 | N 253 | 1.1 |
| NGC 59 | 273.1303.16 | 3 | 431 2 | 4.90 | trgb | 8.66 | 8.32 | 537 | 0.4 | N 253 | |
| PGC 704814 | 262.4203.35 | 10 | 29989 | 3.66 | trgb | 6.90 | 12.39 | 800 | 2.1 | N7793 | (4.2) |
| ESO 349-031 | 260.1800.40 | 10 | 234 3 | 3.21 | trgb | 7.12 | 12.61 | 814 | 0.2 | N 253 | 17.0 |
| NGC 7793 | 261.3003.12 | 6 | 250 2 | 3.71 | trgb | 9.70 | 13.10 | 846 | 0.2 | N 253 | 6.7 |
| UGCA 442 | 260.7806.11 | 8 | 300 6 | 4.36 | trgb | 8.03 | 15.49 | 1000 | 0.3 | N 253 | |
| NGC 625 | 257.2717.34 | 8 | 320 6 | 4.02 | trgb | 8.96 | 18.88 | 1219 | 0.3 | N 253 | |
| ESO 245-005 | 255.1319.74 | 9 | 307 2 | 4.57 | trgb | 8.53 | 24.39 | 1575 | 0.7 | N 253 |
Note: (1) galaxy name; (2) supergalactic coordinates; (3) morphological type on the de Vaucouleurs scale; (4) radial velocity in km s-1 relative to the Local Group centroid; (5) galaxy distance in Mpc; (6) method used to determine the distance; (7) - band luminosity of galaxy in the units of solar luminosity; (8) projected separation from NGC 253 in degrees; (9) projected separation in kpc; (10) the “tidal index” ; (11) name of the Main Disturber; (12) orbital mass estimate via the given satellite.
| Name | Type | D | ||||||
|---|---|---|---|---|---|---|---|---|
| NGC 253 | 5 | 3.70 | 10.98 | 7 | 42 | 465 | 11.91 | 8.52.7 |
| NGC2683 | 3 | 9.82 | 10.81 | 2 | 43 | 49 | 11.09 | 1.91.3 |
| NGC2903 | 4 | 8.87 | 10.82 | 4 | 45 | 198 | 11.68 | 7.36.4 |
| NGC3521 | 4 | 10.70 | 11.09 | 2 | 46 | 198 | 11.77 | 4.84.0 |
| NGC5055 | 4 | 9.04 | 11.00 | 4 | 54 | 216 | 11.71 | 5.11.8 |
| Mean | 4 | 8.43 | 10.94 | 4 | 46 | 225 | 11.63 | 5.51.1 |
Note: (1) galaxy name; (2) morphological type on the de Vaucouleurs scale; (3) galaxy distance in Mpc; (4) - band luminosity of galaxy in the units of solar luminosity; (5) number of companions with measured velocities; (6) velocity dispersion of companions in km s-1; (7) mean separation of companions in kpc; (8) log mass of group from orbital dynamics in solar masses; (9) ratio of orbital mass to K band luminosity in solar units