Thermoresponsivity of poly(N-isopropylacrylamide) microgels in water-trehalose solution and its relation to protein behavior
Abstract
Hypotheses: Additives are commonly used to tune macromolecular conformational transitions. Among additives, trehalose is an excellent bioprotectant and among responsive polymers, PNIPAM is the most studied material. Nevertheless, their interaction mechanism so far has only been hinted without direct investigation, and, crucially, never elucidated in comparison to proteins. Detailed insights would help understand to what extent PNIPAM microgels can effectively be used as synthetic biomimetic materials, to reproduce and study, at the colloidal scale, isolated protein behavior and its sensitivity to interactions with specific cosolvents or cosolutes. Experiments: The effect of trehalose on the swelling behavior of PNIPAM microgels was monitored by dynamic light scattering; Raman spectroscopy and molecular dynamics simulations were used to explore changes of solvation and dynamics across the swelling-deswelling transition at the molecular scale. Findings: Strongly hydrated trehalose molecules develop water-mediated interactions with PNIPAM microgels, thereby preserving polymer hydration below and above the transition while drastically inhibiting local motions of the polymer and of its hydration shell. Our study, for the first time, demonstrates that slowdown of dynamics and preferential exclusion are the principal mechanisms governing trehalose effect on PNIPAM microgels, at odds with preferential adsorption of alcohols, but in full analogy with the behavior observed in trehalose-protein systems.
keywords:
Poly(N-isopropylacrylamide) (PNIPAM) , microgels , trehalose , cosolvents and cosolutes , lower critical solution temperature (LCST) , volume phase transition , biomimetic material , bioprotection , hydration water1 Introduction
The conformation of synthetic and biological macromolecules is known to exhibit a remarkably strong dependence on temperature and other environmental conditions, such as the presence of additives in the solvent. The example par excellence in biology is the denaturation of proteins, for which even a minor change of temperature may result in an abrupt change of structure and loss of biological activity. In globular proteins the destruction of the native functional conformation sometimes gives rise to a fully unfolded (random coil) state, but in a number of cases occurs through partially unfolded states, which are compact and preserve the general architecture of the native structure [1]. It is well-known that such conformational transitions of proteins in solution are strongly affected by the interaction with cosolvents or cosolutes, which perform, and are able to tune, biologically relevant functions such as cryoconservation, bioprotection, stabilization, denaturation, to name a few [2]. On the other hand, temperature-induced coil-globule transitions also occur in synthetic macromolecules, the simplest case being that of homopolymers like poly(-isopropylacrylamide) (PNIPAM). This polymer, dispersed in water, undergoes a reversible transition at a lower critical solution temperature (LCST, 305 K) from a coil conformation of the chains for LCST to a globule conformation above it. Such intramolecular collapse is also highly sensitive to the presence of additives, with the LCST being shifted by organic molecules [3, 4, 5], salts [6, 7, 8], osmolytes [9, 10, 11, 12, 13], ionic liquids [14], and proteins [15]. Additives affect the thermoresponsivity of PNIPAM-based copolymers as well [16, 17, 18]. Moreover, some experiments have shown that PNIPAM displays additional ‘protein-like’ behavioral traits, such as a cooperative character of the coil-globule transition [19] and the occurrence of a dynamical transition at low temperature [20]. Altogether, these features make PNIPAM potentially very useful as a synthetic biomimetic material, that could be employed as a simplified model to elucidate phenomena of high biological relevance. In this context, it would be crucial to shed light on the extent to which PNIPAM is capable of mimicking the protein sensitivity to the interaction with specific cosolvents or cosolutes.
To this aim, in the present study we focus on trehalose, an excellent bioprotectant, and use PNIPAM microgels to mimic the complex macromolecular environment of globular proteins, determining whether the additive-induced effects on PNIPAM microgels and proteins in solution occur via similar molecular mechanisms. Microgels are cross-linked polymer networks of colloidal size, in which the temperature-induced coil-globule transition of the constituent polymer chains reflects into a drastic volume change, i.e. an ability to swell and deswell (so-called volume phase transition) [21]. Owing to the combination of being responsive while still having a stable crosslinked architecture these particles are, on one hand, particularly suited to represent a globular protein during the unfolding process and, on the other hand, able to amplify the effect of trehalose on PNIPAM-water interactions on a colloidal scale, by making it visible through the effect on the microgel hydrodynamic size.
Trehalose is a natural disaccharide, whose outstanding bioprotective capabilities have long been recognized and increasingly used as a way of preserving the biological activity of proteins and enzymes under physicochemical stress conditions that would normally promote lability or denaturation, such as cryogenic temperatures [22], heating [23], presence of chemicals [24], or dehydration [25]. Several studies contributed over the years to shed light on the molecular mechanisms governing the trehalose effectiveness in preserving the functional conformation of proteins in solution [26, 27], making it clear that the extent of preferential exclusion of the sugar from the protein hydration shell, linked to protein preferential hydration [28, 29, 26], and the slowdown caused to local motions of the protein and to its hydration water are the major contributing factors [30, 31, 32]. Recent studies on lysozyme [33, 34, 35] have shown that these mechanisms may be associated, upon cooling, to a remarkably enhanced slowdown of water molecules located in proximity to the protein surface, an effect that inhibits ice formation and facilitates vitrification without biological damage, therefore providing clues as to how a cryoprotectant action of trehalose is also possible.
Aqueous PNIPAM ternary systems have so far been studied by means of various techniques and for a number of additives, yet this work represents the first direct investigation of the PNIPAM-trehalose interaction mechanism. Previous studies in water-trehalose mixture are scarce and only concerned linear PNIPAM chains, where a decrease of LCST, and hence the promotion of the globular compact state of the polymer, on increasing trehalose molar concentration was found to be more pronounced than in presence of other sugars [9, 36]. In this work we monitor the volume phase transition of PNIPAM microgels comparatively in water and in water-trehalose mixture at 0.72 M sugar concentration, a value that is able to significantly lower the polymer LCST compared to that in water, and that falls well within the range of concentrations used to investigate the trehalose stabilization effect of proteins in solution [29, 26]. Microgels are synthesized with low crosslinking degree, to have a high swelling capacity [37], and with a small size (less than 50 nm in hydrodynamic radius at room temperature [38, 39]), to minimize heterogeneity of the internal structure. By combining dynamic light scattering (DLS) and Raman spectroscopy (RS) experiments with all-atom molecular dynamics (MD) simulations, we correlate the conformational transition of the particles detected at the colloidal length scale with changes of structural and dynamical properties, probed at the atomic scale. In particular RS measurements, sensitive to the solvation pattern and intramolecular bonding of microgels, are complemented by simulations which are able to elucidate the influence of trehalose on the water affinity for PNIPAM, the specific and selective interactions, if any, of the sugar with the polymer and, very importantly, how the presence of trehalose affects the dynamics of the system, including polymer, bulk and hydration water. We find that strongly hydrated trehalose molecules mainly develop water-mediated interactions with PNIPAM microgels, making trehalose preferentially excluded from the polymer surface, especially in the swollen state. Preferential exclusion coexists with the binding of some trehalose to the polymer, which occurs, however, without interfering with the hydration pattern of the microgel network. Hydration is preserved both before and after the transition, in a way that the amount of absorbed water remains the same as without trehalose, and the composition of the absorbed solvent remains unaffected by the conformational transition of the particles. Meanwhile, sugar molecules also stabilize microgels by drastically inhibiting local motions of the polymer and of its hydration shell, as well as by increasing the residence time of water in the polymer surrounding. Overall, the present results highlight that trehalose promotes the collapsed conformation of PNIPAM microgels similarly to the way it stabilizes aqueous proteins in their native globular state. It also induces molecular mechanisms that are similar to those governing its own action against protein damage during freezing. This confirms and extends the use of PNIPAM as a suitable biomimetic material of a synthetic nature.
2 Materials and Methods
2.1 Materials
The monomer -isopropylacrylamide (NIPAM) (=113.16, Sigma-Aldrich, 97 purity) and the crosslinker ,’-methylene-bis-acrylamide (BIS) (=154.17, Eastman Kodak, electrophoresis grade) were purified by recrystallization from hexane and methanol, respectively, then dried under reduced pressure (0.01 mmHg) at room temperature and stored at 253 K until use. The surfactant sodium dodecyl sulphate (SDS) (=288.372, 98 purity), the initiator potassium persulfate (KPS) (=270.322, 98 purity) and all solvents (RP grade) were purchased from Sigma-Aldrich and used as received. Ultrapure water (resistivity: 18.2 M/cm at 298 K) was obtained with a Millipore Direct-Q® 3 UV purification system. Dialysis tubing cellulose membrane (Sigma-Aldrich), 14 kDa molecular weight cut-off, was cleaned before use in running distilled water for 3 hours, treated in a solution of sodium hydrogen carbonate (NaHCO3, 3.0 wt) and ethylenediaminetetraacetic acid (EDTA, 0.4 wt) at 343 K for 10 min, rinsed in distilled water at 343 K for 10 min and finally in fresh distilled water at room temperature for 2 h.
2.2 Synthesis of PNIPAM microgels
Microgels were synthesized by precipitation polymerization in a 2000 mL four-necked jacked reactor equipped with condenser and mechanical stirrer. Proper amounts of NIPAM (24.16(2) g), BIS (0.448(0) g) and SDS (3.519(0) g) were dissolved in 1560 mL of ultrapure water and transferred into the reactor, where the solution was deoxygenated by bubbling nitrogen for 1 h and then heated at K. KPS (1.037(6) g, dissolved in 20 mL of deoxygenated water) was added to initiate the polymerization, and the reaction was carried out for 16 h. The resultant PNIPAM microgel particles were purified by dialysis against distilled water with frequent water change for 2 weeks, and then lyophilized to constant weight.
Since the SDS concentration (7.72 mM) was slightly below the critical micelle concentration (8.18 mM), small nanosized microgels were obtained [21]. In contrast to bigger microgels, characterized by a heterogeneous structure with a dense core and a loose corona, the small-sized microgels have an almost uniform radial crosslinker density [38, 39]. The average chain length between crosslinking points is about 37 PNIPAM residues. As the size of a trehalose molecule is comparable to that of three/four PNIPAM repeating units (see sec. below), the mesh size of the microgel network does not hinder the disaccharide to permeate the particles.
2.3 Preparation of microgel suspensions
Lyophilized PNIPAM microgels were re-suspended in ultrapure water and in water-trehalose solution. D-(+)-trehalose dihydrate (=378.33, Sigma-Aldrich, 99.0 purity) was used as received. The water-trehalose solution was prepared by weighing (24.9 wt of trehalose dihydrate). The resulting concentration of trehalose was 0.72 M. In terms of number of molecules, the trehalose to water mole ratio was , or equivalently, the trehalose mole fraction was . The solution was heated at 313 K and continuously stirred until complete trehalose dissolution, then thermalized at room temperature and filtered through a cellulose membrane filter, 0.2 m pore size.
For DLS experiments, microgel suspensions in the two solvents were prepared at high dilution (microgel concentration g/mL). For RS experiments and for thermal analysis, samples were prepared at microgel concentration of 18 wt and 3 wt, respectively. All samples were stored at 275–277 K for at least two days before use.
2.4 Characterization of solvent media
Both water and the water-trehalose solution used to prepare microgel suspensions were characterized by density, viscosity and refractive index, over the temperature range of DLS measurements.
For the water-trehalose solution, the kinematic viscosity was measured with a micro-Ubbelhode viscosimeter, the mass density with an Anton Paar DMA 5000 M densitometer, and the dynamic viscosity was calculated as . At any temperature, the refractive index is related to by the Lorentz-Lorenz equation, , where the specific refractivity is rather temperature-independent. The value of was obtained at 298.3 K from , measured with a NAR-1T Liquid Abbe refractometer, and g cm-3, independently measured.
For pure water, mass density, refractive index, and viscosity data as a function of temperature are available from the literature. We used and taken from ref. [40], after having verified the agreement with the measured value at one reference temperature. Measurements of were repeated, providing values of in perfect agreement with the literature ones [41]. The temperature dependence of , and for the two solvent media is shown in Fig. S1.
2.5 Dynamic light scattering experiments
DLS measurements were performed with a commercial setup equipped with a Brookhaven BI-9000AT correlator, using a solid state laser source of =532 nm. The monochromatic beam was focused on the sample placed in a cylindrical VAT for index matching and temperature control. The temperature was regulated within 0.1 ∘C by a thermostatic circulator. The scattered light was collected at an angle , corresponding to a scattering wave vector , where () is the refractive index of the sample at the incident wavelength. The intensity autocorrelation function, , was acquired as a function of temperature on heating across the volume phase transition of the microgels (from 288 to 320 K for the sample in water, from 278 to 320 K for the sample in water-trehalose). At each temperature, the sample was equilibrated for 10 min, and then measured in at least three different points. The results are reported as the mean value SD.
2.5.1 Analysis of DLS spectra
The autocorrelation function of the scattered field, , is linked to the measured by the Siegert relation , with a measured baseline and the coherence factor, an instrumental parameter of the order of unit. Therefore, is proportional to . This quantity was analyzed by the method of cumulants (see text in the SI), to obtain the intensity-weighted (or z-average) particle diffusion coefficient . The hydrodynamic radius of the microgel particles in suspension was determined as the z-average particle size by using the Stokes-Einstein relation , where is the Boltzmann’s constant, the absolute temperature, and the viscosity of the dispersing medium.
The mentioned analysis, however, only applies if the solvent molecules are light scatterers far less efficient than the suspended particles, and if particles move much more slowly than solvent molecules so that the solvent contribution to the decay of the correlation function occurs on a time scale smaller than the experimental time window. It must be noted that these conditions are fulfilled for the microgel suspension in water, but it is not the case for the sample in water-trehalose solution. In this latter, the relaxation dynamics of trehalose molecules is not sufficiently separated from the motion of microgels, thus entering the time window of the autocorrelation function and contributing with an additional decay process to at small times (see Fig. S2). The solvent contribution must be carefully subtracted from the acquired scattering signal, before applying the cumulant method. The analysis of DLS spectra in the presence of trehalose is illustrated step-by-step in Fig. S3. Without such a treatment, as it was the case in ref. [36], the behavior of the autocorrelation function at small times has no relation with the diffusion properties of the suspended particles.
A cumulant analysis at each temperature, using the same criteria, was made in both suspensions only for the contribution to the autocorrelation function due to the Brownian motion of microgel particles. More details about the procedure are reported in the SI. The temperature dependence of is shown in Fig. S4. The results for the suspension in pure water were validated by the cumulant analysis performed by means of the Brookhaven commercial software.
2.6 Raman spectroscopy experiments
RS measurements were performed with a resolution of 5 cm-1, by using the 532 nm emission of a solid state laser (100 mW on the sample). A backscattering geometry was realized using the 50x long working distance objective of an Olympus BX40 microscope. The scattered light was analyzed by an iHR320 imaging spectrometer Horiba Jobin-Yvon, equipped with a Syncerity CCD camera. The signal was dispersed by a 1800 grooves/mm grating that allowed acquisition in the 750-1800 cm-1 spectral range. Microgel samples in water and in water-trehalose solution were measured at three temperatures (283, 300 and 318 K) chosen in relation to the volume phase transition temperature. At 283 K both samples are in swollen condition; at 318 K both samples have collapsed; at 300 K microgels in water and in water-trehalose are, respectively, below and above the transition. The temperature was controlled by using a FTIR600 Stage by Linkam Scientific Instruments, equipped with a Linkam pump system using liquid nitrogen as coolant. Spectra were collected by cumulating several repetitions, corresponding to 2 hours of acquisition at each temperature. Spectra of the two solvents were also acquired. At each temperature, the solvent spectrum was subtracted from that of the corresponding microgel sample, as much as to avoid negative differences in the resulting ‘solvent-free’ spectrum. Notably, in the trehalose-containing system this operation resulted in the complete removal of the peak at about 800 cm-1, the only trehalose signal with no superposition with those of PNIPAM. More details about the solvent subtraction procedure are provided in Figs. S5 and S6.
2.7 Differential scanning calorimetry measurements
The volume phase transition of microgels in water and in water-trehalose solution was analyzed by using a differential scanning calorimeter SII DSC 7020 EXSTAR Seiko, equipped with liquid nitrogen as cooling agent. The instrument was calibrated with Indium, Zinc and heptane as standards. For each sample, 20–25 mg of microgel suspension were hermetically sealed in a 60 L stainless steel pan equipped with rubber O-ring for operative pressure up to 24 bar, taking care not to exceed the transition temperature before measurement. The thermal analysis was carried out on heating the sample from 0 to 60 ∘C, using a scan rate of 5 ∘C/min.
2.8 Molecular dynamics simulations
2.8.1 Model and simulation procedure
All-atom MD simulations were performed on a PNIPAM linear chain, in diluted condition, both in water and in water-trehalose mixture at the same trehalose mole fraction (=0.015) as used in the experiments. The polymer chain was a 30-mer in atactic configuration. PNIPAM was described with the OPLS-AA force field [42] in the implementation of Siu et al. [43], and trehalose with the OPLS-AA carbohydrates force field [44]. The model for water was TIP4P/ICE [45], as it proved to properly reproduce the PNIPAM behavior in water over a wide temperature range, including the coil-globule transition [46] and the dynamical transition at low temperature [20, 47, 48]. The model of diluted solution was built by adding randomly, around the polymer chain in an extended conformation, 22849 water molecules for the PNIPAM-water system, and 15598 water molecules plus 239 trehalose molecules for PNIPAM in water-trehalose. Both systems were simulated at 283 and 318 K, the same temperatures as in the RS experiments, located below and above the microgel volume phase transition in both solvents. After equilibration, the mass density of the water-trehalose mixture at 283 and 318 K was, respectively, kg m-3 and kg m-3, consistent with the measured values of 1097 kg m-3 and 1085 kg m-3 at the same temperatures. MD simulations were carried out in the NPT ensemble for 365 ns, using the same protocol as in ref. [46]. Trajectory acquisition and analysis were carried out with the GROMACS software package (version 2016.1) [49]. The VMD software [50] was used for graphical visualization. Further details are reported in the SI.
2.8.2 Trajectory analysis
The last 75 ns of each trajectory were considered for analysis, by sampling 1 frame every 5 ps. The radius of gyration of the polymer chain was calculated as , where is the mass of the -th atom and its distance from the center of mass of the chain. The water accessible surface area (WASA) of PNIPAM is defined as the surface of closest approach of water molecules to the solute molecule, where both solute and solvent are described as hard spheres. Numerically, this quantity was calculated as the van der Waals envelope of the solute molecule extended by the radius of the solvent sphere about each solute atom center. A spherical probe of radius 0.14 nm was used and the values of the van der Waals radii were taken from the literature [51, 52]. The distributions of WASA values were calculated with a bin of 0.1 nm2. Water molecules in the first hydration shell of PNIPAM were defined as having the oxygen atom at a distance from oxygen, nitrogen, or methyl carbon atoms of PNIPAM lower than the first minimum distance of the corresponding radial distribution function. This cutoff value corresponds to 0.35 nm for nitrogen and oxygen atoms and to 0.55 nm for methyl carbon atoms. Water molecules in the first hydration shell of trehalose were defined as having their oxygen within 0.35 nm from a trehalose oxygen atom. Finally, trehalose molecules in the first solvation shell of PNIPAM were defined as having their anomeric oxygen within 0.6 nm from oxygen, nitrogen or methyl carbon atoms of PNIPAM. As the anomeric oxygen is located in the center of the trehalose molecule, this criterion entails the proximity to PNIPAM also of other sugar moieties, thereby selecting trehalose molecules with a significant interaction with PNIPAM. The bulk solvent properties were evaluated for molecules at a distance greater than 3 nm from the polymer.
The trehalose concentration as a function of the distance from the PNIPAM surface was evaluated by calculating the trehalose mole fraction , given by the ratio between the anomeric oxygen atoms of trehalose and the sum of the trehalose anomeric and water oxygen atoms, in shells 0.5 nm thick. The number of PNIPAM-PNIPAM, PNIPAM-water, PNIPAM-trehalose and water-trehalose hydrogen bonds (HBs) was also calculated. The hydrogen bonding interaction was identified by adopting the geometrical criteria of an acceptor-donor distance (AD) lower than 0.35 nm and an angle (AD–H) lower than 30∘, irrespective of the AD pair. The lifetime of PNIPAM-water HBs, , was estimated by calculating the intermittent HB autocorrelation function and by taking the time at which its amplitude decreased to 1/e. The exchange time of water (trehalose) from the PNIPAM first hydration (solvation) shell to the bulk solution, , was estimated from the time evolution of the number fraction of water (trehalose) molecules in the first shell, by taking the time at which the corresponding autocorrelation function decayed to 1/e of its amplitude.
The translational diffusion coefficient of PNIPAM and trehalose hydrogen atoms and of bulk water oxygen atoms was calculated from the long-time behavior of their mean square displacement (MSD), as , where and respectively represent the position vector of the atom at time and , and denotes an ensemble and time origin average. In addition, we also calculated the MSD of the oxygen atoms of PNIPAM and trehalose hydration water, in a time window of 500 ps.
3 Results and Discussion
3.1 Dynamic light scattering
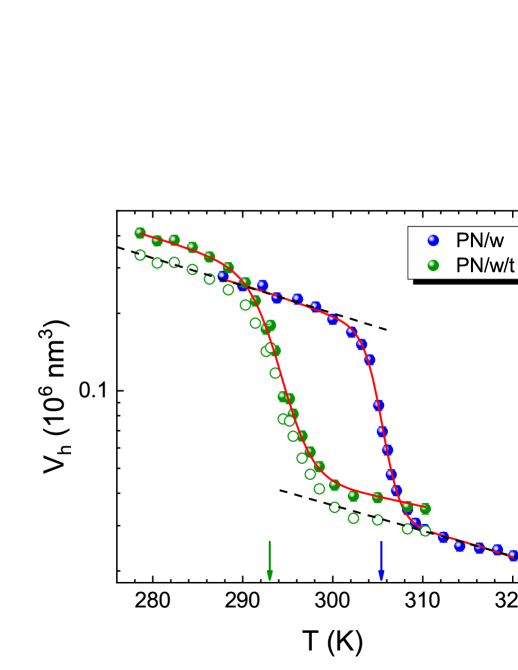
DLS experiments revealed that the size of PNIPAM microgels, measured by the hydrodynamic volume , is affected by the solvent medium in which the particles are suspended, and allowed us to monitor the size change induced by temperature variations in water and in water-trehalose solution (Fig. 1). Upon heating, the value of has a sharp drop within a narrow temperature range, revealing the occurrence of the volume phase transition in both solvents. From a qualitative comparison, two main differences with respect to the pure water suspension emerge in the presence of trehalose at the investigated concentration. Namely, the transition occurs at a temperature lower more than 10 K, and the particles in their thermodynamically stable state remain sensibly more expanded, both below and above the transition.
Going into a deeper, yet model-independent evaluation, we find that the increase of size in water-trehalose is proportional to the size the microgel would have in water at the same temperature, the difference being both in the swollen and the collapsed state. In this respect, we note that the ratio between density of water-trehalose and pure water (Fig. S1), which is constant over the temperature range investigated, implies a constant ratio of about 1.18 between the volume of these solvents taken in quantities containing the same amount of water. Moreover, since the molecular volume of trehalose and water are about 350 Å3 [53] and 30 Å3, respectively, one trehalose molecule approximately occupies 18 the volume of 65.3 water molecules, 1:65.3 being the trehalose to water mole ratio in the binary solvent. Thus, the greater hydrodynamic volume detected when microgels are immersed in water-trehalose solution could be well explained by assuming a water-cosolute ability to enter/exit the microgel particles across the volume phase transition maintaining the same molar composition as the external medium. This rough estimate also suggests that the amount of water permeating the polymer network, in the swollen or collapsed state, is independent of the presence of trehalose. Our observation, made on the microgel colloidal scale, is in agreement with the results of isothermal titration microcalorimetry for PNIPAM chains [9], suggesting that trehalose in the presence of PNIPAM remains preferentially hydrated and mainly develops water-mediated interactions with the polymer.
To obtain more quantitative information on the trehalose effect, we derived the thermodynamic parameters associated to the microgel transition, by applying a van’t Hoff model to the temperature dependence of . In analogy to protein folding-unfolding, the model considers a microgel as consisting of independent ‘cooperative units’, and the transition in each of these units as a temperature-induced all-or-none transition from one state (swollen state of the cooperative unit) to another state (collapsed state of the cooperative unit) [19]. At any temperature of the swollencollapsed thermodynamic equilibrium, the measured value of is the value averaged over the two cooperative unit populations, i.e. , with and the volume of fully swollen and fully collapsed particles (i.e., composed of cooperative units all in the swollen or collapsed state), while and denote the fraction at equilibrium of swollen and collapsed units per particle, with . The equilibrium constant of the reaction, , is given by , with the gas constant, the absolute temperature, and the standard free-energy change associated to the transition at temperature . It is reasonable [54, 55, 56] that the enthalpy and entropy changes at temperature negligibly differ from their values and in the middle point of the transition, i.e., at temperature defined by the condition . This condition is equivalent to , implying . Combining these relations, gives
| (1) |
Due to negative thermal expansion of molecular NIPAM [57, 58], the microgel network contracts on heating. This temperature dependence in the volume of fully swollen and fully collapsed particles is taken into account by introducing a thermal contraction coefficient in each state, and . Therefore, in equation (1), one has and , with and the hydrodynamic volume extrapolated to from both sides of the transition. The fit of the experimental data with equation (1), shown in Fig. 1, indicates that the two-state transition model describes very well the volume phase transition of microgels in both solvent media. An equally good description is not provided by other thermodynamic models, e.g. the Flory-Rehner theory [59].
The resulting best fit parameters, reported in Table 1, can be used to characterize the microgel ability to change volume in response to temperature variations. To this end, we considered the thermal effect that occurs without change of thermodynamic state separately from the effect due to the conformational transition. When particles are far from the transition region, either in the swollen or in the collapsed state, their contraction coefficient in the two solvents is the same within experimental error, suggesting that the presence of trehalose does not appreciably change the elasticity of the polymer network, a property reflected into its ability to contract. Although the value of is significantly lower than (about one half) that of , however it remains different from zero, confirming a residual capacity of microgels to change volume in the collapsed state [60, 61]. On the other hand, a direct measure of the microgel ability to shrink across the conformational transition is provided by the ratio . Notice that this quantification differs from that used in literature, where the ratio is calculated between the particle hydrodynamic radius well below and well above , without separating the effect of thermal contraction. The values of , equal within the error, are and in water and in water-trehalose solution, respectively. These numerical results are consistent with our previous model-independent observation of a constant ratio, below and above the transition, of values in the two solvents, further demonstrating that equation (1) is suitable to describe the data behavior.
| Sample | (K) | (kJ mol-1) | (nm3) | (nm3) | (K-1) | (K-1) |
|---|---|---|---|---|---|---|
| PN/w | ||||||
| PN/w/t |
According to the parameters in Table 1, the swelling-to-collapse transition is an endothermic process () and also occurs with an increase of entropy (). Although a drastic decrease of both and is observed in the presence of trehalose, a transition temperature lower by almost 12 K stems from a lower transition enthalpy which is not compensated by the concomitant transition entropy reduction. This highlights a remarkable effectiveness of trehalose in stabilizing the collapsed state of PNIPAM microgels. Since, according to the model, the enthalpy and entropy changes refer to one mole of cooperative units undergoing the transition, to derive microscopic information from these parameters it is necessary to calculate the number of monomers per cooperative unit, in the two samples. This is done by dividing by the transition enthalpy per mole of PNIPAM residues, a quantity obtained from calorimetry. In this respect, we note that several calorimetric studies have measured this quantity for PNIPAM in water [39, 62, 63, 64, 19, 65, 66, 67, 68], but no determination is available in water-trehalose solution at the present concentration. Our thermal analysis provided kJ mol-1 in water and kJ mol-1 in water-trehalose. Notice that the first of these values is in agreement with the numerous literature data, whose average is kJ mol-1, and in particular is very close to the values reported for microgels prepared with the same synthesis protocol used in the present study [39, 62]. With these values, the PNIPAM residues per cooperative unit in water and in water-trehalose are and , respectively. This suggests a slight reduction of cooperativity for the transition in the presence of trehalose, despite the uncertainty of our estimate. These results for PNIPAM microgels are reminiscent of results for proteins, where additives can modulate the extent of folding cooperativity, and a less cooperative process is found to be associated to an increased protein stability [69, 70]. Thus, a less cooperative conformational transition in the presence of trehalose further reflects the stabilizing action of this sugar.
Per mole of PNIPAM residues, the increase of entropy at the microgel collapse in water and in water-trehalose is and J K-1 mol-1, respectively, with a trehalose-induced reduction of 4.9 J K-1 mol-1. The reduction of heat absorbed, however, is 1.7 kJ mol-1 only, a small value compared to the typical energy of hydrogen bonding. This is an indication that such a value reflects an energy balance resulting from variations of several interactions. Indeed, and provide global information about the conformational transition, whose details at a microscopic level remain hidden. As a demonstration, we may compare the cases of aqueous PNIPAM solution with trehalose and ethanol, the latter being an alcohol that directly exposes the hydrophobic moiety to the surrounding. Despite the difference of the two additives, it is experimentally observed [63] that there exists a water-ethanol composition () at which the transition of PNIPAM exhibits similar thermodynamic parameters as those found at the present trehalose concentration (), namely, K and an enthalpy change per mole of PNIPAM residues of kJ mol-1. Therefore, in order to derive a clear microscopic picture of the mechanism of transition of PNIPAM in the presence of trehalose, analyses at the molecular scale constitute an essential further step of investigation, as reported in the next sections.
3.2 Raman spectroscopy
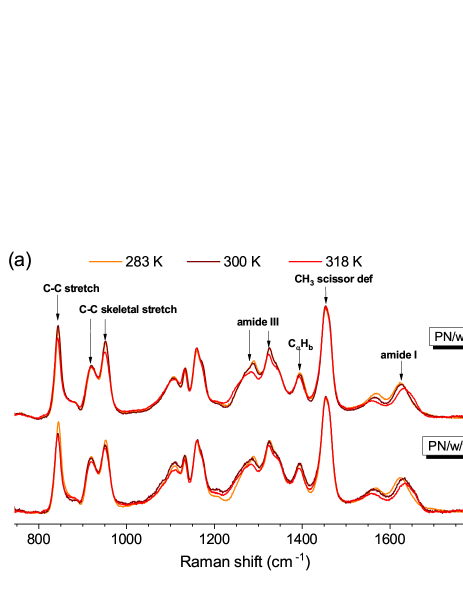

RS experiments were used to get insight into the solvation pattern and intramolecular bonding of PNIPAM microgels in the two solvents, at a molecular level. Fig. 2a shows the effect of temperature, across the volume phase transition, on the solvent-free spectra of each sample. Fig. 2b compares the solvent-free spectra of the two samples at each studied temperature. In the frequency range investigated, the amide I band conveys the most relevant information, as it mainly arises () from the C=O stretching vibration with only a minor contribution () from the C-N stretching mode. In each of the two samples, this band shifts to higher frequency when microgels change from swollen to collapsed (Fig. 2a), however this occurs in a way that no difference in the band profile is observed when microgels are both swollen (at 283 K) or when they are both collapsed (at 318 K). This is shown in Fig. 2b. Conversely, a band shift is observed at 300 K, when microgels are in a different state. Notably, the solvent-free spectra of the two samples, at 283 and 318 K, are well superimposed over the whole frequency range, revealing that the signals of solvent and polymer are not frequency shifted within the experimental sensitivity. Therefore, direct binding of PNIPAM to trehalose is negligible, or rather, is not distinguishable from that of PNIPAM to water.
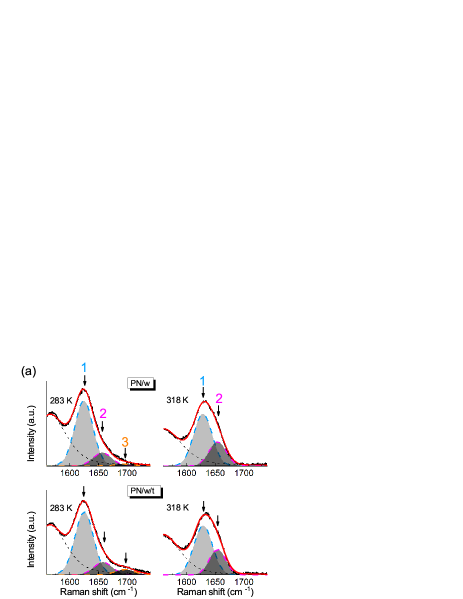
Quantitative information was obtained from the curve fitting of the spectra in the 1530-1740 cm-1 frequency range, including the amide I band. This latter is well reproduced by assuming the presence of three sub-bands, each one described by a pseudo-Voigt function, which are constant in position and shape and only change in intensity upon temperature variation. The low-frequency component ( cm-1) is attributed to C=O groups hydrogen bonded to OH groups, the intermediate-frequency one ( cm-1) to C=O groups intramolecularly hydrogen bonded to the NH group [71], and the high-frequency component ( cm-1) is ascribed to unbonded C=O groups [72]. This testifies to the high sensitivity of the amide I band to changes in both PNIPAM solvation and intra-PNIPAM interactions. In particular, in the presence of trehalose, the low-frequency component is assumed dominated by the interaction with water, according to the experimental suggestions discussed in sec. 3.1 and the simulation results reported in the next sec. 3.3. The observed frequency upshift across the transition reflects a change in the intensity balance among the three sub-bands, with a higher relative increase of the intermediate-frequency contribution. An additional pseudo-Voigt term has been used to describe the band around 1565 cm-1, that partially overlaps the amide I band. The total fit curves together with their individual contributions are displayed in Fig. 3a.
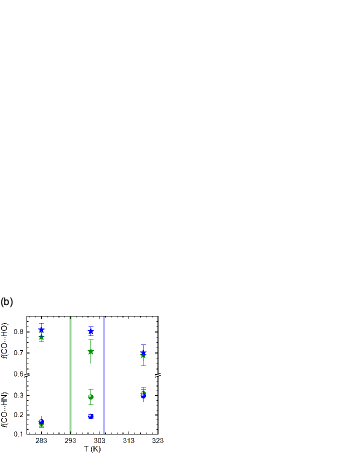
Assuming that the different C=O species have the same Raman cross section, as found in poly-amide systems [72, 73], we calculated the mole fraction of unbonded C=O as the relative area of the high-frequency sub-band (number 3 in Fig. 3a), i.e. , with the sum of peak areas of the three components. This small fraction is found to be temperature and only slightly solvent dependent. Indeed, it vanishes in both samples at 318 K, and at 283 K it is higher in the presence of trehalose. However, this difference is not significant within the experimental error, as demonstrated by the populations of the other C=O species, hereafter calculated. The mole fraction of C=O involved in intra-PNIPAM HBs is provided by the relative area of the intermediate-frequency sub-band (number 2 in Fig. 3a), while the relative area of the low-frequency sub-band (number 1 in Fig. 3a) provides, within the assumption of negligible bonding with trehalose, the fraction of hydrated C=O. These quantities, plotted in Fig. 3b as a function of temperature, are coincident within the error for microgels in the two solvents, below and above the transition, indicating that neither the intramolecular bonding nor the hydrophilic hydration of PNIPAM are affected appreciably by the presence of trehalose. These findings support, with information at the molecular scale, the idea suggested by the analysis of hydrodynamic volume data (see sec. 3.1) that trehalose-induced effects are mostly water-mediated.
Fig. 3b also reveals changes of interactions associated to the microgel conformational transition. Even in the swollen state a non-negligible amount of C=O groups, around 16, is engaged in intramolecular bonding, and it increases in the collapsed state, reaching about 30. Concerning hydration, most (around 80) of the C=O groups are hydrogen bonded to water in the swollen microgels, but only a small fraction, around 10, of these groups dehydrate during the collapse transition. So, there is still a lot of water retained in the collapsed particles. This behavior favorably compares with other experimental and simulation results for PNIPAM microgels [72] and linear chains in water [71, 74, 75, 46]. We note that a quantitative comparison with literature data is prevented since several values are reported, suggesting a possible effect due to the polymer topology and concentration. The comparison in Fig. 3b, however, is not affected by this issue, as it refers to the same microgel particles, at the same concentration.
3.3 Molecular dynamics simulations
3.3.1 Structural properties
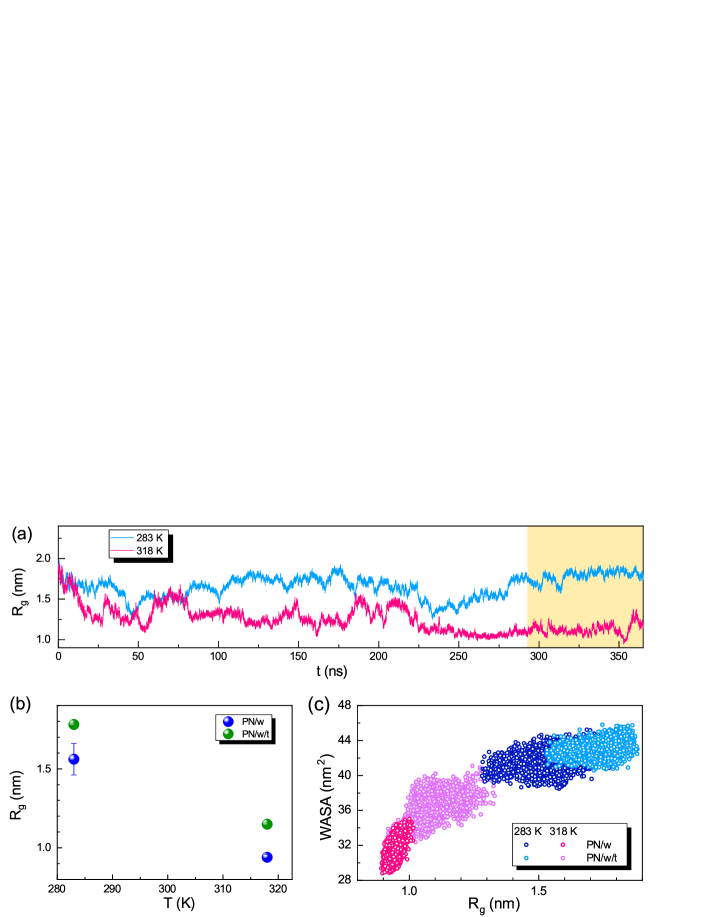
To complement the microscopic information derived by RS experiments, we rely on all-atom MD simulations of a PNIPAM 30-mer, mimicking a linear segment of the microgel network. The time evolution of the chain size (as quantified by the polymer radius of gyration ) is reported in Fig. 4a for the trehalose-containing system. The behavior shows that extended conformations are mainly populated at 283 K, while the chain collapse has already occurred at 318 K. The average value of in the two solvents is compared in Fig. 4b. While decreases from 283 to 318 K, the chain size in the presence of trehalose is slightly bigger than in pure water, both in the coil and the globule state. This difference qualitatively matches the behavior of the hydrodynamic volume observed by DLS in our PNIPAM microgels (see Fig. 1). The water accessible surface area (WASA), a property strictly correlated to the chain size in aqueous environment, confirms the results for , as shown in Fig. 4c. The associated distributions of and WASA are reported in Figs. S7 and S8.
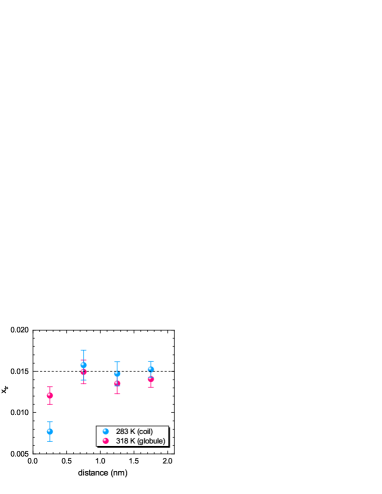
The larger chain size in the presence of trehalose could derive from a preferential adsorption of the sugar on the polymer, since portions of the chain in a more extended conformation would favour the interaction with trehalose through a greater accessible surface. To verify whether this occurs, we calculated the local concentration of trehalose as a function of the distance from the surface of the PNIPAM chain (Fig. 5). We find that the mole fraction of trehalose in close proximity to the chain is lower than 0.015 found in the bulk solution. This means that the polymer surface layer is depleted of trehalose, and therefore preferential adsorption is ruled out. Notably, this behavior is much more pronounced at 283 K, in the coil conformation. These results for PNIPAM are quite remarkable, since they are very similar to what observed for globular proteins in solution, where trehalose is found to be preferentially excluded from the protein surface [76]. Indeed, an increased exclusion from the vicinity of the denatured protein is proposed to be the physical basis of the trehalose stabilizing action [29, 26], a conjecture that seems to be confirmed by the present findings.
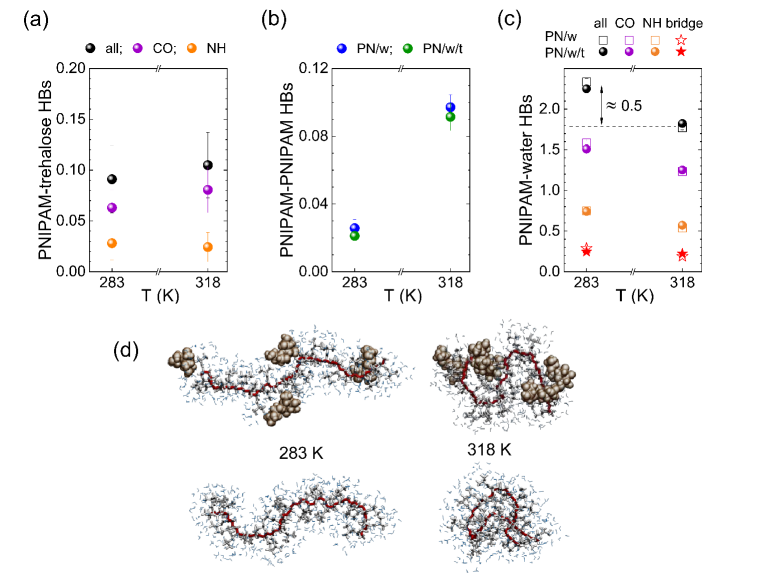
To further investigate the trehalose arrangement, we looked for trehalose molecules bound to hydrophilic groups of the polymer. On average, only one out of ten PNIPAM residues forms HBs with trehalose, irrespective of temperature (Fig. 6a). The extent of this interaction is negligible compared to that of the polymer with water, providing support to the assumptions made in the RS analysis of sec. 3.2. However, since the size of a trehalose molecule is about three or four times that of a PNIPAM residue, the binding or the proximity of even very few molecules helps the polymer chain to adopt more extended conformations than in pure water, explaining a slightly larger size both in the coil and globule state. This situation is visually displayed in Fig. 6d, showing representative configurations of the simulated chain in the two solvents, along with the water and trehalose molecules in the first solvation shell (see Methods and Figs. S9, S10). Although the presence of trehalose in the PNIPAM surrounding induces more extended conformations, Fig. 6b shows that this makes no difference for the number of intra-PNIPAM HBs in the coil and collapsed chain. Moreover, the increase of intramolecular bonds across the conformational transition is in agreement with the behavior observed in the RS experiments (see Fig. 3b), though the fraction of bonds obtained in the simulations is lower than that obtained experimentally. As noted in sec. 3.2, such discrepancy can be ascribed to the much higher polymer concentration of the experimental samples and to the network architecture of microgels, both of which making contacts between amide groups more likely.
We then explored in detail the hydration pattern of PNIPAM in the two solvents. The shape of the radial distribution functions between water oxygens and PNIPAM atoms is very similar in water and in water-trehalose, showing three distinct hydration shells (see Fig. S10). For the polymer chain in the coil and globule state, we find that the coordination number of PNIPAM atoms by water oxygens, which is calculated by integration of the corresponding radial distribution function, is the same in the two solvents up to distances greater than the thickness of the first hydration shell (see Fig. S11). Therefore, trehalose at the investigated concentration does not inhibit PNIPAM hydration. This finding is confirmed by the number of PNIPAM-water HBs, shown in Fig. 6c. We calculated this quantity separately for the different hydrophilic (carbonyl and amine) groups of the polymer, and also identified HBs where a water molecule bridges two different amide groups. The results show that across the coil-globule transition the chain maintains a high water affinity, with the loss of only about 0.5 HBs per PNIPAM residue, as pointed out in previous studies for linear chains [71, 74, 75, 72]. Most notably, the number of HBs for each type of hydrophilic group is very similar in the two solvents, indicating that trehalose not only preserves the overall polymer hydration but also keeps unchanged the pattern of hydrogen bonding with water. These findings are in agreement with the results of the RS experiments (see Fig. 3b).
The mentioned results also suggest that maintaining the same hydration level as in pure water can be an additional driving force which induces more extended conformations of the PNIPAM chain, and allows for higher WASA values compensating for the presence of trehalose in the polymer surrounding. Another consequence of these results is that the decrease of transition enthalpy per mole of polymer residues, measured by calorimetry in the presence of trehalose, cannot be ascribed to a lower dehydration of amide groups, but is likely due to a smaller molar partial enthalpy of water in the bulk of the water-trehalose solution [77], a factor which thermodynamically favors the transition to the collapsed state [63].
| T | (w) | (w/t) | (w) | (w/t) | (w) | (w/t) | (w) | (w/t) | |||
|---|---|---|---|---|---|---|---|---|---|---|---|
| (K) | (ps) | (ps) | (ps) | (ps) | (ps) | ||||||
| 283 | |||||||||||
| 318 |
We then analyzed the hydration and aggregation properties of trehalose in our model. Indeed, the presence of hydrated-sugar complexes acting as an effective cosolute has been proposed to control the effect of carbohydrates on the PNIPAM LCST, in such a way that the higher the sugar size and hydration, the larger the decrease of the LCST, mainly for entropic effect [9]. We find a hydration number of , irrespective of temperature, in very good agreement with the value of determined experimentally at the same trehalose concentration [78, 79, 80]. On average, one trehalose molecule hydrogen bonds and water molecules, respectively at 283 and 318 K (see Table 2), while it only forms 0.5 inter-trehalose HBs, which demonstrates a high water affinity and a weak tendency to aggregate, as experimentally reported [78, 79]. Particularly, we analyzed the distribution of trehalose in the PNIPAM surrounding, looking for some connectivity between sugar molecules residing in the first solvation shell. We observe that these molecules never hydrogen bond to each other, so that no clustering occurs at the polymer interface. These findings, combined with the relatively long trehalose-water HB lifetime, (see Table 2), confirm the strong and preferential interaction of trehalose with water and exclude the presence of clusters in the polymer surrounding for the system here investigated.
3.3.2 Dynamical properties
To complement these results, we studied the trehalose-induced effect on the dynamics of the system constituents. To this end, we monitored the MSD of PNIPAM and trehalose hydrogen atoms, and of bulk water oxygen atoms (Fig. S12). All these atoms show a long-time diffusive behavior so that it is possible to estimate their diffusion coefficients, respectively , , and . The values are reported in Table 2. We observe that the addition of trehalose induces a drastic slowdown of both PNIPAM and water. In particular, the bulk water diffusivity decreases by almost a factor of 2, at both temperatures. A similar reduction is observed for PNIPAM at 318 K, but the effect is almost double at 283 K, where is only of the one in pure water. We also note that the temperature-induced change of PNIPAM diffusivity is in a different relationship with the corresponding change of the bulk solvent mobility. In fact, the value of in water roughly scales with , while in the trehalose-containing system the reduction of from 318 to 283 K is greater than that of and , suggesting that the presence of trehalose enhances the slowing down of polymer local motions upon cooling. Concerning hydration water, of both trehalose and PNIPAM, we observe that the oxygen atoms never reach a diffusive regime within the studied time interval, thus preventing an estimate of their diffusion coefficient. However, the time behavior of the MSDs (Fig. S12) shows that the hydration water dynamics is always slower than that of bulk water. The molecules in the hydration shell of PNIPAM are slower than those in the hydration shell of trehalose and, most importantly, the mobility of PNIPAM hydration water is much lower in water-trehalose solution. This is observed at 283 and 318 K, and highlights the strong slowdown induced by trehalose also in the dynamics of the polymer hydration water.
To better characterize the hydration shell dynamics, we calculated three characteristic times, namely, the PNIPAM-water HB lifetime () and the exchange time of water and of trehalose in the first hydration shell (), as described in Materials and Methods. At each temperature, of water molecules is higher than . This reflects the major constraints imposed on these molecules by being hydrogen bonded rather than residing in the polymer first hydration shell, and also depends on their possibility to break HBs with amide groups without escaping the surrounding of hydrophilic or hydrophobic PNIPAM domains. In the presence of trehalose the value of these characteristic times significantly increases. As shown in Table 2, the PNIPAM-water HBs last longer, and the exchange of water molecules from the hydration shell to the bulk needs more time. Moreover, the exchange of trehalose takes a time over one order of magnitude longer than the exchange of water (see Fig. S13). All these findings demonstrate that, independently of the polymer conformation, trehalose provides an increased dynamical stability to the polymer hydration shell. Again, these results for PNIPAM are noteworthy, since they are closely reminiscent of the slowdown caused by trehalose to protein local motions and hydration water, helpful to obviate high-temperature damages in solution [30, 31, 32]. Moreover, it should be pointed out the similarity with the mechanism of protein cryoprotection described in a recent simulation study of lysozyme in aqueous solution [35]. The study revealed two structural relaxations of hydration water, with the long-time process being sensitive to the protein structural fluctuations and changing its temperature behavior in correspondence to the protein dynamical transition. The effect of trehalose was to strongly damp the fluctuations of the protein structure, and to slowdown the long-time water relaxation to a much greater extent than the other process. This effect was claimed to inhibit ice nucleation and favor vitrification upon cooling, providing a rationale to the cryoprotectant action of trehalose for proteins. Our study reveals a very similar mechanism of slowdown induced by trehalose, reflected in the long-lasting PNIPAM-water HBs combined with a slow exchange of hydration-to-bulk water and an even slower exchange of trehalose, all contributing to confine a small amount of water molecules close to the polymer surface. Such molecules, located within the polymer hydration shell, are necessarily most prone to share hydrogen bonding interactions with polymer and trehalose and are thus expected to be more slowed down and more coupled to the structural fluctuations of the macromolecular system. The analogy is reinforced by the similar time behavior of the MSD observed for the hydration water that, in lysozyme and PNIPAM, never reaches the diffusive regime at any temperature, in contrast to bulk water.
In the simulation of lysozyme, the sugar-induced slowing down was found to be associated with the presence, over the protein surface, of transient trehalose patches formed by clusters of several molecules [35]. In the PNIPAM system, however, no clustering of trehalose is detected, whereas a clear slowing down of both polymer and its hydration water is found, suggesting that a massive binding of the sugar to the macromolecule is not an essential ingredient. Since the absence of clustering in the system here investigated might well be explained by the lower concentration of trehalose (0.72 instead of 1.33 M), further investigations at higher concentration would be useful to clarify the effect of trehalose clusters at the polymer interface.
It is now important to stress that the hydration pattern of PNIPAM and the localization of additive in its surrounding, are very different in water-trehalose from those identified in water-ethanol by another recent simulation study [81]. Unlike trehalose, ethanol preferentially adsorbs on the polymer surface, mainly due to interactions between ethyl and isopropyl groups, but also competes with water for hydrogen bonding to hydrophilic groups and develops aggregates in the first solvation shell of the polymer. Thus, important differences at the microscopic level characterize the mechanisms governing the effect of these two additives on the polymer transition, even in case of similar thermodynamic parameters as discussed in sec. 3.1.
Overall, the simulations give us a microscopic picture of the effect of trehalose on PNIPAM which indicates that, consistently with the experimental results, the bioprotectant sugar preserves PNIPAM hydration both below and above the transition, and stabilizes the hydration shell by preferential exclusion and drastic slowdown of local motions. These mechanisms are at odds with those put in place by other additives, for instance ethanol, and are strikingly similar to those observed in trehalose-protein systems.
4 Conclusions
In this manuscript, we reported evidence that trehalose acts on PNIPAM microgels through molecular mechanisms that are similar to those governing its protective action against thermal denaturation and cold damage of aqueous proteins. To this aim, we combined DLS and RS measurements with MD simulations, to complement single-particle information at the colloidal scale with atomic-scale structural and dynamical information. From the temperature dependence of the microgel hydrodynamic volume, which is well described by the van’t Hoff equation for the thermodynamic equilibrium between the swollen state of the particles for and their collapsed state above it, the at the investigated 0.72 M trehalose concentration was found to be lowered by as much as 12 K, showing that trehalose promotes the collapsed conformation of the microgel particles similarly to the way it stabilizes aqueous proteins in their native state. Trehalose has proved to be even more effective as a stabilizer of microgels than of proteins, as shown by the exceptional reduction of transition temperature (), which is almost twice the increase of transition temperature in proteins for the same sugar concentration [29, 26].
In the presence of trehalose, microgels are found more expanded than in pure water keeping unchanged their thermal contraction, swelling capacity, and the amount of absorbed water, with no change in composition of the solvent absorbed below and above the transition. This suggests that sugar molecules remain preferentially hydrated without directly interfering with the HBs formed by the microgel network, thereby preserving polymer hydration. The numerical simulations provided evidence, indeed, that binding of some trehalose to the polymer occurs, but without changing the water affinity for PNIPAM which, below and above the transition, is expected to be preferentially hydrated.
Most crucially, we found an increased preferential exclusion of trehalose in the swollen microgels, in close analogy to the increased exclusion from the hydration shell of denatured proteins, a mechanism thermodynamically explaining the sugar stabilizing action [76, 29, 26]. The collapsed conformation of PNIPAM microgels is not only thermodynamically but also kinetically stabilized, in further analogy to protein behavior. Trehalose, in fact, was found to deeply impact on the dynamics of the system by inducing a drastic slowdown of the polymer local motions and of its hydration shell. A reduced mobility, together with an increased residence time of water in the polymer surrounding, is also one major mechanism explaining the trehalose ability to counteract deleterious intramolecular motions in delicate proteins and enzymes in solution, during exposure to high temperatures [30, 31, 32]. Moreover, the long-lasting PNIPAM-water interactions, and the reduced hydration-to-bulk exchange of solvent molecules, contribute to confine a small amount of slow water close to the polymer surface, suggesting similarities with the protective mechanism of trehalose against cold damage in proteins. In this respect, a natural and interesting extension of this work will be to simulate a microgel network upon cooling to ascertain the occurrence of a long-time structural relaxation in the polymer hydration water, similar to the one detected in the recent simulations of lysozyme in solution [33, 35], and to investigate how trehalose affects the polymer dynamical transition, a phenomenon which is well established for PNIPAM microgels only in water [20, 47].
At this point, it is important to see the present study in the context of the existing literature about the trehalose effect on the PNIPAM stability in aqueous solution. In particular, the MD simulation study by Narang and coworkers [36] claimed to explore the changes of PNIPAM intramolecular bonding and solvent interactions across the coil-globule transition. Such investigation was, however, limited to the effect produced by a single trehalose molecule on one PNIPAM chain (35-mer) in water, a system in which the trehalose concentration (0.012 M) was clearly unable to affect the polymer LCST with respect to that in pure water. Moreover, the simulation was carried out at a single temperature (300 K), which is still below the LCST in such a highly diluted trehalose solution. Therefore, the results of ref. [36] only refer to trehalose-induced changes of PNIPAM in the coil conformation, leaving unexplored those associated to the coil-globule transition.
Another study that deserves a comment is the experimental work of Shpigelman and coworkers [9] focused on the behavior of PNIPAM LCST at increasing concentration of different sugars, including trehalose, as a way to indirectly probe the stabilization effect of sugars on proteins. Results from isothermal titration microcalorimetry, showing no preferential adsorption of trehalose on the polymer, are found to be in agreement with our findings. However, such study was based on the assumption that the interactions between the two solvent components and the responsive polymer reproduce those of a protein in the same aqueous medium. This is a different approach to that adopted in the present work, where the PNIPAM-trehalose interaction mechanism has been elucidated at a molecular level and then compared to that observed in proteins. In this respect, it should be stressed that the protein-analogue behavior of PNIPAM is not to be taken for granted, as important differences between the two macromolecular systems exist – from the complexity level of their chemical structure to the aggregation and phase separation behavior, to the residual hydration degree of their collapsed state – which could be important in relation to specific phenomena.
As a whole, our findings prove that PNIPAM microgels are capable of efficiently mimicking the sensitivity of proteins to the water-trehalose solvent, giving rise to thermodynamic and dynamic mechanisms fully similar to those responsible for the sugar bioprotective action. The results also highlight that these mechanisms, for instance preferential exclusion, may strongly differ from those, for example preferential adsorption, arising from the polymer interaction with additives of opposite effect on proteins, such as alcohols. Altogether, this work puts forward PNIPAM microgels as a genuinely synthetic protein-like template, that will be useful to investigate, under controlled conditions, the source of different additive actions, a biological issue subject of intensive research.
Future work will aim to provide generality to the present findings for trehalose, by extending the investigation to other additives, with different hydrophilicity and size, yet endowed with biological function. Moreover, as trehalose is also the most effective sugar to stabilize proteins during dehydration, PNIPAM microgels could be used as models for a better understanding of the mechanisms required to proteins to obviate this fundamentally different stress vector, compared to freezing and heat denaturation [82].
Acknowledgments
B.R., L.C, S.C. and C.P. acknowledge support from Università di Perugia (“CarESS” project, D.R. n. 597); L.T., M.B., E.C. and E.Z. from European Research Council - ERC (ERC-CoG-2015, Grant No. 681597 MIMIC); L.T., E.B., E.C. and E.Z. from Ministero dell’Istruzione, dell’Università e della Ricerca - MIUR (FARE project R16XLE2X3L, SOFTART). Support for computational time by CINECA-ISCRA grants (Nos. HP10C1IX5O and HP10C9V0IP) is also acknowledged.
References
References
- [1] A. Finkelstein, O. Ptitsyn, Protein Physics, Academic Press, Elsevier, 2016.
- [2] J. W. Shriver (Ed.), Protein Structure, Stability, and Interactions, Humana Press, 2009. doi:10.1007/978-1-59745-367-7.
- [3] R. O. Costa, R. F. Freitas, Phase behavior of poly (n-isopropylacrylamide) in binary aqueous solutions, Polymer 43 (22) (2002) 5879–5885. doi:10.1016/S0032-3861(02)00507-4.
- [4] H. Yamauchi, Y. Maeda, Lcst and ucst behavior of poly(n-isopropylacrylamide) in dmso/water mixed solvents studied by ir and micro-raman spectroscopy, The Journal of Physical Chemistry B 111 (45) (2007) 12964–12968. doi:10.1021/jp072438s.
- [5] H. Pérez-Ramírez, C. Haro-Pérez, G. Odriozola, Effect of temperature on the cononsolvency of poly (n-isopropylacrylamide)(pnipam) in aqueous 1-propanol, ACS Applied Polymer Materials 1 (11) (2019) 2961–2972. doi:10.1021/acsapm.9b00665.
- [6] Y. Zhang, S. Furyk, D. E. Bergbreiter, P. S. Cremer, Specific ion effects on the water solubility of macromolecules: Pnipam and the hofmeister series, Journal of the American Chemical Society 127 (41) (2005) 14505–14510. doi:10.1021/ja0546424.
- [7] J. Heyda, J. Dzubiella, Thermodynamic description of hofmeister effects on the lcst of thermosensitive polymers, The Journal of Physical Chemistry B 118 (37) (2014) 10979–10988. doi:10.1021/jp5041635.
- [8] A. Pica, G. Graziano, Effect of sodium thiocyanate and sodium perchlorate on poly(n-isopropylacrylamide) collapse, Physical Chemistry Chemical Physics 22 (1) (2020) 189–195. doi:10.1039/C9CP05706D.
- [9] A. Shpigelman, I. Portnaya, O. Ramon, Y. D. Livney, Saccharide-structure effects on poly -isopropylacrylamide phase transition in aqueous media; reflections on protein stability, Journal of Polymer Science Part B: Polymer Physics 46 (2008) 2307–2318. doi:10.1002/polb.21562.
- [10] L. B. Sagle, Y. Zhang, V. A. Litosh, X. Chen, Y. Cho, P. S. Cremer, Investigating the hydrogen-bonding model of urea denaturation, Journal of the American Chemical Society 131 (26) (2009) 9304–9310. doi:10.1021/ja9016057.
- [11] S. M. Kim, S. M. Lee, Y. C. Bae, Influence of hydroxyl group for thermoresponsive poly(n-isopropylacrylamide) gel particles in water/co-solvent (1,3-propanediol, glycerol) systems, European Polymer Journal 54 (2014) 151–159. doi:10.1016/j.eurpolymj.2014.03.008.
- [12] M. A. Schroer, J. Michalowsky, B. Fischer, J. Smiatek, G. Grübel, Stabilizing effect of tmao on globular pnipam states: preferential attraction induces preferential hydration, Phys. Chem. Chem. Phys. 18 (46) (2016) 31459–31470. doi:10.1039/C6CP05991K.
- [13] P. Narang, P. Venkatesu, Unravelling the role of polyols with increasing carbon chain length and oh groups on the phase transition behavior of pnipam, New J. Chem. 42 (16) (2018) 13708–13717. doi:10.1039/C8NJ02510J.
- [14] R. Umapathi, I. Khan, J. A. Coutinho, P. Venkatesu, Unravelling the interactions between biomedical thermoresponsive polymer and biocompatible ionic liquids, Journal of Molecular Liquids 300 (2020) 112362. doi:10.1016/j.molliq.2019.112362.
- [15] R. Umapathi, K. Kumar, G. M. Rani, P. Venkatesu, Influence of biological stimuli on the phase behaviour of a biomedical thermoresponsive polymer: A comparative investigation of hemeproteins, Journal of Colloid and Interface Science 541 (2019) 1–11. doi:10.1016/j.jcis.2019.01.062.
- [16] P. Narang, P. Venkatesu, Efficacy of several additives to modulate the phase behavior of biomedical polymers: A comprehensive and comparative outlook, Advances in Colloid and Interface Science 274 (2019) 102042. doi:10.1016/j.cis.2019.102042.
- [17] M. Martinez-Moro, J. Jenczyk, J. M. Giussi, S. Jurga, S. E. Moya, Kinetics of the thermal response of poly(n-isopropylacrylamide co methacrylic acid) hydrogel microparticles under different environmental stimuli: A time-lapse nmr study, Journal of Colloid and Interface Science 580 (2020) 439–448. doi:10.1016/j.jcis.2020.07.049.
- [18] K. Kumar, R. Umapathi, K. Ramesh, S.-K. Hwang, K. T. Lim, Y. S. Huh, P. Venkatesu, Biological stimuli-induced phase transition of a synthesized block copolymer: Preferential interactions between pnipam-b-pnvcl and heme proteins, Langmuir 37 (5) (2021) 1682–1696. doi:10.1021/acs.langmuir.0c02900.
- [19] E. I. Tiktopulo, V. E. Bychkova, J. Rička, O. B. Ptitsyn, Cooperativity of the coil-globule transition in a homopolymer: microcalorimetric study of poly(-isopropylacrylamide), Macromolecules 27 (1994) 2879–2882. doi:10.1021/ma00088a031.
- [20] M. Zanatta, L. Tavagnacco, E. Buratti, M. Bertoldo, F. Natali, E. Chiessi, A. Orecchini, E. Zaccarelli, Evidence of a low-temperature dynamical transition in concentrated microgels, Science Advances 4 (9). doi:10.1126/sciadv.aat5895.
- [21] A. Fernandez-Nieves, H. Wyss, J. Mattsson, D. Weitz (Eds.), Microgel suspensions: fundamentals and applications, Wiley-VCH Verlag, Germany, 2011. doi:10.1002/9783527632992.
- [22] G. M. Beattie, J. Crowe, A. Lopez, V. Cirulli, C. Ricordi, A. Hayek, Trehalose: a cryoprotectant that enhances recovery and preserves function of human pancreatic islets after long-term storage, Diabetes 46 (3) (1997) 519–523. doi:10.2337/diab.46.3.519.
- [23] P. Carninci, Y. Nishiyama, A. Westover, M. Itoh, S. Nagaoka, N. Sasaki, Y. Okazaki, M. Muramatsu, Y. Hayashizaki, Thermostabilization and thermoactivation of thermolabile enzymes by trehalose and its application for the synthesis of full length cdna, Proceedings of the National Academy of Sciences 95 (2) (1998) 520–524. doi:10.1073/pnas.95.2.520.
- [24] N. Benaroudj, D. Lee, A. Goldberg, Trehalose accumulation during cellular stress protects cells and cellular proteins from damage by oxygen radicals, The Journal of Biological Chemistry 276 (26) (2001) 24261–24267. doi:10.1074/jbc.m101487200.
- [25] A. Cesàro, All dried up, Nature materials 5 (8) (2006) 593–594.
- [26] J. K. Kaushik, R. Bhat, Why is trehalose an exceptional protein stabilizer? an analysis of the thermal stability of proteins in the presence of the compatible osmolyte trehalose, Journal of Biological Chemistry 278 (29) (2003) 26458–26465. doi:10.1074/jbc.M300815200.
- [27] N. K. Jain, I. Roy, Effect of trehalose on protein structure, Protein Science 18 (1) (2009) 24–36. doi:https://doi.org/10.1002/pro.3.
- [28] T. Arakawa, S. N. Timasheff, Stabilization of protein structure by sugars, Biochemistry 21 (1982) 6536–6544. doi:10.1021/bi00268a033.
- [29] G. Xie, S. N. Timasheff, The thermodynamic mechanism of protein stabilization by trehalose, Biophysical Chemistry 64 (1) (1997) 25–43. doi:10.1016/S0301-4622(96)02222-3.
- [30] M. T. Cicerone, C. L. Soles, Fast dynamics and stabilization of proteins: binary glasses of trehalose and glycerol, Biophysical Journal 86 (2004) 3836–3845. doi:10.1529/biophysj.103.035519.
- [31] S. Paul, S. Paul, Molecular insights into the role of aqueous trehalose solution on temperature-induced protein denaturation, The Journal of Physical Chemistry B 119 (4) (2015) 1598–1610. doi:10.1021/jp510423n.
- [32] M. Malferrari, A. Savitsky, W. Lubitz, K. Möbius, G. Venturoli, Protein immobilization capabilities of sucrose and trehalose glasses: The effect of protein/sugar concentration unraveled by high-field epr, The Journal of Physical Chemistry Letters 7 (23) (2016) 4871–4877. doi:10.1021/acs.jpclett.6b02449.
- [33] D. Corradini, E. G. Strekalova, H. E. Stanley, P. Gallo, Microscopic mechanism of protein cryopreservation in an aqueous solution with trehalose, Scientific reports 3 (2013) 1218. doi:10.1038/srep01218.
- [34] S. Corezzi, M. Paolantoni, P. Sassi, A. Morresi, D. Fioretto, L. Comez, Trehalose-induced slowdown of lysozyme hydration dynamics probed by EDLS spectroscopy, Journal of Chemical Physics 151.
- [35] G. Camisasca, M. De Marzio, P. Gallo, Effect of trehalose on protein cryoprotection: Insights into the mechanism of slowing down of hydration water, The Journal of Chemical Physics 153 (22) (2020) 224503. doi:10.1063/5.0033526.
- [36] P. Narang, S. B. Vepuri, P. Venkatesu, M. E. Soliman, An unexplored remarkable pnipam-osmolyte interaction study: An integrated experimental and simulation approach, Journal of Colloid and Interface Science 504 (2017) 417–428. doi:10.1016/j.jcis.2017.05.109.
- [37] M. Karg, S. Prévost, A. Brandt, D. Wallacher, R. von Klitzing, T. Hellweg, Poly-NIPAM microgels with different cross-linker densities. In: Intelligent Hydrogels. Progress in Colloid and Polymer Science, Springer, Berlin, 2013.
- [38] L. Arleth, X. Xia, R. Hjelm, J. Wu, Z. Hu, Volume transition and internal structures of small poly(n-isopropylacrylamide) microgels, Journal of Polymer Science. Part B, Polymer Physics 43 (2005) 849–860. doi:10.1002/polb.20375.
- [39] M. Andersson, S. L. Maunu, Structural studies of poly(n-isopropylacrylamide) microgels: Effect of sds surfactant concentration in the microgel synthesis, Journal of Polymer Science Part B: Polymer Physics 44 (23) (2006) 3305–3314. doi:10.1002/polb.20971.
- [40] M. Philipp, U. Muller, R. Aleksandrova, R. Sanctuary, P. Muller-Buschbaum, J. K. Kruger, On the elastic nature of the demixing transition of aqueous pnipam solutions, Soft Matter 8 (2012) 11387–11395. doi:10.1039/C2SM26527C.
- [41] L. Korson, W. Drost-Hansen, F. J. Millero, Viscosity of water at various temperatures, The Journal of Physical Chemistry 73 (1) (1969) 34–39. doi:10.1021/j100721a006.
- [42] W. L. Jorgensen, D. S. Maxwell, J. Tirado-Rives, Development and testing of the opls all-atom force field on conformational energetics and properties of organic liquids, J. Am. Chem. Soc. 118 (45) (1996) 11225–11236. doi:10.1021/ja9621760.
- [43] S. W. I. Siu, K. Pluhackova, R. A. Böckmann, Optimization of the opls-aa force field for long hydrocarbons, J. Chem. Theory Comput. 8 (4) (2012) 1459–1470. doi:10.1021/ct200908r.
- [44] W. Damm, A. Frontera, J. Tirado-Rives, W. L. Jorgensen, Opls all-atom force field for carbohydrates, Journal of Computational Chemistry 18 (16) (1997) 1955–1970.
- [45] J. L. F. Abascal, E. Sanz, R. G. Fernández, C. Vega, A potential model for the study of ices and amorphous water: Tip4p/ice, J. Chem. Phys. 122 (23) (2005) 234511. doi:10.1063/1.1931662.
- [46] L. Tavagnacco, E. Zaccarelli, E. Chiessi, On the molecular origin of the cooperative coil-to-globule transition of poly(n-isopropylacrylamide) in water, Physical Chemistry Chemical Physics 20 (2018) 9997–10010. doi:10.1039/C8CP00537K.
- [47] L. Tavagnacco, E. Chiessi, M. Zanatta, A. Orecchini, E. Zaccarelli, Water–polymer coupling induces a dynamical transition in microgels, The Journal of Physical Chemistry Letters 10 (4) (2019) 870–876. doi:10.1021/acs.jpclett.9b00190.
- [48] L. Tavagnacco, M. Zanatta, E. Buratti, B. Rosi, B. Frick, F. Natali, J. Ollivier, E. Chiessi, M. Bertoldo, E. Zaccarelli, A. Orecchini, Proteinlike dynamical transition of hydrated polymer chains, Physical Review Research 3 (2021) 013191. doi:10.1103/PhysRevResearch.3.013191.
- [49] M. J. Abraham, T. Murtola, R. Schulz, S. Páll, J. C. Smith, B. Hess, E. Lindahl, Gromacs: High performance molecular simulations through multi-level parallelism from laptops to supercomputers, SoftwareX 1-2 (2015) 19 – 25. doi:https://doi.org/10.1016/j.softx.2015.06.001.
- [50] W. Humphrey, A. Dalke, K. Schulten, Vmd: Visual molecular dynamics, Journal of Molecular Graphics 14 (1) (1996) 33 – 38. doi:https://doi.org/10.1016/0263-7855(96)00018-5.
- [51] A. Bondi, Van der waals volumes and radii, Journal of Physical Chemistry 68 (1964) 441–451. doi:10.1021/j100785a001.
- [52] F. Eisenhaber, P. Lijnzaad, P. Agros, C. Sander, M. Scahrf, The double cubic lattice method: Efficient approaches to numerical integration of surface area and volume and to dot surface contouring of molecular assemblies, Journal of Computational Chemistry 16 (3) (1995) 273–284. doi:10.1002/jcc.540160303.
- [53] M. E. Gallina, L. Comez, A. Morresi, M. Paolantoni, S. Perticaroli, P. Sassi, D. Fioretto, Rotational dynamics of trehalose in aqueous solutions studied by depolarized light scattering, The Journal of Chemical Physics 132 (21) (2010) 214508. doi:10.1063/1.3430555.
- [54] J. Taylor, N. Greenfield, B. Wu, P. Privalov, A calorimetric study of the folding-unfolding of an alpha-helix with covalently closed n and c-terminal loops, Journal of Molecular Biology 291 (1999) 965–976. doi:10.1006/jmbi.1999.3025.
- [55] A. V. Persikov, Y. Xu, B. Brodsky, Equilibrium thermal transitions of collagen model peptides, Protein Science 13 (2004) 893–902. doi:10.1110/ps.03501704.
- [56] C. Fuciños, P. Fuciños, M. Míguel, I. Katime, L. M. Pastrana, M. L. Rúa, Temperature- and ph-sensitive nanohydrogels of poly(-isopropylacrylamide) for food packaging applications: modelling the swelling-collapse behaviour, PLOS ONE 9 (2014) e87190. doi:10.1371/journal.pone.0087190.
- [57] M. H. Futscher, M. Philipp, P. Müller-Buschbaum, A. Schulte, The role of backbone hydration of poly(n-isopropyl acrylamide across the volume phase transition compared to its monomer, Scientific Reports 7 (2017) 17012. doi:10.1038/s41598-017-17272-7.
- [58] Z. Liu, Q. Gao, J. Chen, J. Deng, K. Lin, X. Xing, Negative thermal expansion in molecular materials, Chemical Communications 54 (2018) 5164–5176. doi:10.1039/C8CC01153B.
- [59] C. G. Lopez, W. Richtering, Does flory–rehner theory quantitatively describe the swelling of thermoresponsive microgels?, Soft Matter 13 (44) (2017) 8271–8280. doi:10.1039/c7sm01274h.
- [60] I. Bischofberger, V. Trappe, New aspects in the phase behaviour of poly-n-isopropyl acrylamide: systematic temperature dependent shrinking of pnipam assemblies well beyond the lcst, Scientific Reports 5 (1) (2015) 15520. doi:10.1038/srep15520.
- [61] A. Ninarello, J. J. Crassous, D. Paloli, F. Camerin, N. Gnan, L. Rovigatti, P. Schurtenberger, E. Zaccarelli, Modeling microgels with a controlled structure across the volume phase transition, Macromolecules 52 (20) (2019) 7584–7592. doi:10.1021/acs.macromol.9b01122.
- [62] N. C. Woodward, B. Z. Chowdhry, S. A. Leharne, M. J. Snowden, The interaction of sodium dodecyl sulphate with colloidal microgel particles, European Polymer Journal 36 (7) (2000) 1355 – 1364. doi:10.1016/S0014-3057(99)00207-4.
- [63] I. Bischofberger, D. C. E. Calzolari, P. D. L. Rios, I. Jelezarov, V. Trappe, Hydrophobic hydration of poly-n-isopropyl acrylamide: a matter of the mean energetic state of water, Scientific Reports 4 (2014) 4377.
- [64] H. G. Schild, D. A. Tirrell, Microcalorimetric detection of lower critical solution temperatures in aqueous polymer solutions, Journal of Physical Chemistry 94 (10) (1990) 4352–4356. doi:10.1021/j100373a088.
- [65] P. Kujawa, F. M. Winnik, Volumetric studies of aqueous polymer solutions using pressure perturbation calorimetry: A new look at the temperature-induced phase transition of poly(n-isopropylacrylamide) in water and d2o, Macromolecules 34 (12) (2001) 4130–4135. doi:10.1021/ma002082h.
- [66] S. Fujishige, K. Kubota, I. Ando, Phase transition of aqueous solutions of poly(n-isopropylacrylamide) and poly(n-isopropylmethacrylamide), The Journal of Physical Chemistry 93 (8) (1989) 3311–3313. doi:10.1021/j100345a085.
- [67] Y. Ding, X. Ye, G. Zhang, Microcalorimetric investigation on aggregation and dissolution of poly(-isopropylacrylamide) chains in water, Macromolecules 38 (2005) 904–908. doi:10.1021/ma048460q.
- [68] S. Sun, P. Wu, W. Zhang, W. Zhang, X. Zhu, Effect of structural constraint on dynamic self-assembly behavior of pnipam-based nonlinear multihydrophilic block copolymers, Soft Matter 9 (2013) 1807–1816. doi:10.1039/C2SM27183D.
- [69] P. N. Jethva, J. B. Udgaonkar, Modulation of the extent of cooperative structural change during protein folding by chemical denaturant, The Journal of Physical Chemistry B 121 (35) (2017) 8263–8275. doi:10.1021/acs.jpcb.7b04473.
- [70] P. N. Jethva, J. B. Udgaonkar, The osmolyte tmao modulates protein folding cooperativity by altering global protein stability, Biochemistry 57 (40) (2018) 5851–5863. doi:10.1021/acs.biochem.8b00698.
- [71] Y. Maeda, T. Higuchi, I. Ikeda, Change in hydration state during the coil-globule transition of aqueous solutions of poly(-isopropylacrylamide as evidenced by ftir spectroscopy, Langmuir 16 (2000) 7503–7509. doi:10.1021/la0001575.
- [72] Z. Ahmed, E. A. Gooding, K. V. Pimenov, L. Wang, S. A. Asher, Uv resonance raman determination of molecular mechanism of poly(-isopropylacrylamide) volume phase transition, Journal of Physical Chemistry B 113 (2009) 4248–4256. doi:10.1021/jp810685g.
- [73] N. C. Maiti, M. M. Apetri, M. G. Zagorski, P. R. Carey, V. E. Anderson, Raman spectroscopic characterization of secondary structure in natively unfolded proteins: -synuclein, Journal of the American Chemical Society 126 (8) (2004) 2399–2408. doi:10.1021/ja0356176.
- [74] B. Sun, Y. Lin, P. Wu, H. W. Siesler, A ftir and 2d-ir spectroscopic study on the microdynamics phase separation mechanism of the poly(n-isopropylacrylamide) aqueous solution, Macromolecules 41 (4) (2008) 1512–1520. doi:10.1021/ma702062h.
- [75] R. Pelton, Poly(n-isopropylacrylamide)(pnipam) is never hydrophobic, Journal of Colloid and Interface Science 348 (2) (2010) 673–674. doi:10.1016/j.jcis.2010.05.034.
- [76] E. S. Courtenay, M. W. Capp, C. F. Anderson, M. T. Record Jr., Vapor pressure osmometry studies of osmolyte-protein interactions: Implications for the action of osmoprotectants in vivo and for the interpretation of “osmotic stress” experiments in vitro, Biochemistry 39 (15) (2000) 4455–4471. doi:10.1021/bi992887l.
- [77] D. P. Miller, J. J. de Pablo, Calorimetric solution properties of simple saccharides and their significance for the stabilization of biological structure and function, The Journal of Physical Chemistry B 104 (37) (2000) 8876–8883. doi:10.1021/jp000807d.
- [78] L. Lupi, L. Comez, M. Paolantoni, S. Perticaroli, P. Sassi, A. Morresi, B. M. Ladanyi, D. Fioretto, Hydration and aggregation in mono- and disaccharide aqueous solutions by gigahertz-to-terahertz light scattering and molecular dynamics simulations, The Journal of Physical Chemistry B 116 (51) (2012) 14760–14767. doi:10.1021/jp3079869.
- [79] D. Fioretto, L. Comez, S. Corezzi, M. Paolantoni, P. Sassi, A. Morresi, Solvent sharing models for non-interacting solute molecules: The case of glucose and trehalose water solutions, Food Biophysics 8 (3) (2013) 177–182. doi:10.1007/s11483-013-9306-3.
- [80] L. Comez, L. Lupi, A. Morresi, M. Paolantoni, P. Sassi, D. Fioretto, More is different: Experimental results on the effect of biomolecules on the dynamics of hydration water, The Journal of Physical Chemistry Letters 4 (7) (2013) 1188–1192. doi:10.1021/jz400360v.
- [81] L. Tavagnacco, E. Zaccarelli, E. Chiessi, Molecular description of the coil-to globule transition of poly(n-isopropylacrylamide) in water/ethanol mixture at low alcohol concentration, Journal of Molecular Liquids 297 (2020) 111928. doi:10.1016/j.molliq.2019.111928.
- [82] J. H. Crowe, J. F. Carpenter, L. M. Crowe, T. J. Anchordoguy, Are freezing and dehydration similar stress vectors? a comparison of modes of interaction of stabilizing solutes with biomolecules, Cryobiology 27 (3) (1990) 219–231. doi:10.1016/0011-2240(90)90023-W.
Supporting Information
1 Experimental
1.1 Analysis of DLS spectra with the cumulant method
The quantity measured in a dynamic light scattering (DLS) experiment is , the autocorrelation function of the scattered intensity. This is linked to the autocorrelation function of the scattered field, , by the Siegert relation , where is a measured baseline and is the coherence factor, an instrumental parameter of the order of unit. Therefore, is proportional to . For a monodisperse diluted suspension of macromolecular objects, decays as a single exponential, so that , where the decay time is related to the translational diffusion coefficient of the particles as . For a polydisperse suspension, does not decay exponentially, and its deviation from a single exponential behavior contains information about the distribution of diffusion coefficients. In this case , and hence , can be represented as a superposition of exponential contributions, each one arising from a population of particles with a certain diffusion coefficient and weighted by the population scattering intensity, i.e.,
| (2) |
with , the normalized distribution function of the scattered intensity from particles with diffusion coefficient , and a proportionality constant. The quantity in equation (2) can be analyzed by the method of cumulants [1], by expanding its logarithm in a power series in ,
| (3) |
where is called the nth cumulant. The cumulants are related to the moments of the diffusion coefficient distribution. The explicit form of the first two of them is
| (4) | |||||
| (5) |
i.e., they respectively provide the average value and variance of
the diffusion coefficient distribution. The average values extracted
by this method, which are weighted by the particle scattering
intensity, are defined as z-average values, and denoted by
.
Therefore, by analyzing with a polynomial function the quantity
obtained
from the experiment, if the data are good at small times, one
obtains and its variance from the
first and second-order polynomial terms. Then, the hydrodynamic
radius of the particles can be determined as the z-average
particle size by using the Stokes-Einstein relation
. Here, is the Boltzmann’s
constant, the absolute temperature, and the viscosity of
the dispersing medium.
In the presence of a scattering contribution due to the solvent
molecules, as it is the case for microgel suspensions in
water-trehalose solution (Fig. S2), the cumulant analysis does not
apply to , but only to its contribution due to the
Brownian motion of suspended microgel particles, as illustrated in
Fig. S3.
1.2 Supplementary figures
In the following, we report additional information obtained from experimental methods applied to PNIPAM microgel suspensions in water and in water-trehalose solution at trehalose mole fraction .
-
1.
Figure S1 reports a characterization of the solvent media in which the microgels were suspended.
-
2.
Figure S2 shows the intensity autocorrelation function, , obtained by DLS at different temperatures for microgels in water-trehalose solution.
-
3.
Figure S3 illustrates the cumulants analysis performed on the DLS spectra of the microgel suspension in water-trehalose solution.
-
4.
Figure S4 compares the temperature dependence of the hydrodynamic radius, , of microgels in water and in water-trehalose solution.
-
5.
Figure S5 illustrates the normalization procedure of the Raman spectra of microgel suspensions in water and in water-trehalose solution, needed to carry out the solvent subtraction procedure.
-
6.
Figure S6 illustrates the solvent subtraction procedure performed on the Raman spectra of microgel suspensions in water and in water-trehalose solution.
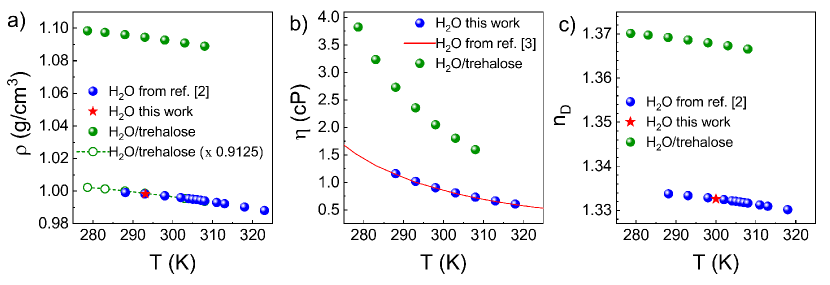
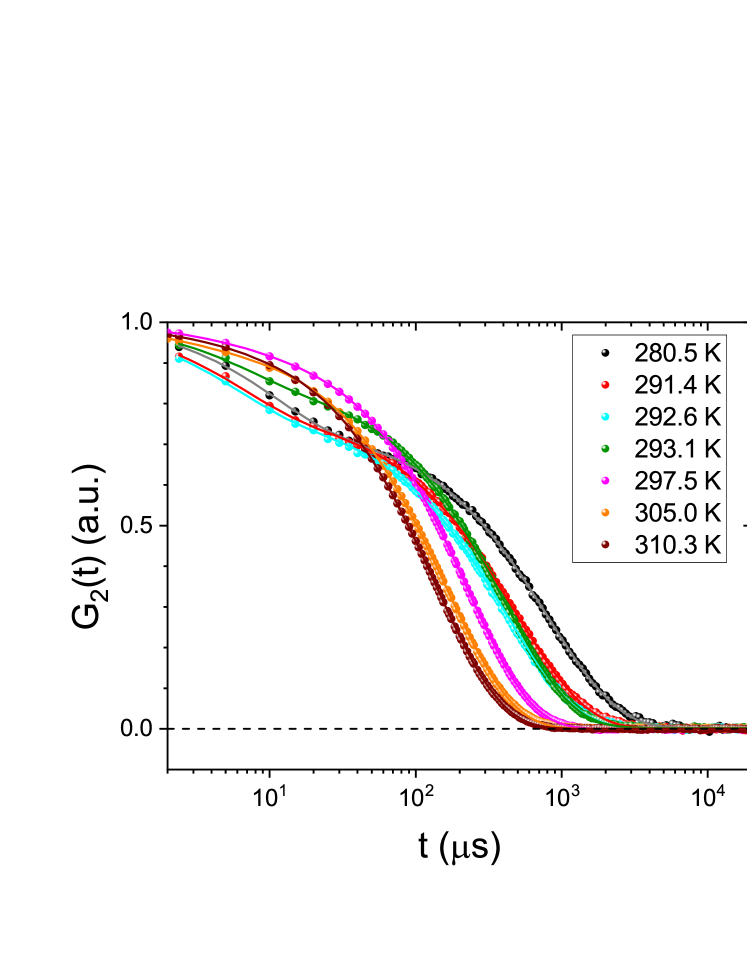
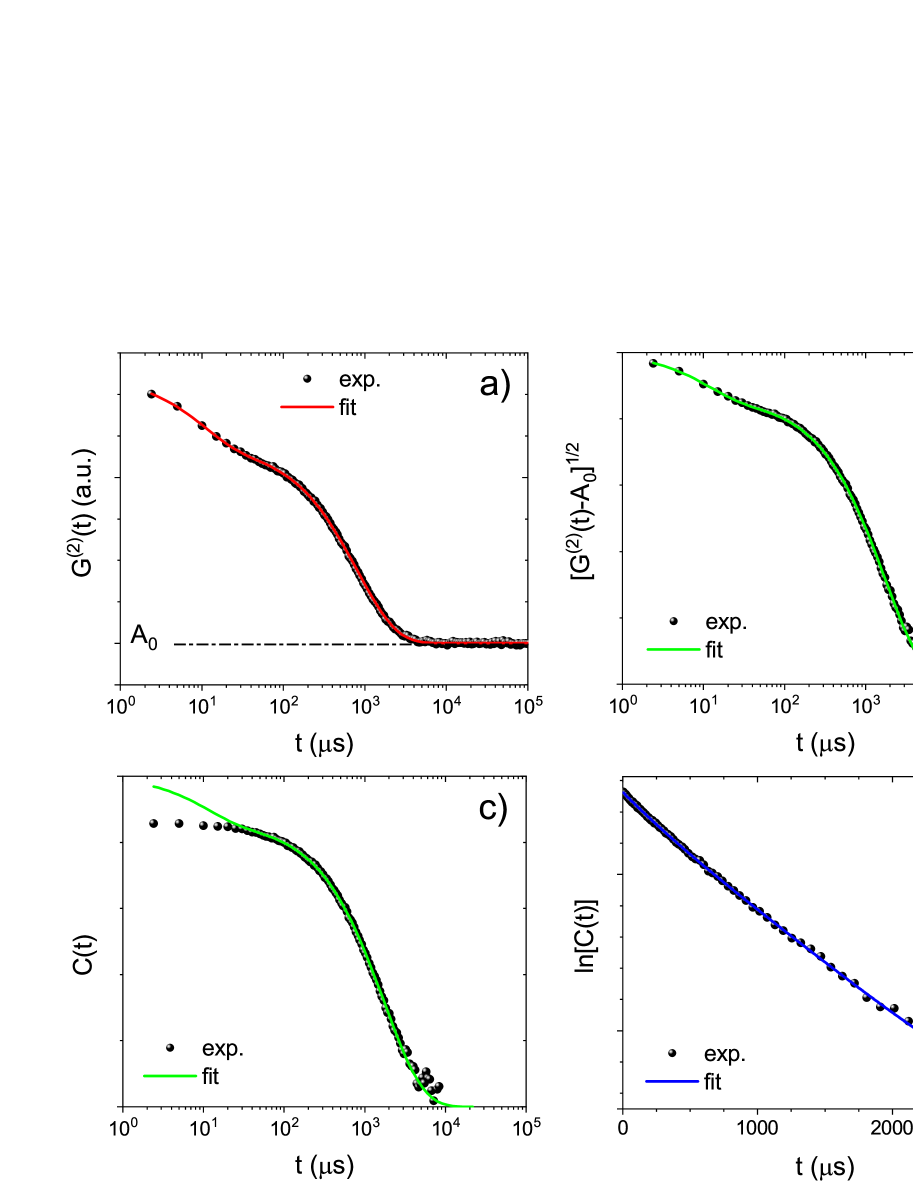
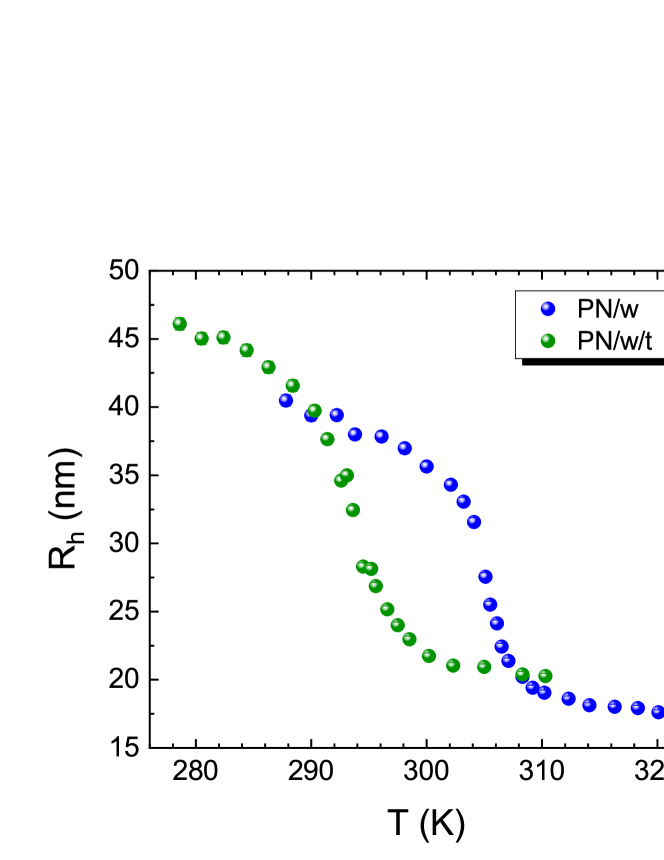
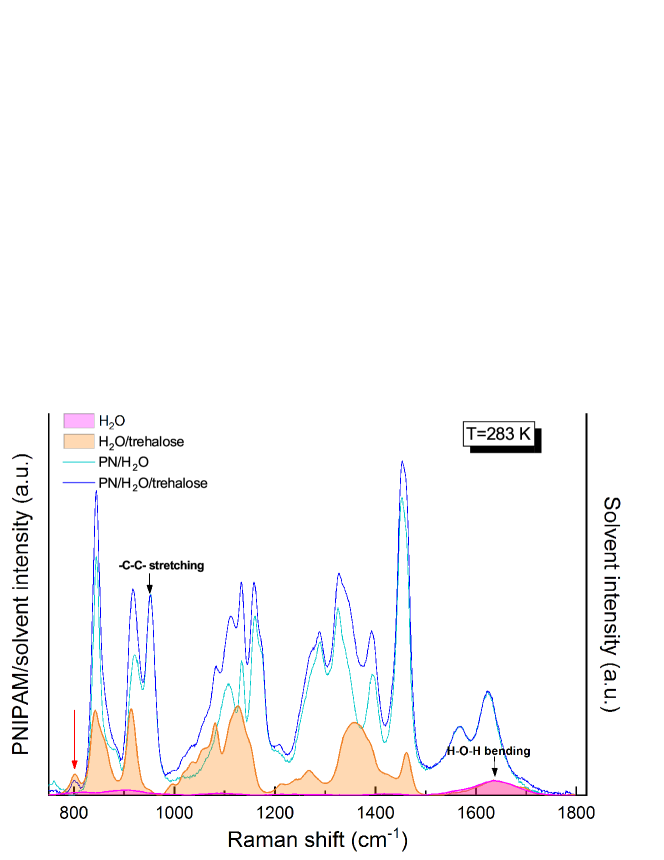
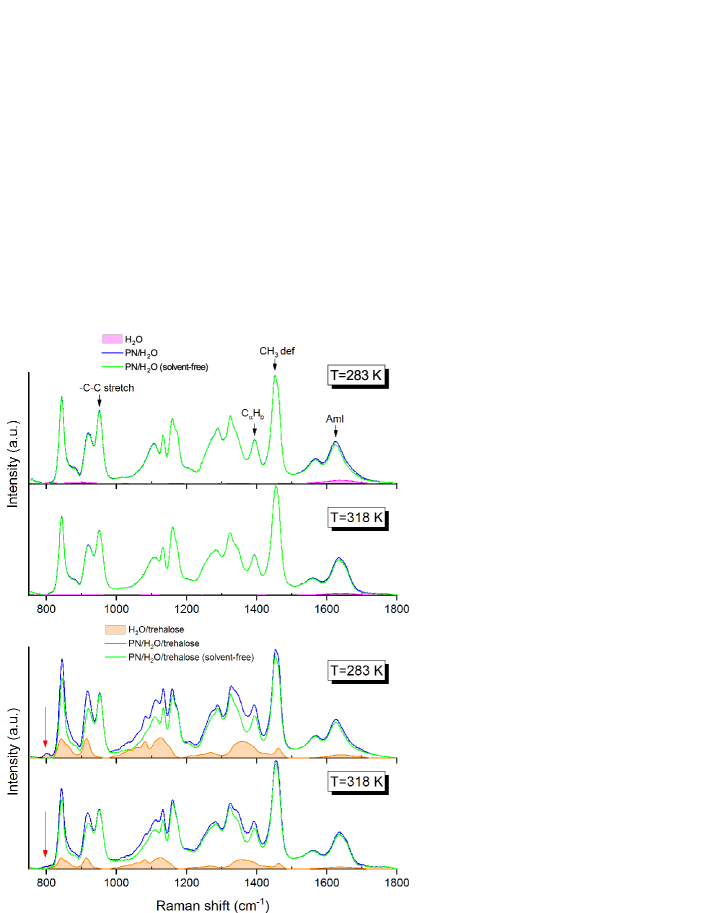
2 Molecular dynamics simulations
2.1 Model and simulation procedure
The model of PNIPAM solution was assembled by centering the polymer chain in a cubic box of side 9 nm. The chain conformation of the starting structure was obtained by imposing values to the backbone dihedral angles corresponding to states of minimum conformational energy for the dyads composing the 30-mer [4]. The chain was oriented along a diagonal of the cubic box to maximize the distance between periodic images. Then, the proper number of water or water and trehalose molecules was added randomly around the chain to replicate the experimental solvent, i.e., pure water or water-trehalose mixture at . Energy minimization was carried out with tolerance of 100 kJ mol-1nm-1, and the resulting configuration was used to start simulations at the two studied temperatures (283 and 318 K). After equilibration the box side was about 8.2 nm and 8.9 nm for the water-trehalose and the aqueous solution, respectively. MD simulation trajectories were acquired with the leapfrog integration algorithm [5] with a time step of 2 fs. Cubic periodic boundary conditions and minimum image convention were applied. The length of bonds involving hydrogen atoms was constrained with the LINCS procedure [6]. The temperature was controlled by the velocity rescaling thermostat [7], with a time constant of 0.1 ps. The pressure of 1 atm was maintained by the Parrinello-Rahman barostat [8, 9], with a time constant of 2 ps. Electrostatic interactions were treated with the smooth particle-mesh Ewald method [10] with a cutoff of nonbonded interactions of 1 nm.
2.2 Supplementary figures
In the following, we report additional characterizations of the solution behavior of PNIPAM in water and in water-trehalose at trehalose mole fraction , as obtained from the MD simulations.
-
1.
Figure S7 compares the distribution of values of PNIPAM radius of gyration, , in water and in water-trehalose.
-
2.
Figure S8 compares the distribution of values of water accessible surface area (WASA) of PNIPAM in water and in water-trehalose.
-
3.
Figure S9 shows the radial distribution functions, , calculated between the anomeric oxygen of trehalose and specific atoms of PNIPAM belonging to hydrophilic and hydrophobic groups.
-
4.
Figure S10 reports the radial distribution functions characterizing PNIPAM hydration.
-
5.
Figure S11 shows the water coordination number, , of PNIPAM specific groups, as obtained by integration of the corresponding radial distribution functions reported in Fig. S10.
-
6.
Figure S12 shows a comparison between the mean square displacements (MSDs) of water oxygen atoms, PNIPAM hydrogen atoms, and trehalose hydrogen atoms.
-
7.
Figure S13 reports the time behavior of the number fraction of trehalose and water molecules in the first solvation shell.
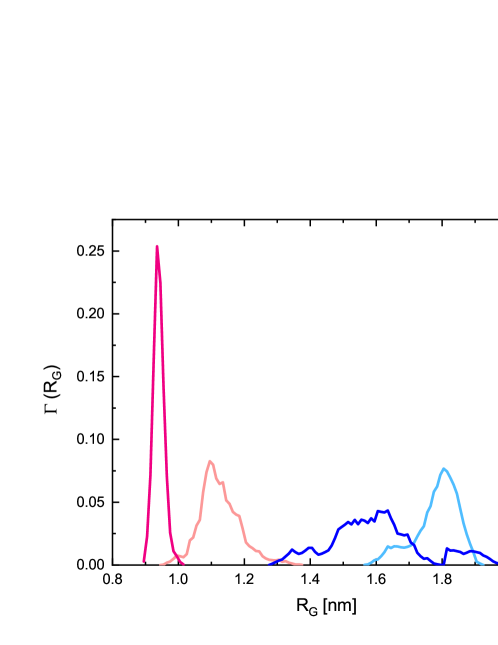
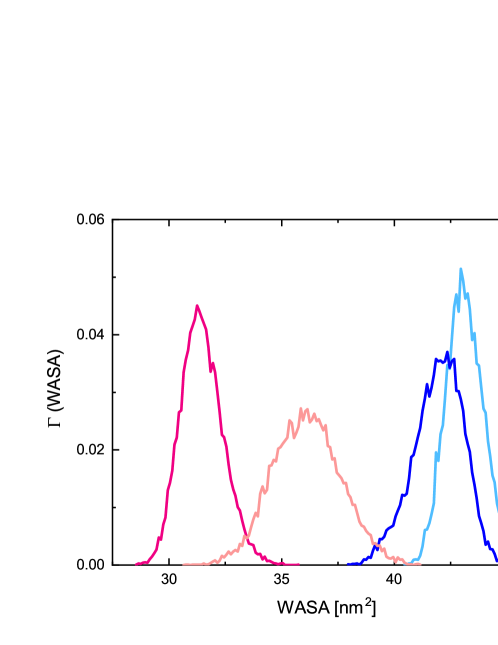
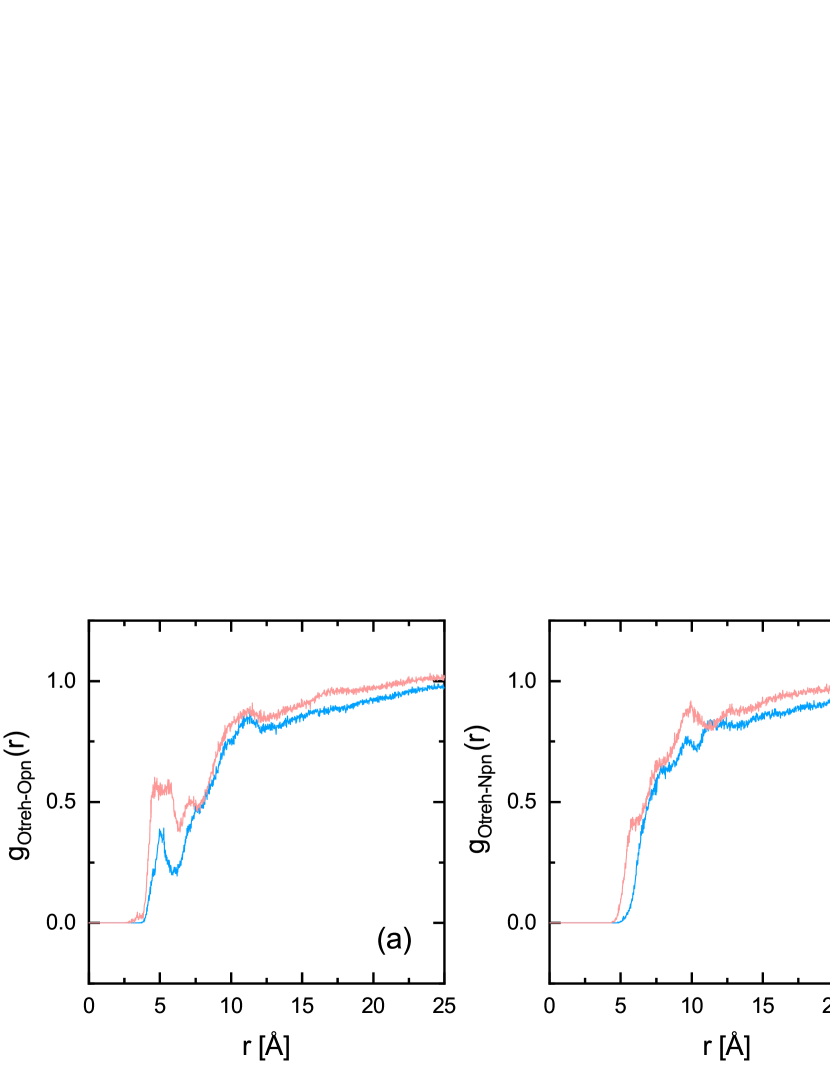
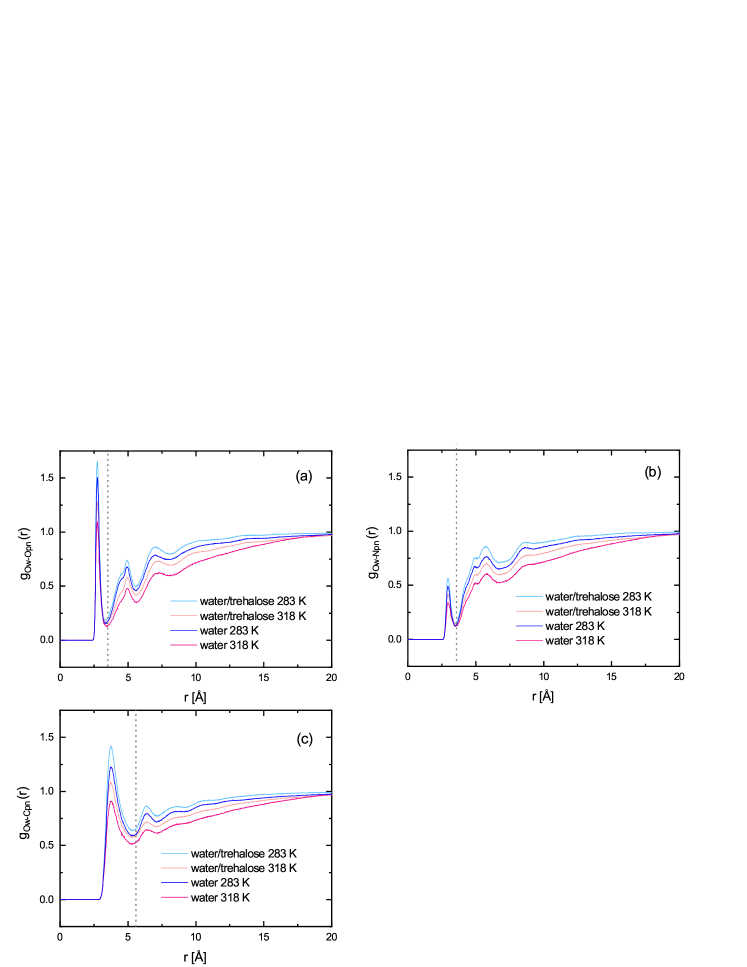
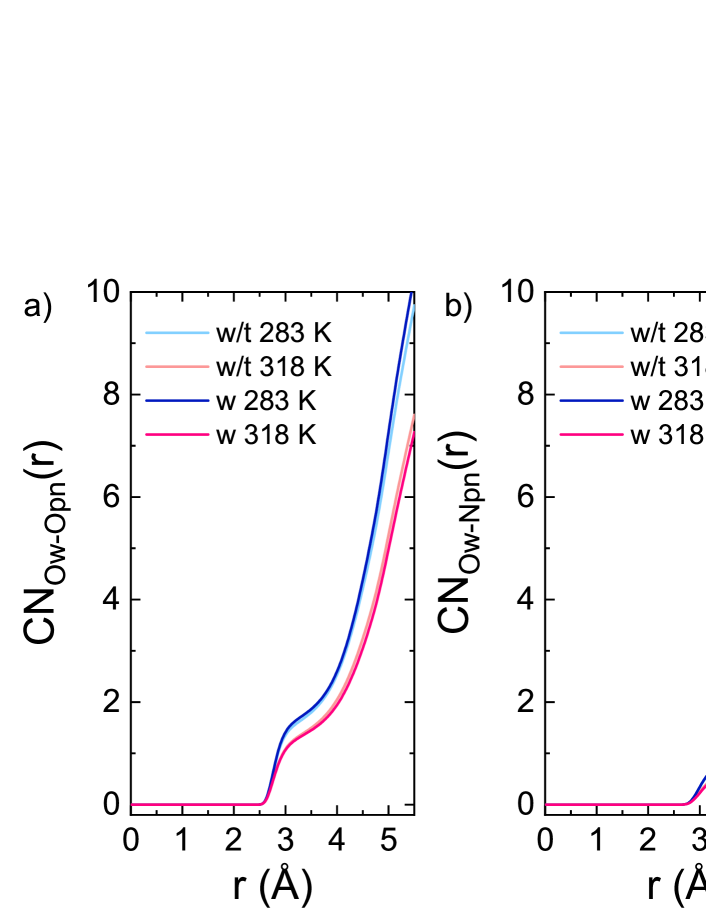
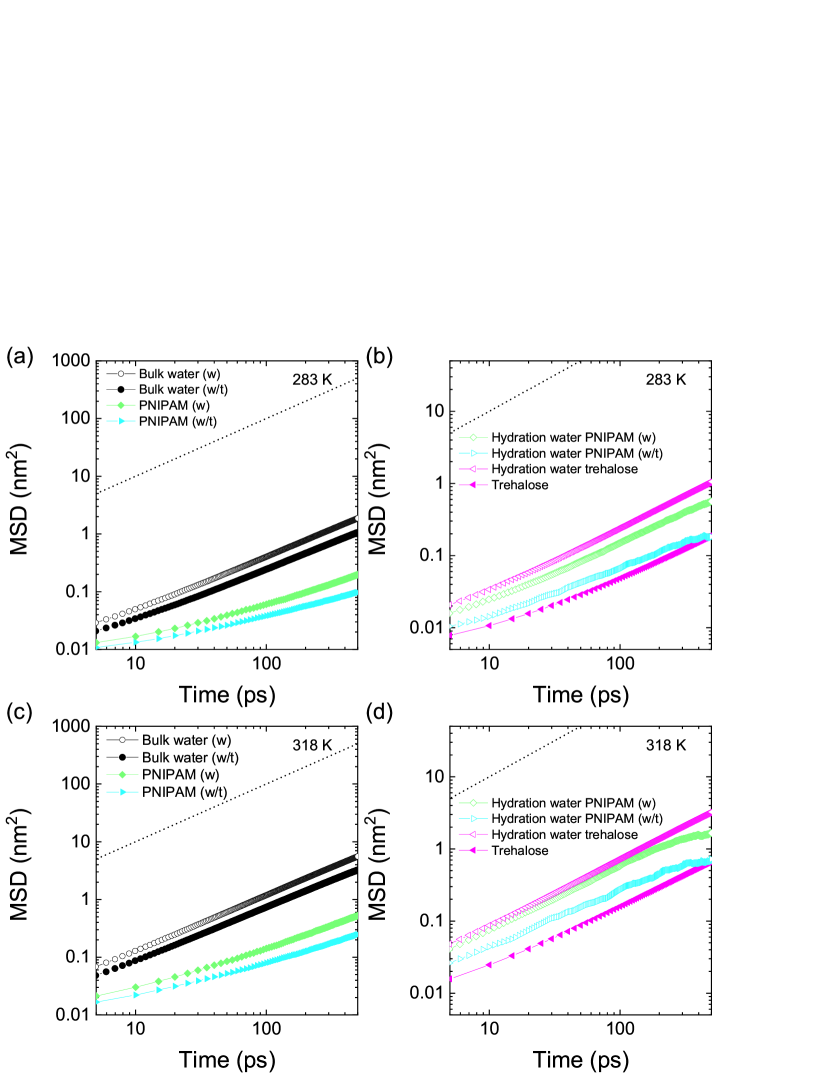
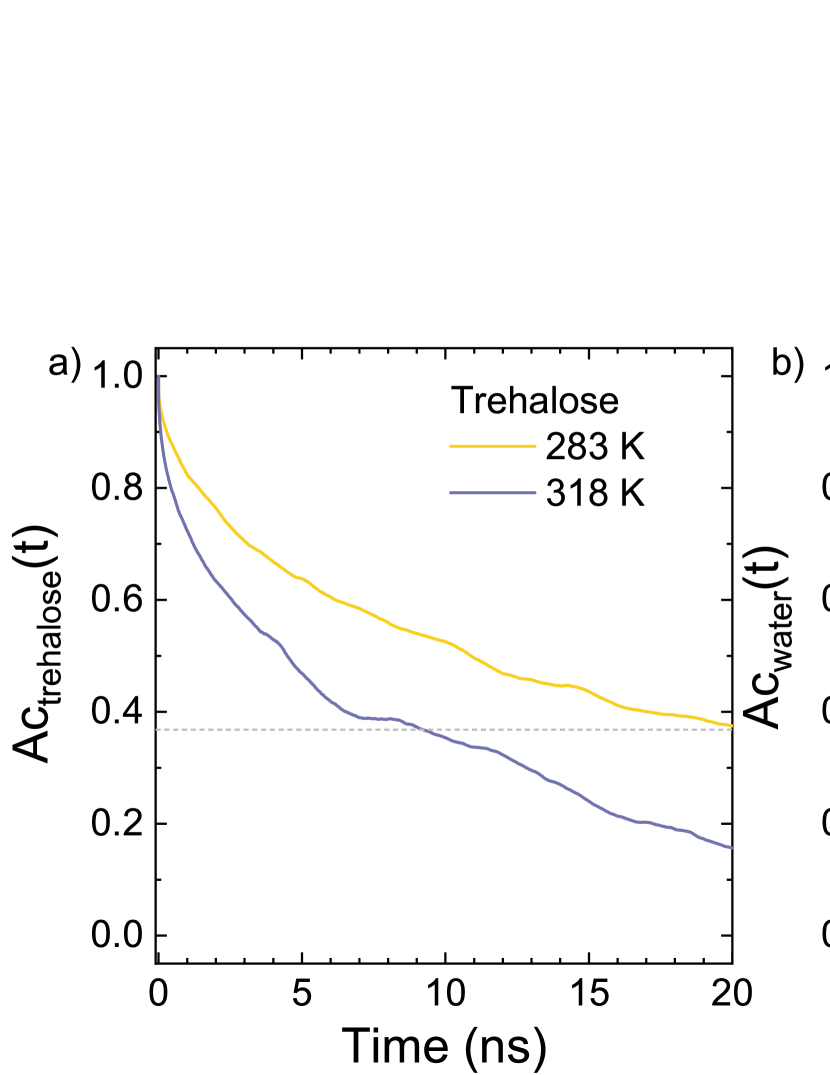
Supplementary references
References
- [1] Bruce J. Berne and Robert Pecora, Dynamic Light Scattering: With Applications to Chemistry, Biology, and Physics, Dover Publications, New York (2000)
- [2] M. Philipp, U. Muller, R. Aleksandrova, R. Sanctuary, P. Muller-Buschbaum, J. K. Kruger, On the elastic nature of the demixing transition of aqueous PNIPAM solutions, Soft Matter 8, 11387-11395 (2012)
- [3] L.Korson, W.Drost-Hansen, F. J. Millero, Viscosity of water at various temperatures, J. Phys. Chem. 73, 34-39 (1969)
- [4] P. J. Flory, J. E. Mark, A. Abe, Random-Coil Configurations of Vinyl Polymer Chains. The Influence of Stereoregularity on the Average Dimensions, J. Am. Chem. Soc. 88, 639-650 (1966)
- [5] R. W. Hockney, The potential calculation and some applications, Methods Comput. Phys. 9, 136 (1970)
- [6] B. Hess, H. Bekker, H. J. C. Berendsen, J. G. E. M. Fraaije, LINCS: A linear constraint solver for molecular simulations, J. Comput. Chem. 18, 1463–1472 (1997)
- [7] G. Bussi, D. Donadio, M. Parrinello, Canonical sampling through velocity rescaling, J. Chem. Phys. 126, 014101 (2007)
- [8] M. Parrinello, A. Rahman, Polymorphic transitions in single crystals: A new molecular dynamics method, J. Appl. Phys. 52, 7182–7190 (1981)
- [9] S. Nosé, M. L. Klein, Mol. Phys. 50, 1055–1076 (1983)
- [10] U. Essmann, L. Perera, M. L. Berkowitz, T. Darden, H. Lee, L. G. Pedersen, A smooth particle mesh Ewald method, J. Chem. Phys. 103, 8577–8593 (1995)