Dynamical evidence for a morphology-dependent relation between the stellar and halo masses of galaxies
We derive the stellar-to-halo mass relation (SHMR), namely versus and , for early-type galaxies from their near-infrared luminosities (for ) and the position-velocity distributions of their globular cluster systems (for ). Our individual estimates of are based on fitting a flexible dynamical model with a distribution function expressed in terms of action-angle variables and imposing a prior on from the correlation between halo concentration and mass in the standard Cold Dark Matter (CDM) cosmology. We find that the SHMR for early-type galaxies declines with mass beyond a peak at and (near the mass of the Milky Way). This result is consistent with the standard SHMR derived by abundance matching for the general population of galaxies, and with previous, less robust derivations of the SHMR for early-type galaxies. However, it contrasts sharply with the monotonically rising SHMR for late-type galaxies derived from extended HI rotation curves and the same CDM prior on as we adopt for early-type galaxies. We show that the SHMR for massive galaxies varies more or less continuously, from rising to falling, with decreasing disc fraction and decreasing Hubble type. We also show that the different SHMRs for late-type and early-type galaxies are consistent with the similar scaling relations between their stellar velocities and masses (the Tully-Fisher and the Faber-Jackson relations). As we demonstrate explicitly, differences in the relations between the stellar and halo virial velocities account for the similarity of the scaling relations. We argue that all these empirical findings are natural consequences of a picture in which galactic discs are built mainly by relatively smooth and gradual inflow, regulated by feedback from young stars, while galactic spheroids are built by a cooperation between merging, black-hole fuelling, and feedback from active galactic nuclei.
Key Words.:
galaxies: kinematics and dynamics – galaxies: elliptical – galaxies: spiral – galaxies: structure – galaxies: formation1 Introduction
Galaxies consist of stars and interstellar gas in relatively compact bodies surrounded by more extended halos of dark matter and circumgalactic gas. The composition of the dark matter is unknown, but it is believed to be elementary particles that interact only gravitationally with baryons. In the standard Cold Dark Matter (CDM) paradigm, the assembly of galactic halos by gravitational clustering is relatively simple and well understood, while the inflow and outflow of gas and the formation of stars by both gravitational and hydrodynamical processes are much more complex and are topics of intense current research. One of the most useful empirical constraints in these studies – and the focus of this paper – is the ratio
| (1) |
of the mass in stars to that in dark matter within a galaxy normalised by the cosmic baryon fraction . This ratio represents a sort of global star formation efficiency, averaged over space and time, for that galaxy.
The variation of with or is called the stellar-to-halo mass relation (SHMR). This has now been derived using several different techniques: abundance matching (Vale & Ostriker 2004; Conroy et al. 2006; Behroozi et al. 2013; Moster et al. 2013), halo occupation distributions (Peacock & Smith 2000; Kravtsov et al. 2004; Reddick et al. 2013), group catalogues (Zheng et al. 2007; Yang et al. 2008), weak galaxy-galaxy lensing (Leauthaud et al. 2012; van Uitert et al. 2016), galaxy clustering (Zu & Mandelbaum 2015; Tinker et al. 2017), empirical models (Rodríguez-Puebla et al. 2017; Moster et al. 2018; Behroozi et al. 2019). The consensus of these studies is that increases with mass to a peak, with at and (near the mass of the Milky Way), and then decreases with mass.
The standard explanation for the inverted-U shape of the SHMR is that feedback by young stars is responsible for the low-mass part, while feedback from active galactic nuclei (AGN) is responsible for the high-mass part. Both types of feedback are potentially capable of driving outflows from a galaxy and impeding further inflows, thus quenching star formation. The effect of stellar feedback on the SHMR is fairly well understood: a higher fraction of gas is driven out of low-mass galaxies because they have lower escape speeds (e.g. Dekel & Silk 1986; Veilleux et al. 2005). Near the peak of the SHMR, much of the gas probably circulates in a self-regulated fountain, without escaping from the halo (e.g. Tumlinson et al. 2017, and references therein). The effect of AGN feedback on the SHMR is less well understood, but it is plausible that it drives energetic outflows that heat some of the circumgalactic gas, thus slowing or reversing its inflows (e.g. Fabian 2012; King & Pounds 2015; Harrison 2017). Mergers may also disrupt the inflow and quench star formation, at least temporarily (e.g. Hopkins et al. 2010b). Both mergers and AGN feedback may cooperate to cause the decline of the SHMR at high mass (e.g. Croton et al. 2006) since mergers can funnel gas to a central black hole, igniting AGN feedback (e.g. Hopkins et al. 2006), while also building galactic spheroids (i.e. classical bulges, Hopkins et al. 2010a).
In practice, the SHMR is usually assumed to be independent of galactic morphology (Wechsler & Tinker 2018). This assumption, however, appears to contradict the reasoning above about the different roles of stellar and AGN feedback and the observation that the masses of central black-holes correlate with the bulge masses of their host galaxies (Kormendy & Ho 2013). Thus, if AGN feedback is important, it should have more effect on the high-mass shape of the SHMR for bulge-dominated galaxies than it does for disc-dominated galaxies. More specifically, should decline with and past the peak in early-type galaxies but rise or level off in late-type galaxies. The main goals of this paper are to confirm this expected dependence of the SHMR on galaxy morphology and to explore some of its implications for our understanding of galaxy formation.
There is already some evidence for secondary correlations between the SHMR and other properties of galaxies. This evidence comes from weak lensing (Mandelbaum et al. 2006, 2016; Tinker et al. 2013; Hudson et al. 2015; Taylor et al. 2020), satellite kinematics (Conroy et al. 2007; More et al. 2011; Wojtak & Mamon 2013; Lange et al. 2019), empirical models (Rodríguez-Puebla et al. 2015), abundance matching (Hearin et al. 2014; Saito et al. 2016) or a mix of these (Dutton et al. 2010). The results of these studies are consistent with the expectation that early-type galaxies occupy more massive halos than late-type galaxies of the same stellar mass. However, in most cases, the results are based on stacking the observations in large samples of galaxies to amplify the marginal or undetectable signals from individual galaxies, an approach that can sometimes yield spurious correlations (and has led to some debate on the topic, see e.g. S6.1 in Wechsler & Tinker 2018). Some recent hydrodynamical simulations also display the expected differences between the SHMR of early and late-type galaxies (Grand et al. 2019; Marasco et al. 2020; Correa & Schaye 2020).
The most direct approach to deriving the SHMR is to estimate the masses of individual halos from the observed kinematics of tracer objects whose space distribution extends well beyond the luminous parts of galaxies. Since the available tracers almost never reach the expected outer (virial) radii of the halos, estimates of their total masses require priors such as the correlation between concentration and mass found in CDM simulations. This is the approach used by Posti et al. (2019a, hereafter PFM19) to derive the SHMR of 110 late-type galaxies with extended HI rotation curves in the Spitzer Photometry and Accurate Rotation Curves (SPARC) sample (Lelli et al. 2016a)111In this context, HI is a better tracer than H because it usually extends to larger radii (van Albada et al. 1985; Kent 1987).. PFM19 found that the SHMR rises monotonically for all masses and reaches –1 for the most massive galaxies in this sample, with – (dubbed the “failed feedback problem”). This result is in stark contrast to the declining high-mass form of the SHMR found in most studies of the general population of galaxies, which is dominated by early types at the highest masses (Kelvin et al. 2014).
In this paper, we derive the SHMR for early-type galaxies by methods as similar as possible to those used by PFM19 for late-type galaxies. In particular, we adopt the same CDM correlation between halo concentration and mass. However, instead of using HI rotation curves to probe the gravitational potential, we use the radial velocities of globular clusters (GCs) around 25 massive early-type galaxies in the SAGES Legacy Unifying Globulars and GalaxieS Survey (SLUGGS, Brodie et al. 2014). We fit a distribution function, expressed in terms of action and angle variables, to the observed kinematics and space distribution of each GC system to estimate its halo mass. This enables us, for the first time, to make a direct and robust comparison between the SHMR of early types and late types based on individual estimates of halo masses.
The different SHMRs for early-type and late-type galaxies – one with a prominent bend, the other without – may seem puzzling because both galactic types have similar scaling relations between stellar velocities and masses (the Faber-Jackson and Tully-Fisher relations). Since the SHMR and the velocity scaling relations both depend on , one might reasonably expect a bend in the former to impose a bend in the latter. However, since the SHMR also depends on , it is possible that the similar velocity scaling relations are actually explained by, and disguised by, different underlying relations between the stellar velocities of early-type and late-type galaxies and one or more properties of their dark matter halos, thus offering potentially important clues about the physical mechanisms responsible for different galactic morphologies. We explore this issue here for the first time.
The remainder of this paper is organised as follows. In Section 2, we summarise the data and dynamical models we use to estimate for early types and the analogous estimates of from PFM19 for late types. Interested readers can find a full description of our models for early-type galaxies in Appendix A. In Section 3, we present our SHMR, showing unambiguously that it depends on galaxy morphology and disc fraction. Section 4 compares our results with previous evidence for different SHMRs. In Section 5, we reconcile the different shapes of the SHMRs for late-type and early-type galaxies with their similar velocity scaling relations in terms of differences between their stellar and halo velocities, and we interpret this result as a natural consequence of the different roles of smooth inflow, merging, and AGN feedback in the formation of galactic discs and spheroids. Section 6 summarises our main conclusions.
Throughout the paper, we use a fixed critical overdensity parameter to define the virial quantities of dark matter halos and a standard CDM model with a Hubble constant km s-1 Mpc-1 (Planck Collaboration et al. 2020). We distinguish late-type and early-type galaxies based on published morphological classifications: early types are E and S0 (Hubble type ), while late types are S0/a, Sa, Sb, Sc, Irr (Hubble type ).
2 Dynamical estimates of halo masses for early-type and late-type galaxies
2.1 Early types
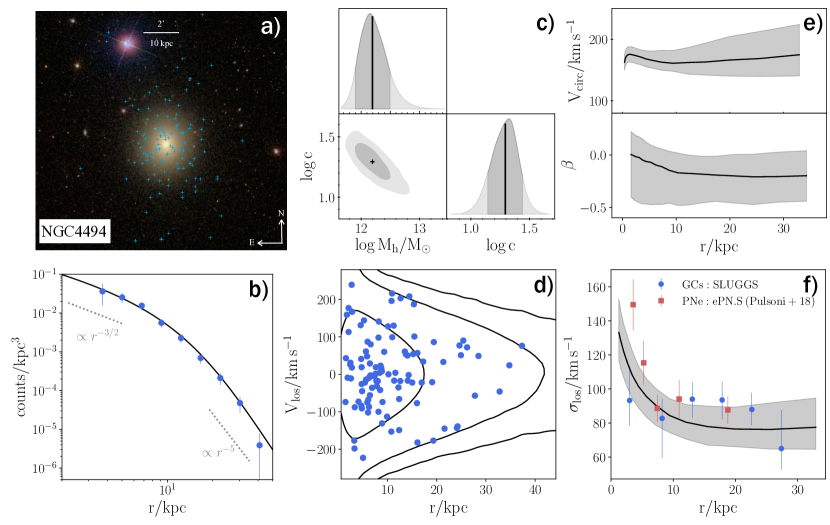
The main novelty of this work is our dynamical estimates of halo masses () for individual nearby ellipticals and lenticulars. To derive these, we use observations of the kinematics of the GC systems around these galaxies and we model explicitly their distribution function. Our method is an adaptation of that of Posti & Helmi (2019), who used it to measure the halo mass of the Milky Way. The method consists of two main ingredients: the distribution function (DF) of the GC system and the gravitational potential. Here we provide an overview of our method with the guidance of Fig. 1, which illustrates the input, fitting, and output of our model for a representative galaxy, NGC 4494. This section introduces all the information needed to understand our results, while Appendix A provides a detailed description of our model, which the busy reader can skip.
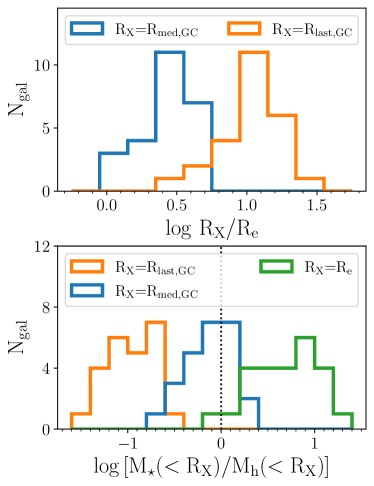
Data. We take the velocity and position data of the globular cluster systems around 27 nearby bright ellipticals and lenticulars from the SLUGGS Survey (Brodie et al. 2014). The centrepiece of this data set is the catalogue of radial velocities of the spectroscopically-confirmed GCs obtained with DEIMOS@Keck (Forbes et al. 2017a). Each galaxy has tens or hundreds of GCs, with a significant galaxy-to-galaxy variation and with a typical uncertainty on each radial velocity of about km/s. The radial coverage of the GC system is also quite varied: the radius containing 90% of the observed GCs ranges between 8 and 98 kpc (corresponding to and ) with a median of about 30 kpc (corresponding to ). The top panel of Fig. 2 shows the distributions of the median radii () and the outermost radii () of the GC systems, both normalised by the effective radii of the galaxies (). To model the distribution of baryons, we use the photometric profiles derived from Spitzer Space Telescope images at 3.6 m by Forbes et al. (2017b). Out of the 27 galaxies in Brodie et al. (2014), we exclude NGC 4474, since it does not have Spitzer images, and NGC 4111, since it has fewer than 20 GC velocities. As an example, in Fig. 1a, we show the distribution of the confirmed SLUGGS GCs around NGC 4494.
Distribution function. We use analytic DFs that depend on action-angle variables in the form introduced by Posti et al. (2015) specifically to describe spheroidal systems. We refer to these models as , where is the DF and are the action integrals. The models we use have spherical space distributions but anisotropic velocity distributions. The DFs are double power laws in the actions such that they generate double power-law density distributions in physical space. Once the two slopes of the DF are fitted to the space distributions of GCs (Fig. 1b), the three remaining parameters specify the velocity distribution of the GC system.
Gravitational potential. The total potential in the model is a superposition of two spherical components: the luminous galaxy and the dark matter halo. The galaxy is modelled as a de-projected Sersic (1968) profile, based on the the photometry by Forbes et al. (2017a), with an adjustable mass-to-light ratio. The dark matter halo is assumed to have a Navarro et al. (1996, herafter NFW) profile parametrized by its virial mass () and concentration (). For the mass-to-light ratio, we impose a gaussian prior with a mean derived by Forbes et al. (2017a), using stellar population models, and a dispersion dex. For the halo concentration, we impose the correlation between and found in N-body CDM simulations (Dutton & Macciò 2014).
Bayesian parameter estimation. We use a Markov Chain Monte Carlo (MCMC) method to derive posterior probabilities of the free parameters of our model (Fig. 1c). The likelihood is given by the product of the DF convolved by the error distribution for each cluster. Since we need 3 positions and 3 velocities to evaluate the DF, we sample the missing position from the observed density distribution of the clusters and the two missing velocities uniformly in the range allowed by the escape speed of the model (Fig. 1d). We then use our models to derive the intrinsic properties of the potential (the circular velocity ) and of the GC system (the anisotropy parameter ) shown in Fig. 1e. In the bottom panel of Fig. 2, we use the models to compute the ratios of stellar to halo mass enclosed within progressively larger radii: the luminous , the median GC radius , and the outermost GC radius . Evidently, dark matter is negligible relative to stars near , is comparable near (), and is dominant near (). We can also compute a posteriori the model line-of-sight velocity dispersion profile and check that it is consistent with the observed profile for GCs in the SLUGGS Survey and planetary nebulae in the ePN.S Survey (Pulsoni et al. 2018). Fig. 1f shows this consistency for NGC4494.
2.2 Late types
PFM19 determined halo masses for a sample of nearby spirals by fitting galaxy plus halo models to their extended HI rotation curves. Here we just summarise their analysis and results and refer the reader to their paper for full details.
Data. The sample consists of 110 nearby spirals with 3.6 m Spitzer images and HI rotation curves drawn from the SPARC database compiled by Lelli et al. (2016a, see also the original references therein). The rotation curves, taken from various sources in the literature, were derived from interferometric HI observations that extended well beyond the optical discs of the galaxies. The sample spans a large range in stellar masses, from dwarfs () to giants ().
Rotation curve decomposition. The observed rotation curves are decomposed into gas, stars, and dark matter components. The gas contribution is derived directly from the HI flux, while the stellar contribution is computed from the 3.6 m photometry with an adjustable mass-to-light ratio. The dark matter halo is modelled as a standard NFW profile with variable virial mass () and concentration () following the relation from CDM simulations (Dutton & Macciò 2014). In massive spirals, which are the focus of this work, models with cuspy dark matter halos (such as NFW) match the observed rotation curves, yielding fits that are statistically indistinguishable from those obtained with other halo models (e.g. pseudo-isothermal or cored halos, see de Blok et al. 2008; Martinsson et al. 2013; Katz et al. 2017; PFM19; Li et al. 2020). This contrasts with the situation for dwarf galaxies, whose rotation curves are often matched better with cored halo models (e.g. de Blok et al. 2001; Oh et al. 2011).
Bayesian parameter estimation. The MCMC approach is used to fit the rotation curve and to estimate the posterior distribution of the three free parameters of the gravitational potential: the stellar mass-to-light ratio, the halo mass, and concentration.
It is important to note here that the key assumptions of the dynamical models for late types and early types are the same: an adjustable mass-to-light ratio at 3.6 m, a spherical NFW halo, a prior following the CDM relation and an MCMC approach to sample the posterior. This makes the results from our models for early-type galaxies directly comparable with those of PFM19 for late-type galaxies.
3 The SHMR for different galaxy types
3.1 Dependence on stellar and halo masses
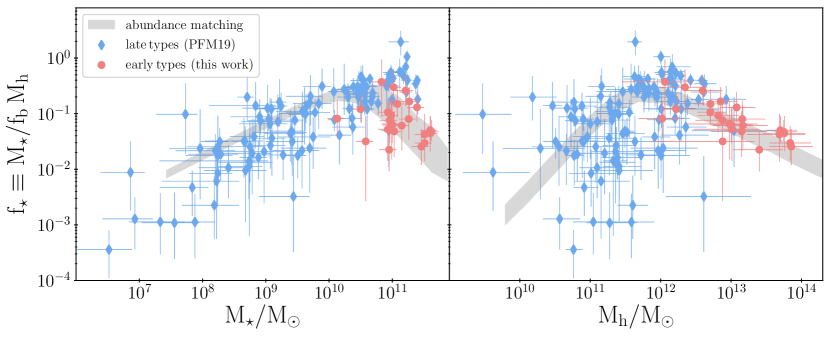
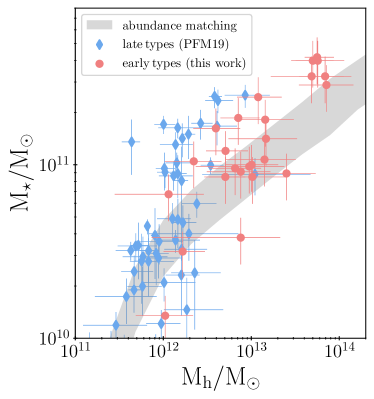
In Fig. 3, we plot our estimates of versus stellar mass (left panel) and halo mass (right panel) for the 25 SLUGGS early-type galaxies. We compare these with the estimates of from PFM19 for SPARC late-type galaxies and with the abundance matching model of Moster et al. (2013). We find that at a fixed stellar mass, above , early types have systematically lower than late types of similar stellar mass, by a factor of at .
In order to guard against the possibility that the trends visible in Fig. 3 are induced by correlated errors in the plotted variables, versus or , we also show in Fig. 4 the SHMR directly in the form versus . In particular, we zoom in on the high-mass regime of the SHMR (), which is of most interest here. Fig. 4 confirms that late types and early types are separated from each other in the same way as indicated in Fig. 3; massive late types occupy systematically less massive halos than early types of the same stellar mass.
The grey bands in Fig. 3-4, representing the conventional SHMR derived by abundance matching, are displayed only for comparison purposes. We stress that all the main results of this paper come from dynamical analyses of late-type and early-type galaxies and do not depend in any way on abundance matching. In these figures, we show the SHMR from Moster et al. (2013) because it represents a consensus in the field (see Fig. 2 in Wechsler & Tinker 2018). In the SHMR derived by Kravtsov et al. (2018), massive galaxies tend to occupy slightly less massive halos with respect to the Moster et al. (2013) SHMR. However, even in this case, the qualitative picture presented in Fig. 3-4 remains valid.
For early types with , we measure a scatter of dex in at a fixed . This scatter reflects a combination of several effects, which we assume to be independent to first order: i) the observational errors in the GC velocities and the uncertainty in the velocity dispersion due to sparse sampling, ii) the uncertainty in the mass-to-light ratio, iii) the scatter in the relation, and iv) the intrinsic scatter in at fixed . The first term varies substantially from galaxy to galaxy, as it is related to the signal-to-noise of the GC spectra and to the number of GCs observed, but for a typical galaxy this is of the order of 25%, i.e. 0.1 dex. The second term is of the order of 0.1-0.2 dex (Forbes et al. 2017b). The third term is an output of cosmological simulations and is dex (Dutton & Macciò 2014). The fourth term can be estimated from the conventional SHMR. We generate a population of halos from a standard halo mass function (Tinker et al. 2008) and we assign an to each halo following the Moster et al. (2013) SHMR. They estimate the scatter of to be 0.15 dex at a fixed halo mass , which corresponds to the grey bands in versus and in Fig. 3, and in versus in Fig. 4. The resulting scatter at a fixed stellar mass is about 0.08 dex below the turnover at , but then increases substantially, reaching about 0.34 dex at 222 This happens as a result of the combination of the SHMR with the steeply declining halo mass function. Above the peak, low-mass halos that are high- outliers of the relation are about as common as high-mass halos with a typical . This not only increases the scatter at a fixed , but it also increases the average at a fixed with respect to that obtained by inverting (see e.g. Moster et al. 2020). . Combining these four effects, we can nicely explain the observed scatter of 0.4 dex in our estimates of .
Plotting as a function of demonstrates clearly that early types occupy halos of a wide range of masses (). In contrast, late types of similar stellar mass are all found in halos of mass and virtually none occupies halos more massive than . This is potentially a very important finding since it hints at the existence of an upper limit to the masses of halos within which discs can form (e.g. Dekel & Birnboim 2006).
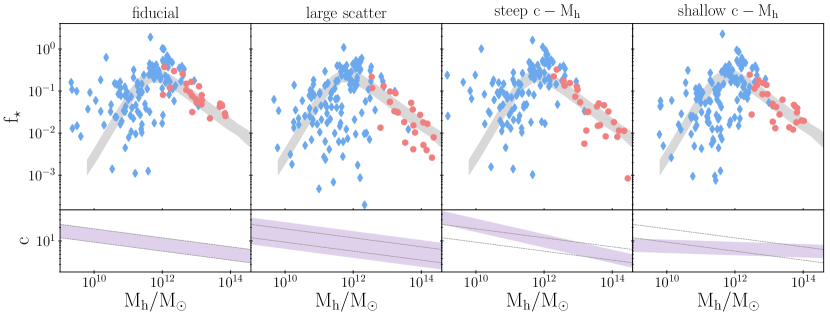
Of all the assumptions in our modelling technique, we found that the prior on the correlation has the largest effect on estimates of . In Fig. 5, we show the results of some tests to assess the robustness of our findings. We re-fitted our models to the SLUGGS data with different priors for the halo concentration-mass relation: in particular, we doubled the scatter and we increased and decreased the slopes of the relation so as to span the range of the the standard CDM relation over the range of halo masses probed here333 We also repeated this test with systematically larger and smaller concentrations, i.e. with following the fiducial relation , finding similar results to those shown in Fig. 5. These priors are shown in the middle row of panels in Fig. 5. Each column of Fig. 5 shows the (top) and (bottom) relation that we obtain when assuming these different priors. To compare early types (red) and late types (blue) consistently, we re-computed the rotation curve decompositions of the late types in SPARC with each prior. From the results plotted in Fig. 5, we note that, while there can be significant differences for individual galaxies, the general trends for the populations of late types and early types remains robust.
These tests give us confidence that the systematic difference of the SHMR of massive late-type and early-type galaxies is real. An important point that we need to emphasise here is that the priors that we have used for these tests are deliberately extreme. In fact, such a large scatter (0.25 dex) or such steep or shallow slopes are outside of the range of published relations for the standard CDM cosmogony (e.g. Diemer & Kravtsov 2015). This allows us to exclude, with high confidence, that the two branches of the SHMR revealed in Fig. 3 are the result of late types and early types occupying halos with systematically different concentrations.
3.2 Dependence on disc fraction and morphological type
In Sect. 3.1, we investigated the difference in between two broadly defined galaxy samples, late types and early types, while here we look in more detail at how depends continuously on disc fraction and morphological type for massive galaxies.
For 21 of the 25 early types in SLUGGS, we rely on the photometric bulge/disc decompositions in the -band performed by Krajnović et al. (2013), who fitted a Sérsic plus exponential functions to the observed 1D photometric profiles. We note that, for half of these, Krajnović et al. (2013) found no significant contribution from an exponential disc component. For the four remaining galaxies, we fitted the 1D -band profiles from the Carnegie-Irvine Galaxy Survey (Li et al. 2011) with Sérsic plus exponential functions, in order to perform a similar analysis to that of Krajnović et al. (2013).
We include only the 20 late types with the largest stellar mass for this comparison (). We take the disc-to-total ratios from either: i) the Spitzer Survey of Stellar Structure in Galaxies (Sheth et al. 2010), based on 2D bulge/disc decompositions of the 3.6 m Spitzer images with the code galfit (Peng et al. 2002, 2010) when available; ii) otherwise, from the kinematic decompositions reported by Fall & Romanowsky (2013, 2018, and references therein). For a few galaxies that do not have from i) or ii), we used the decomposition of the 1D surface brightness profiles at 3.6 m performed by Lelli et al. (2016a).
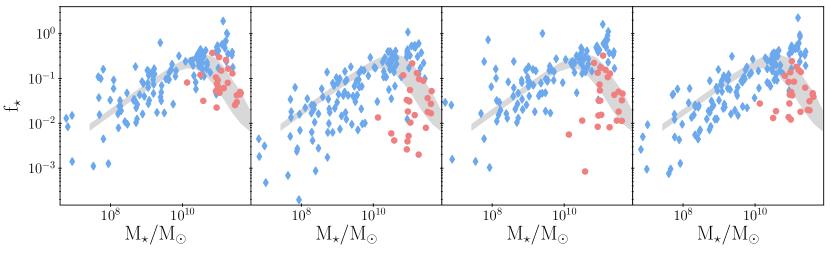
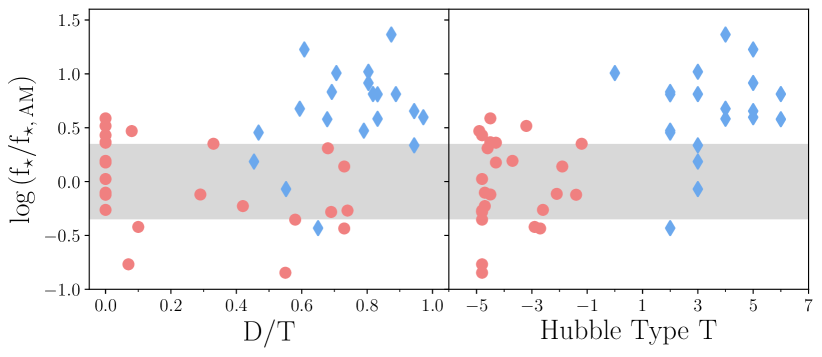
For all of these massive galaxies, we calculate the residual of our estimate of relative to the abundance-matching value at the same mass from Moster et al. (2013) and express it in the form . We plot this quantity in Fig. 6 as a function of (left) and as a function of the Hubble type (right), both for late types (blue diamonds) and early types (red circles). We find that bulge-dominated galaxies (, ) have small residuals with respect to abundance matching, as they lie within its scatter (grey area). In contrast, disc-dominated galaxies (, ) are found to have systematically larger . The transition between these two regimes occurs at around or . The spirals with lowest disc fractions in this sample (, ) are indeed in better agreement with abundance matching, although the scatter of the points is substantial. The dependence of on and on that we observe in Fig. 6 indicates that the location of a galaxy in the diagram depends fairly continuously on its disc fraction.
From this new perspective, we can now see that derivations of the SHMR that include galaxies of all types are likely to overestimate the scatter at the high-mass end. This is because the trend of with (Fig. 6), if not recognised, will simply be counted as scatter. However, this effect is likely to be small since disc-dominated galaxies are relatively rare at the high-mass end ( at , see e.g. Kelvin et al. 2014; Ogle et al. 2019). To gain some intuition on the magnitude of this effect, we performed a simple calculation in an extreme case of a binary population of galaxies: pure discs and pure spheroids. At a fixed , we have 90% spheroids on the abundance matching relation, i.e. with , and we have 10% discs with systematically offset from this by a factor 0.8 dex. In order to match the scatter of the Moster et al. (2013) SHMR at that stellar mass, which is 0.35 dex, we need to decrease the intrinsic scatter of the pure spheroid population to dex. This exercise suggests that calculations that ignore the dependence of the SHMR on morphology will overestimate the intrinsic scatter by about dex.
4 Comparison with other estimates of the SHMR
In this section, we compare our derivation of the relation for individual late-type and early-type galaxies with other estimates from the literature. Taken together, these results provide additional evidence that galaxies of different types occupy halos of different masses.
4.1 Statistical estimates of the SHMR
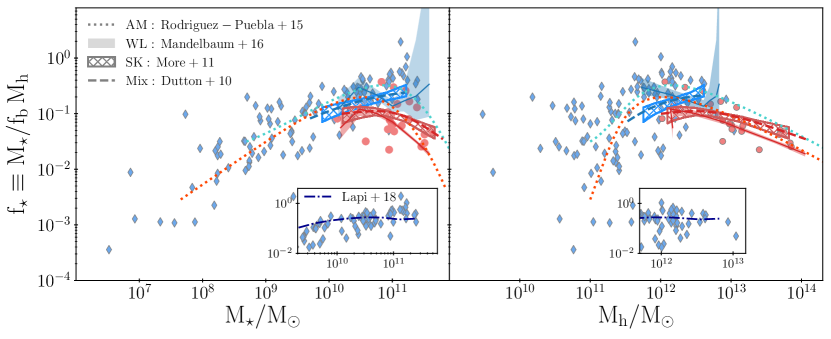
In Fig. 7, we show how our SHMR compares to those derived by different techniques, for late (blue) and early types (red) separately. We notice that there is general agreement among these studies, with our SHMR showing perhaps the largest differences between late and early types.
Satellite kinematics (e.g. Conroy et al. 2007; More et al. 2011; Wojtak & Mamon 2013; Lange et al. 2019) and especially weak lensing (e.g. Mandelbaum et al. 2006, 2016; Tinker et al. 2013; Hudson et al. 2015; Taylor et al. 2020) are, in principle, reliable tracers of halo masses out to very large radii. However, these methods rely heavily on stacking (hundreds or thousands of) galaxies that are usually grouped into late types and early types via a hard cut in colour. These analyses have the advantage of including large numbers of galaxies but the disadvantage that colour is an imperfect proxy for morphology, since it depends on a combination of other factors, including star formation rate and history, dust reddening, and metallicity. Hence, the differences between late types and early types will be artificially attenuated. Similar considerations apply also to SHMRs based on empirical models, which are mostly constrained by observed stellar mass functions, with only indirect estimates of halo masses (e.g. Dutton et al. 2010; Rodríguez-Puebla et al. 2015; Behroozi et al. 2019; Moster et al. 2020),
Our work reinforces these results since it is based on careful estimates of the halo masses of individual galaxies in samples of late types and early types specifically selected for dynamical studies. Our derivation of the SHMR has opposite strengths and weaknesses with respect to the statistical estimates above. It is therefore not surprising that we find a somewhat larger difference in between late-type and early-type galaxies.
4.2 Individual estimates of halo masses
4.2.1 Early types
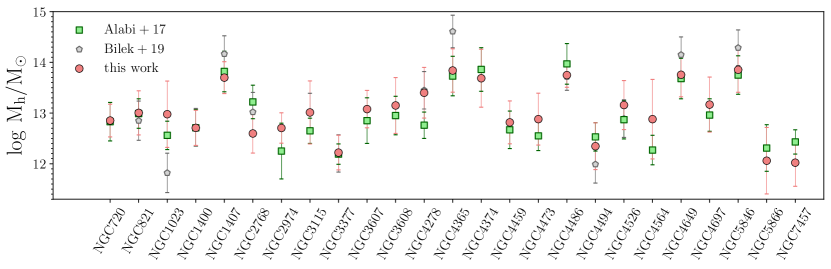
The SLUGGS globular cluster data have already been used by Alabi et al. (2016, 2017) to estimate the total halo masses of the galaxies by a simpler method: the so-called tracer mass estimator (TME, Watkins et al. 2010, with original formulation by Bahcall & Tremaine 1981). In this case, the total mass is taken to be where is the gravitational constant, and are a characteristic radius and velocity of the system and is a dimensionless constant of order unity that is calibrated a priori with some simple assumptions. We compare in Fig. 8 our halo masses with those of Alabi et al. (2017) on a galaxy-by-galaxy basis, finding overall consistency within a factor of a few.
One of the shortcomings of the TME method is that it does not clearly partition between luminous and dark components. This is of particular importance in the context of the SLUGGS early types, since the TME is sensitive to the dynamical mass near the median radius of the tracer population (), which happens to be where the masses of stars and dark matter are comparable (see Fig. 2). Therefore, it is not surprising that the estimates of this method are consistent within a factor of a few with those of our models.
Bílek et al. (2019) recently estimated the halo masses of the early-type galaxies in SLUGGS, by analysing the kinematics of their GC systems. In particular, they used the GC velocity dispersion profiles together with the Jeans equations to constrain the gravitational potential. They modelled the dark matter halo with a spherical NFW profile and they imposed a prior on the relation from cosmological simulations, as in our approach. However, rather than allowing the data to constrain the velocity anisotropy of the GC system, as we do here, they assume a profile as an input to their model. We compare their estimates of halo masses with ours in Fig. 8. Despite the differences and limitations of their approach, we find that their results are consistent with ours within the uncertainties. This comparison adds to our confidence that our estimates of are not biased by model-dependent systematic effects.
4.2.2 Late types
Several other studies have derived the SHMR of spiral galaxies from their rotation curves, with results consistent with those from PFM19 shown here in Fig. 3. Lapi et al. (2018) found a similar trend from stacked H rotation curves in an independent sample of spirals (see Fig. 7). However, H rotation curves typically do not extend as far as HI rotation curves and thus, at best, provide only weak constraints on dark matter halo masses (van Albada et al. 1985; Kent 1987).
Katz et al. (2017) also estimated the halo masses of spiral galaxies in the SPARC sample from HI rotation curve decomposition. However, they either used an unconstrained fit (i.e. with no prior on the relation), leaving undetermined, or they imposed a prior on from the Moster et al. (2013) SHMR. While the SHMR they derive naturally follows closely the Moster et al. SHMR by construction, their estimates of are nevertheless in fair agreement with the ones we obtain without imposing a prior on the SHMR. Li et al. (2020) recently revised and expanded their approach to several different types of halo profiles and reached similar conclusions.
It is also interesting to notice that a systematic difference between late types and early types was also reported by Tortora et al. (2019) when looking at the dark matter fraction within one effective radius as a function of stellar mass. They noticed that late types lie on a decreasing relation, while for massive early types this relation inverts, analogous to our results for versus based on the total masses within the virial radii of the halos. This suggests that, at a fixed , massive discs are less dominated by dark matter than spheroids, both globally and locally (see also Marasco et al. 2020).
4.3 The mass of the globular cluster system as a dark matter halo tracer
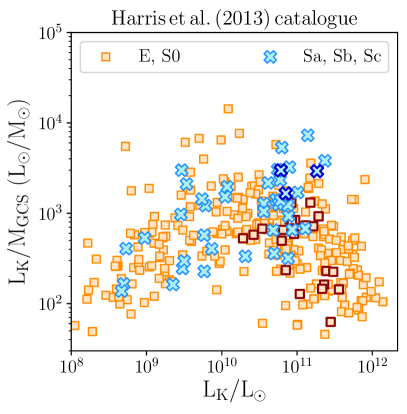
Another novel method for estimating dark matter halo masses of galaxies is based on the total mass of their GC system, . Several recent studies have demonstrated the existence of a convincing linear relation between and for both late types and early types (e.g. Blakeslee et al. 1997; Spitler & Forbes 2009; Georgiev et al. 2010; Harris et al. 2013, 2017; Hudson et al. 2014; Burkert & Forbes 2020). The physical origin of this relation is not well understood (e.g. Kravtsov & Gnedin 2005; Boylan-Kolchin 2017; El-Badry et al. 2019), but we can exploit it as a semi-independent method for deriving the SHMR nonetheless444 A caveat we note here is that studies that determined the relation often assumed halo masses from a standard SHMR, typically not taking into account the morphology dependence that we highlight in Fig. 3. . Thus, we may regard the relation between and as a direct analogue of the relation, where is the -band luminosity. The relation requires only photometry, rather than spectroscopy of the GCs, making it relatively easy to derive. Harris et al. (2013, see also references therein) have assembled a catalogue of for 422 nearby galaxies of all morphological types covering a wide range in luminosities.
We plot in Fig. 9 the ratio as a function of for the galaxies in the Harris et al. (2013) sample, separating them into late types (blue crosses) and early types555 Irregulars are excluded from this analysis (orange squares). The similarity between the relation in Fig. 9 and the relation in Fig. 3 is striking; early types turnover at about , while bright late types seem to lie on a separate rising branch (see also Kim et al. 2019, for a similar analysis of early types).
The Harris et al. (2013) sample contains 24 out of the 25 SLUGGS early types that we analysed in this work, but only three of the 20 massive spirals in SPARC (NGC 891, NGC 5907 and NGC 7331). The galaxies in common with our detailed analysis are indicated in Fig. 9 by symbols with darker and thicker edges. We notice that the three spirals have systematically higher than any of the early types of similar , in qualitative agreement with what we find on the diagram. From this analysis we conclude that, despite the large scatter, the relation is quite consistent with our more robust derivation of the relation from GC kinematics and HI rotation curves.
5 The SHMR and galaxy scaling laws
In the previous sections, we established that the SHMR of late types and early types follows two distinct branches: one where increases with mass for spirals, and another one for ellipticals and lenticulars where decreases beyond a peak near . Yet, late-type and early-type galaxies are known to obey very similar scaling relations between their stellar masses and velocities; the Tully & Fisher (1977) and Faber & Jackson (1976) relations are observed to be pure power laws with no significant features. These two facts may appear to be at odds with each other, since velocity is a proxy for dynamical mass and one might therefore expect the shape of the SHMR to impact the mass-velocity scaling laws (e.g. Ferrero et al. 2017; Posti et al. 2019b). How can we reconcile these seemingly contradictory facts?
The resolution of this apparent paradox logically must involve the relations between the characteristic velocities of galaxies and those of their dark matter halos, which need to be different for late types and early types on the two branches of the SHMR. In this section, we demonstrate this difference and discuss its physical implications.
5.1 A paradox and its resolution
We take measurements of the flat parts of HI rotation curves for spirals in SPARC (, Lelli et al. 2016b) and stellar velocity dispersions measured within a fixed radius of 1 kpc for the ellipticals and lenticulars in SLUGGS (, Brodie et al. 2014). These are the two characteristic velocities that we use to define the Tully-Fisher and Faber-Jackson relations, which we compactly write as
| (2) |
where is for late types and for early types. Along either the rising branch of the SHMR for late types or along the declining one for massive early types, the SHMR can also be approximated by a power law
| (3) |
Given the definition of (Eq. 1) and the fact that, in CDM cosmogonies, halo masses and virial velocities are related by , we can rearrange the two equations above into a relation between and , which then becomes the power law
| (4) |
with
| (5) |
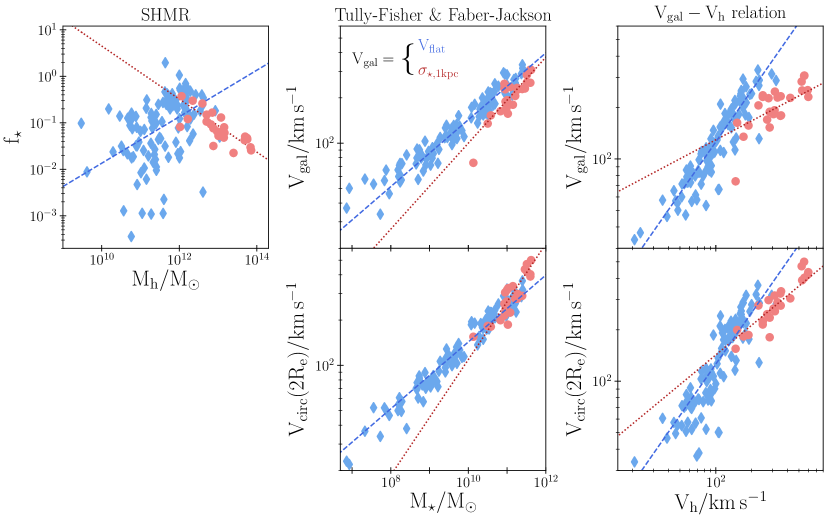
Eq. (4) is key here since it relates the familiar scaling laws (Eq. 2) with the two branches of the SHMR (Eq. 3). With our set of measurements – from 3.6m photometry, from observed HI () or stellar kinematics (), from dynamical models of rotation curves and GC kinematics – we perform power-law fits to Eq. (2)-(4), finding
| (6) |
| (7) |
In Fig. 10, we show (on the top row) the data and the power-law fits of the three relations (, , and ) for the late types (blue) and early types (red). While the mass-velocity scaling laws have a similar slope (), the SHMR and the relations have significantly different slopes ( and ) on the two branches. At a fixed stellar mass, the large difference in halo mass between discs and spheroids is hidden in the similar Tully-Fisher and Faber-Jackson relations by the different relations.
The slope for late types on the rising branch of the SHMR means that the ratio is nearly the same (and about equal to unity) for discs of all masses (Posti et al. 2019b). This is yet another manifestation of the so-called disc-halo conspiracy, i.e. rotation curves are observed to be flat from the inner, baryon-dominated parts of galactic discs to the outer, dark matter-dominated parts (e.g. van Albada et al. 1985; Kent 1987). On the other hand, for early types along the falling branch of the SHMR, we find a very different result: , which implies that the ratio decreases with both stellar and halo mass.
While for late types is measured at large radii and traces the potential of the dark halo, for early types is measured in the inner regions where the potential is dominated by stars. One might then wonder whether this is responsible for the difference in the and ratios. We check for this in the bottom panels of Fig. 10, where we replace the observed with the circular velocity evaluated at a fixed radius of for both late-type and early-type galaxies in our sample. For late types, we obtain the circular velocities directly from the observed rotation curves, while for early types, they are an output of our dynamical models. Fig. 10 shows that the difference persists in the relation . Now we find for late types and for early types.
5.2 Physical interpretation
The observed scaling relations between the rotation velocities, sizes, and stellar masses of spiral galaxies indicate that they represent a self-similar population of objects, homologous to their dark matter halos (e.g. Posti et al. 2019b). In particular, galactic discs have almost as much specific angular momentum as their dark halos, as expected from simple conservation arguments (e.g. Fall & Efstathiou 1980; Dalcanton et al. 1997; Mo et al. 1998). Stellar feedback modifies this behaviour, making gas retention mass dependent, and thus creating the rising branch of the SHMR. Gravitational clustering and accretion moves galaxies along the scaling laws and up the rising branch of the SHMR. This introduces no features in either the scaling laws or the relation.
However, galaxies in crowded environments, such as groups and clusters, often collide and merge with each other. Depending on the mass ratio of the galaxies and on whether they are gas rich or gas poor, mergers have a couple of important implications for the evolution of massive galaxies. First, the stellar body is dynamically heated, causing the spheroidal component to grow at the expense of the disc component, thus leading to morphological transformation (e.g. Quinn et al. 1993; Hopkins et al. 2010a; Martin et al. 2018). Second, some of the gas in the merging galaxies may be funnelled into the central black hole, thus triggering AGN feedback (e.g. Hopkins et al. 2006). Outflows and radiation from the AGN may then impede further inflows and star formation, hence reducing . As a consequence of merging and AGN feedback, massive discs are driven off the rising branch of the SHMR, becoming passive spheroids on the falling branch.
In the previous subsection, we showed that late types follow a relation with a slope of , implying that the ratio of binding energy per unit mass of the luminous galaxy to that of its dark halo () is approximately independent of mass. In contrast, early types have , indicating that the ratio of galaxy-to-halo binding energy per unit mass decreases as mass increases. Both merging and AGN feedback may reduce the binding energy per unit mass, leading to , as observed.
To understand how mergers can lower the ratio we consider a typical collision between two galaxies on a weakly bound orbit (seee.g. Khochfar & Burkert 2006). While the halo mass and the virial velocity increase during merging, idealised simulations have shown that the internal velocity dispersion of the stars typically remains constant or decreases, depending on the mass ratio, gas fraction and orbital parameters (e.g. Nipoti et al. 2003; Cox et al. 2006; Naab et al. 2009; Hilz et al. 2012; Posti et al. 2014). After some Gyrs of evolution in a dense environment, a massive early type that experiences several mergers will therefore lower its ratio as its mass increases. This effect is also observed in cosmological simulations, where frequent minor mergers deposit stars primarily in the outskirts of massive galaxies, thus lowering their binding energy per unit mass (e.g. Oser et al. 2012; Gabor & Davé 2012).
At the same time, outflows launched by the AGN will interact with the circumgalactic medium, pushing some of it outward, depending on the opening angle of the outflow. If this gas is ever able to condense and form stars, this would also tend to lower the binding energy per unit mass of the host galaxy.
Mergers and AGN feedback may thus combine to transform star-forming discs on the rising branch of the SHMR into quenched spheroids on the falling branch. These two processes are contemporaneous but episodic. Both mergers and AGN feedback tend to disrupt inflow onto galactic discs, thus suppressing disc growth while promoting spheroid growth. Between these episodes, relatively smooth inflow can resume, thus promoting the regrowth of discs. This reasoning suggests that massive galaxies may evolve along complicated, essentially stochastic, paths in the region of the plane bounded by the rising pure-disc branch and the declining pure-spheroid branch.
6 Summary and Conclusions
In this paper, we have derived the SHMR for a sample of 25 massive early-type galaxies from estimates of their individual halo masses. We accomplished this by comparing a dynamical model with a flexible analytical distribution function with position and velocity data for the globular cluster systems around these galaxies. Combining our new results for early types with those from PFM19 for late types based on extended HI rotation curves, we derived, for the first time, the relation for galaxies of different morphologies with identical assumptions about their halo properties. Our main findings can be summarised as follows.
-
(i)
At the high-mass end of the SHMR (), late types are found to have significantly higher than early types of the same stellar mass (by about a factor at ). While increases with for late types (PFM19), it decreases for early types, in broad agreement with expectations from abundance matching (e.g. Moster et al. 2013). Our determinations show unequivocally that the SHMR has a secondary correlation with galaxy type at the high-mass end.
-
(ii)
For massive galaxies (), we studied how deviates from the expectations of abundance matching () as a function of disc fraction and Hubble type. We find a fairly continuous transition between close agreement, , for pure spheroids, and an order of magnitude discrepancy, , for pure discs. This transition occurs at about , or , suggestive of scenarios involving merging and AGN feedback.
-
(iii)
We have tested the sensitivity of our estimates with respect to our adopted priors on the correlation. We find that the secondary correlation of the SHMR with galaxy type is robust relative to any reasonable adjustments to this prior. We have also compared our results both with other statistical derivations of the SHMR (e.g. using weak-lensing or satellite kinematics) and with other individual estimates of halo masses based on different data and/or techniques. We find these estimates to be compatible within the uncertainties, allowing us to conclude that the issue of whether the SHMR has a secondary correlation with galaxy type is now settled.
-
(iv)
We investigated the apparent paradox between the two separate branches of the SHMR – a rising one for discs and a falling one for massive spheroids – and the similar power-law relations between stellar masses and velocities for late types and early types, the Tully-Fisher and Faber-Jackson relations. We demonstrated that this happens because the relations between galaxy velocity and halo velocity are different for galaxies of different types. Discs have a constant ratio at all masses – indicating that they are close to homologous with their dark halos – while spheroids have a declining ratio with mass. We suggest that this is a signature of the combined effects of merging and AGN feedback.
As suggested above, both merging and AGN feedback are likely responsible for splitting the SHMR and the relation into different branches for discs and spheroids, but their exact roles remain to be determined. The growth of discs and spheroids in massive galaxies may be intermittent, with disc growth during periods of relatively smooth inflow, interrupted by spheroid growth during episodes of merging and AGN feedback. Hydrodynamical simulations may shed light on the underlying physical processes, so long as they are relatively insensitive to numerical resolution and subgrid recipes for stellar and AGN feedback. A careful census of black holes in a large sample of host galaxies of different morphologies and masses likely would also be instructive.
Acknowledgements.
We thank Michal Bílek, Benoit Famaey, and Filippo Fraternali for encouragement in the early stages of this project and Romeel Davé, Ken Freeman, and Andrey Kravtsov for helpful comments in the later stages. LP acknowledges support from the Centre National d’Etudes Spatiales (CNES). This research has made use of ”Aladin sky atlas” developed at CDS, Strasbourg Observatory, France (Bonnarel et al. 2000)References
- Alabi et al. (2016) Alabi, A. B., Forbes, D. A., Romanowsky, A. J., et al. 2016, MNRAS, 460, 3838
- Alabi et al. (2017) Alabi, A. B., Forbes, D. A., Romanowsky, A. J., et al. 2017, MNRAS, 468, 3949
- Arnold (1978) Arnold, V. I. 1978, Mathematical methods of classical mechanics (New York: Springer)
- Bahcall & Tremaine (1981) Bahcall, J. N. & Tremaine, S. 1981, ApJ, 244, 805
- Behroozi et al. (2019) Behroozi, P., Wechsler, R. H., Hearin, A. P., & Conroy, C. 2019, MNRAS, 488, 3143
- Behroozi et al. (2013) Behroozi, P. S., Wechsler, R. H., & Conroy, C. 2013, ApJ, 770, 57
- Bílek et al. (2019) Bílek, M., Samurović, S., & Renaud, F. 2019, A&A, 625, A32
- Binney (2010) Binney, J. 2010, MNRAS, 401, 2318
- Binney (2014) Binney, J. 2014, MNRAS, 440, 787
- Binney & Tremaine (2008) Binney, J. & Tremaine, S. 2008, Galactic Dynamics: Second Edition (Princeton University Press)
- Binney & Wong (2017) Binney, J. & Wong, L. K. 2017, MNRAS, 467, 2446
- Blakeslee et al. (1997) Blakeslee, J. P., Tonry, J. L., & Metzger, M. R. 1997, AJ, 114, 482
- Bonnarel et al. (2000) Bonnarel, F., Fernique, P., Bienaymé, O., et al. 2000, A&AS, 143, 33
- Born (1927) Born, M. 1927, The Mechanics of the Atom (London: G. Bell and Sons, LTD.)
- Boylan-Kolchin (2017) Boylan-Kolchin, M. 2017, MNRAS, 472, 3120
- Brodie et al. (2014) Brodie, J. P., Romanowsky, A. J., Strader, J., et al. 2014, ApJ, 796, 52
- Burkert & Forbes (2020) Burkert, A. & Forbes, D. A. 2020, AJ, 159, 56
- Conroy et al. (2007) Conroy, C., Prada, F., Newman, J. A., et al. 2007, ApJ, 654, 153
- Conroy et al. (2006) Conroy, C., Wechsler, R. H., & Kravtsov, A. V. 2006, ApJ, 647, 201
- Correa & Schaye (2020) Correa, C. A. & Schaye, J. 2020, MNRAS, 499, 3578
- Cox et al. (2006) Cox, T. J., Dutta, S. N., Di Matteo, T., et al. 2006, ApJ, 650, 791
- Croton et al. (2006) Croton, D. J., Springel, V., White, S. D. M., et al. 2006, MNRAS, 365, 11
- Dalcanton et al. (1997) Dalcanton, J. J., Spergel, D. N., & Summers, F. J. 1997, ApJ, 482, 659
- de Blok et al. (2001) de Blok, W. J. G., McGaugh, S. S., Bosma, A., & Rubin, V. C. 2001, ApJ, 552, L23
- de Blok et al. (2008) de Blok, W. J. G., Walter, F., Brinks, E., et al. 2008, AJ, 136, 2648
- Dekel & Birnboim (2006) Dekel, A. & Birnboim, Y. 2006, MNRAS, 368, 2
- Dekel & Silk (1986) Dekel, A. & Silk, J. 1986, ApJ, 303, 39
- Diemer & Kravtsov (2015) Diemer, B. & Kravtsov, A. V. 2015, ApJ, 799, 108
- Dutton et al. (2010) Dutton, A. A., Conroy, C., van den Bosch, F. C., Prada, F., & More, S. 2010, MNRAS, 407, 2
- Dutton & Macciò (2014) Dutton, A. A. & Macciò, A. V. 2014, MNRAS, 441, 3359
- El-Badry et al. (2019) El-Badry, K., Quataert, E., Weisz, D. R., Choksi, N., & Boylan-Kolchin, M. 2019, MNRAS, 482, 4528
- Faber & Jackson (1976) Faber, S. M. & Jackson, R. E. 1976, ApJ, 204, 668
- Fabian (2012) Fabian, A. C. 2012, ARA&A, 50, 455
- Fall & Efstathiou (1980) Fall, S. M. & Efstathiou, G. 1980, MNRAS, 193, 189
- Fall & Romanowsky (2013) Fall, S. M. & Romanowsky, A. J. 2013, ApJ, 769, L26
- Fall & Romanowsky (2018) Fall, S. M. & Romanowsky, A. J. 2018, ApJ, 868, 133
- Ferrero et al. (2017) Ferrero, I., Navarro, J. F., Abadi, M. G., et al. 2017, MNRAS, 464, 4736
- Forbes et al. (2017a) Forbes, D. A., Alabi, A., Brodie, J. P., et al. 2017a, AJ, 153, 114
- Forbes et al. (2017b) Forbes, D. A., Sinpetru, L., Savorgnan, G., et al. 2017b, MNRAS, 464, 4611
- Foreman-Mackey et al. (2013) Foreman-Mackey, D., Hogg, D. W., Lang, D., & Goodman, J. 2013, PASP, 125, 306
- Foster et al. (2016) Foster, C., Pastorello, N., Roediger, J., et al. 2016, MNRAS, 457, 147
- Gabor & Davé (2012) Gabor, J. M. & Davé, R. 2012, MNRAS, 427, 1816
- Georgiev et al. (2010) Georgiev, I. Y., Puzia, T. H., Goudfrooij, P., & Hilker, M. 2010, MNRAS, 406, 1967
- Grand et al. (2019) Grand, R. J. J., van de Voort, F., Zjupa, J., et al. 2019, MNRAS, 490, 4786
- Harris et al. (2017) Harris, W. E., Blakeslee, J. P., & Harris, G. L. H. 2017, ApJ, 836, 67
- Harris et al. (2013) Harris, W. E., Harris, G. L. H., & Alessi, M. 2013, ApJ, 772, 82
- Harrison (2017) Harrison, C. M. 2017, Nature Astronomy, 1, 0165
- Hearin et al. (2014) Hearin, A. P., Watson, D. F., Becker, M. R., et al. 2014, MNRAS, 444, 729
- Hilz et al. (2012) Hilz, M., Naab, T., Ostriker, J. P., et al. 2012, MNRAS, 425, 3119
- Hopkins et al. (2010a) Hopkins, P. F., Bundy, K., Croton, D., et al. 2010a, ApJ, 715, 202
- Hopkins et al. (2010b) Hopkins, P. F., Croton, D., Bundy, K., et al. 2010b, ApJ, 724, 915
- Hopkins et al. (2006) Hopkins, P. F., Hernquist, L., Cox, T. J., et al. 2006, ApJS, 163, 1
- Hudson et al. (2015) Hudson, M. J., Gillis, B. R., Coupon, J., et al. 2015, MNRAS, 447, 298
- Hudson et al. (2014) Hudson, M. J., Harris, G. L., & Harris, W. E. 2014, ApJ, 787, L5
- Jeans (1915) Jeans, J. H. 1915, MNRAS, 76, 70
- Katz et al. (2017) Katz, H., Lelli, F., McGaugh, S. S., et al. 2017, MNRAS, 466, 1648
- Kelvin et al. (2014) Kelvin, L. S., Driver, S. P., Robotham, A. S. G., et al. 2014, MNRAS, 444, 1647
- Kent (1987) Kent, S. M. 1987, AJ, 93, 816
- Khochfar & Burkert (2006) Khochfar, S. & Burkert, A. 2006, A&A, 445, 403
- Kim et al. (2019) Kim, D.-W., James, N., Fabbiano, G., Forbes, D., & Alabi, A. 2019, MNRAS, 488, 1072
- King & Pounds (2015) King, A. & Pounds, K. 2015, ARA&A, 53, 115
- Kormendy & Ho (2013) Kormendy, J. & Ho, L. C. 2013, ARA&A, 51, 511
- Krajnović et al. (2013) Krajnović, D., Alatalo, K., Blitz, L., et al. 2013, MNRAS, 432, 1768
- Kravtsov et al. (2004) Kravtsov, A. V., Berlind, A. A., Wechsler, R. H., et al. 2004, ApJ, 609, 35
- Kravtsov & Gnedin (2005) Kravtsov, A. V. & Gnedin, O. Y. 2005, ApJ, 623, 650
- Kravtsov et al. (2018) Kravtsov, A. V., Vikhlinin, A. A., & Meshcheryakov, A. V. 2018, Astronomy Letters, 44, 8
- Lange et al. (2019) Lange, J. U., van den Bosch, F. C., Zentner, A. R., Wang, K., & Villarreal, A. S. 2019, MNRAS, 487, 3112
- Lapi et al. (2018) Lapi, A., Salucci, P., & Danese, L. 2018, ApJ, 859, 2
- Leauthaud et al. (2012) Leauthaud, A., Tinker, J., Bundy, K., et al. 2012, ApJ, 744, 159
- Lelli et al. (2016a) Lelli, F., McGaugh, S. S., & Schombert, J. M. 2016a, AJ, 152, 157
- Lelli et al. (2016b) Lelli, F., McGaugh, S. S., & Schombert, J. M. 2016b, ApJ, 816, L14
- Li et al. (2020) Li, P., Lelli, F., McGaugh, S., & Schombert, J. 2020, ApJS, 247, 31
- Li et al. (2011) Li, Z.-Y., Ho, L. C., Barth, A. J., & Peng, C. Y. 2011, ApJS, 197, 22
- Lynden-Bell (1962) Lynden-Bell, D. 1962, MNRAS, 124, 1
- Mandelbaum et al. (2006) Mandelbaum, R., Seljak, U., Kauffmann, G., Hirata, C. M., & Brinkmann, J. 2006, MNRAS, 368, 715
- Mandelbaum et al. (2016) Mandelbaum, R., Wang, W., Zu, Y., et al. 2016, MNRAS, 457, 3200
- Marasco et al. (2020) Marasco, A., Posti, L., Oman, K., et al. 2020, A&A, 640, A70
- Martin et al. (2018) Martin, G., Kaviraj, S., Devriendt, J. E. G., Dubois, Y., & Pichon, C. 2018, MNRAS, 480, 2266
- Martinsson et al. (2013) Martinsson, T. P. K., Verheijen, M. A. W., Westfall, K. B., et al. 2013, A&A, 557, A131
- Mo et al. (1998) Mo, H. J., Mao, S., & White, S. D. M. 1998, MNRAS, 295, 319
- More et al. (2011) More, S., van den Bosch, F. C., Cacciato, M., et al. 2011, MNRAS, 410, 210
- Moster et al. (2013) Moster, B. P., Naab, T., & White, S. D. M. 2013, MNRAS, 428, 3121
- Moster et al. (2018) Moster, B. P., Naab, T., & White, S. D. M. 2018, MNRAS, 477, 1822
- Moster et al. (2020) Moster, B. P., Naab, T., & White, S. D. M. 2020, MNRAS, 499, 4748
- Naab et al. (2009) Naab, T., Johansson, P. H., & Ostriker, J. P. 2009, ApJ, 699, L178
- Navarro et al. (1996) Navarro, J. F., Frenk, C. S., & White, S. D. M. 1996, ApJ, 462, 563
- Nipoti et al. (2003) Nipoti, C., Londrillo, P., & Ciotti, L. 2003, MNRAS, 342, 501
- Ogle et al. (2019) Ogle, P. M., Lanz, L., Appleton, P. N., Helou, G., & Mazzarella, J. 2019, ApJS, 243, 14
- Oh et al. (2011) Oh, S.-H., de Blok, W. J. G., Brinks, E., Walter, F., & Kennicutt, Robert C., J. 2011, AJ, 141, 193
- Oser et al. (2012) Oser, L., Naab, T., Ostriker, J. P., & Johansson, P. H. 2012, ApJ, 744, 63
- Pascale et al. (2018) Pascale, R., Posti, L., Nipoti, C., & Binney, J. 2018, MNRAS, 480, 927
- Peacock & Smith (2000) Peacock, J. A. & Smith, R. E. 2000, MNRAS, 318, 1144
- Peng et al. (2002) Peng, C. Y., Ho, L. C., Impey, C. D., & Rix, H.-W. 2002, AJ, 124, 266
- Peng et al. (2010) Peng, Y.-j., Lilly, S. J., Kovač, K., et al. 2010, ApJ, 721, 193
- Planck Collaboration et al. (2020) Planck Collaboration, Aghanim, N., Akrami, Y., et al. 2020, A&A, 641, A6
- Posti et al. (2015) Posti, L., Binney, J., Nipoti, C., & Ciotti, L. 2015, MNRAS, 447, 3060
- Posti et al. (2019a) Posti, L., Fraternali, F., & Marasco, A. 2019a, A&A, 626, A56
- Posti & Helmi (2019) Posti, L. & Helmi, A. 2019, A&A, 621, A56
- Posti et al. (2019b) Posti, L., Marasco, A., Fraternali, F., & Famaey, B. 2019b, A&A, 629, A59
- Posti et al. (2014) Posti, L., Nipoti, C., Stiavelli, M., & Ciotti, L. 2014, MNRAS, 440, 610
- Pota et al. (2015) Pota, V., Romanowsky, A. J., Brodie, J. P., et al. 2015, MNRAS, 450, 3345
- Pulsoni et al. (2018) Pulsoni, C., Gerhard, O., Arnaboldi, M., et al. 2018, A&A, 618, A94
- Quinn et al. (1993) Quinn, P. J., Hernquist, L., & Fullagar, D. P. 1993, ApJ, 403, 74
- Reddick et al. (2013) Reddick, R. M., Wechsler, R. H., Tinker, J. L., & Behroozi, P. S. 2013, ApJ, 771, 30
- Rodríguez-Puebla et al. (2015) Rodríguez-Puebla, A., Avila-Reese, V., Yang, X., et al. 2015, ApJ, 799, 130
- Rodríguez-Puebla et al. (2017) Rodríguez-Puebla, A., Primack, J. R., Avila-Reese, V., & Faber, S. M. 2017, MNRAS, 470, 651
- Saito et al. (2016) Saito, S., Leauthaud, A., Hearin, A. P., et al. 2016, MNRAS, 460, 1457
- Sanders & Binney (2016) Sanders, J. L. & Binney, J. 2016, MNRAS, 457, 2107
- Sanders & Evans (2015) Sanders, J. L. & Evans, N. W. 2015, MNRAS, 454, 299
- Sersic (1968) Sersic, J. L. 1968, Atlas de Galaxias Australes
- Sheth et al. (2010) Sheth, K., Regan, M., Hinz, J. L., et al. 2010, PASP, 122, 1397
- Spitler & Forbes (2009) Spitler, L. R. & Forbes, D. A. 2009, MNRAS, 392, L1
- Taylor et al. (2020) Taylor, E. N., Cluver, M. E., Duffy, A., et al. 2020, MNRAS[arXiv:2006.10040]
- Tinker et al. (2008) Tinker, J., Kravtsov, A. V., Klypin, A., et al. 2008, ApJ, 688, 709
- Tinker et al. (2017) Tinker, J. L., Brownstein, J. R., Guo, H., et al. 2017, ApJ, 839, 121
- Tinker et al. (2013) Tinker, J. L., Leauthaud, A., Bundy, K., et al. 2013, ApJ, 778, 93
- Tortora et al. (2019) Tortora, C., Posti, L., Koopmans, L. V. E., & Napolitano, N. R. 2019, MNRAS, 489, 5483
- Tully & Fisher (1977) Tully, R. B. & Fisher, J. R. 1977, A&A, 54, 661
- Tumlinson et al. (2017) Tumlinson, J., Peeples, M. S., & Werk, J. K. 2017, ARA&A, 55, 389
- Vale & Ostriker (2004) Vale, A. & Ostriker, J. P. 2004, MNRAS, 353, 189
- van Albada et al. (1985) van Albada, T. S., Bahcall, J. N., Begeman, K., & Sancisi, R. 1985, ApJ, 295, 305
- van Uitert et al. (2016) van Uitert, E., Cacciato, M., Hoekstra, H., et al. 2016, MNRAS, 459, 3251
- Vasiliev (2019) Vasiliev, E. 2019, MNRAS, 482, 1525
- Veilleux et al. (2005) Veilleux, S., Cecil, G., & Bland-Hawthorn, J. 2005, ARA&A, 43, 769
- Watkins et al. (2010) Watkins, L. L., Evans, N. W., & An, J. H. 2010, MNRAS, 406, 264
- Wechsler & Tinker (2018) Wechsler, R. H. & Tinker, J. L. 2018, ARA&A, 56, 435
- Williams & Evans (2015) Williams, A. A. & Evans, N. W. 2015, MNRAS, 448, 1360
- Williams et al. (2014) Williams, A. A., Evans, N. W., & Bowden, A. D. 2014, MNRAS, 442, 1405
- Wojtak & Mamon (2013) Wojtak, R. & Mamon, G. A. 2013, MNRAS, 428, 2407
- Yang et al. (2008) Yang, X., Mo, H. J., & van den Bosch, F. C. 2008, ApJ, 676, 248
- Zhao (1996) Zhao, H. 1996, MNRAS, 278, 488
- Zheng et al. (2007) Zheng, Z., Coil, A. L., & Zehavi, I. 2007, ApJ, 667, 760
- Zu & Mandelbaum (2015) Zu, Y. & Mandelbaum, R. 2015, MNRAS, 454, 1161
Appendix A Action-based dynamical models of early-type galaxies
Here, we describe the dynamical models that we use to represent the distribution function of globular cluster systems around 25 ellipticals and lenticulars and their dark matter halos. We first summarise the basic principles of models based on action-angle variables, and then we describe our application to the study of early types. For a more complete introduction to action-angle variables, we refer the reader to the monographs by Born (1927) and Arnold (1978). We use the code AGAMA (Vasiliev 2019) to evaluate actions, potentials, and distribution functions, and to generate the dynamical models in this work.
A.1 Preliminaries
We begin with the distribution function (DF) for a globular cluster system , defined such that is the probability of finding a cluster in the infinitesimal volume element at the position-velocity point in phase-space. According to the strong form of the Jeans (1915) theorem, in a steady state, is a function of the integrals of motion (see also Lynden-Bell 1962). Without loss of generality, we may choose these to be the three action integrals
| (8) |
where and are canonically conjugate momenta and coordinates, and write the DF as .
Actions and their canonically conjugate angles , are the “natural” coordinates of galactic dynamics since i) the description of orbits becomes mathematically simplest, ii) they describe systems both in and out of equilibrium and iii) actions are adiabatic invariants, i.e. they are constant under slow changes of the potential (see e.g. Binney & Tremaine 2008). models have been somewhat underused in galactic dynamics, mainly because actions generally cannot be expressed with algebraic functions of positions and velocities and need to be computed numerically. In recent years, several crucial advances have made it feasible to calculate efficiently in arbitrary potentials (see e.g. Sanders & Binney 2016, and references therein). This, in turn, has led to the introduction of several analytic DFs tailored to model different galaxy components (e.g. Binney 2010; Posti et al. 2015; Sanders & Evans 2015; Pascale et al. 2018; Vasiliev 2019).
In this work, we deal mostly with spherical potentials, which greatly simplifies the numerical calculations. In the case of a spherical system the motion of particles is confined to a plane and all orbits can be characterised by two actions. One of these is the total angular momentum , and the other is the radial action
| (9) |
where and are the radial momentum and position, is the energy, is the gravitational potential and and are the apocentre and pericentre of the orbit. Thus, in the spherical case, we have and .
A.2 Distribution function
To describe the phase-space distribution of globular clusters we use the DF introduced by Posti et al. (2015, see also , ). This is
| (10) |
where
| (11) |
Here is a parameter proportional to the mass of the system described by the DF; since we are treating the globular clusters as tracers of the potential, is unimportant in this context. The DF of Eq. (10) has 6 free parameters, all with specific physical meanings. and B control the asymptotic slopes of the density profile in the inner () and outer parts () respectively, while the parameter A controls the sharpness of the transition between these regimes. In the case , the two slopes and B have a direct correspondence to the asymptotic slopes of the density distribution666 Posti et al. (2015) showed that a self-consistent model with DF as in Eq. (10) and generates a density law that is roughly equal to that of a -model (Zhao 1996) with , and . . is a characteristic action that defines the radial scale at which the transition between the two regimes occurs. The last two parameters, and , control the velocity anisotropy of the model in the inner and outer parts, respectively.
An important advantage of the double power-law in Eq. (10), over models that depend on , is that in the former case the density distribution effectively decouples from the velocity distribution. This allows us to fix at the outset the parameters of the DF that regulate the density profile of a GC system (A, B, ) and then to fit only for those that determine the velocity anisotropy of the system (, , ). Such decoupling is possible because, for double power-law models, the homogeneous functions and are designed to approximate surfaces of constant energy in action space (Williams et al. 2014; Posti et al. 2015). Thus, and largely determine the differential energy distribution , and hence the density profile of the model (see S4.3 in Binney & Tremaine 2008). Starting from a quasi-ergodic model, where and appear on an equal footing in and , one can easily make the model anisotropic by varying and without altering the radial density profile (Binney 2014; Posti et al. 2015).
As a first step in our modelling procedure, we fix the two slopes and B and the sharpness A by matching to the observed number density profile of GCs. In Fig. 1b, we show this fit for the GC system of the galaxy NGC 4494, with (A, B, . We find that, in all cases, the double power-law density profiles generated by Eq. (10) provide a very good description of the observed GC number density profiles. The remaining three parameters, , and , are instead allowed to vary, but, for internal consistency of the DF, we need to require (see Posti et al. 2015; Vasiliev 2019).
A.3 Gravitational potential
We model the mass distribution of each galaxy with two spherical components; the stellar body of the galaxy and its dark matter halo – the globular cluster system is then regarded as a tracer with negligible mass. The stellar distribution is described by a numerically deprojected Sersic (1968) profile, whose parameters are taken from the photometry of 3.6 m Spitzer images by Forbes et al. (2017b). We fix all the parameters of the stellar component, except its mass-to-light ratio at 3.6 m, which we allow to vary with a log-normal prior with a central value estimated by Forbes et al. (2017b) from stellar population models, and a dispersion of 0.2 dex.
The dark matter halo in our model is described by a standard NFW profile. This has two free parameters: the virial mass () and concentration (), which we allow to vary. While we adopt a flat (uninformative) prior on the halo mass, we use a prior for the concentration that follows the mean correlation from CDM simulations, with a scatter of 0.11 dex (Dutton & Macciò 2014). Thus, overall our models have six free parameters: three for the potential and three for the DF.
Several of our galaxies appear flattened on the sky, so it is important to evaluate whether the assumption of spherical symmetry for the stellar component of the potential significantly affects our results. To check this, we have re-run all of our models with an axisymmetric galaxy mass distribution that has the same 3D flattening as the 2D image (Forbes et al. 2017b), while the dark matter halo is still spherical. With respect a spherical galaxy with the same mass, the deviations in the resulting halo masses are always well within the uncertainties777 We also recall that the potential is always more spherical than the mass distribution that it generates (Binney & Tremaine 2008). . We are therefore confident that the assumption of spherical symmetry in the galactic mass distribution does not significantly bias our results.
A.4 Parameters estimation
We estimate the posterior distributions of the model parameters () with standard Bayesian inference: , where are the data, is the likelihood, and is the prior. We adopt a prior that is flat (uninformative) for four parameters (, , and ), gaussian for , with a mean estimated for each galaxy by Forbes et al. (2017b) with stellar population models and a dispersion of 0.2 dex, and gaussian for , with a mean given by the CDM relation and a dispersion of 0.11 dex.
The DF in Eq. (10) itself is a probability distribution that can serve as the likelihood in our framework. Specifically, for a set of particles with position-velocity coordinates orbiting in a given potential , the likelihood, given the model , is simply . In reality, when dealing with data, one does not know the positions and velocities with infinite precision; thus, a convolution of the DF with the observed error distribution is needed (see Binney & Wong 2017; Posti & Helmi 2019).
In our case, we also lack information about the two transverse velocities and the precise positions of the GCs along the line-of-sight (LOS). To take this into account, we marginalise the likelihood over all of the realistically possible transverse velocities and LOS positions of the clusters. For the two unknown transverse velocities , we adopt uniform distributions in the range , where is the escape velocity of the potential. For the unknown LOS position , we adopt the deprojected density distribution of the GC system , where is the spherical radius, , evaluated at a fixed position on the sky . Thus, we have the following error distribution
| (12) |
where is a point in phase space in a Cartesian frame centred on the galaxy, and are the observations. Here is the deprojected density distribution derived from the observed GC number counts profile (Fig. 1b), is a gaussian distribution with mean and dispersion , is a uniform distribution in the range , and is a Dirac delta distribution centred on . We use a distribution because the uncertainty in the sky positions of the clusters is negligible. Finally, the likelihood of our model is given by the convolution of the DF with the distribution of each cluster, i.e.
| (13) |
In practice, we evaluate Eq. (13) with a Monte Carlo method, sampling the integral and the distribution of each cluster with 1000 realisations. Fortunately, the likelihood in Eq. (13) turns out to be quite insensitive to the specific form of both the density distribution and the distributions of the missing velocities; in fact, we verified that using a gaussian instead of a uniform distribution in and does not alter significantly our results on the halo masses. As an example, in Fig. 1d, we show the distribution of clusters around NGC 4494 on the observable projection of the phase-space, the plane, compared to the prediction of the maximum-likelihood model for this galaxy. The plane is effectively the sub-space where we are fitting our models to the data.
With the prior and likelihood defined as above, we evaluate the posterior distribution of the six free parameters of the model with a Markov Chain Monte Carlo (MCMC) method; in particular, we use the affine-invariant sampler implemented in the code emcee by Foreman-Mackey et al. (2013). For all 25 SLUGGS early-type galaxies, we find that the chains converge quite rapidly around a well-defined peak in the posterior after a short burn-in phase. As an example, in Fig. 1c, we show the marginalised posterior distributions for the halo mass and concentration for the galaxy NGC 4494. Clearly, both and are well constrained by our analysis, despite having an unavoidable degeneracy. For each parameter, we take the median of the marginalised posterior as the best-fit value and the interval between the 16th and 84th percentiles as a measure of its uncertainty.
A.5 Derived quantities
From our model, with parameters optimised for each GC system in the SLUGGS sample, we can now derive several other properties of interest. In Fig. 1e, we show, as examples, the circular velocity curve of the mass distribution, , and the (spherically averaged) velocity anisotropy profile of the GC system, . While depends only on the three free parameters of the gravitational potential , depends mostly on the three free parameters of the DF (). This means, incidentally, that the uncertainty on , which we estimate with random realisations of the model from the posterior ( grey band in Fig. 1e), is fully determined by the width of the posterior on the parameters of the potential (Fig. 1c).
We can also compute the profile of the LOS velocity dispersion of the GC systems (), which depends on both the potential and the DF. We show this model profile for NGC 4494 in Fig. 1f, where we compare it with the observed profile (see Foster et al. 2016). Such a comparison is meaningful since we do not input directly the profile to our fitting routine, although we do, of course, input the same individual velocities that determine . The agreement that we observe for NGC 4494 (Fig. 1f), and also for the other galaxies in our sample (not shown), thus serves as a useful consistency check on our procedure.
For 18 of the 25 early types in our sample, Pulsoni et al. (2018) measured the velocity dispersion profile of the population of planetary nebulae orbiting around the host galaxy and found that in most cases it agrees quite well with the profile of the GC system from SLUGGS. Fig. 1f shows this agreement for NGC 4494. In a few cases, however, the for the planetary nebulae is lower than for the globular clusters. This difference in the likely reflects the different density profiles of the two types of tracers orbiting in the same gravitational potential. Even among GCs, there are differences in when the system is subdivided by colour. Red GCs have lower than blue GCs, and are in better agreement with both the velocity dispersion of planetary nebulae and the stellar bodies of galaxies (e.g. Pota et al. 2015).