Capturing the inside-out quenching by black holes with far-infrared atomic line ratios
Abstract
We propose to use relative strengths of far-infrared fine structure lines from galaxies to characterise early phases of the inside-out quenching by massive black holes (BHs). The BH feedback is thought to quench star formation by evacuating the ambient gas. In order to quantify the feedback effect on the gas density in the galactic centres, we utilise the outputs of IllustrisTNG and Illustris simulations, which implement different BH feedback models. We devise a physical model of H regions and compute the intensities of [O] and lines. The line intensity ratio is sensitive to the local electron density, and thus can be used to measure the strength and physical extent of the BH quenching. If the BH feedback abruptly operates and expel the gas when it grows to a certain mass, as modelled in IllustrisTNG, the low-density gas yields relatively weak [O] line with respect to . In contrast, if the feedback strength and hence the local gas density are not strongly correlated with the BH mass, as in Illustris, the line ratio is not expected to vary significantly among galaxies with different evolutionary stages. We find these features are reproduced in the simulations. We also show that the line ratios are not sensitive to the aperture size for measurement, and thus observations do not need to resolve the galactic centres. We argue that the integrated line ratios can be used to capture the onset of the inside-out quenching by BHs.
keywords:
methods: numerical – galaxies: evolution – galaxies: nuclei – quasars: supermassive black holes1 Introduction
A wide variety of physical processes occur in the central regions of galaxies through the co-evolution of galaxies and massive black holes (BHs). Detailed observations of galactic inner regions can therefore provide important clues to the evolutionary stages of the galaxies. It is theoretically expected that, in massive galaxies in the high-redshift Universe, a large amount of gas is funnelled into the galactic centre, where the earliest episode of star formation should have taken place. There, the central BH can grow by accreting a large amount of gas, but the details of this process have not been elucidated (e.g. Inayoshi et al., 2020, and references therein). When there is a large amount of dense gas in the galactic centre, a massive BH can outshine as a quasar by accreting the ambient gas at a high rate. When the gas around a BH is diffuse and the accretion rate is low, it can expel the gas from the galactic centre through various processes such as high-energy radiation and launching a jet. If the feedback effect of active galactic nuclei (AGN) is strong enough to expel most of the gas from the galaxy, star formation activity there is effectively ‘quenched’, and the galaxy evolves to a quiescent galaxy that consists of old and red stars with little gas. Hence the AGN feedback plays a key role in the evolution of galaxies that host massive BHs.
It is known that the star formation efficiencies of galaxies, i.e. ratios of stellar to halo masses, peaks at a halo mass of , and declines toward more massive galaxies (e.g. Silk & Mamon, 2012; Behroozi et al., 2019). This trend is often attributed to the feedback by massive BHs. In a colour-magnitude diagram, quenched galaxies are generally found in a ‘red sequence’ as elliptical and lenticular galaxies, which is distinct from a ‘blue cloud’ consisting of star-forming galaxies. Several quenching mechanisms have been proposed to transform galaxies from blue to red through the so-called ‘green valley’ (e.g. Martig et al., 2009; Schawinski et al., 2014; Joshi et al., 2020), and the BH feedback is thought to be a major process that shapes the colour bimodality of the local galaxies by quenching star formation in massive galaxies.
Because the AGN feedback is driven by the central BH, star-formation quenching is expected to proceed from the galactic centre first and then propagate outwards. This "inside-out" quenching process would begin with lowering the gas densities in the central regions, whereas the outer regions still sustain their star formation activity with a sufficient amount of dense gas. Contrastingly, if there are no massive BHs are or the feedback is insufficient, galaxies usually have gas density profiles increasing towards the centre. Therefore, measuring the gas density at the galactic centre may provide a probe of the inside-out quenching by massive BHs. Namely, if a star-forming galaxy is observed to have a low gas density at the centre, it may be a sign of the onset of the BH quenching of star formation.
Although it is difficult to measure directly the gas densities by observations especially for distant galaxies, one can use the intensity ratio between a specific pair of emission lines to estimate the local electron density. In the present study, we focus on the fine structure lines of doubly ionized oxygen at the wavelengths of and (hereafter [O and [O). The relative strength of [O to (hereafter [O) is sensitive to the electron density of the line emitting region owing to their different critical densities (e.g. Keenan & Aggarwal, 1988). The [O] lines are detected in various astronomical objects including low- and high-redshift galaxies (e.g. De Looze et al., 2014; Inoue et al., 2016; Novak et al., 2019). We apply a physical model of the [O] line emission to the output of cosmological hydrodynamics simulations and examine whether or not and how the BH feedback affects the line ratio.
Since the detailed physics of BH formation and growth are not know, and numerical simulations do not have a sufficient resolution to reproduce the interaction between BHs and the surrounding gas, even the state-of-the-art cosmological simulations treat the formation, growth and feedback of BHs as sub-resolution models (see Section 2.1). Unfortunately, there is not a well-established model of BH feedback, and recent simulations adopt different numerical implementation, especially for massive BHs. The major purposes of our study are to predict the line ratios of [O for star-forming galaxies using cosmological simulations and to show how characteristic features of BH feedback models are inferred from the line ratio.
We utilise the outputs of the cosmological simulation of the Next Generation Illustris (hereafter IllustrisTNG or TNG). Nelson et al. (2018b) show that IllustrisTNG reproduces well the colour bimodality of galaxies observed in the local Universe thanks to its improved model for BH feedback in massive galaxies. However, Hayward et al. (2020) postprocess the simulation data and model sub-millimetre galaxies (SMGs) at redshift , to show that TNG significantly underestimates the SMG luminosity function. They argue that the BH quenching in TNG appears to operate too early. It is thus important to study in detail the feedback effects caused by the massive BHs in the simulations. Using the two sets of simulations allows us to make a quantitative comparison; we apply the same analysis to the original Illustris simulation (hereafter Illustris), in which the BH feedback model is different from that of TNG. Hayward et al. (2020) also shows that Illustris can reproduce the luminosity function of SMGs better than TNG. With our postprocessing model of the [O] lines, we can address how the differences in the BH feedback models affect the line ratios. It is worth noting here that we do not aim at judging which simulation is more realistic. We propose a method or diagnostics to constrain BH models using observations of emission lines from star-forming galaxies at low and high redshifts. The results of our study would eventually help to understand the behaviours of BH quenching observationally, such as the dependence of the feedback efficiency on BH mass and on other physical parameters in the real Universe.
Because far-infrared emission of atomic fine-structure lines is optically thin, their relative strengths can be used as a direct probe of the gas (electron) density of the emitting region. High-redshift quasars at are bright in the line emission such as [O] and [N] and have been observed with Atacama Large Millimetre/submillimetre Array (ALMA). Our method using these line pairs could be applicable to such quasars in the early Universe. However, because there are no massive BHs at in the above simulations, we demonstrate our method with snapshot data at .
In Section 2, we describe the cosmological simulations of IllustrisTNG and Illustris. In Section 3, we explain our models to compute the [O] lines from snapshot data of the simulations. We present our results in Section 4 and discuss them in Section 5. We summarise this study and draw our conclusions in Section 6.
2 The cosmological simulations
We utilise publicly available data sets of IllustrsTNG and Illustris. The details of the simulations are presented on the respective web sites111https://www.tng-project.org/,222https://www.illustris-project.org/ and in related papers including Nelson et al. (2018a), Weinberger et al. (2017) and Pillepich et al. (2018) for IllustrisTNG, and Vogelsberger et al. (2014a, b), Genel et al. (2014) and Sijacki et al. (2015) for Illustris. Both simulations are performed with an -body/moving-mesh hydrodynamics code Arepo (Springel, 2010; Weinberger et al., 2020). The sub-resolution physics such as gas cooling, star formation and supernovae implemented are essentially the same in the simulations. The main differences between the TNG and Illustris are in their BH feedback models and implementation of magneto-hydrodynamics (see Section 2.1). Although only TNG includes the effects of magnetic fields, Pakmor et al. (2017) show that the presence of magnetic fields hardly affects the formation history of the simulated galaxies. This study focuses on the runs of TNG100-1 and Illustris-1 for the IllustrisTNG and Illustris simulations, respectively. Their resolutions and sizes of the simulated volumes are hardly different. Their simulation boxes have comoving side lengths of , and the mass-resolutions for dark matter and gas are and . Hence, the comparison between TNG100-1 and Illustris-1 is expected to extract physical influences by their different BH feedback models.
In the simulations, dense gas cells with are converted to stellar particles according to a stochastic model of star formation. The mass-resolution of a stellar particle is therefore comparable to that of the parent gas cell. Star formation rate (SFR) is calculated as
| (1) |
where is a mass of the parent cell, is the mass fraction of cold gas computed with a model of Yepes et al. (1997, see also ), and the star-formation time-scale is approximated as a free-fall time within the cell: . A stellar particle is assumed to have the initial mass function (IMF) of Chabrier (2005). Type-II supernovae (SNe) are triggered immediately following the star formation, and a feedback model of Springel & Hernquist (2003) is adopted to represent stellar feedback effects. Type-Ia SNe and asymptotic giant branch stars eject mass and metals into nearby gas cells.
Gravitationally bound structures are identified with the friend-of-friend and SUBFIND grouping algorithms (e.g. Springel et al., 2001). In this study, the total masses and SFRs are computed for each SUBFIND group (galaxy). When a single galaxy hosts multiple BHs, we define the most massive one to be the representative BH of the galaxy and consider its mass to be the BH mass, , of the galaxy.
2.1 The black hole models
The details of the BH model of IllustrisTNG and Illustris are described in Weinberger et al. (2017) and Sijacki et al. (2007); Sijacki et al. (2015), respectively. Briefly, BHs are seeded with the initial mass of when their friend-of-friend host haloes reach in TNG, whereas the corresponding masses are and in Illustris. The seed BHs are placed at the potential centres of their host haloes and move together with them. The BHs increase their masses by accreting the surrounding gas at rates given by the Bondi–Hoyle–Lyttleton formula limited by the Eddington rate , i.e. . In computing , IllustrisTNG does not use an artificial boost factor nor take into account relative velocity between the BH and ambient gas unlike Illustris.
In both the simulations, the BH model assumes two feedback modes according to whether the Eddington ratios are higher or lower than a critical value . An important point in our study is that TNG and Illustris adopt different definitions of . IllustrisTNG assumes to be a function of as
| (2) |
where and , whereas Illustris sets a constant value of . When , an inefficient thermal feedback mode called "quasar mode" is switched on in both simulations. When , the BH feedback model largely differ between TNG and Illustris. In TNG, the criterion given by equation (2) quadratically increases with until reaches .333When , is limited to 0.1 according to equation (2). On the other hand, the Eddington ratio scales as if the properties of ambient gas do not change. The transition of the BH feedback is thus closely linked to in TNG.444As long as , a BH growing at a constant Eddington ratio necessarily reaches the condition of at a certain , when the BH feedback is switched to the low-accretion mode. This modelling makes a determinant quantity to switch between the two feedback modes, and massive BHs with are mostly in the low-accretion mode (see Section 4.1.1).
In the quasar mode with , a BH distributes thermal energies to nearby gas cells, given as , where the thermal coupling efficiencies are and in IllustrisTNG and Illustris, respectively. The bolometric luminosity is given by with radiative efficiency , where is the speed of light. This high-accretion mode occurs essentially in the same manner between the two simulations.
In TNG, a BH in the low-accretion mode with injects momenta to nearby gas cells (‘kinetic mode’, Weinberger et al., 2017). The energy-injection rate in this mode is given as with the efficiency .555If gas around a BH has a hydrogen number density lower than , the efficiency scales linearly with the local density as . The injection per time-step is accumulated in time, and the integrated energy is released every time it exceeds a certain threshold given by equation (13) of Weinberger et al. (2017). The accumulation makes the BH feedback strong enough to blow out the gas around the BH to halo regions. Since the kinetic energy injected as momentum is not converted quickly to thermal energy that is lost by gas cooling, the kinetic mode can cause efficient feedback in galaxies with massive BHs.
In Illustris, the low-accretion mode with injects thermal energies to gas within a ‘bubble’ region in the galaxy (‘radio mode’, Sijacki et al., 2007). The injected thermal energy into the bubble is given as , where . The injection is operated every time the BH increments its mass by from at the previous injection. The bubble is randomly located within a certain distance from a BH, and therefore the thermal energy is injected effectively by avoiding the high-density region at the galactic centre where the injected energy can be quickly radiated away.
The low-accretion modes are the main driver of the quenching process in massive galaxies in both the simulations although their models are largely different. We expect that characteristic features of the distinct BH feedback models can be found in galaxies that host massive BHs while still forming stars actively. We focus on the early stage of the BH quenching occurring in massive, star-forming galaxies.
3 [O line model
It is well known that a combination of far-infrared emission lines can be used to estimate the local election density of the line emitting region. Although we consider specifically the line ratio of [O in this study, other pairs such as [N] lines at and (e.g. Zhao et al., 2016; Doherty et al., 2020) can also be the density indicator (see also Section 5.1). Far-infrared fine structure lines are useful to observationally study the density structure of high-redshift galaxies, in which the inside-out quenching driven by massive BHs can be occuring.
3.1 Method
Because the [O lines are mainly emitted from H regions around young massive stars, we devise a physical model of H regions and implement in each gas cell in the simulations. We first evaluate the following physical quantities; a typical lifetime of a H region and the characteristic mass of a star cluster . We assume that the star cluster is the dominant radiation source that forms the H region. Note that is defined as the initial mass of a cluster. The number of H regions within a single gas cell is estimated as
| (3) |
where is an SFR of a cell, given by equation (1). We set the parameters to be (e.g. Krumholz, 2017; Fukushima et al., 2020) and . We allow to be less than 1, i.e. a computational cell covers only a fraction of a star-forming region. We assume that is constant during , and that the cluster stellar population is represented by time-integrated Chabrier IMF evolved over . We consider the metallicity of the stars to be the same as that of its parent gas cell. From these quantities, we compute the spectral energy distribution (SED) of a star cluster using PÉGASE.2 (Fioc & Rocca-Volmerange, 1999), and calculate the production rate of ionizing photons, , with energies higher than .
Since the spatial resolutions of star-forming gas cells with are in the order of – in the runs of TNG100-1 and Illustris-1, star-forming regions are not resolved in the simulations. The actual physical density in a star-forming region is therefore expected to be significantly higher than the cell density . We adopt a model for interstellar matter (ISM) used in Inoue et al. (2020), where a gas cell is considered to consist of cold and warm neutral media (CNM and WNM) with their density contrast of (Wolfire et al., 1995). The ISM model considers that the CNM and WNM are in pressure equilibrium due to the balance between (unresolved) SN feedback and thermal instability by cooling (Springel & Hernquist, 2003). According to the ISM model, we can compute a density and volume of the CNM for each gas cell. The density enhancement factors are estimated to be – depending on cell density (see figure 1 of Inoue et al., 2020). Although the CNM and WNM are unresolved in the simulations, stars are actually expected to form in the CNM. We therefore consider that all H regions reside in CNM, and the gas density inside the H regions is approximated to be for each cell.
To compute the line emission of [O based on the above model for H regions, we use a method described in Moriwaki et al. (2018). Assuming the density within an H region to be uniform, a Strömgren sphere forming the H region has a radius of
| (4) |
where is the case-B hydrogen recombination coefficient, and we assume a constant value of .666Although the coefficient actually depends on temperature of free electrons, we adopt the value estimated at . Considering a fully ionized state, the electron number density is equal to the hydrogen number density estimated for the H region by the above ISM model: . In all snapshots of both simulations, we confirm that the total volume of the Strömgren spheres, , does not exceed a volume of CNM in any star-forming cell with with the above parameter settings. Eventually, the volume-averaged ionization parameter inside is given as
| (5) |
In the plane-parallel case, the ionization parameter at an inner surface of the H region becomes .
For the H region modelled above, we adopt a spectral synthesis code Cloudy (version 17.02 of the code last described in Ferland et al., 2017) designed to simulate conditions in ISM. For our Cloudy model, we input an SED of the radiation source, ionization parameter , density , metallicity of gas, and redshift that sets the temperature of the cosmic microwave background. The SED is computed with PÉGASE.2 for our star cluster model. For the IllustrisTNG simulation, we use an oxygen-based metallicity: where and are the solar metallicity and oxygen abundance. This treatment is motivated by the fact that the [O lines are more sensitive to oxygen abundance than the total metallicity. Since the original Illustris simulation does not have information on oxygen abundance, we use a metallicity assigned to a gas cell as a proxy. At each redshift , we generate a look-up table of line intensities of [O, [O and H as a function of the three parameters of , and in logarithmic spacing of , although depends only on at a given (see below). The line emission of H is used for parameter calibration (see below). The look-up table covers the whole parameter space that the star-forming gas cells in the simulations can have. We estimate the line intensities of each gas cell from the tabulated values multiplied by . We assume that low-density cells with do not emit any radiation since they do not form stars. In this study, we do not take into account dust attenuation.
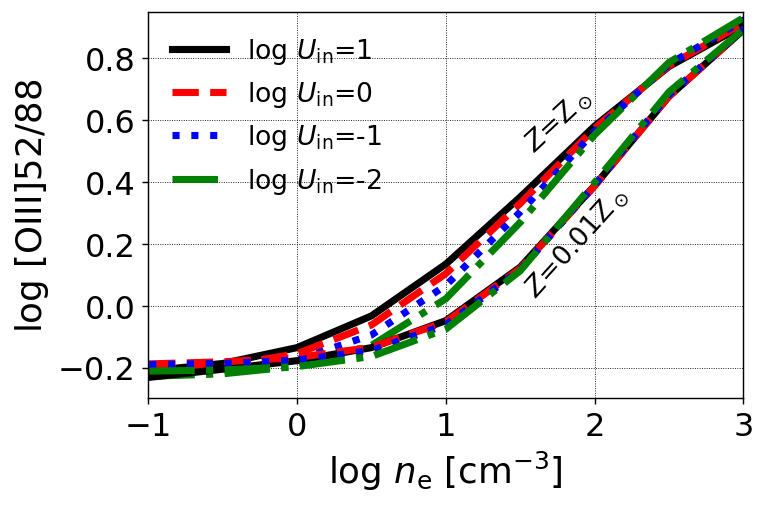
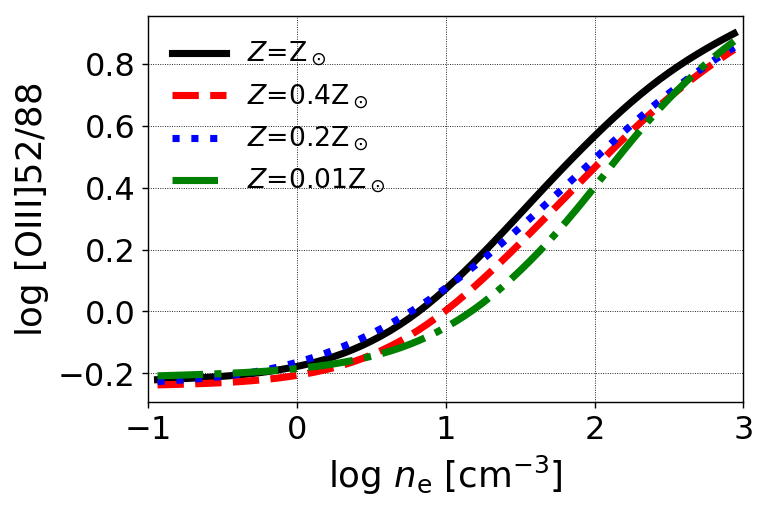
In our model described above, the properties of a Strömgren sphere are determined by an SED of a central star cluster and a local density , and the SED depends on , and . Hence, if we fix and , becomes a function of at a given . Fig. 1 illustrates the line ratios of [O computed with our model, as functions of for different . The line ratios monotonically increase with and hardly depend on (see also Fig. 19 in Appendix B). Thus, [O is expected to be an observational tracer of a local density in a star-forming region. Combining it with the fact that intensities of the [O] lines are nearly proportional to SFR (see below and e.g. De Looze et al., 2014), [O measured within an aperture can be used to estimate the averaged gas density weighted by SFR.
3.2 Parameter calibration and relationship with SFR
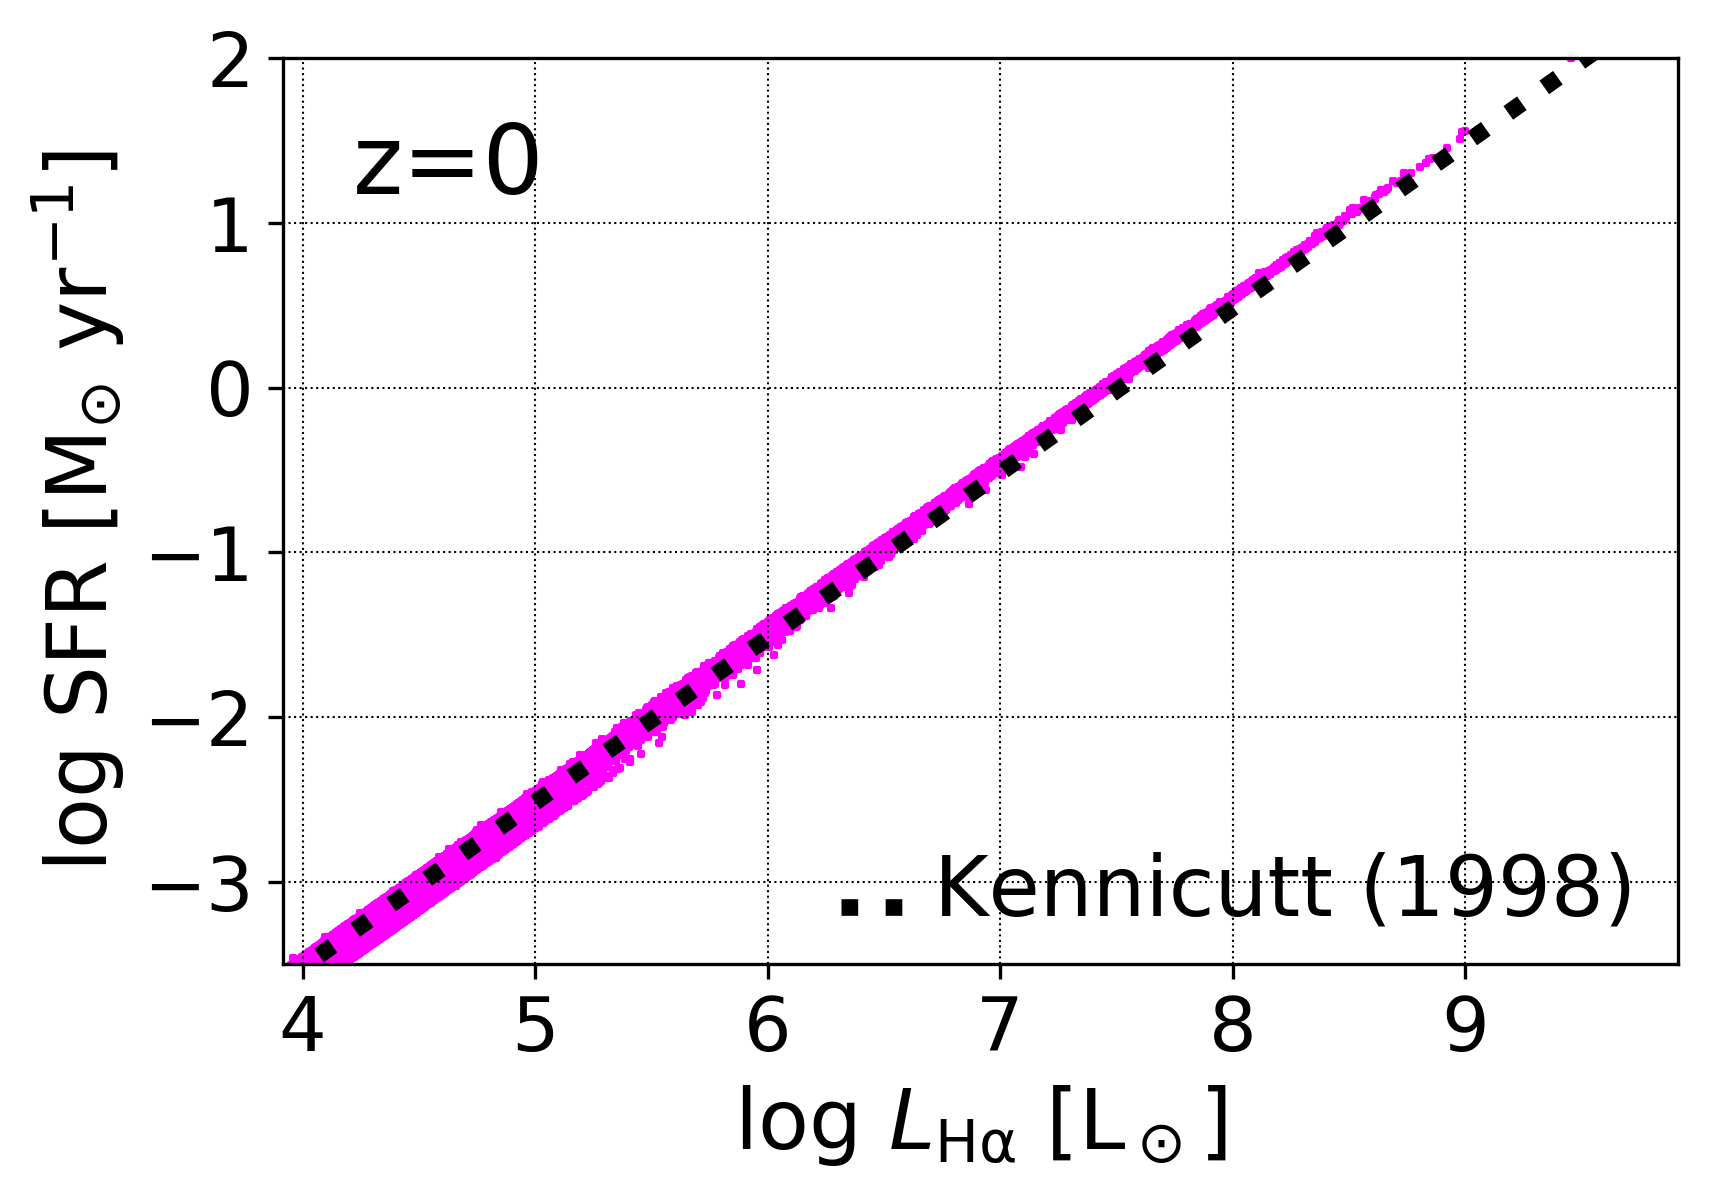
Fig. 2 shows relationship between the galaxy-integrated SFRs and the modelled H luminosities of all galaxies at redshift in IllustrisTNG. With the fiducial values of and , our result is in agreement with the observed relation of Kennicutt (1998). Our result for Illustris also shows the same consistency with the observations. We confirm that this result hardly depends on redshift or cluster mass in the ranges from to and from to .777When , we find that the total volumes of the Strömgren spheres can exceed the CNM volumes in some cells. We consider that would be too large for a typical cluster mass. The H luminosities increase with and deviate from the observed relation if . Accordingly, hereafter we argue our results with the fiducial values of and .
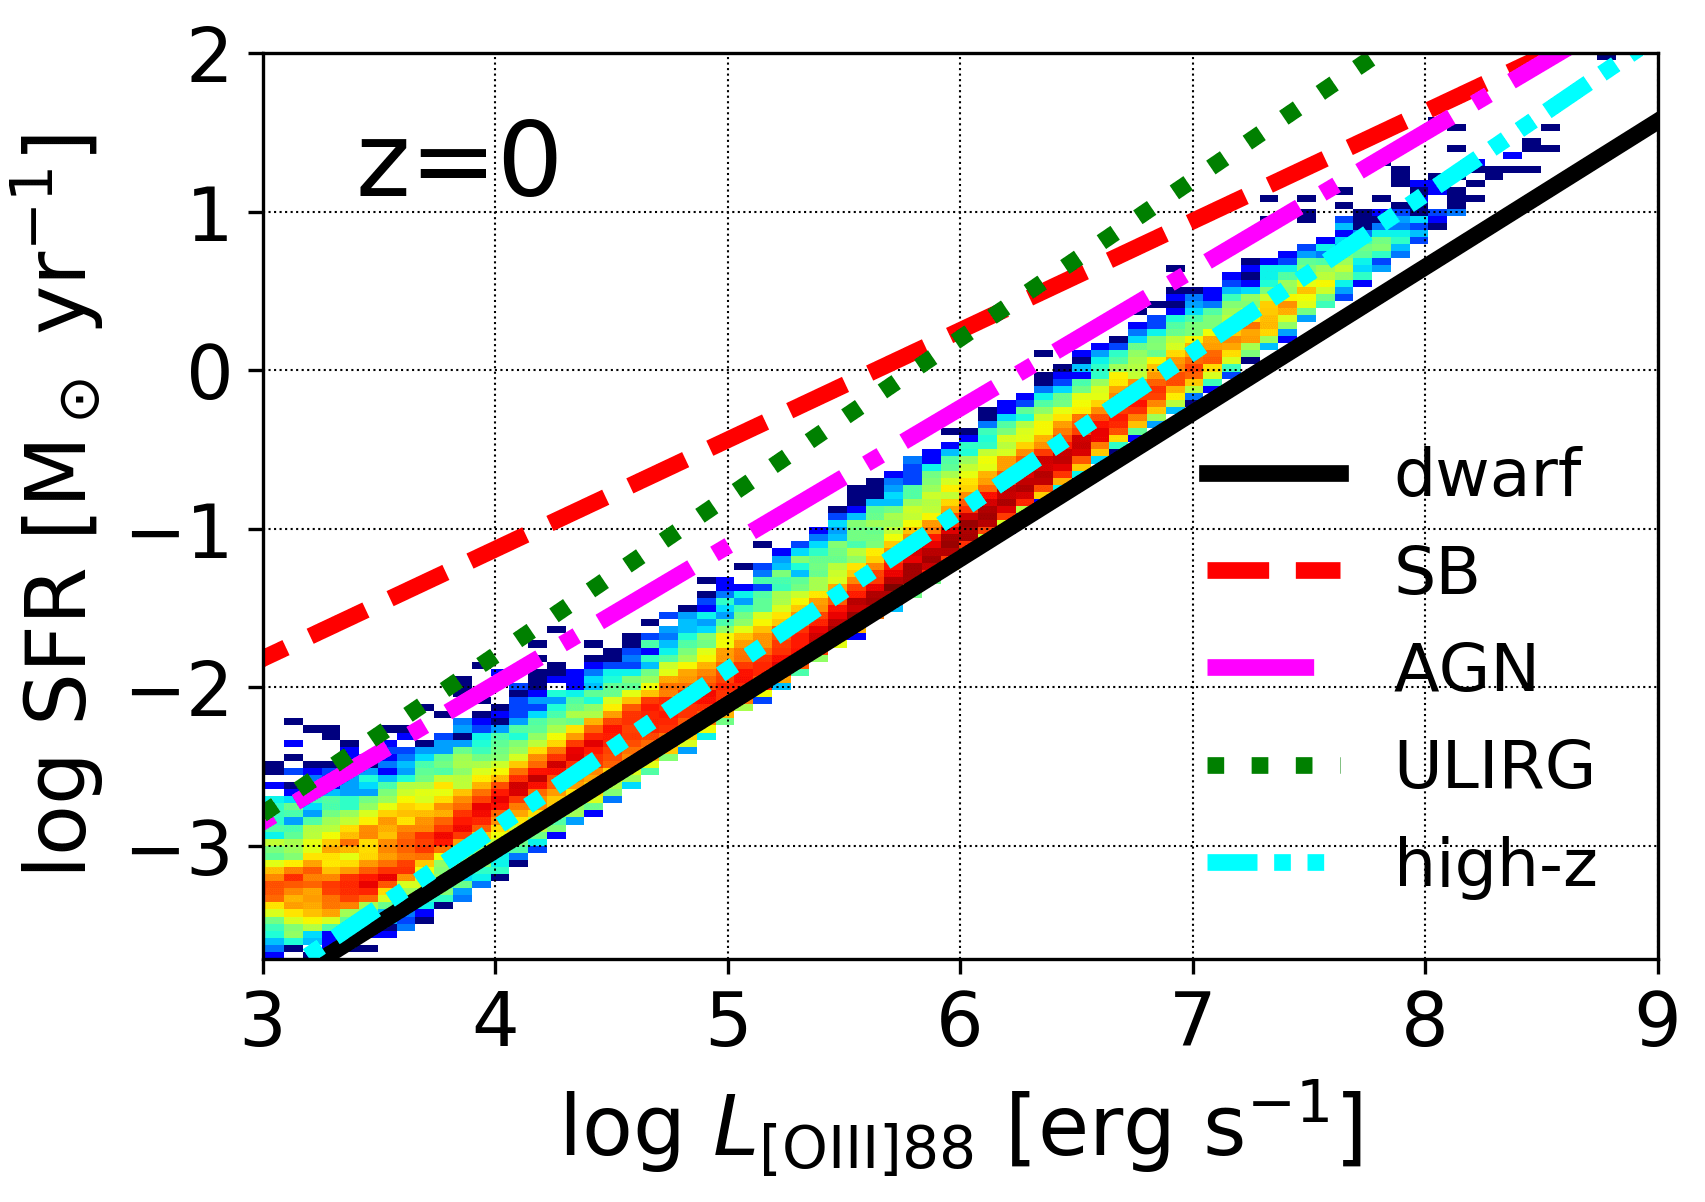
Fig. 3 is the same as Fig. 2 but for luminosities of [O instead of H. Our result is in agreement with observations of De Looze et al. (2014) for dwarf and high-redshift galaxies although the distribution of the simulated galaxies appears to be slightly below the observed relation for AGNs and also below the relations for star-burst and ultraluminous infrared galaxies. The correlation of the modelled [O and SFR little depends on or evolves with redshift . We find no systematic differences of the correlation in Fig. 3 between the star-forming and quiescent galaxies or between BHs in the high- and low-accretion modes. We find essentially the same result with Illustris.
4 Results
We show our results for IllustrisTNG in Section 4.1. First, in Section 4.1.1, we address characteristic features of the inside-out quenching processes caused by massive BHs in the simulation, i.e. depletion of central gas by the kinematic feedback. Next, in Section 4.1.2, we show how the modelled [O] emission reflects the gas distribution affected by the BH quenching. In Section 4.2, we follow the same course but show the results for Illustris.
4.1 IllustrisTNG
4.1.1 Influence of the BH feedback in star-forming galaxies
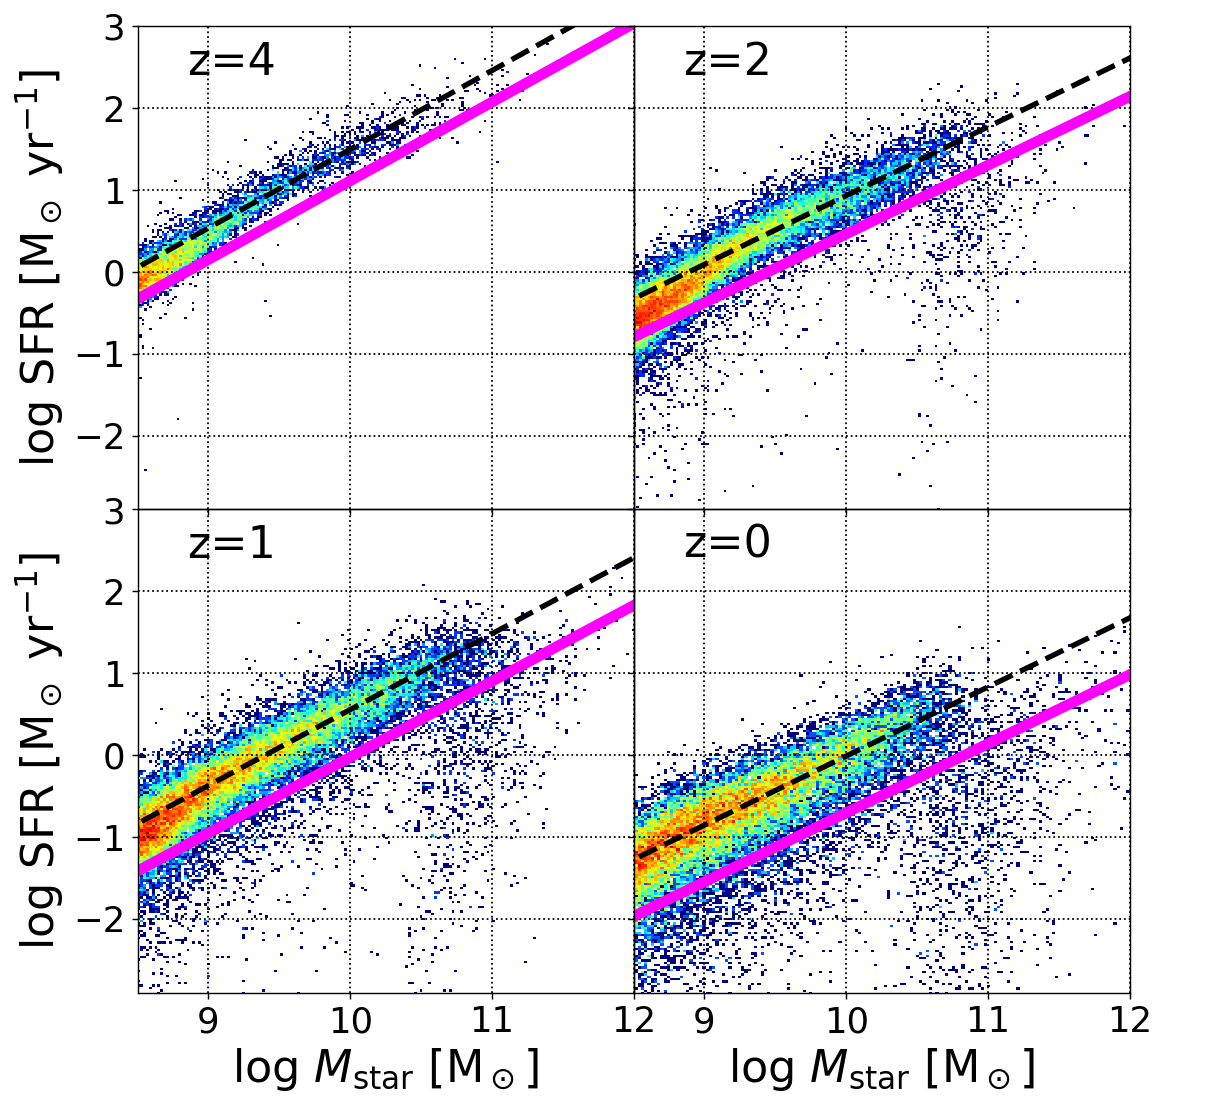
To sample star-forming galaxies from the simulation data, we define a star-formation main sequence (SFMS: correlation between the total stellar masses and SFRs) in each snapshot. We use a method proposed by Donnari et al. (2019) to both simulations, describe the method in Appendix A. Fig. 4 illustrates the distribution of and SFRs of galaxies in IllustrisTNG, and the black dashed line delineates the SFMS defined at each redshift. The magenta solid line is the boundary between star-forming and quiescent galaxies, and this study samples those above the boundary as star-forming galaxies.
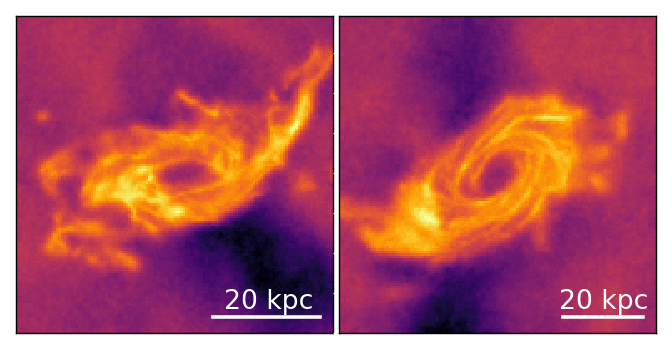
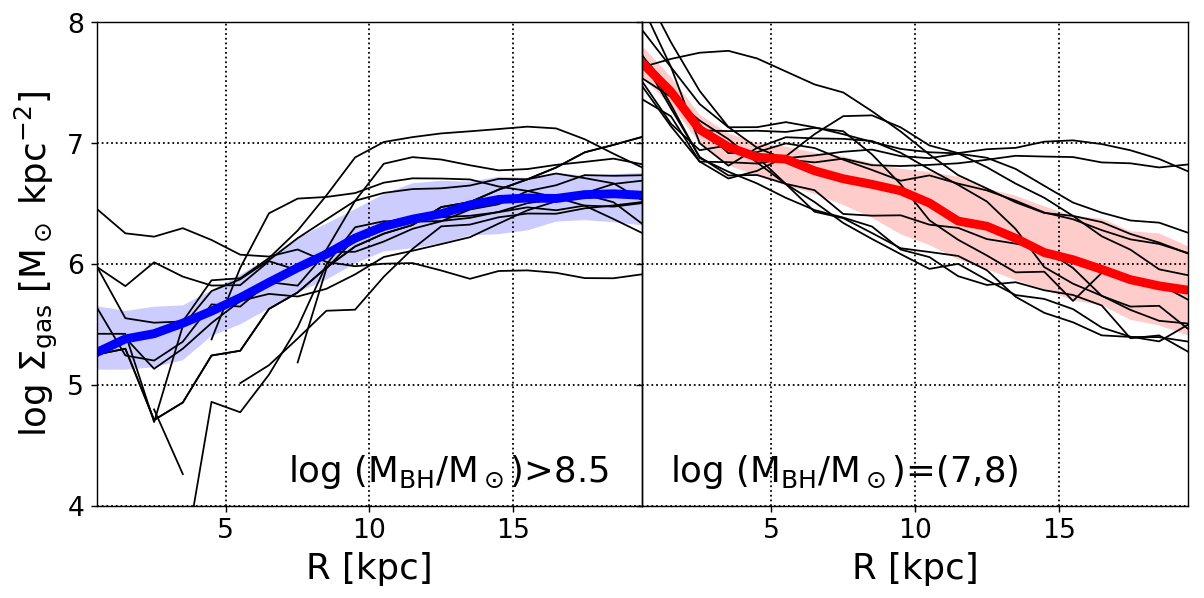
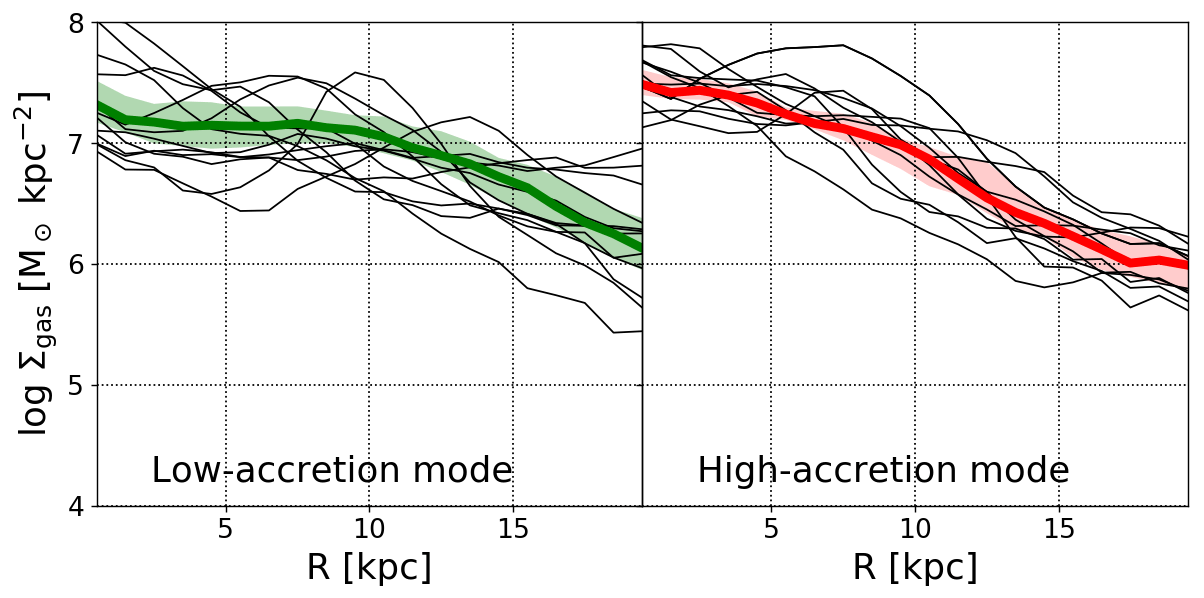
Fig. 5 exemplifies two star-forming galaxies in IllustrisTNG at redshift . Both have BHs more massive than and high SFRs. With molecular gas modelling of Inoue et al. (2020), these galaxies are found to be the first and eighth brightest galaxies in CO(1-0) emission in TNG100-1. These galaxies have ‘cavities’ in their gas distributions at the galactic centres (see also Terrazas et al., 2020). Fig. 6 indicates gas surface density distributions , which are the face-on radial profiles stacked among 128 galaxies randomly selected in the ranges of (left panel) and (right panel). The galaxies with massive BHs show decreasing towards their galactic centres, whereas those with less massive BHs have nearly exponential profiles in which is generally the highest at the centre. Nelson et al. (2019) have also shown that massive galaxies with indicate SFRs decreasing in their central regions in the TNG50 simulation (see also Donnari et al., 2021). Thus, central gas densities can be significantly affected by the feedback of massive BHs in star-forming galaxies in TNG. Such characteristic features may be consistent with observations of green-valley galaxies (see Section 5.2).
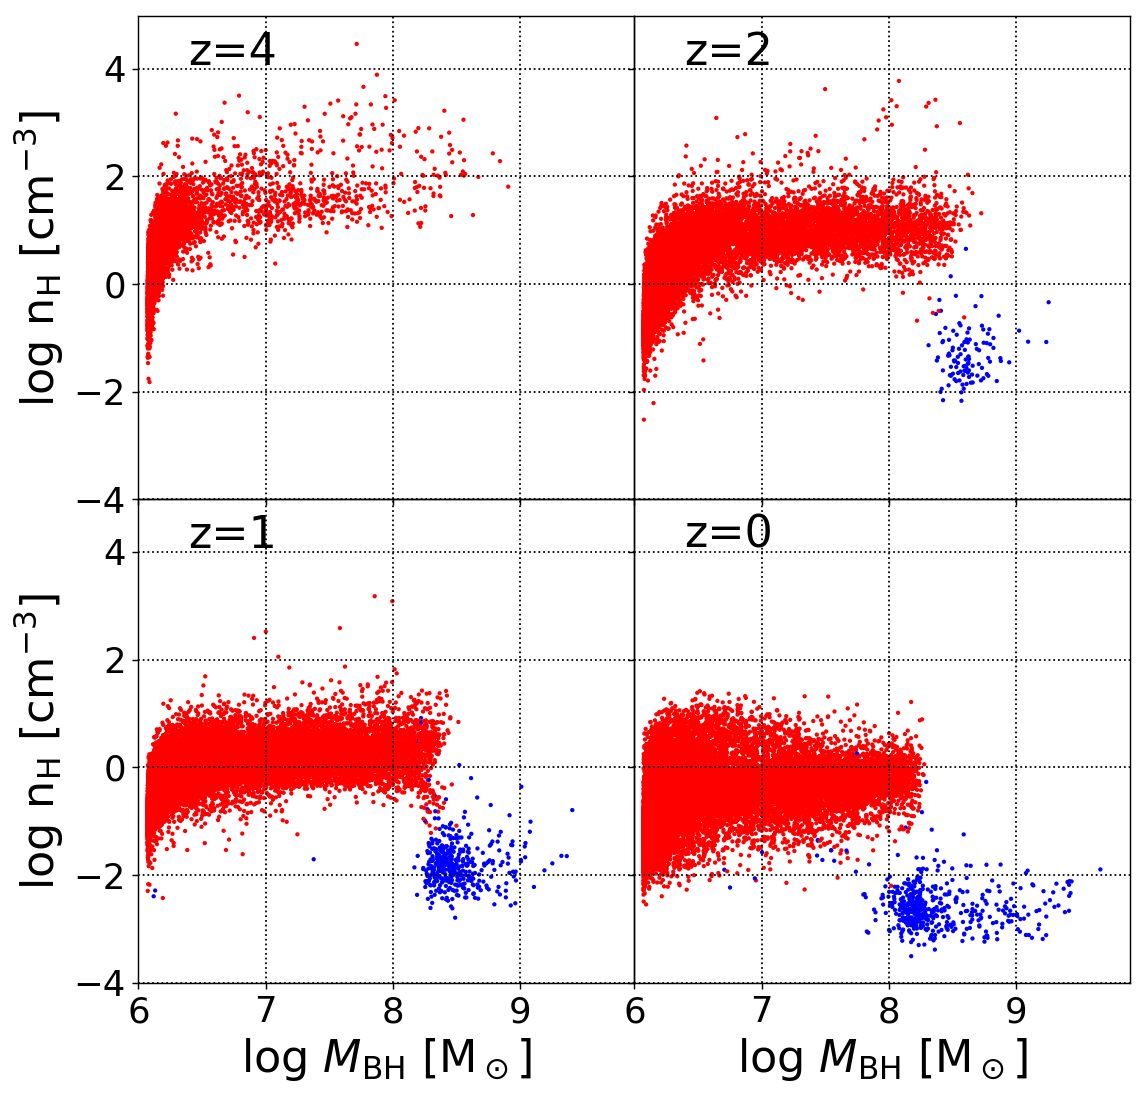
Fig. 7 shows relationship between and gas densities around the BHs for the star-forming galaxies in IllustrisTNG. The densities around BHs abruptly decrease at , which is consistent with the presence of the cavities shown in Fig. 5 and the left panel of Fig. 6. In Fig. 7, the red and blue dots correspond to galaxies whose BHs are in the high- and low-accretion modes, and most of the massive BHs in the low-accretion mode (blue dots) are surrounded by low-density gas. Hence, the depletion of the central gas is caused by the kinetic feedback of the low-accretion mode in TNG, rather than other mechanisms such as stellar feedback and consumption of gas by star formation.
Previous studies using the IllustrisTNG simulation have also shown similar results. Terrazas et al. (2020) show the averaged gas densities within galaxies to significantly decrease in those with at since energies injected by the kinetic feedback of the low-accretion mode exceed binding energies in the galaxies. They propose, therefore, that galaxies whose BHs reach the critical are suddenly quenched and abruptly decrease their specific SFRs (see also Weinberger et al., 2018). Weinberger et al. (2017) show that the critical BH mass at which the feedback modes are switched is –, does not significantly vary with redshift in the case of the fiducial settings of IllustrisTNG888In TNG100-1, no BHs are in the low-accretion mode in redshifts . Therefore, the redshift-dependence of the critical is unclear above .. However, Terrazas et al. (2020) perform similar simulations but with different parameter settings and feedback models, demonstrate that the critical depends on the BH models and parameters therein.
4.1.2 The line ratios and black hole masses
Our result suggests that, if we observe the [O lines from the simulated galaxies in TNG, the large difference of the central gas densities between galaxies whose are are higher and lower than the critical can be inferred. To model the [O line emission, we adopt our method described in Section 3 to snapshots of TNG at redshifts , , and .
|
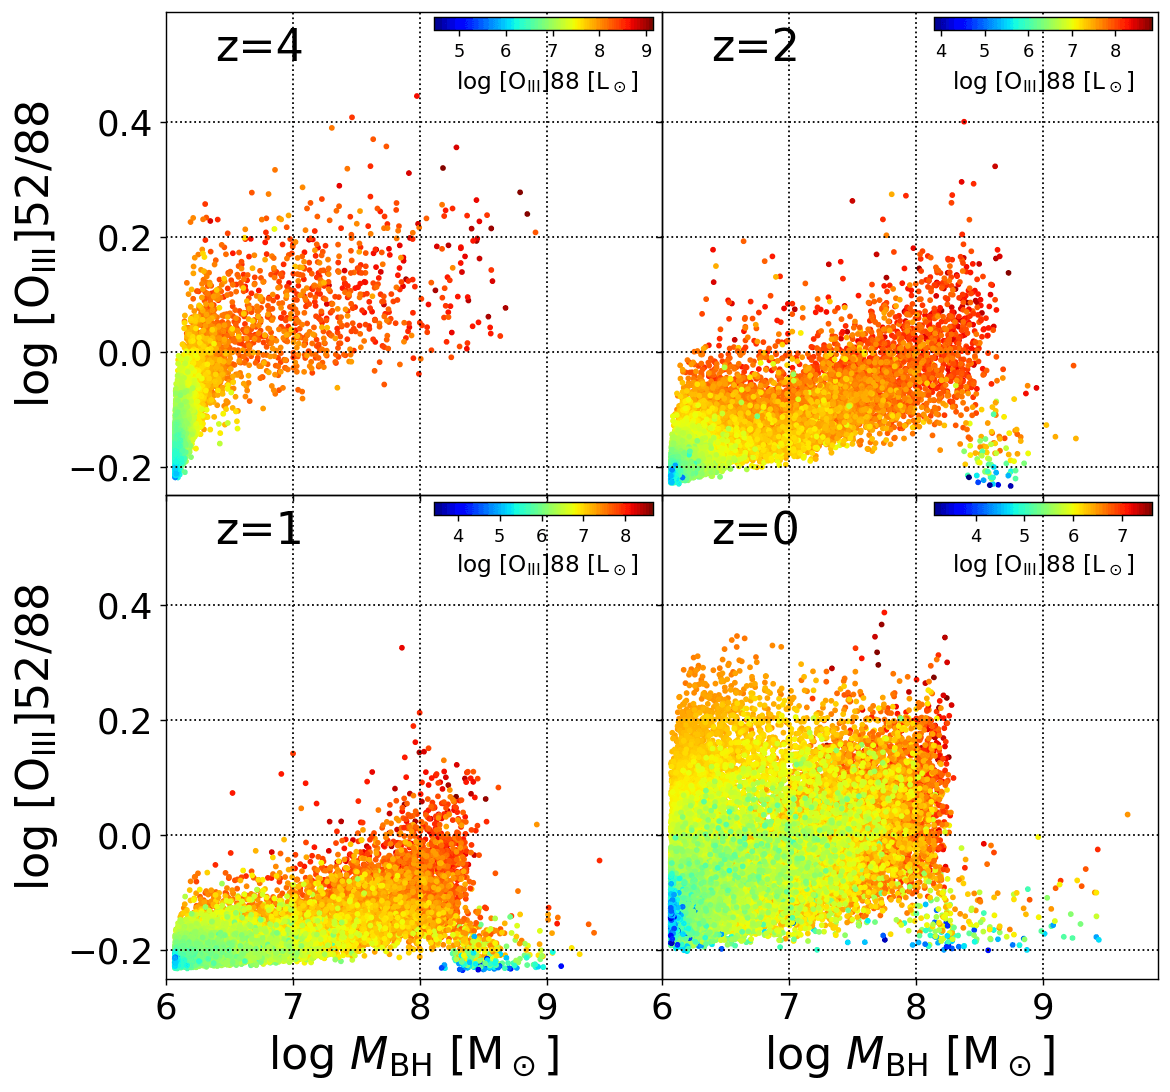
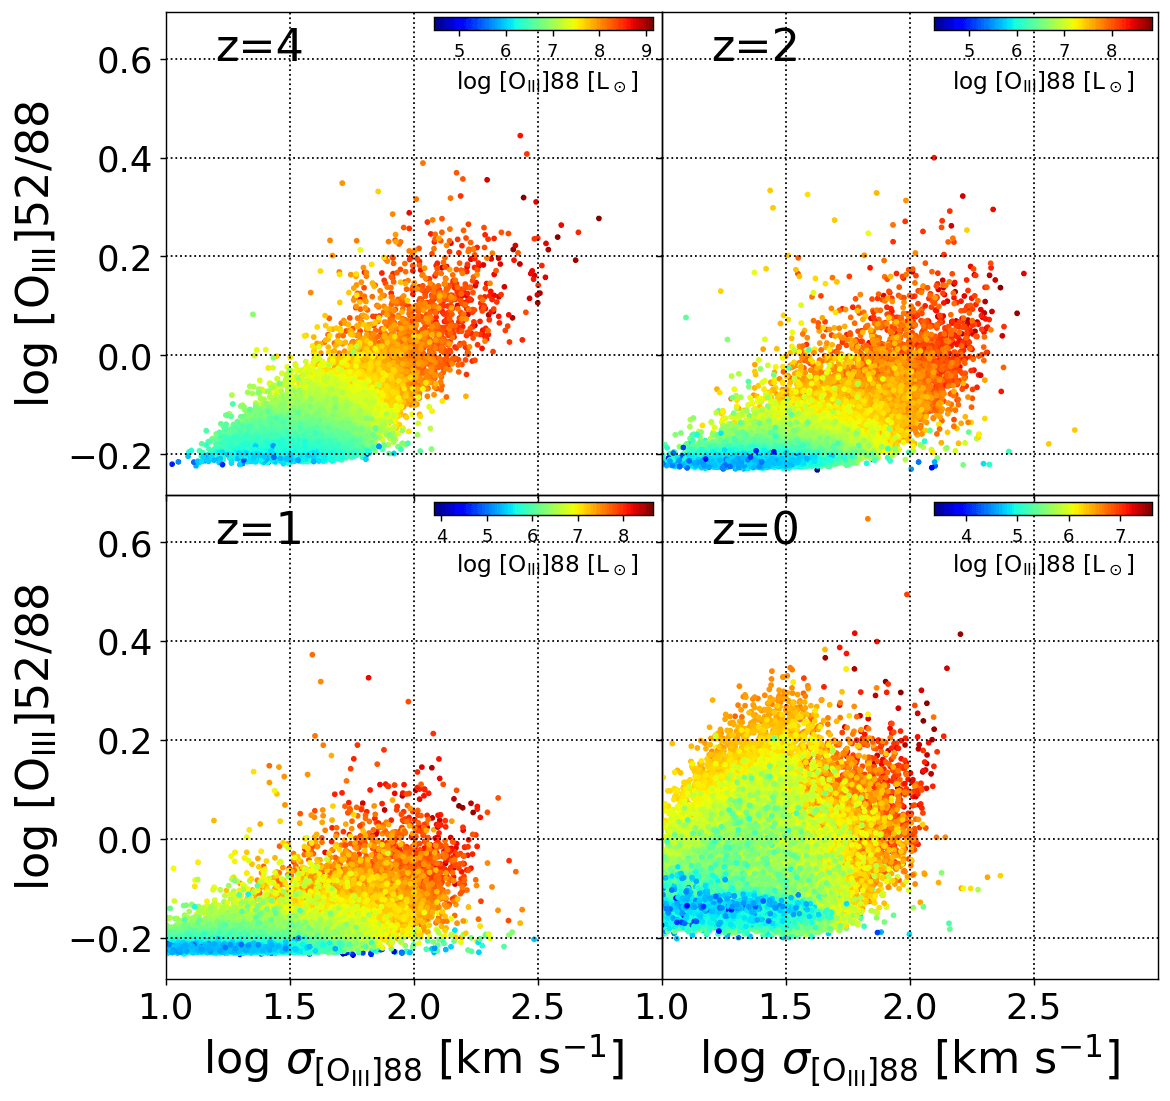
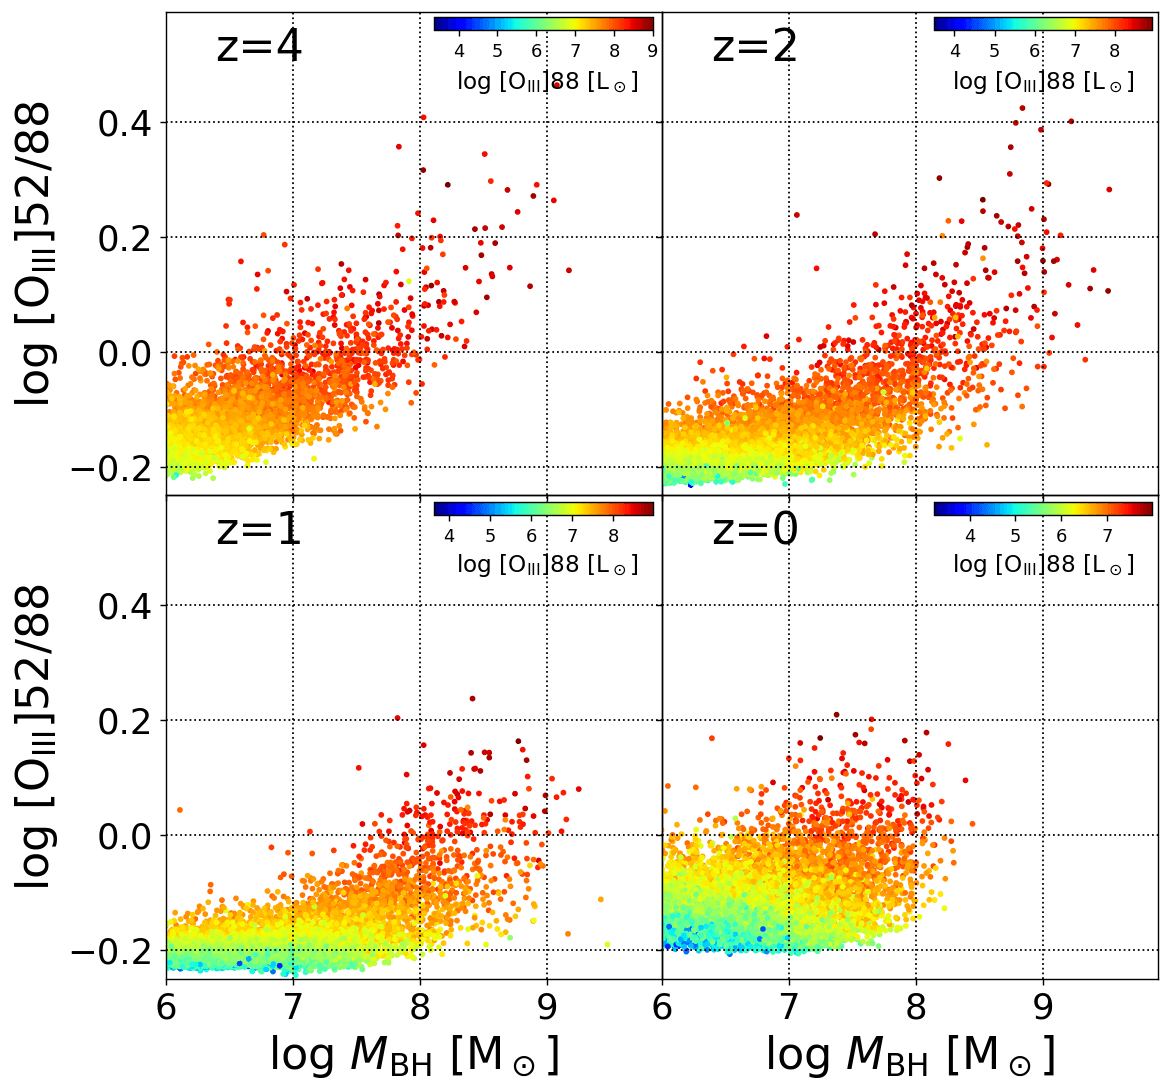
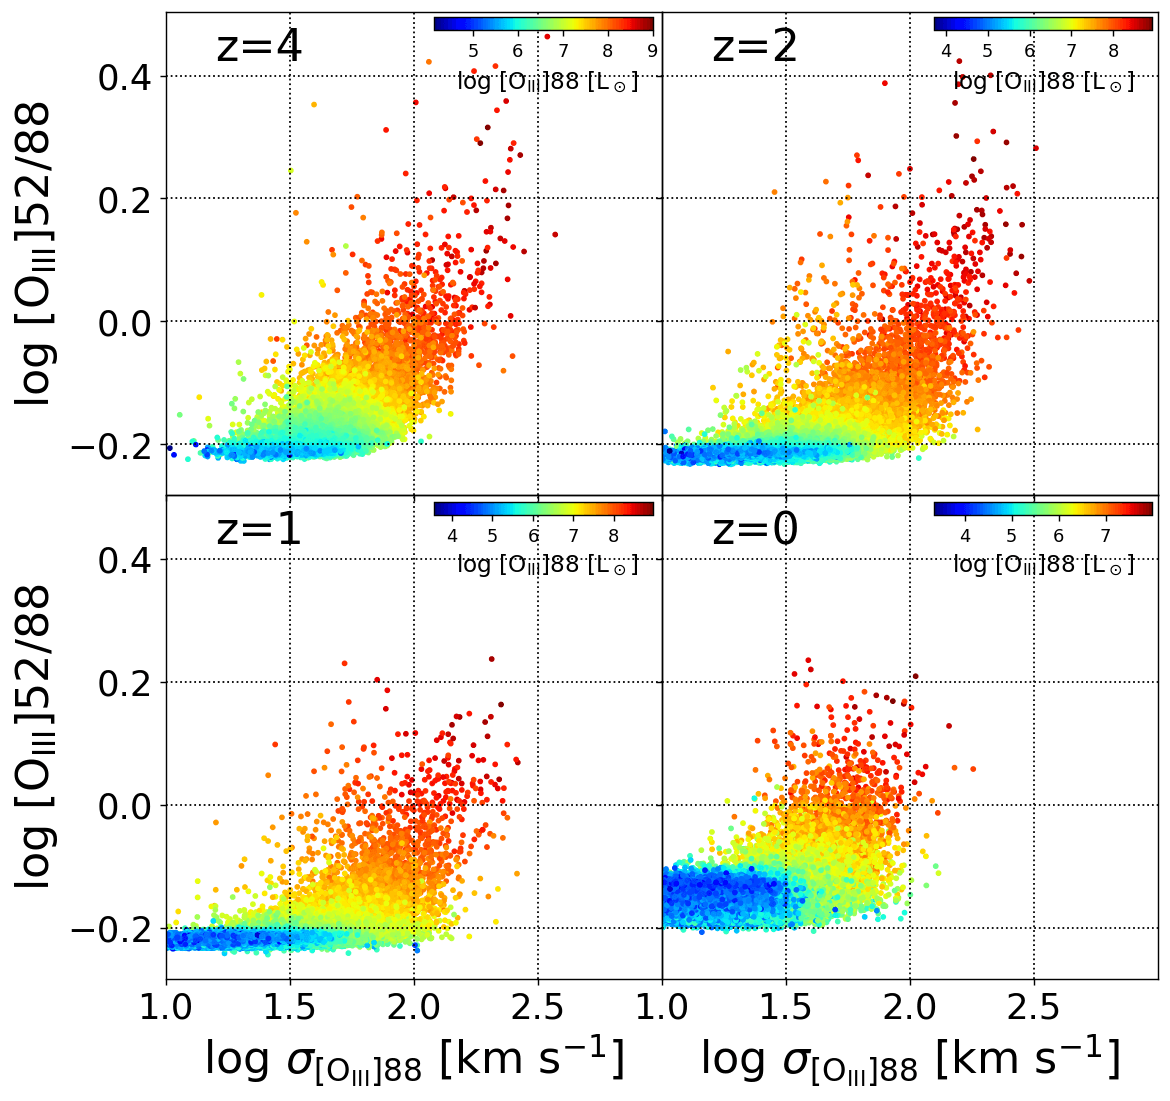
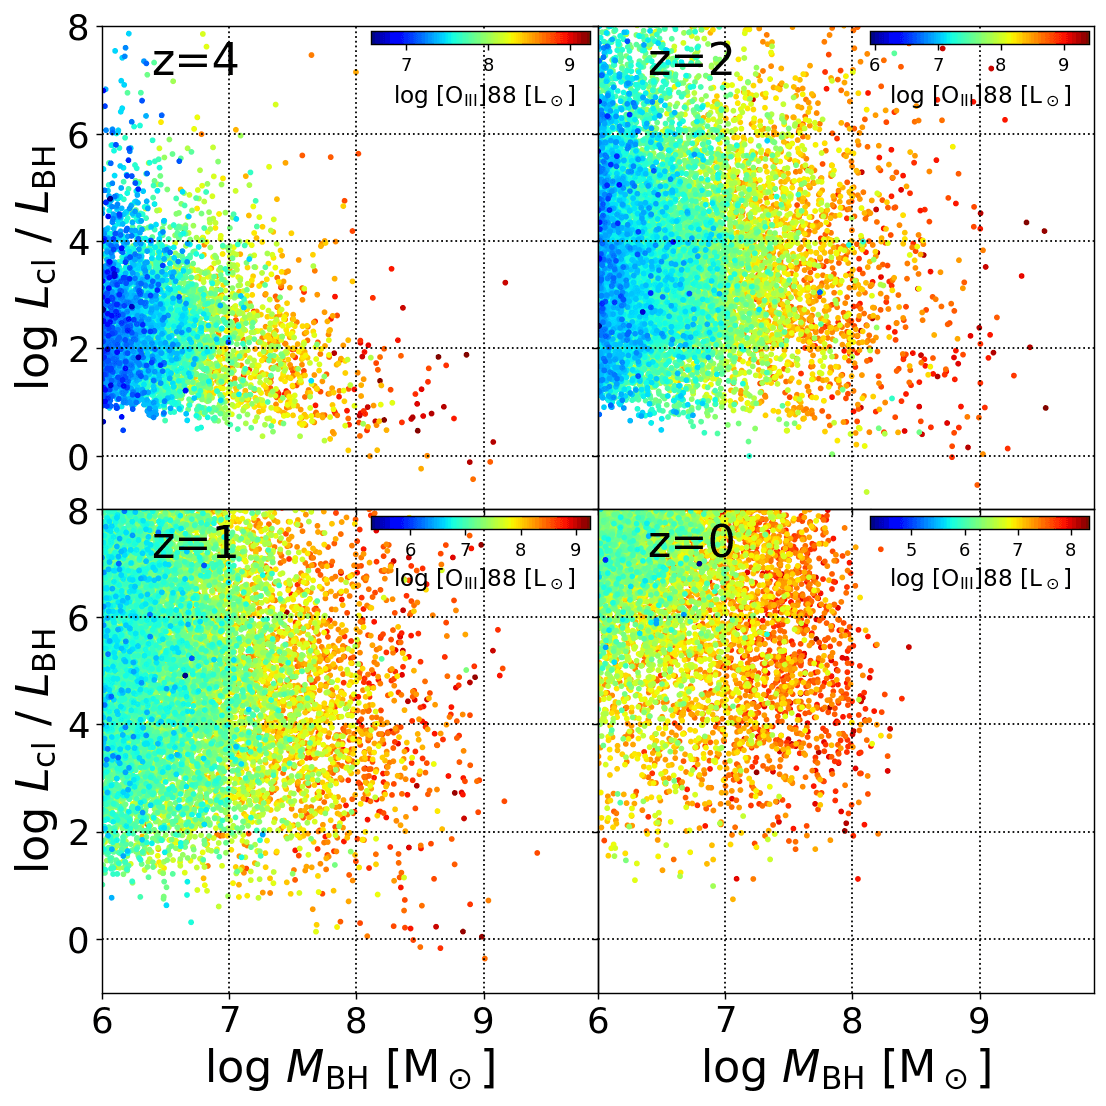
Fig. 8 shows our results of modelled line ratios of [O as functions of for the star-forming galaxies in IllustrisTNG. In the left set of four panels, the [O ratios are measured within two-dimensional apertures of centred on their BHs, where line-of-sight orientations of the galaxies are at random. The colours of the dots indicate unattenuated luminosities of [O integrated within the apertures. In TNG, no BHs are in the low-accretion mode at high redshifts (see Fig. 7). At redshift , [O appears to increase with although the scatter is large, which means that more massive BHs are embedded within gas with higher densities. The higher gas densities around more massive BHs are also reflected in stronger emission of [O which indicates higher SFRs within the apertures. In the following snapshots at , and , similar trends are only seen for galaxies hosting less massive BHs with . It is noteworthy that the line ratios of [O suddenly decrease at , and the [O luminosities within the 3-kpc aperture are weak in the galaxies with . In comparing Figs. 8 with 7, it is obvious that the drop of [O at coincides with the transition from the high- to low-accretion modes of the BH feedback in TNG. Namely, the drop of [O reflects the depletion of central gas densities by the kinematic feedback of massive BHs: the early phase of the inside-out quenching.
The right set of panels of Fig. 8 shows [O measured within apertures covering the whole galaxies, and the ratios are not significantly different from those measured within the 3-kpc apertures. This is because, for galaxies with , their SFR distributions are compact, and their central regions inside are therefore dominant in their [O] emission. For galaxies with , on the other hand, their central gas densities are significantly lowered by the kinematic feedback, and therefore mainly their outer regions contribute to the total SFRs and [O] emission. However, such outer gas is not dense enough to raise the integrated [O. It can be deduced from the result that the galaxy-integrated [O is high in the galaxies with massive BHs of , unlike in the case of the 3-kpc apertures. Thus, from the above result, we predict that the abrupt decrease of [O is observed at the critical BH mass of if the BH model implemented in IllustrisTNG is accurate. In addition, the similarity between [O measured within the 3-kpc and galaxy-integrated apertures means that observations for the line ratios do not need to resolve the central regions of galaxies (although see below).
Although BH masses have been measured in a substantial number of galaxies, determinations of basically require different observations independent from measurements for the [O] lines. It has been known that correlates with stellar velocity dispersions (VDs) of spheroidal components of galaxies: the – relation (e.g. Ferrarese & Merritt, 2000; Gebhardt et al., 2000; Marziani & Sulentic, 2012, and references therein). This implies that more massive BHs generally reside in more massive galaxies although there are scatters to some extent in the correlation. It may be expected that the large masses of galaxies can enlarge not only stellar VDs but also gaseous ones. We compute the second-moment of [O emission as
| (6) |
where and are [O luminosity and line-of-sight velocity of a single gas cell, and the integrals in the denominator and numerator cumulate gas cells within the observational apertures. The mean velocity is measured within the aperture: . We consider that equation (6) corresponds to a VD weighted by [O luminosity.
|
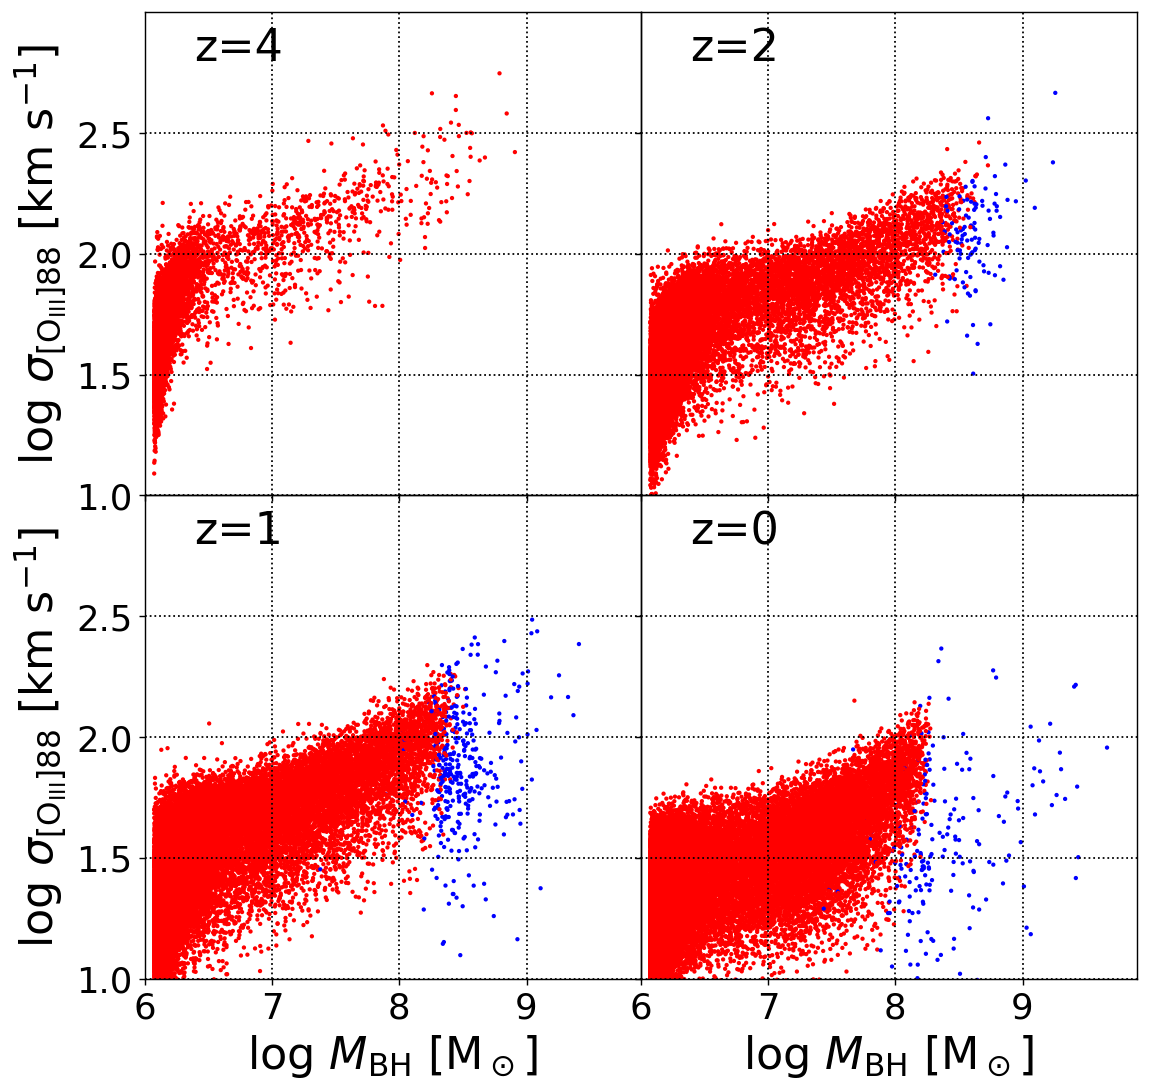
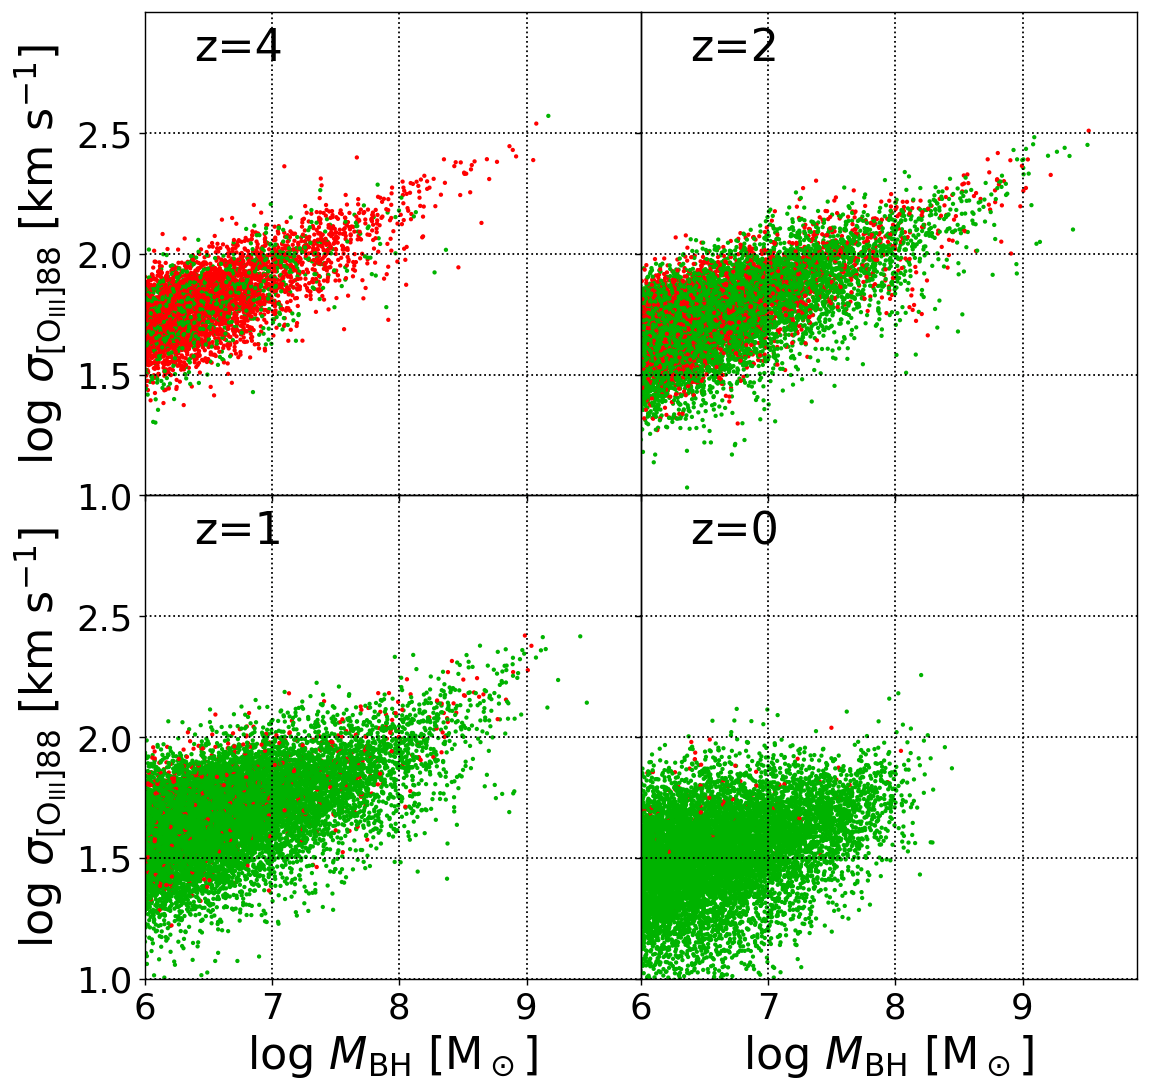
Fig. 9 shows the distribution of and in IllustrisTNG. In the case of the 3-kpc apertures (the left set of panels), although the galaxies in the high-accretion mode (the red dots) indicate the correlation between their and , those in the low-accretion mode (the blue dots) have significantly lower than the extrapolation of the correlation. In the case of the galaxy-integrated apertures (the right set of panels), on the other hand, appears to correlate with regardless of the BH feedback modes. We infer that BHs in the kinematic mode blow out gas around the galactic centres to outer regions and would significantly reduce dynamical masses inside the 3-kpc apertures. Hence, virialised VDs inside result in low values at a given above the critical mass . The galaxy-integrated apertures capture all gas belonging to the galaxies although would be biased to high-SFR regions. Since BH masses are thought to correlate with the total masses of the galaxies, the galaxy-integrated reflecting the total mass still holds the correlation. From this result, we expect that can be replaced with if the galaxy-integrated apertures are applied.
|
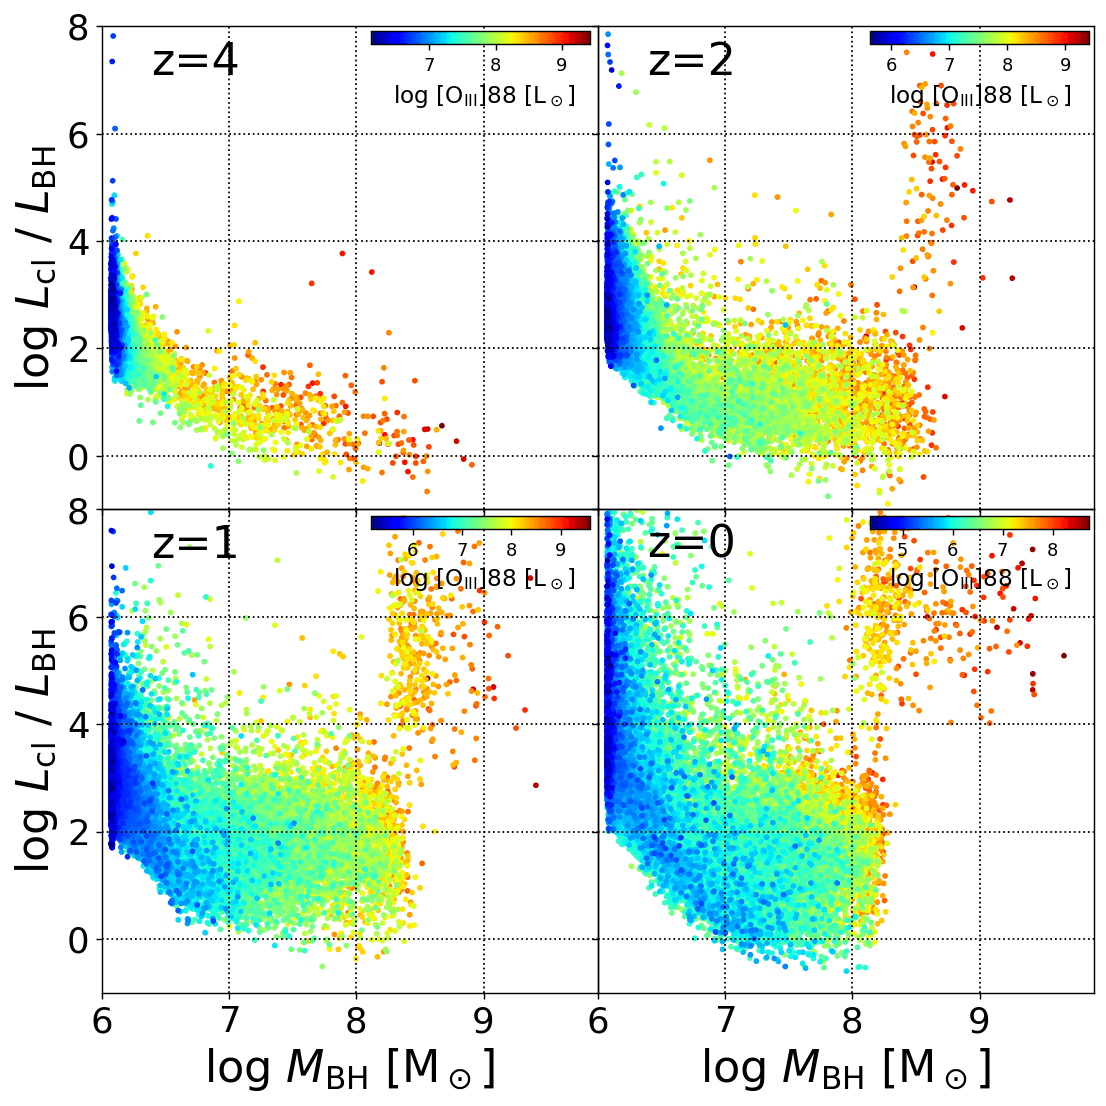
Fig. 10 shows the line ratios of [O as functions of for IllustrisTNG. As we expect above, since does not correlate with above the critical BH mass in the case of the 3-kpc apertures, the drop of [O is not clearly seen in the left set of panels. On the other hand, in the case of the galaxy-integrated apertures, the abrupt decrease of [O is still apparent at although it is less clear than in Fig. 8. Thus, if we use observational apertures large enough to cover nearly the entire regions of galaxies, we may be able to use the second-moment of [O instead of in searching for the drop of [O. These two quantities can be obtained from the same spectroscopic observations.
4.2 Illustris
As we mention in Section 2.1, the Illustris simulation is largely different from TNG in the low-accretion mode of the BH feedback. Instead of the kinematic feedback in TNG, Illustris adopts the thermal feedback designed to reproduce AGN bubbles to the BHs whose Eddington ratios are below the constant criterion (see Section 2.1). Therefore, the expected line ratios can differ between the two simulations, and their comparison may give us clues to constrain BH models and their parameters.
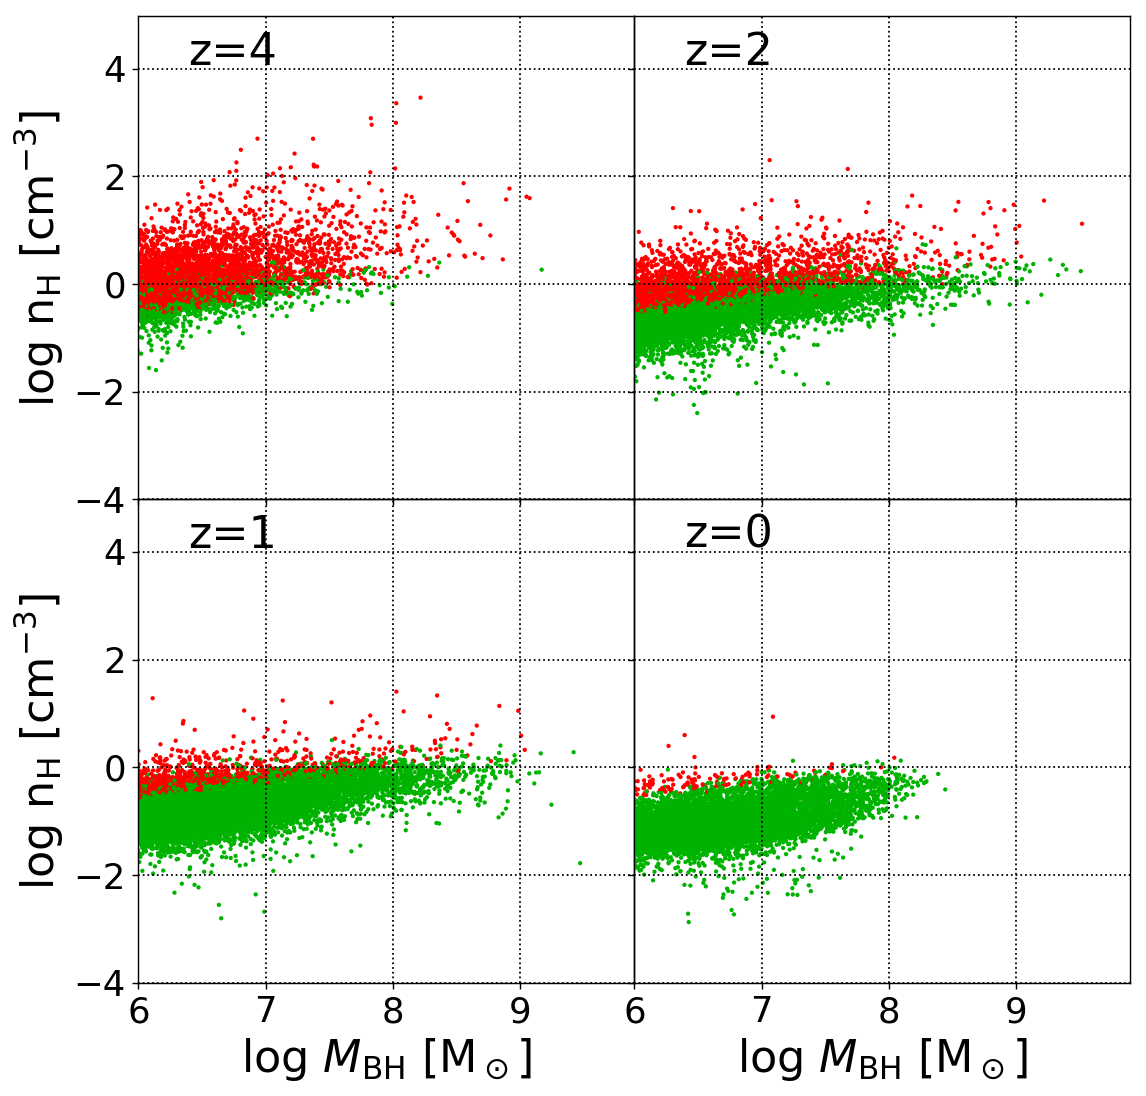
As is done for TNG in Section 4.1.1, we extract star-forming galaxies distributing along the SFMS in each snapshot and show the SFMSs in Appendix A. For the star-forming galaxies, Fig. 11 shows the relationships between and gas densities around the BHs. In contrast with TNG (Fig. 7), the gas densities around BHs little change and weakly increase with in Illustris, and the transition of BH feedback between the high- and low-accretion modes does not appear to significantly affect the gas densities. In addition, there is not a characteristic value of to switch the feedback modes in Illustris. Unlike in TNG, no galaxies have BHs with at redshift in Illustris. This is because galaxies hosting such massive BHs are quenched after and drop off from the SFMS (see Fig. 16). They are no longer classified as star-forming galaxies and excluded from our analysis. This behaviour is also due to the different feedback model for the low-accretion mode in Illustris.
Fig. 12 shows face-on radial profiles of of the star-forming galaxies with at , where the left and right panels illustrate those of galaxies in the low- and high-accretion modes. The stacked profiles are similar between galaxies in the low- and high-accretion modes although those in the low-accretion mode have slightly lower in their central regions. Note that the sample selection in Fig. 12 is different from that in Fig. 6. However, these selections are essentially consistent since all BHs with and few BHs with are in the low-accretion mode in Fig. 6. The influence of the BH feedback on the central gas densities is thus largely different between TNG and Illustris because of their different modellings for the feedback, especially the low-accretion modes and the switching criteria . As shown above, the low-accretion mode in the Illustris simulation is not influential on gas distribution.
|
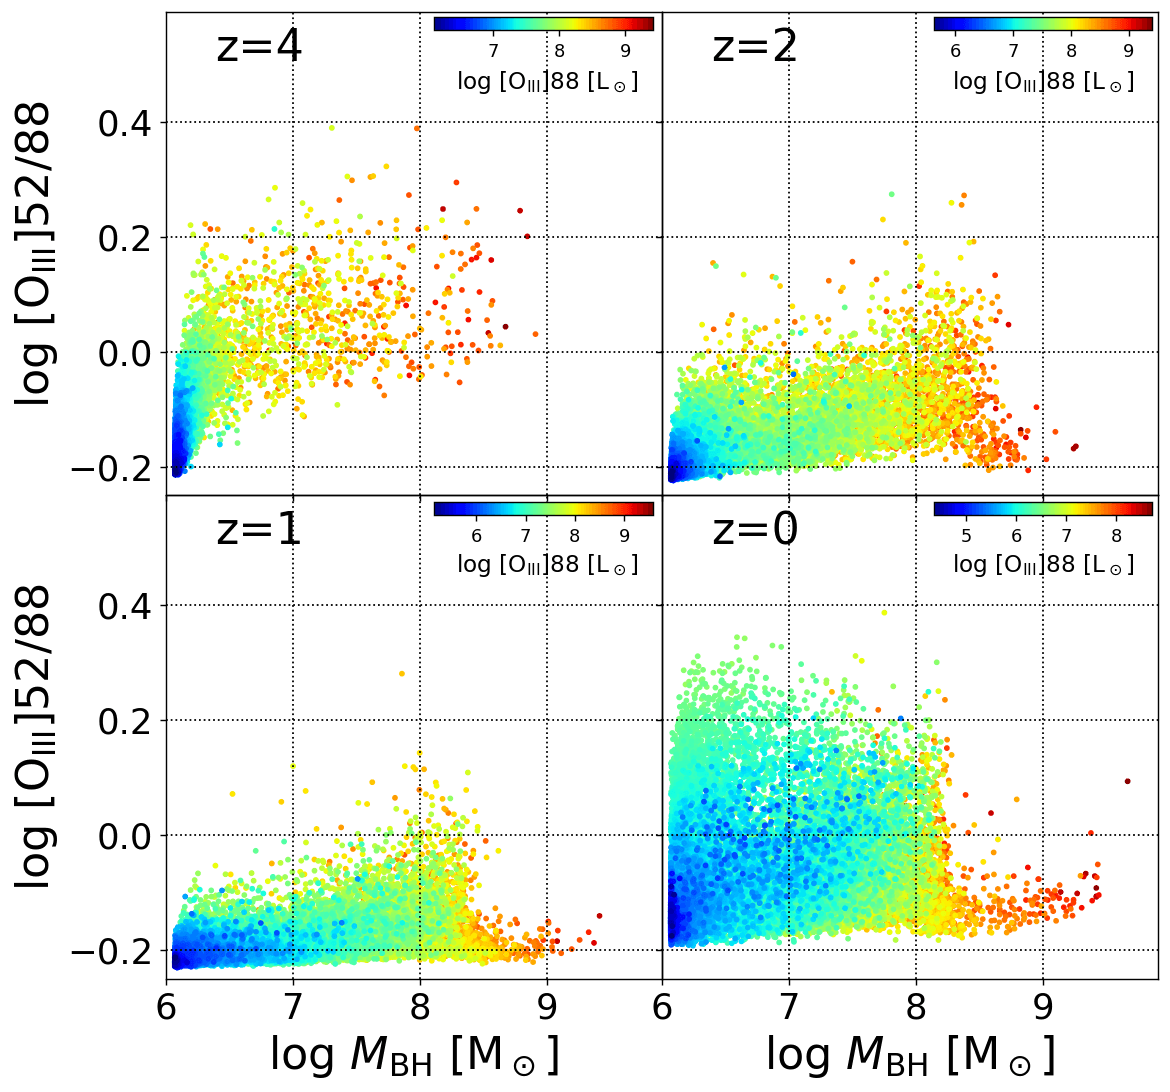
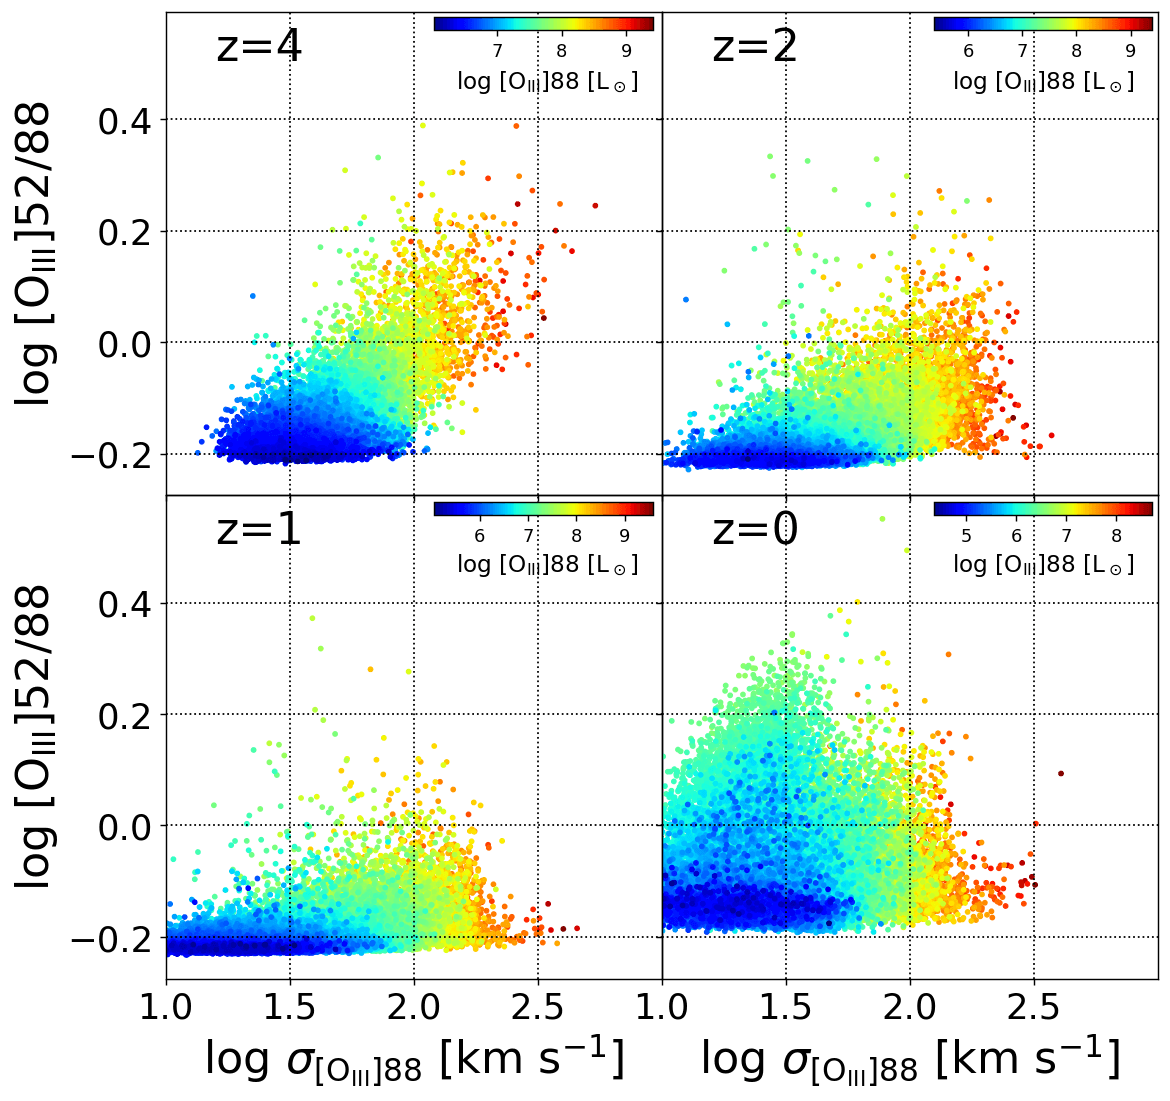
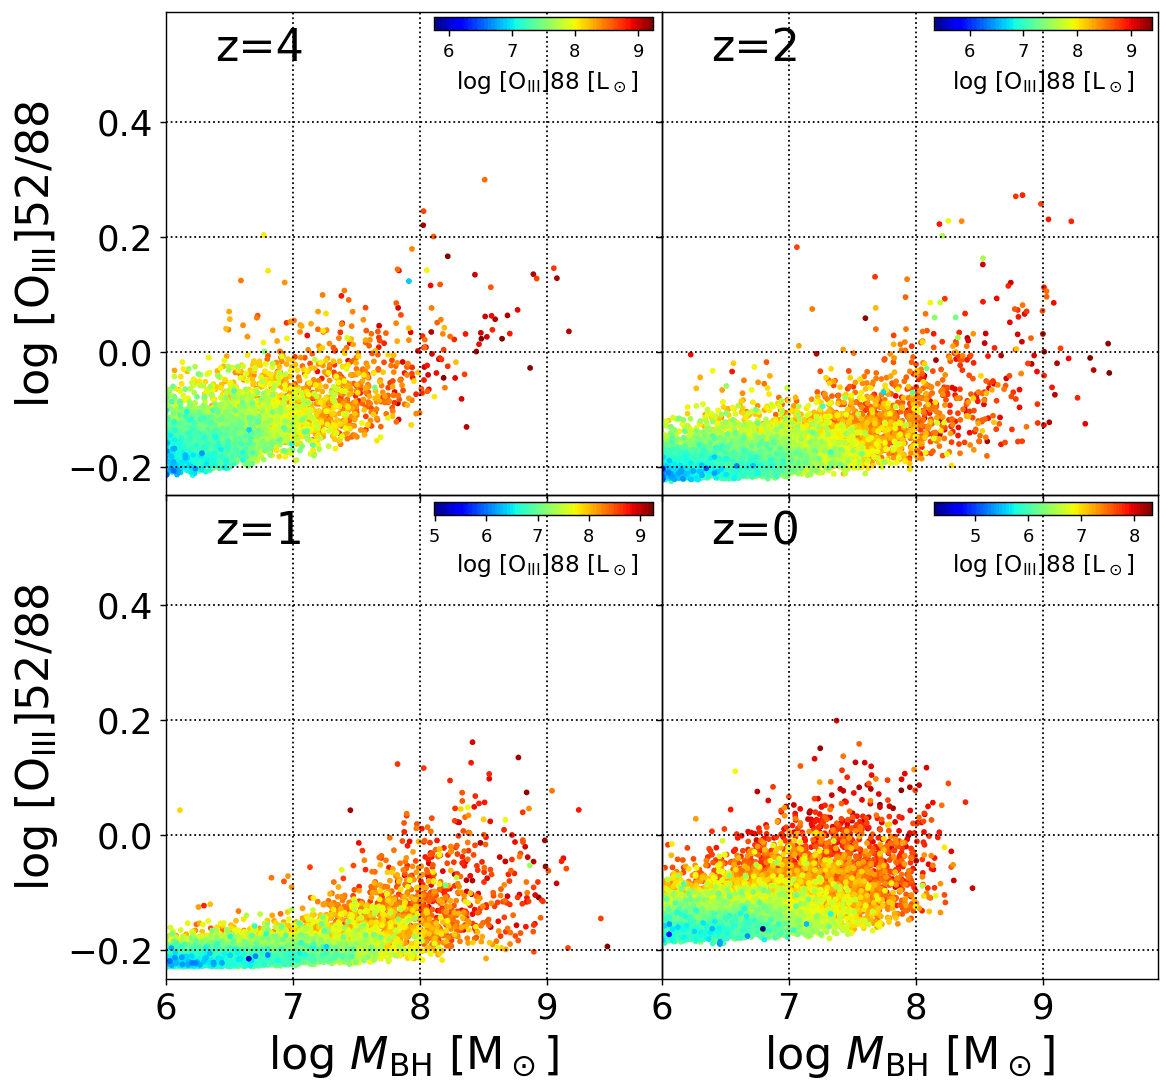
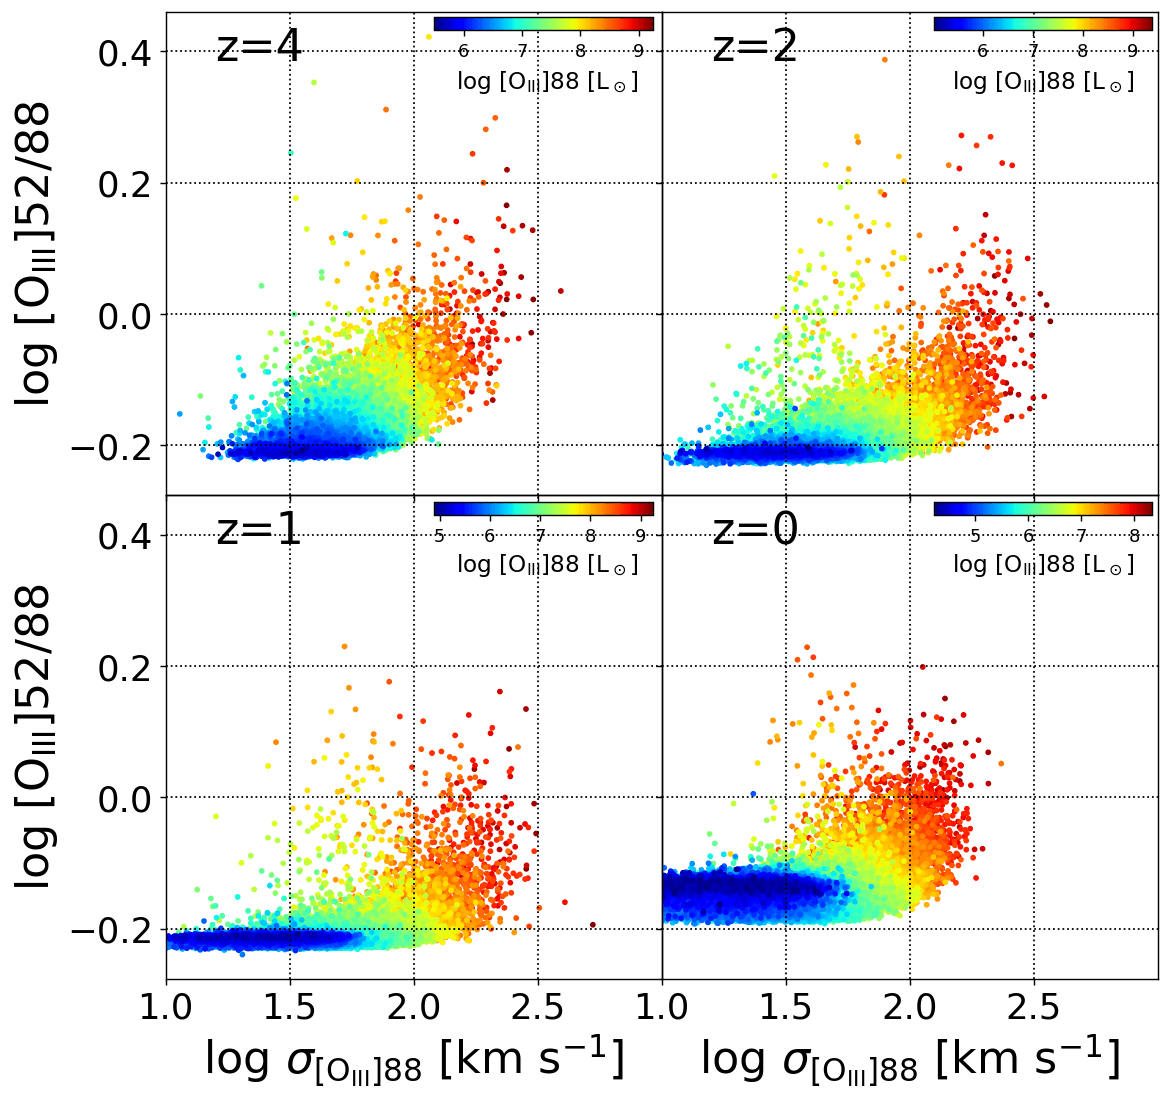
Fig. 13 shows the relationship between and [O for the star-forming galaxies in Illustris. As expected from Figs. 11 and 12, there is no clear drop of [O at any , and the line ratios continuously increase with although the scatters are large as well as in TNG. The galaxy-integrated values (right) of [O are not significantly different from those measured within the 3-kpc apertures (left). Thus, we predict that abrupt decrease of [O is not observed at any if the BH model of Illustris is accurate. Accordingly, the difference of the BH models in the simulations, especially the low-accretion modes of the feedback, is expected to significantly impact the line ratios of [O measured in star-forming galaxies hosting massive BHs. From these results, we propose that observations for [O can constrain the BH models implemented in simulations. As in the case of TNG (Fig. 8), the integrated [O does not significantly depend on aperture size. The reason can be deduced from Fig. 12; the averaged profiles of are approximately flat up to , and most of the [O] lines are emitted from gas with similar densities.
|
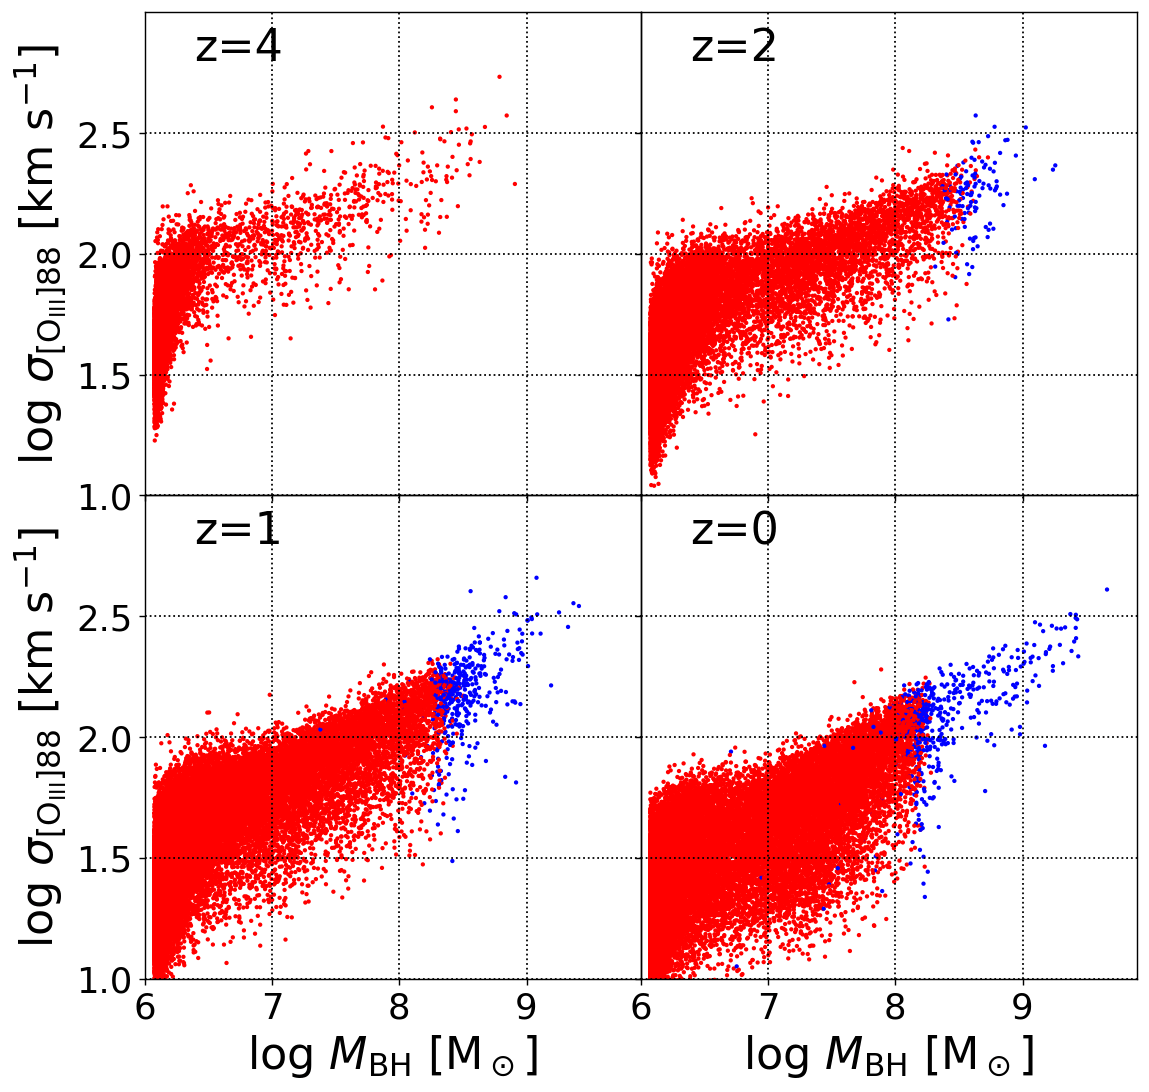
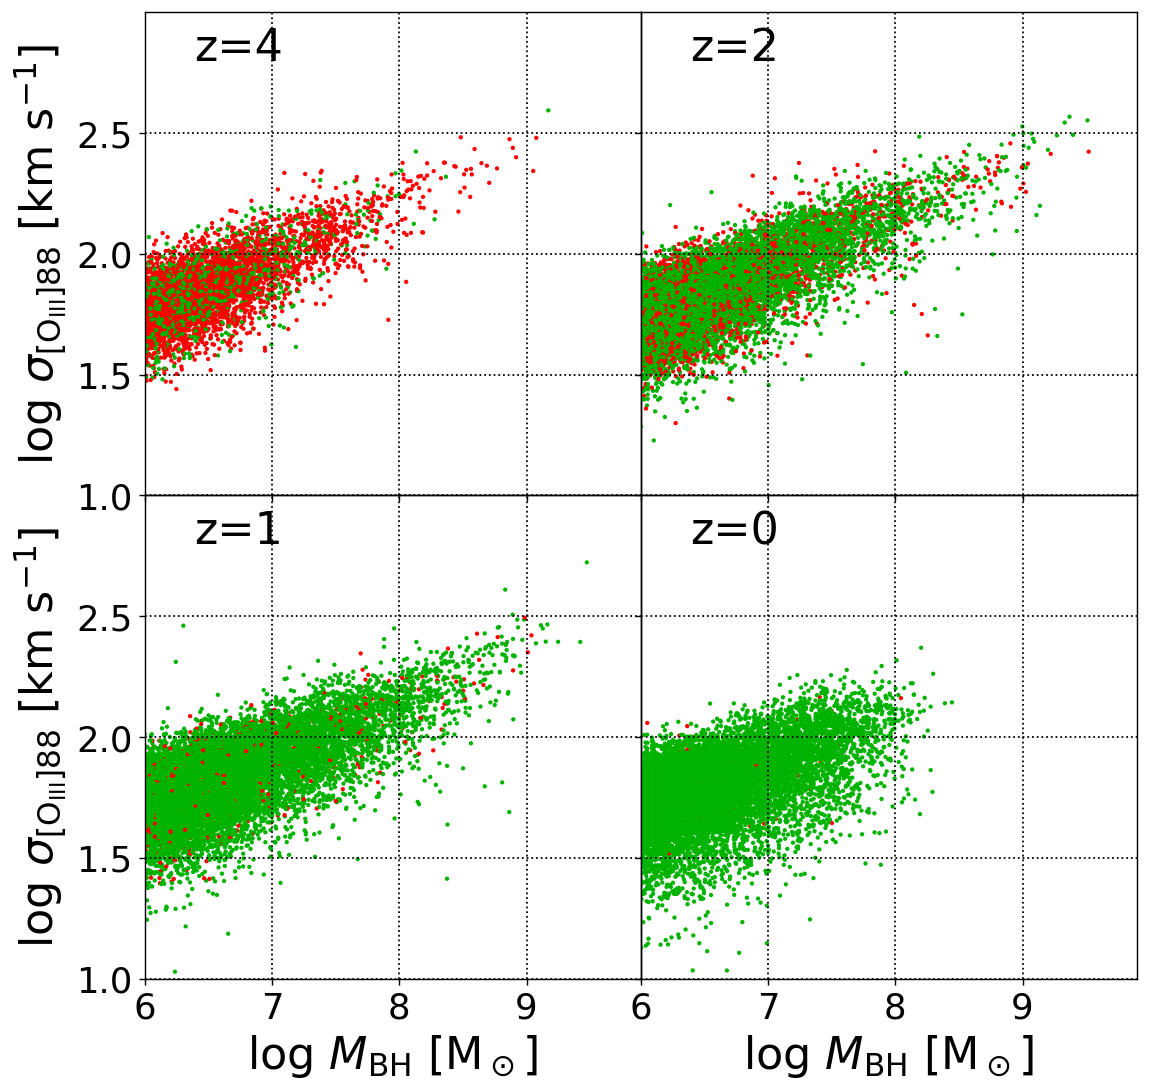
Fig. 14 shows the correlations between and for the star-forming galaxies in Illustris. In the distributions, there is no clear segregation between galaxies in the high- and low-accretion modes. In comparing the left and right panels, the values of hardly depend on aperture size although the VDs are slightly higher in the case of the galaxy-integrated apertures at redshift . The VDs weighted by [O are clearly correlated with although scatters are quite large at . It is noteworthy that, in the left set of panels, measured in the 3-kpc apertures also correlate with even in the range of in Illustris. This is clearly different from the result of TNG shown in Fig. 10 where the correlation disappears above the critical mass . It implies that measuring with small observational apertures for galaxies hosting massive BHs may be useful to study the impact of AGN on their central gas, and the absence of the correlation at high may be taken as a sign of the inside-out quenching.
|
Fig. 15 shows the relationship between and [O. Due to the correlations between and , Fig. 15 appears similar to Fig. 13, where the line ratios increase with the VDs without the drop of [O at any . Thus, if the BH feedback model of Illustris is accurate, measurements of can be replaced with those of . In comparing with the result of TNG (Fig. 10), the presence/absence of the abrupt drop of [O at is a noticeable difference that could be used to constrain theoretical models of BH feedback.
5 Discussion
5.1 Towards observational diagnosis of BH feedback
We have shown good correlation of with , but appears to be a better quantity to characterise the impact of the BH feedback on [O in star-forming galaxies. Suppose that we observationally measure [O of star-forming galaxies with various BH masses, and suppose that the BH masses are known. From our results for TNG discussed in Section 4.1, we can infer whether there is a characteristic value of to quench star formation around the galactic centres. If the BH feedback is suddenly ‘switched on’ to a highly efficient mode at a certain , and efficiently expels the gas from the central region in the manner implemented in TNG, [O is expected to drop abruptly at the BH mass as shown in Fig. 8. IllustrisTNG predicts the drop to occur at . However, if the efficiency of the BH feedback depends on properties other than , the variation of [O would not be clear and the line ratio may change gradually with . If the BH feedback is not efficient enough to drastically reduce the central gas density as in Illustris, [O would not decrease with . In fact, as shown in Fig. 13, Illustris predicts the line ratio to continuously increase with for the star-forming galaxies, although with large scatter. Based on the results, we expect that observations of galaxies at redshifts may allow us to make direct comparison with the simulations.
If we assume that the BH feedback expels the central gas as reproduced in IllustrisTNG, a low (high) line ratio of [O implies the presence (absence) of a BH massive enough to trigger quenching the star formation activity in the galaxy. Unfortunately, for this method to work in practice, one needs a prior knowledge on the characteristic for quenching and on weather is a primary quantity to cause the inside-out depletion of gas.
In IllustrisTNG, the critical value of varies little with redshift as shown in Figs .7 and 8 (see also Weinberger et al., 2017; Terrazas et al., 2020). At , the central BHs are still small in mass, and none of them is in the low-accretion modes in TNG. Massive BHs with have, however, been actually observed in galaxies at (Marziani & Sulentic, 2012, and references therein). It would be interesting to observe [O for such high-redshift galaxies hosting massive BHs. Low line ratios, if measured, are indicative of low gas densities in the galaxies, which in turn suggest early phases of the inside-out quenching processes driven by BHs. The [O] lines emitted at are redshifted to submillimetre wavelengths, and ALMA can detect the line emission. The capability of ALMA for detecting the [O] lines from such high-redshift galaxies have already been suggested from theoretical models (e.g. Inoue et al., 2014; Arata et al., 2020), and ALMA has indeed observed [O of galaxies at (e.g. Inoue et al., 2016; Hashimoto et al., 2018; Novak et al., 2019). An analytic model of Yang et al. (2021) suggests that the high-redshift galaxy SXDF-NB1006-2 at is a promising first target for [O measurements. Clearly, using [O as diagonostics of BH feedback is realistic with ALMA.
The fine structure line diagnostics we propose here is not limited to [O. The line ratio of [N] to is also a promising density tracer (e.g. Zhao et al., 2016; Doherty et al., 2020), and the two lines can be used essentially in the same way. ALMA can detect the [N] lines from high-redshift galaxies (e.g. Novak et al., 2019). The [O] line ratios significantly increase with density in the range 10 , where the logarithmic gradient . The [N ratio is a sensitive probe at relatively lower densities from to with (e.g. Doherty et al., 2020).
For a recently discovered quasar at with , Novak et al. (2019) report detection of emission lines of various ions and molecules with ALMA. Although their observations lack [O, they observe the [N lines at and with a large aperture diameter of , and place a lower limit of the line ratio to be [N. The line ratio indicate the local density of the emitting region . It should be noted that the galaxy-integrated line ratio cannot be directly converted to the local density in this case. Using their model for photodissociation regions, they also derive an upper limit of the local density for the quasar to be . Since there are no such massive BHs at in TNG or Illustris simulations, we cannot perform direct comparison. Instead, let us compare the observation with the simulated galaxies at shown in Fig. 7. Even the lower limit of appears to be significantly higher than the central densities of galaxies with in IllustrisTNG. On the assumption that the physical conditions are similar, this may imply that inside-out quenching has not begun in the quasar host galaxy at . Hashimoto et al. (2019) observe two quasars with at using ALMA and detect bright [O emission. They also find physically more extended emission than their dust continua, suggesting large-scale star formation activity. It would be interesting to investigate whether the extended [O is relevant to the inside-out quenching in the quasars by observing [O] and the [N] lines in the future.
For physically extended objects such as high-redshift galaxies, interferometers such as ALMA often take a strategy to enhance the sensitivity at the sacrifice of spatial resolution by shrinking the arrangement of the telescope arrays. Then the central regions of galaxies are not resolved. It is encouraging that the correlations between [O and are hardly different between the cases with the 3-kpc and galaxy-integrated apertures (Figs. 8 and 13). The diagnostics we propose here do not require a high spatial resolution if is known. Fortunately, as shown in Figs. 10 and 14, may be replaced with the second-moments if the aperture size is large enough to cover the entire star-forming regions.
5.2 Speculation on the BH models from previous observations
Some green-valley galaxies have been observed to have lower densities of molecular gas. They also show low SFRs in their central regions, surrounded by outer disc regions with higher densities and SFRs (Lin et al. 2017; Brownson et al. 2020, see also Ellison et al. 2021). Kalinova et al. (2021) classify local galaxies into various quenching stages according to the morphology of the H emission map, and find that the ‘centrally-quiescent’ galaxies reside in the green valley. They argue that their sample galaxies that are on the way to ‘red-sequence’ generally begin to cease their star formation from the centres. The observations and the interpretation are consistent with the inside-out quenching process, which is possibly driven by the central BHs. It is also consistent with the cavity and the reverse trend in shown in Figs. 5 and 6 for TNG. It is not clear, however, whether the transition is closely related with the BH mass; it may well be that all galaxies evolve similarly toward completely quenched states.
Terrazas et al. (2020) give similar prediction to ours. Using IllustrisTNG, they show that galaxies at are suddenly quenched by the kinematic feedback of BHs at , and abrupt transition from star-forming to quiescent galaxies is seen in diagrams of , and specific SFR. They compare the simulated and observed galaxies at using the diagrams, and find that, for observed galaxies, the transition from star-forming to quiescent states occurs roughly at . However, the transition is not as sharp as in TNG, and star-forming and quiescent galaxies coexist in a wide range of –. Their result does not point to a clear critical for the transition in the observed galaxies. The quenching process by BH feedback is thought to depend not only on but also on other physical parameters. Accordingly, we speculate that, at least for local galaxies, the line ratios of [O may not indicate the abrupt decrease at . However, we note that our samples taken from the simulations are star-forming galaxies. Our result for TNG shows that the drop of [O is seen in the star-forming galaxies where their massive BHs have started quenching the galaxies. Because the line ratio traces local gas density rather than the total star formation rate, the diagnostics with the line ratios could more directly deduce in which galaxies the BH quenching operates.
5.3 [O] emission from AGN
Our model considers [O] emission from H regions whose energy sources are young star clusters. A luminous AGN can also radiate high-energy photons and thus can be an energy source for the [O] emission of gas in the galactic centre. This means that our model can possibly underestimate the absolute luminosities of the [O] lines. Since our main conclusions are based on the relative strength of the [O] lines, they may not be significantly affected by the influence by an AGN on their absolute luminosities. We note that AGNs can enhance the overall [O] emission from inner regions in the galaxy. In this case, the integrated line ratio is more contributed from the emission from the central density, which strongly reflects the efficiency of BH quenching. Although hard photons emitted from an AGN likely increases the ionization parameter of the ISM, the line ratio hardly depends on the ionization parameter. In Appendix B, we show that the contribution of AGN radiation to the total [O] emission is expected to be insignificant in most of the simulated galaxies. We consider that our results for [O are not compromised by the uncertainty in the actual .
6 Conclusions and Summary
The relative strength of a specific pair of line emission such as [O and [O is used to estimate the local gas density of star-forming regions where the lines are emitted. By postprocessing the outputs of the cosmological simulations of IllustrisTNG and Illustris, we model emission of the [O] lines from the simulated galaxies in a large cosmological volume from to .
In galaxies hosting massive BHs, if the BH feedback and star-formation quenching proceeds efficiently in an "inside-out" fashion, the central gas densities are significantly lowered. If the BH quenching is inefficient, the gas densities are expected to be higher towards the centres. Such a difference of the central gas densities can be probed by the line ratio of [O measured in the galaxies. Detecting and identifying both the lines can help extracting the information of the physical properties of galactic centres affected by the BH feedback.
For star-forming galaxies in IllustrisTNG, we find that [O weakly increases with with a large scatter but abruptly decreases at . The drop of the line ratios is due to the transition from high- to low-accretion modes of the BH feedback. The line ratios do not significantly depend on aperture size to integrate the [O] lines. In addition, we find that the second-moments of [O correlate with if the aperture sizes are sufficently large. Hence, in the diagrams of [O and , the abrupt drop of [O is still seen at a VD of . However, if small apertures are applied to measure , the correlation between and disappears above the critical mass due to the strong feedback of the massive BHs in TNG.
Models of the BH feedback are, however, largely different among simulations. In Illustris, we find that the line ratios continuously increase with , and the drop of [O does not appear at any . This is because the transition from high- to low-accretion modes of the feedback model in Illustris does not significantly affect the central gas densities in star-forming galaxies. The second-moments correlate with regardless of the feedback modes of BHs and the aperture sizes. Thus, the correlations of [O with and among star-forming galaxies are expected to reflect the efficiency of the BH feedback.
Based on the simulation results, we propose that observing [O for star-forming galaxies with massive BHs can be used as diagnostics for accuracy of BH models implemented in simulations. If [O is low in a galaxy with a massive BH, the galaxy may be at an early stage of the inside-out quenching by the BH. We have shown that [O hardly depends of aperture size, and thus observations do not need to resolve the central regions of galaxies to apply our diagnostics, even if the aperture size is as large as covering the entire galaxies. ALMA is capable of observing [O and other line ratios such as [N for high-redshift galaxies at . Measuring the line ratios for distant galaxies with massive BHs will provide us with important clues to know on how the BH feedback operates in the galaxies.
Acknowledgements
We thank Takuya Hashimoto and Ken-ichi Tadaki for their fascinating discussion and helpful suggestion. This study was supported by National Astronomical Observatory of Japan (NAOJ) ALMA Scientific Research Grant Number 2019-11A. HY receives the funding from Grant-in-Aid for Scientific Research (No. 17H04827 and 20H04724) from the Japan Society for the Promotion of Science (JSPS). The numerical computations presented in this paper were carried out on the analysis servers and the general-purpose PC cluster at Center for Computational Astrophysics, NAOJ.
Data availability
The data underlying this article will be shared on reasonable request to the corresponding author.
References
- Arata et al. (2020) Arata S., Yajima H., Nagamine K., Abe M., Khochfar S., 2020, MNRAS, 498, 5541
- Behroozi et al. (2019) Behroozi P., Wechsler R. H., Hearin A. P., Conroy C., 2019, MNRAS, 488, 3143
- Brownson et al. (2020) Brownson S., Belfiore F., Maiolino R., Lin L., Carniani S., 2020, MNRAS, 498, L66
- Chabrier (2005) Chabrier G., 2005, in Corbelli E., Palla F., Zinnecker H., eds, Astrophysics and Space Science Library Vol. 327, The Initial Mass Function 50 Years Later. p. 41 (arXiv:astro-ph/0409465)
- Churazov et al. (2005) Churazov E., Sazonov S., Sunyaev R., Forman W., Jones C., Böhringer H., 2005, MNRAS, 363, L91
- De Looze et al. (2014) De Looze I., et al., 2014, A&A, 568, A62
- Doherty et al. (2020) Doherty M. J., Geach J. E., Ivison R. J., Dye S., 2020, ApJ, 905, 152
- Donnari et al. (2019) Donnari M., et al., 2019, MNRAS, 485, 4817
- Donnari et al. (2020) Donnari M., Pillepich A., Nelson D., Marinacci F., Vogelsberger M., Hernquist L., 2020, arXiv e-prints, p. arXiv:2008.00004
- Donnari et al. (2021) Donnari M., et al., 2021, MNRAS, 500, 4004
- Ellison et al. (2021) Ellison S. L., Lin L., Thorp M. D., Pan H.-A., Sánchez S. F., Bluck A. F. L., Belfiore F., 2021, MNRAS, 502, L6
- Ferland et al. (2017) Ferland G. J., et al., 2017, Rev. Mex. Astron. Astrofis., 53, 385
- Ferrarese & Merritt (2000) Ferrarese L., Merritt D., 2000, ApJ, 539, L9
- Fioc & Rocca-Volmerange (1999) Fioc M., Rocca-Volmerange B., 1999, arXiv e-prints, pp astro–ph/9912179
- Fukushima et al. (2020) Fukushima H., Yajima H., Sugimura K., Hosokawa T., Omukai K., Matsumoto T., 2020, MNRAS, 497, 3830
- Gebhardt et al. (2000) Gebhardt K., et al., 2000, ApJ, 539, L13
- Genel et al. (2014) Genel S., et al., 2014, MNRAS, 445, 175
- Hashimoto et al. (2018) Hashimoto T., et al., 2018, Nature, 557, 392
- Hashimoto et al. (2019) Hashimoto T., Inoue A. K., Tamura Y., Matsuo H., Mawatari K., Yamaguchi Y., 2019, PASJ, 71, 109
- Hayward et al. (2020) Hayward C. C., et al., 2020, arXiv e-prints, p. arXiv:2007.01885
- Hirschmann et al. (2014) Hirschmann M., Dolag K., Saro A., Bachmann L., Borgani S., Burkert A., 2014, MNRAS, 442, 2304
- Inayoshi et al. (2020) Inayoshi K., Visbal E., Haiman Z., 2020, ARA&A, 58, 27
- Inoue et al. (2014) Inoue A. K., Shimizu I., Tamura Y., Matsuo H., Okamoto T., Yoshida N., 2014, ApJ, 780, L18
- Inoue et al. (2016) Inoue A. K., et al., 2016, Science, 352, 1559
- Inoue et al. (2020) Inoue S., Yoshida N., Yajima H., 2020, MNRAS, 498, 5960
- Joshi et al. (2020) Joshi G. D., et al., 2020, MNRAS, 496, 2673
- Kalinova et al. (2021) Kalinova V., Colombo D., Sánchez S. F., Kodaira K., García-Benito R., González Delgado R., Rosolowsky E., Lacerda E. A. D., 2021, arXiv e-prints, p. arXiv:2101.10019
- Keenan & Aggarwal (1988) Keenan F. P., Aggarwal K. M., 1988, Journal of Astrophysics and Astronomy, 9, 237
- Kennicutt (1998) Kennicutt Jr. R. C., 1998, ApJ, 498, 541
- Krumholz (2017) Krumholz M. R., 2017, Star Formation. World Scientific Publishing, Singapore, doi:10.1142/10091
- Lin et al. (2017) Lin L., et al., 2017, ApJ, 851, 18
- Martig et al. (2009) Martig M., Bournaud F., Teyssier R., Dekel A., 2009, ApJ, 707, 250
- Marziani & Sulentic (2012) Marziani P., Sulentic J. W., 2012, New Astron. Rev., 56, 49
- Moriwaki et al. (2018) Moriwaki K., et al., 2018, MNRAS, 481, L84
- Nelson et al. (2018a) Nelson D., et al., 2018a, arXiv e-prints, p. arXiv:1812.05609
- Nelson et al. (2018b) Nelson D., et al., 2018b, MNRAS, 475, 624
- Nelson et al. (2019) Nelson D., et al., 2019, MNRAS, 490, 3234
- Novak et al. (2019) Novak M., et al., 2019, ApJ, 881, 63
- Pakmor et al. (2017) Pakmor R., et al., 2017, MNRAS, 469, 3185
- Pillepich et al. (2018) Pillepich A., et al., 2018, MNRAS, 473, 4077
- Schawinski et al. (2014) Schawinski K., et al., 2014, MNRAS, 440, 889
- Sijacki et al. (2007) Sijacki D., Springel V., Di Matteo T., Hernquist L., 2007, MNRAS, 380, 877
- Sijacki et al. (2015) Sijacki D., et al., 2015, MNRAS, 452, 575
- Silk & Mamon (2012) Silk J., Mamon G. A., 2012, Research in Astronomy and Astrophysics, 12, 917
- Springel (2010) Springel V., 2010, MNRAS, 401, 791
- Springel & Hernquist (2003) Springel V., Hernquist L., 2003, MNRAS, 339, 289
- Springel et al. (2001) Springel V., White S. D. M., Tormen G., Kauffmann G., 2001, MNRAS, 328, 726
- Terrazas et al. (2020) Terrazas B. A., et al., 2020, MNRAS, 493, 1888
- Vogelsberger et al. (2014a) Vogelsberger M., et al., 2014a, MNRAS, 444, 1518
- Vogelsberger et al. (2014b) Vogelsberger M., et al., 2014b, Nature, 509, 177
- Weinberger et al. (2017) Weinberger R., et al., 2017, MNRAS, 465, 3291
- Weinberger et al. (2018) Weinberger R., et al., 2018, MNRAS, 479, 4056
- Weinberger et al. (2020) Weinberger R., Springel V., Pakmor R., 2020, ApJS, 248, 32
- Wolfire et al. (1995) Wolfire M. G., McKee C. F., Hollenbach D., Tielens A. G. G. M., 1995, ApJ, 453, 673
- Yang et al. (2021) Yang S., Lidz A., Popping G., 2021, arXiv e-prints, p. arXiv:2101.00662
- Yepes et al. (1997) Yepes G., Kates R., Khokhlov A., Klypin A., 1997, MNRAS, 284, 235
- Zhao et al. (2016) Zhao Y., et al., 2016, ApJ, 819, 69
Appendix A Star-formation main sequence
In Section 4.1.1, we use the method of Donnari et al. (2019) to define an SFMS and to sample star-forming galaxies in each snapshot. Although Donnari et al. (2019) have proposed various methods to determine an SFMS, here we describe the one we use in this study. We assume a power-low relation between and SFRs of galaxies,
| (7) |
where and are the total stellar mass and instantaneous SFR of a gravitationally bound structure detected with SUBFIND. We divide galaxies into stellar-mass bins with intervals of in the range from to and compute the median value and standard deviation of logarithmic SFRs in each bin. We then exclude the galaxies whose SFRs are lower than , re-compute and and iterate this procedure until convergence. Using the converged of the bins, we eventually determine the constants and in equation (7) by the least squares method. We set the boundary between star-forming and quenched galaxies to be at below equation (7) for all stellar masses, where is the median of .
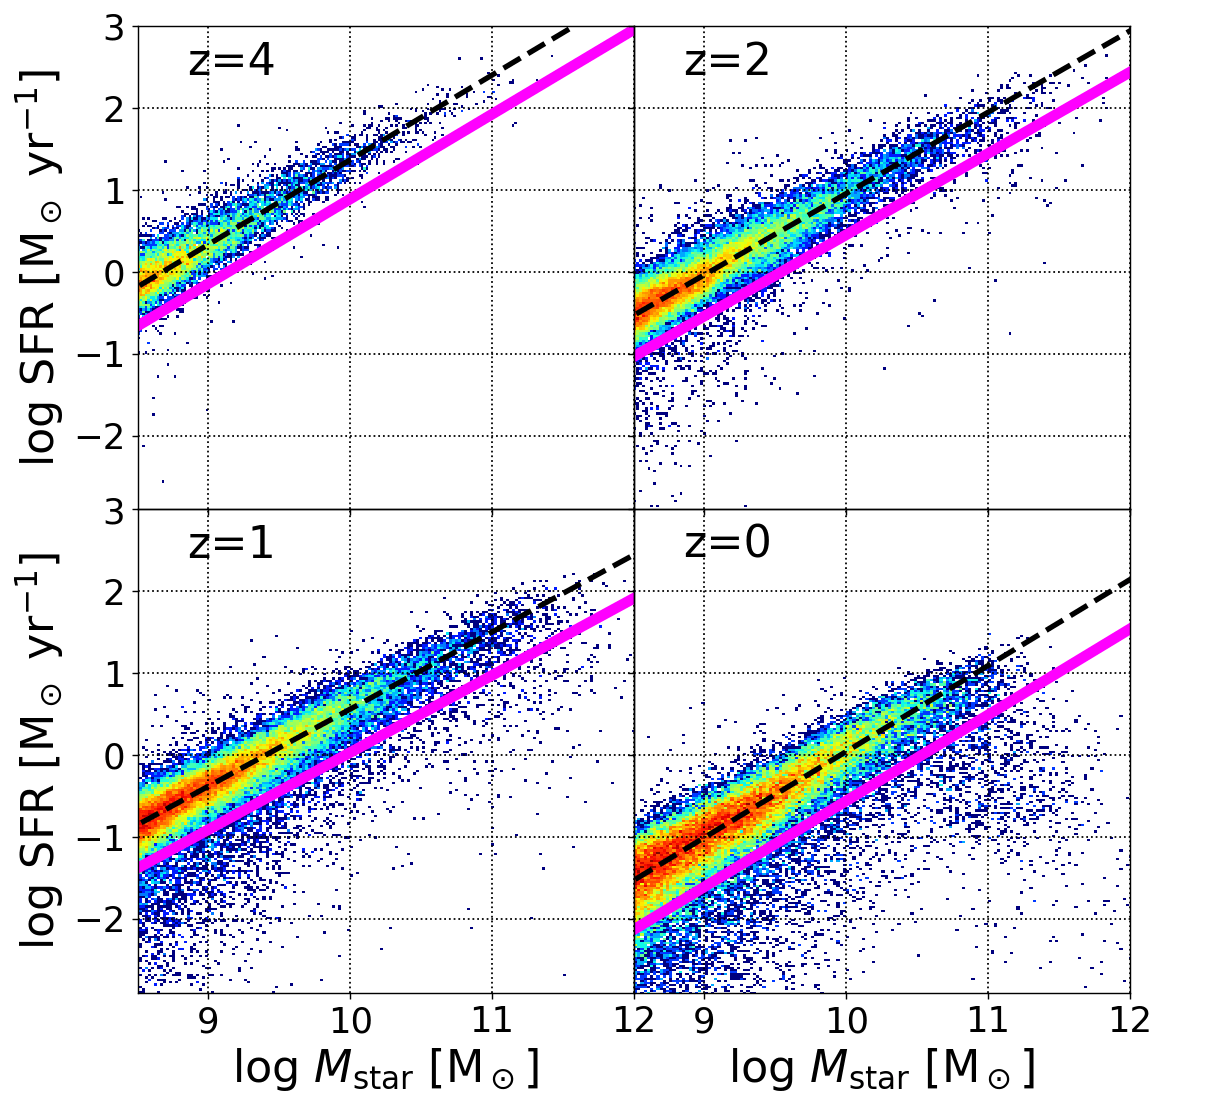
Fig. 16 shows the same result as Fig. 4 but for Illustris. Generally, the offset of the boundary from the SFMS, , decreases with redshift and is smaller than in all snapshots in both simulations. Donnari et al. (2019); Donnari et al. (2020) have argued the dependence of estimated fractions of quenched galaxies and relationship with the colour bimodality on their methods to determine SFMSs in IllustrisTNG.
Appendix B Influence by radiation from black holes
We estimate the contribution from the central AGN as a power source to the galaxy-integrated [O] emission. It is difficult to accurately compute the line emission since we need to know the emergent SED of an AGN which generally has unresolved small-scale structures such as torus. We thus resort to estimating a bolometric luminosity of the BH and compare it with the total bolometric luminosity of stars that form H regions in a galaxy.
We follow a popular model of AGN that assumes the bolometric luminosity is given by
| (8) |
where which is consistent with the value used in the simulations (Churazov et al., 2005; Hirschmann et al., 2014; Weinberger et al., 2018). The bolometric luminosities of star clusters are computed with PÉGASE.2 in the same way as in our model of the [O] lines (see Section 3.1).
For the star-forming galaxies in IllustrisTNG and Illustris, Figs 17 and 18 show the ratios of the galaxy-integrated bolometric luminosities of star clusters with respect to of the most massive BHs in the galaxies. In both the simulations, most of the galaxies have ratios higher than unity, suggesting that the net radiation energy released from the star clusters is generally larger than that from BHs in the galaxies. We thus consider that BHs in the simulations are less significant sources for the [O] lines.
Even if the bolometric luminosity of an AGN is insignificant, it can emit hard photons and may increase the ionization parameters of star-forming regions. To evaluate the influence on [O, we compute the line ratios with our Cloudy model described in Section 3.1 by manually changing the parameter . Fig. 19 shows the dependence of the computed [O on in the cases with and . The line intensity ratio does not strongly depend on , and therefore our conclusions in the main text based on [O are not significantly affected by considering the AGN radiation contribution.