Coping with Mistreatment in Fair Algorithms
Abstract
Machine learning actively impacts our everyday life in almost all endeavors and domains such as healthcare, finance, and energy. As our dependence on the machine learning increases, it is inevitable that these algorithms will be used to make decisions that will have a direct impact on the society spanning all resolutions from personal choices to world-wide policies. Hence, it is crucial to ensure that (un)intentional bias does not affect the machine learning algorithms especially when they are required to take decisions that may have unintended consequences. Algorithmic fairness techniques have found traction in the machine learning community and many methods and metrics have been proposed to ensure and evaluate fairness in algorithms and data collection.
In this paper, we study the algorithmic fairness in a supervised learning setting and examine the effect of optimizing a classifier for the Equal Opportunity metric. We demonstrate that such a classifier has an increased false positive rate across sensitive groups and propose a conceptually simple method to mitigate this bias. We rigorously analyze the proposed method and evaluate it on several real world datasets demonstrating its efficacy.
Reproducibility: All source code, and experimental results are available at https://anonymous.4open.science/r/b6c6653c-5f50-477c-bb13-7dfdeb39d4f4/
1 Introduction
Machine learning has permeated almost every sphere of human endeavours. The algorithms are being applied on both macro and micro scale in various degrees in diverse fields like space [Kothari et al., 2020], finance [Dixon et al., 2020]. Moreover, our dependence on machine learning algorithms to take decisions has created an urgent need to ensure that the algorithms are unbiased when taking decisions, more so if that decision affects society. There has been a steady growth of work in algorithmic fairness in the recent times, e.g., [Ahmadian et al., 2019, 2020, Chierichetti et al., 2017, Dwork et al., 2017, Pessach and Shmueli, 2020]. The underlying assumption in most of the algorithmic fairness works is that there exists a unique sensitive attribute and it influences the decision made by the algorithm. However, in real world especially healthcare the problem is not so simple. For instance, in the healthcare data the number of sick people is usually significantly lower than that of the healthy people Dua et al. [2014] in many data samples. However, this statistical difference is not just influenced by that sensitive label (a diagnosis code in the electronic health records) or any single other such as the gender of the patient but also on whether a patient has access to medical insurance, or whether a patient would want another surgery. In this situation, it becomes hard to not just quantify a fairness metric but also design algorithms that discover and optimize such domain specific metrics.
For machine learning algorithms to be completely fair, they need to simultaneously satisfy the dual objectives of not preferring a statistical majority over a statistical minority to make a final decision and at the same time ensuring that the statistical majority is not unfairly treated to satisfy some constraint. In other words, a fair machine learning algorithm should be able to discriminate between different outcomes given a data sample without overly relying on a single sensitive attribute or a combination thereof.
Many metrics such as Disparate Impact [Barocas and Selbst, 2016, Chierichetti et al., 2017, Ahmadian et al., 2020, Bera et al., 2019], Demographic Parity [Zafar et al., , Zliobaite, 2015, Calders et al., 2009], and Equal Odds/Equal Opportunity [Hardt et al., 2016, Donini et al., 2020, Zafar et al., 2017] have been proposed to ensure the first fairness requirement but they haven’t been studied to see if they also satisfy the second requirement as well.
We focus on the supervised learning paradigm and assume that we have access to an underlying “protected attribute” (we also refer to it as a “sensitive attribute”). Two important fairness measures in this paradigm are the Equal Odds and Equal Opportunity measures [Hardt et al., 2016]. The Equal Odds requires that a classifier has the same true positive rate (TPR) and false positive rate (FPR) across sensitive groups, i.e.,
| (1) |
and
| (2) |
where is the output of the classifier, is the ground truth, is a user defined fairness criterion threshold and is an indicator variable defining the sensitive group. For our purposes, . Similarly, Equal Opportunity requires that
| (3) |
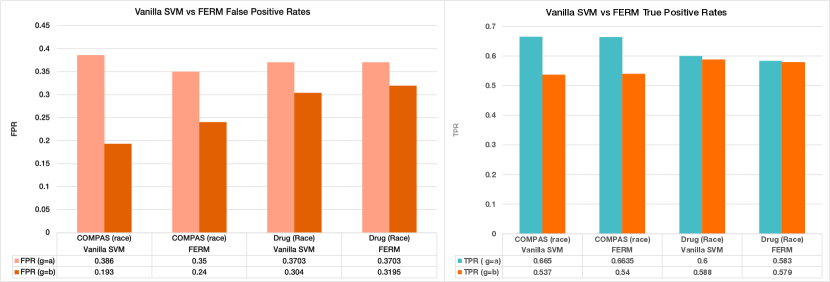
It has been shown in [Pleiss et al., 2017] that the only way to satisfy the Equal Odds metric is to set . This requirement severely limits the areas in which the Equal Odds metric can be a useful measure for ensuring fairness. The Equal Opportunity can be seen as a relaxed version of Equalized Odds. When , Equal Opportunity requires that the true positive rates across sensitive groups are same. Figure 1 shows the true positive and false positive rates of an SVM model trained without fairness constraint and another SVM trained with Equal Opportunity (EO) constrain across the sensitive groups on two datasets - COMPAS recidivism dataset [Larson et al., 2016] released by ProPublica and the Drug dataset [Fehrman et al., 2017]. We can see that in both datasets, the false positive rates increase across the sensitive groups. Moreover, the increase in TPR of a statistical minority group comes at the expense of a statistical majority group. We name this phenomenon as disparate mistreatment (different from Zafar et al. ). A classifier trying to ensure equal opportunity can make myopic decisions by inadvertently associating the sensitive group as the most important feature for final prediction. For instance, in the healthcare domain the data is often extremely imbalanced [Razzaghi et al., 2019, 2015] due to such reasons as much smaller number of sick people than healthy, unequal access to medical insurance, and incorrect sampling among the people seeking for medical help. A trained classifier with Equal Opportunity metric may falsely output more positive responses on the group forming a minority in the overall disease rate. This bias would then violate our requirement on fairness.
1.1 Our Contributions
In this paper, we note the existence of bias exhibited by classifiers optimizing EO metric against majority groups belonging to a single protected attribute. We make the following contributions with our work:
-
•
We concretely define the disparate mistreatment phenomenon presented above and propose a conceptually simple criteria to prevent the disparate mistreatment.
-
•
We rigorously show that minimizing the optimization objective subject to our constraint can generalize to unseen samples.
-
•
We quantify the performance of classifier in terms of the DFPR metric (difference of False Positive Rates) and show that a classifier trained with our approach exhibits a significantly less DFPR when compared against other baselines.
2 Related Work
Work on algorithmic fairness has progressed on different areas of machine learning and different algorithms have been proposed in both supervised and unsupervised settings. In this paper we limit ourselves to work concerning statistical or group fairness. For an excellent introduction to algorithmic fairness in general, please consider [Pessach and Shmueli, 2020] and the references therein.
In the supervised learning paradigm, the proposed algorithms achieve fairness by either data-preprocessing, optimizing a model satisfying a particular criteria or fine tuning an unoptimal classifier to meet fairness criteria. For instance, [Hardt et al., 2016] propose the Equal Odds and Equal Opportunity fairness metric and first train an unoptimal (in the fairness sense) classifier. Then the authors fine tune the classifier keeping in mind the protected attribute of the dataset.
In a different approach [Donini et al., 2020] propose the FERM framework to optimize the Equal Opportunity metric by integrating the fairness constraint in an Empirical Risk Management (ERM) framework. [Zafar et al., 2017] propose a framework to mitigate disparate mistreatment by measuring the distance of users feature vectors that are misclassified with the decision boundary. The authors then propose to mitigate disparate impact(DI) [Zafar et al., ] by measuring the distance between a users feature vector and the decision boundary. We note that our definition of disparate mistreatment is different from [Zafar et al., 2017] and also note that their method assumes linear separability of data while we do not make any such assumptions about our data. Our work is more closely related to Donini et al. [2020] since we also use the ERM framework to integrate fairness in the algorithm.
Another direction to ensure fairness in supervised setting is proposed by [Zemel et al., 2013] in which a new data representation is derived from the original existing data in a way that removes the protected attribute from participating directly into the decision process. An ensemble learning approach is proposed by [Dwork et al., 2017] in which decoupled classifiers are trained and each classifier is fine tuned jointly by minimizing a joint loss.
Fairness and calibration are closely related. [Pleiss et al., 2017] define calibration and rigorously show that a classifier cannot simultaneously satisfy Equalized Odds and output calibrated responses. Moreover, it has been shown that the only way to ensure Equalized Odds is to ensure that both true positive rates and false positive rates across two sensitive groups are exactly the same.
In the unsupervised learning domain, fairness has been considered within the framework of clustering. Following the work of [Chierichetti et al., 2017] on fairlets, different methods have been proposed [Ahmadian et al., 2019, 2020, Chhabra and Mohapatra, 2020, Backurs et al., 2019] that either solve the clustering problem in a heirarchical agglomerative setting or ensuring fairness in a k-means clustering setting. The central idea in all works in this vein is to prevent an over-representation of a particular sensitive group in a cluster.
3 Our Approach
We begin with the notation. Let be a labelled dataset of samples, where and represent the data point and label, respectively. Let be the space of all functions that minimize a prescribed loss function . We define to be a classifier that optimizes accuracy and to be a classifier that minimizes taking into account fairness using the Equal Oportunity (EO) constraint. Further, we constrain the target classes . For any classifier, let
| (4) |
be the probability of predicting for sensitive group and target . We further assume that there are only two classes of protected attribute hence . We are now ready to define the disparate mistreatment phenomenon.
Definition 3.1 (Disparate Mistreatment).
A classifier is said to exhibit disparate mistreatment if and only if for groups an increase in directly corresponds to a decrease in and vice versa.
It follows from Definition 3.1 that any classifier exhibiting disparate mistreatment will have an increased rate of false negatives for one statistical group and at the same time also result in an increased false positive rate in the other. For any , optimizing for maximizing accuracy will return which tries to find the decision boundary that differentiates between positive and negative samples conditioned on the outcome alone.
However, optimizing EO results in which constrains the classifer to find a supoptimal decision boundary so that true positives increase across the different sensitive groups. Geometrically, this can be seen as pushing the clusters of positively labeled samples in either group closer to each other by minimizing the distance between their respective means. This optimization method however completely ignores the effect on the cluster of negatively labeled samples in either sensitive group. We hypothesize that this is the root cause of exhibiting disparate mistreatment.
Our approach is to introduce a minimum separation parameter into the Empirical Risk Minimization (ERM) framework. We build on the work of [Donini et al., 2020] due its attractive guarantees on upper bounds of the empirical risk.
Definition 3.2.
Let
be the risk on negatively labeled samples for a particular sensitive group in a dataset. Then is -minimum separated if
| (5) |
Based on Definition 5, we can formulate two constrained ERM problems. In the case where we want to obtain such that the decision boundary respects a minimal separation between negative label clusters we optimize:
| (6) | |||||
| such that |
We call Problem 6 as Equal Treatment (ET). In this case, we do not constrain the optimal function to ensure equal true positive rates across sensitive groups. Instead, fairness is achieved by ensuring that negative samples from any sensitive group do not get classified as positive up to the tolerance level . We additionally require that . However, there may be situations where we would want both EO and ET constraints to be satisfied. In those cases we optimize:
| (7) | |||||
| such that | |||||
We have defined the optimization problems 7 and 6 in a general manner. We now analyze the bounds on the performance of our algorithm. First, we define to be the true risk of the unknown underlying data distribution . Further,
is the empirical risk associated with samples drawn i.i.d from . We call to be the Bayes optimal classifier minimizing true risk and to be optimal classifier minimizing the empirical risk. Furthermore, we constrain the loss function to be convex.
Lemma 3.1.
If be a function minimizing empirical risk subject to constraints in Problem 6 and the loss is convex. If is the upper bound function on empirical risk, then with probability of at least ,
| (8) | ||||
Proof.
For a given upper bound function , the true risk and empirical risk are related as:
| (9) |
with probability greater or equal . Using Equation 9, we can that with probability of atleast , where is the confidence parameter that
| (10) |
But, we have defined . Then it follows that,
| (11) | ||||
Essentially, Equation 11 means that the true risk of a classifier that minimizes ERM is upper bounded by the cost function and the minimal separation parameter . However, we are interested in bounding the risk of the optimal classifier on the training data (observed samples) in terms of the Bayes optimal classifier , so the following relation is applied
| (12) |
with probability greater or equal . Using Equation 12 and noticing that the right hand side of Equation 11 is valid , we can state that with probability at least
| (13) |
∎
The result of Lemma 3.1 upper bounds the empirical risk of the optimal and can guarantee that with a small penalty of the empirical risk will be close to the true risk on the underlying distribution. However, the degree of closeness will depend on how fast converges to a uniform value. If is finite we can use Union bound to derive the upper bound function as:
| (14) |
On the other hand, if is infinite then we can make use of Rademacher bound to find an upper bound for the empirical risk. The key point to note is that decays to as which implies that the empirical risk can approximate the true risk within a small penalty of .
3.1 Non-Linear Optimization with Kernels
In this section we specify our problem when the underlying space of functions is the Reproducing Kernel Hilbert Space (RKHS). For any function in RKHS we parametrize it as where and is a feature map in high dimensional space. For our purpose, we assume is a non-linear mapping in high dimensional space, i.e., . Since our underlying function space is RKHS, we can define a positive semidefinite kernel matrix , such that .
Following [Donini et al., 2020], we define to be the barycenter of a negatively labeled cluster of points belonging to a sensitive group :
| (15) |
In general, we optimize the following problem
| (16) | |||||
| such that |
In Equation 16, . We further specify this problem to a soft-margin SVM by optimizing
| (17) | |||||
| such that | |||||
To simplify solving Equation 16, we use the Representer theorem [Kimeldorf and Wahba, 1971] to note that , then
| (18) |
which can be simply expressed as
| (19) |
where is an element of the gram matrix . We also write, . The optimization problem can be restated as:
| (20) | |||||
| such that |
Geometric Intuitions: We stated earlier that where is the Hilbert space. Since Hilbert space is a complete vector space, we can interpret any as a distance between two infinite dimensional vectors embedded in that space. Moreover, since the underlying function space is a RKHS, any functional will be upper bounded by a finite quantity. If we solve Equation 16 without the constraint, then we simply are choosing a weight vector which is closest to points that minimize the loss. However, our added constraint forces the algorithm to search for a weight vector that minimizes the loss while maintaining a distance of at-least between the center of masses of points that have negative labels associated with them.
4 Experimental results
| Dataset | # Data points | # Features | Sensitive Attribute |
|---|---|---|---|
| Adult | / | Gender | |
| COMPAS | Race | ||
| Drug | Race | ||
| Arrhythmia | Gender |
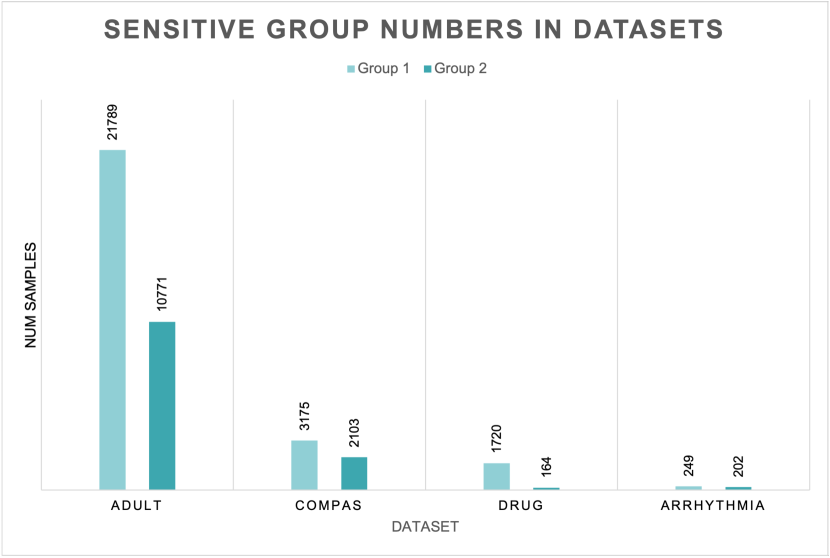
We now describe our experimental results on several real-world datasets and show the effectiveness of our approach in reducing the FPR across the sensitive groups. Table 1 summarizes the datasets.
Adult is a dataset from UCI repository [Dua and Graff, 2017] containing 14 features with 48842 data points about different aspects of an individual (such as age, gender, and marital status) to determine if that person earns more than $50,000 a year. For this dataset we consider gender to be the sensitive attribute.
COMPAS Correctional Offender Management Profiling for Alternative Sanctions (COMPAS) algorithm [Larson et al., 2016] used by Broward County Prison to assess the re-arrest rate of different individuals was shown to be biased against black defendants. We used the dataset [Larson et al., 2016] provided by Propublica and specifically focused on the violent-recidivism subset. The dataset contains 6,171 data points with 12 features. We chose race as the sensitive feature.
Drug is a dataset provided by UCI [Dua and Graff, 2017] containing information about 1889 individuals. Each individual has 12 features associated with them including personality type, ethnicity and whether they have used a drug in the past. There are 16 possible classification problems concerning use of different drugs. In this paper we select the use of cocaine as our target variable and discretize it into “Never used” and “Used” classes. We further discretize the sensitive attribute ethnicity into “White” and “Other” classes.
Arrhythmia is a dataset containing 452 samples and 279 features to detect the absence or presence of cardiac arrhythmia in a patient. We also turn this into a binary classification problem by considering “Normal” vs “Others” as the outcome variable. We choose gender as the protected attribute. Since this data contains a lot of missing values we pre-processed the data by dropping feature with number of unknowns greater than a threshold and substituting the rest of the unknowns with the median value of the feature. This dataset is also provided by the UCI [Dua and Graff, 2017] repository.
We use the RBF kernel
for all experiments. All real valued features are scaled to have a zero mean and unit standard deviation. We further vectorize all categorical variables as well. In datasets where the test/train split is not provided we search for the optimal hyperparameters () using 5-fold cross validation for each given value of and report the best result. For baseline, we use the code provided by [Donini et al., 2020] with our pre-processed data. In all tables containing the results, our method is labeled by SVM-MT, the original FERM and SVM by FERM and SVM, respectively.
| Method | Adult | COMPAS | Drug | Arrhythmia | ||||
|---|---|---|---|---|---|---|---|---|
| Precision | DFPR | Precision | DFPR | Precision | DFPR | Precision | DFPR | |
| SVM | 0.74 | 0.086 | ||||||
| SVM-MT | 0.73 | 0.020 | ||||||
| FERM | 0.71 | 0.067 | ||||||
In order to measure the performance of the classifier after optimization we define the DFPR metric to be the absolute difference between the FPR across the sensitive groups. Our search for optimal was performed by first optimizing the SVM specific hyperparameters via cross fold validation. When we do not explicitly balance the dataset, then we sweep the values of in in steps of to determine the optimal value that minimizes the DFPR.
In our experiments, we did not notice a significant decrease of DFPR value for . We explain this as follows: when is higher then a maximum margin classifier would effectively optimize for accuracy. Table 2 shows the results of our experiments on four real world datasets. We observe that our method consistently outperforms the baseline FERM [Donini et al., 2020] method achieving significantly lower DFPR on almost all datasets without sacrificing too much precision.
| Model | Adult | COMPAS | Drug | Arrhythmia |
|---|---|---|---|---|
| SVM | ||||
| SVM-MT | ||||
| FERM |
For the completeness of comparison we also trained SVM models without any constraints. As expected, the unconstrained SVM has a higher accuracy, but also a higher rate of FPR than any other models. In particular, the FERM model has a comparable precision with the baseline SVM but has a much higher DFPR rate on the Arrhytmia dataset, while on the other hand our method sacrifices some precision to achieve the lowest DFPR rate of with . Table 3 shows the average optimization time over 5 different runs for all three models considered in our study. As expected, an unconstrained baseline SVM is significantly faster than the other two methods in finding the decision boundary. However, compared against the FERM model, our approach is consistently faster. In the case of Adult dataset optimizing both FERM and SVM-MT takes considerably longer than the baseline SVM. This indicates that for larger datasets a more scalable algorithm needs to be designed.
| Model | Drug | Arrhythmia | ||
|---|---|---|---|---|
| Precision | DFPR | Precision | DFPR | |
| SVM | ||||
| SVM-MT | ||||
| FERM | ||||
4.1 Handling Imbalanced Classes
The real world datasets have a class imbalance since data collection is not always uniform. For instance, in the Drug dataset there are 784 people belonging to sensitive group (“Other”) that are labeled as a positive class. By contrast, only 63 people belonging to the other sensitive group(“White”) are positively labeled. The same trend is also observed in other datasets. In order to evaluate the algorithms more fairly, we wanted to remove the imbalance in the class labels. Hence, we undersampled the numerically superior class and ran the optimization against all three methods i.e. baseline SVM, SVM-MT(our method) and FERM. Table 4 shows the results of our experiments. All the results are the average of 5 independent runs. We found to be a stable choice for all the experiments.
In the case of Drug dataset, FERM model has a significantly reduced precision, while our method has almost comparable precision to the baseline. Moreover, our DFPR is the lowest amongst all three methods. Given that the drug dataset exhibits a strong class imbalance and FERM optimizes to minimize the TPR, undersampling the majority decreases the precision. In the Arrhythmia dataset we also note that our method achieves the best DFPR. However, for the FERM model the precision drops less due to the fact that difference between positively labeled samples is not as pronounced (160 in one sensitive group and 85 in the other). We also observe that our method does exhibit a lower precision on the Arrhythmia dataset which we interpret to be because of the low number of samples in the data and our objective to keep the negatively labeled samples separated by atleast .
5 Conclusion
In this paper we have studied the effects of optimizing a classifier under the Equal Opportunity constraint. We showed that a classifier trying to minimize the difference between true positive rates of sensitive groups causes an increase in the false positive rates within each group. Furthermore, the increase in true positive rate of the statistical minority is achieved by the decrease in the true positive rate of the statistical majority. While this may be a valid method to ensure fairness with a single protected attribute, we reasoned that it would be counterproductive if the sensitive attribute could not be precisely defined. To mitigate this mistreatment we proposed a minimum separation parameter and showed that our approach is successful in decreasing the false positive rates across the sensitive groups without sacrificing too much accuracy.
Our work opens up a discussion about how far the assumption of a unique sensitive attribute in data is valid. A fruitful direction of work can be to examine the existing fairness metrics when the sensitive attribute is not precise. Another direction that opens up is to define metrics that are robust to imprecise sensitive attributes and create algorithms that make minimal assumptions about the underlying data. Another important direction is related to introducing the Equal Opportunity constraint into the recent scalable accelerators of nonlinear support vector machines such as [Wen et al., 2018, Sadrfaridpour et al., 2019] which are expected to provide a notable scalability improvement to the entire optimization process.
Reproducibility: All source code, and experimental results are available at https://anonymous.4open.science/r/b6c6653c-5f50-477c-bb13-7dfdeb39d4f4/
References
- Ahmadian et al. [2019] Sara Ahmadian, Alessandro Epasto, Ravi Kumar, and Mohammad Mahdian. Clustering without Over-Representation. Proceedings of the 25th ACM SIGKDD International Conference on Knowledge Discovery & Data Mining, pages 267–275, July 2019. doi: 10.1145/3292500.3330987. URL http://arxiv.org/abs/1905.12753. arXiv: 1905.12753.
- Ahmadian et al. [2020] Sara Ahmadian, Alessandro Epasto, Marina Knittel, Ravi Kumar, Mohammad Mahdian, Benjamin Moseley, Philip Pham, Sergei Vassilvitskii, and Yuyan Wang. Fair Hierarchical Clustering. arXiv:2006.10221 [cs, stat], June 2020. URL http://arxiv.org/abs/2006.10221. arXiv: 2006.10221.
- Backurs et al. [2019] Arturs Backurs, Piotr Indyk, Krzysztof Onak, Baruch Schieber, Ali Vakilian, and Tal Wagner. Scalable Fair Clustering. arXiv:1902.03519 [cs], June 2019. URL http://arxiv.org/abs/1902.03519. arXiv: 1902.03519.
- Barocas and Selbst [2016] Solon Barocas and A. Selbst. Big data’s disparate impact. California Law Review, 104:671, 2016.
- Bera et al. [2019] Suman Bera, Deeparnab Chakrabarty, Nicolas Flores, and Maryam Negahbani. Fair algorithms for clustering. In H. Wallach, H. Larochelle, A. Beygelzimer, F. d'Alché-Buc, E. Fox, and R. Garnett, editors, Advances in Neural Information Processing Systems, volume 32. Curran Associates, Inc., 2019. URL https://proceedings.neurips.cc/paper/2019/file/fc192b0c0d270dbf41870a63a8c76c2f-Paper.pdf.
- Calders et al. [2009] T. Calders, F. Kamiran, and M. Pechenizkiy. Building classifiers with independency constraints. In 2009 IEEE International Conference on Data Mining Workshops, pages 13–18, 2009. doi: 10.1109/ICDMW.2009.83.
- Chhabra and Mohapatra [2020] Anshuman Chhabra and Prasant Mohapatra. Fair Algorithms for Hierarchical Agglomerative Clustering. arXiv:2005.03197 [cs, stat], July 2020. URL http://arxiv.org/abs/2005.03197. arXiv: 2005.03197.
- Chierichetti et al. [2017] Flavio Chierichetti, Ravi Kumar, Silvio Lattanzi, and Sergei Vassilvitskii. Fair Clustering Through Fairlets. In I. Guyon, U. V. Luxburg, S. Bengio, H. Wallach, R. Fergus, S. Vishwanathan, and R. Garnett, editors, Advances in Neural Information Processing Systems 30, pages 5029–5037. Curran Associates, Inc., 2017. URL http://papers.nips.cc/paper/7088-fair-clustering-through-fairlets.pdf.
- Dixon et al. [2020] Matthew F Dixon, Igor Halperin, and Paul Bilokon. Machine Learning in Finance. Springer, 2020.
- Donini et al. [2020] Michele Donini, Luca Oneto, Shai Ben-David, John Shawe-Taylor, and Massimiliano Pontil. Empirical Risk Minimization under Fairness Constraints. arXiv:1802.08626 [cs, stat], January 2020. URL http://arxiv.org/abs/1802.08626. arXiv: 1802.08626.
- Dua and Graff [2017] Dheeru Dua and Casey Graff. UCI machine learning repository, 2017. URL http://archive.ics.uci.edu/ml.
- Dua et al. [2014] Sumeet Dua, U Rajendra Acharya, and Prerna Dua. Machine learning in healthcare informatics, volume 56. Springer, 2014.
- Dwork et al. [2017] Cynthia Dwork, Nicole Immorlica, Adam Tauman Kalai, and Max Leiserson. Decoupled classifiers for fair and efficient machine learning. arXiv:1707.06613 [cs], July 2017. URL http://arxiv.org/abs/1707.06613. arXiv: 1707.06613.
- Fehrman et al. [2017] E. Fehrman, A. K. Muhammad, E. M. Mirkes, V. Egan, and A. N. Gorban. The five factor model of personality and evaluation of drug consumption risk, 2017.
- Hardt et al. [2016] Moritz Hardt, Eric Price, and Nathan Srebro. Equality of Opportunity in Supervised Learning. arXiv:1610.02413 [cs], October 2016. URL http://arxiv.org/abs/1610.02413. arXiv: 1610.02413.
- Kimeldorf and Wahba [1971] George Kimeldorf and Grace Wahba. Some results on tchebycheffian spline functions. Journal of mathematical analysis and applications, 33(1):82–95, 1971.
- Kothari et al. [2020] Vivek Kothari, Edgar Liberis, and Nicholas D Lane. The final frontier: Deep learning in space. In Proceedings of the 21st International Workshop on Mobile Computing Systems and Applications, pages 45–49, 2020.
- Larson et al. [2016] Jeff Larson, Marjorie Roswell, and Vaggelis Atlidakis. Correctional Offender Management Profilingfor Alternative Sanctions (COMPAS) dataset. https://github.com/propublica/compas-analysis/, 2016.
- Pessach and Shmueli [2020] Dana Pessach and Erez Shmueli. Algorithmic Fairness. arXiv:2001.09784 [cs, stat], January 2020. URL http://arxiv.org/abs/2001.09784. arXiv: 2001.09784.
- Pleiss et al. [2017] Geoff Pleiss, Manish Raghavan, Felix Wu, Jon Kleinberg, and Kilian Q Weinberger. On Fairness and Calibration. In I. Guyon, U. V. Luxburg, S. Bengio, H. Wallach, R. Fergus, S. Vishwanathan, and R. Garnett, editors, Advances in Neural Information Processing Systems 30, pages 5680–5689. Curran Associates, Inc., 2017. URL http://papers.nips.cc/paper/7151-on-fairness-and-calibration.pdf.
- Razzaghi et al. [2015] Talayeh Razzaghi, Oleg Roderick, Ilya Safro, and Nick Marko. Fast imbalanced classification of healthcare data with missing values. In 2015 18th International Conference on Information Fusion (Fusion), pages 774–781. IEEE, 2015.
- Razzaghi et al. [2019] Talayeh Razzaghi, Ilya Safro, Joseph Ewing, Ehsan Sadrfaridpour, and John D Scott. Predictive models for bariatric surgery risks with imbalanced medical datasets. Annals of Operations Research, 280(1):1–18, 2019.
- Sadrfaridpour et al. [2019] Ehsan Sadrfaridpour, Talayeh Razzaghi, and Ilya Safro. Engineering fast multilevel support vector machines. Machine Learning, 108(11):1879–1917, 2019.
- Wen et al. [2018] Zeyi Wen, Jiashuai Shi, Qinbin Li, Bingsheng He, and Jian Chen. ThunderSVM: A fast SVM library on GPUs and CPUs. The Journal of Machine Learning Research, 19(1):797–801, 2018.
- [25] Muhammad Bilal Zafar, Isabel Valera, Manuel Gomez Rodriguez, and Krishna P Gummadi. Fairness Constraints: Mechanisms for Fair Classification. page 9.
- Zafar et al. [2017] Muhammad Bilal Zafar, Isabel Valera, Manuel Gomez Rodriguez, and Krishna P. Gummadi. Fairness Beyond Disparate Treatment & Disparate Impact: Learning Classification without Disparate Mistreatment. Proceedings of the 26th International Conference on World Wide Web, pages 1171–1180, April 2017. doi: 10.1145/3038912.3052660. URL http://arxiv.org/abs/1610.08452. arXiv: 1610.08452.
- Zemel et al. [2013] Rich Zemel, Yu Wu, Kevin Swersky, Toni Pitassi, and Cynthia Dwork. Learning fair representations. In International conference on machine learning, pages 325–333. PMLR, 2013.
- Zliobaite [2015] Indre Zliobaite. On the relation between accuracy and fairness in binary classification. arXiv preprint arXiv:1505.05723, 2015.