Diffuse bands 9577 and 9633 – relations to other interstellar features
Abstract
We study, for the first time, the relations of two strong diffuse bands (DIBs) at 9633 and 9577 Å, commonly attributed to C, to other interstellar features seen in optical and UV spectra including Hi, Cai, Feii, Nai, Tiii, CN, CH, CH+, and C2 and DIBs 5780, 5797, 6196, 6269, 6284, and 6614. We analyzed 62 lines of sight where the stellar contamination by Mgii was corrected or found negligible for DIB 9633. Equivalent widths of DIB 9577 were measured in 62 lines of sight. Poor mutual correlation between the strengths of the above features and the major diffuse bands (5780 and 5797) as well as with other DIBs (with some exceptions) were revealed. The considered DIBs are also poorly correlated with the features of neutral hydrogen, molecular carbon, and those of simple interstellar radicals. Perhaps this phenomenon can be explained if the diffuse band 9577 is an unresolved blend of two or more interstellar features. There are indications that 9633 and 9577 diffuse bands are stronger in -type clouds, i.e. these features resemble the behavior of reasonably broad DIBs, which are strong in the lines of sight where the UV flux from the very hot nearby stars plays an important role.
1 Introduction
Two relatively strong and broad interstellar features near the diffuse bands (DIBs) 9577 and 9633 were first proposed to be possibly carried by the C molecule by Foing & Ehrenfreund (1994). The features are situated in the near-infrared (near-IR) region of the spectrum, heavily contaminated by telluric lines. A determination of their exact profiles and strengths requires thus a telluric line divisor. Moreover, the DIB 9633 feature is inextricably intertwined with the stellar Mgii line (Galazutdinov et al. (2000); Galazutdinov et al. (2017)); the latter is negligibly weak only in the spectra of the hottest (O-type) stars.
Cami et al. (2010) reported the first detection of infrared emissions carried by neutral C60, seemingly present on the surfaces of solid material (dust particles). It was observed only in the vicinity of the peculiar planetary nebula Tc1. Independently, Sellgren et al. (2010) reported the presence of neutral C60 in the NGC 7023 reflection nebula illuminated by the B star HD 200775. The molecule was detected only in the regions closest to the star. All these reports support the idea of a presence of the buckminsterfullerene cation in translucent interstellar clouds.
The reasonably recent publications by Campbell et al. (2015, 2016a, 2016b) restarted the discussion on whether the “soccer ball” molecule may carry the abovementioned near-IR spectral features. According to Campbell et al. (2015), C exhibits four relatively strong spectral lines, centered at 9365.90.1, 9428.50.1, 9577.50.1, and 9632.70.1 Å, with relative intensities of 0.2, 0.3, 1.0, and 0.8 respectively.
Galazutdinov et al. (2017) disputed the identifications, raising a problem of the variable strength ratio of the two strong features. A precise determination of this ratio requires accurate elimination of telluric contaminations as well as that of the Mgii stellar line from the DIB 9633 profile. The latter was done by means of calculating non-LTE synthetic spectra of the atmospheres of hot stars used to estimate the strength of the contaminating line with respect to another non–blended one, near 4481 Å (see details in Galazutdinov et al. 2017). The result was discouraging: the 9577/9633 strength ratio seems to be severely variable.
Another problem is the presence of weaker bands seen in laboratory spectra. Their relative equivalent width ratios should mimic the observed ones. Here the problem of telluric contamination is even more severe. The expected features are weak, while the telluric lines are strong; thus complete elimination of telluric contamination is not always possible. The identification of the C molecule in translucent interstellar clouds was disputed by Galazutdinov & Krełowski (2017); the observed strength ratios of the postulated C features do not follow the laboratory predictions of Campbell et al. (2016a). The observed strength ratios were demonstrated to be variable, i.e. not the same from object to object. In their following publication, Campbell & Maier (2018) changed the laboratory spectrum: the C lines are at 9365.20.2, 9427.80.2, 9577.00.2, and 9632.10.2 with relative intensities distributed as 0.26, 0.17, 1.00, and 0.84 respectively. Thus, the weak 9428 C feature is weaker than that at 9365 Å in contrast to the results reported in 2015. This new spectrum matches the observed interstellar one better with one caution: the very weak 9428 Å DIB is severely contaminated by telluric lines.
The latter problem should be solved if the observations are done outside the atmosphere. This is the subject of a recent publication by Cordiner et al. (2019). The authors used the spectrograph onboard the Hubble Space Telescope (HST) to record the near-IR spectra of seven reddened and four unreddened stars. Despite their claim that C is eventually discovered beyond a doubt, the formerly missing feature (9428) is clearly seen only in BD +40 4220, albeit without detailed analysis of possible stellar contamination. The presence of the 9428 Å feature in other objects is doubtful. Moreover, the HST spectrograph does not cover the second strongest C DIB – the 9633 one. Thus the authors of the latter paper were unable to analyze the relation between the two strong bands. We mentioned some problems with this in Galazutdinov & Krełowski (2017). The lack of the major DIB 9633 in the observed wavelength range reduces the significance of the reported conclusions.
Apparently the statistics of the existing measurements are a serious problem. One needs more targets to convince everybody that the claimed (especially weak) features really exist and that their strength ratios mimic the laboratory predictions. In this paper we present a sample of reddened targets collected to check the possible relations of the proposed C features to other interstellar ones. We emphasize that almost all interstellar features are correlated, in many cases quite tightly (Moutou et al., 1999). Diffuse bands usually demonstrate good mutual correlations with the 6196 – 6614 relation being the “champion” (Krełowski et al., 2016). However, the latter publication warns that even a very tight correlation does not guarantee that the two features share a carrier (Krełowski et al., 2020).
Walker (2015) state that the weak C bands near 9366 and 9428 Å can be traced in the spectra of HD183143 (only 9366) and HD169454 (both). Walker (2016) reported the detection of diffuse bands 9632, 9577, 9428, 9365 and 9348 towards the stars HD 46711, HD 169454, HD 183143. In any case the conclusions were based on very small samples. It is the natural consequence of the fact that IR DIBs (especially weak ones) can be traced only in the spectra of heavily reddened targets.
In this paper we present an analysis of the largest sample so far of targets with measured near-IR interstellar features attributed to C. We carefully corrected not only the telluric line contamination but also that caused by stellar lines (Galazutdinov et al. 2017). The latter contamination poses special difficulties while dealing with broad interstellar features with a width comparable to stellar lines. Here we use the results from Galazutdinov et al. (2017) supplemented with measurements of hot objects lacking a strong Mgii effect.
We also analyze possible relations between the two strong infrared bands (C) and the other well-known DIBs, as well as abundances of simple interstellar molecules and atoms.
2 Spectral data
Our observations have been collected using several high resolving power echelle spectrographs. They are as follows.
-
•
The Ultraviolet and Visual Echelle Spectrograph (UVES) is fed with the 8m Kueyen VLT mirror (ESO, Paranal, Chile; (Dekker et al., 2000)). The spectral resolving power reaches R=80,000 in the blue range and R=110,000 in the red. The telescope size allows one to get high signal-to-noise ratio (S/N) spectra even for rather faint stars.
-
•
The Fiber-fed Extended Range Optical Spectrograph (FEROS) is fed with the 2.2m MPG/ESO telescope (ESO, LaSilla) (Kaufer et al., 1999). It allows one to record in a single exposure a spectral range of 3600 to 9200 Å divided into 39 echelle orders. The resolving power of Feros spectra is R=48,000. Feros spectra cover a broad wavelength range per each order, which makes the spectrograph a very useful tool for checking the spectral types and luminosity classes of the observed targets and for measuring DIBs and atomic/molecular features. However, the C features are out of its range.
-
•
The Echelle SpectroPolarimetric Device for the Observation of Stars (ESPaDOnS) spectrograph111For details see https://www.cfht.hawaii.edu/Instruments/Spectroscopy/Espadons/ is a bench-mounted high resolving power echelle spectrograph/spectropolarimeter, attached to the 3.58m Canada-France-Hawaii telescope at Maunakea (Hawaii, USA). It is designed to obtain a complete optical spectrum in the range of 3700 to 10050 Å. The whole spectrum is divided into 40 echelle orders. The resolving power is about 68,000. Spectra from ESPaDOnS were obtained during the runs 05Ao5 (in 2010, PI B. Foing) and 15AD83 (in 2015, PI G. Walker). The high altitude (more than 4 km) and exceptionally low humidity on the site make Mauna Kea an ideal place for the study of IR DIBs. The quality of telluric line removal in ESPaDOnS spectra is the best among all the spectral data we have used. Unfortunately, the major DIB 9633 is out of the observed spectral range in the spectra from ESPaDOnS. This explains why the number of the DIB 9633 measurements is lower than that for 9577 (Tab. 1).
-
•
The Bohyunsan Echelle Spectrograph (BOES) of the Korean National Observatory (Kim et al., 2007) is installed at the 1.8m telescope of the Bohyunsan Observatory in Korea. The spectrograph has three observational modes allowing resolving powers of 30,000, 45,000, and 90,000. In any mode, the spectrograph covers the whole spectral range of 3500 to 10,000 Å, divided into 75 – 76 spectral orders.
-
•
The MAtrix Echelle SpecTROgraph (MAESTRO; (Musaev et al., 1999)) is attached to the 2m telescope at the Terskol Observatory (the North Caucasus, Russia). It is a three branch cross-dispersed echelle spectrograph installed at the Coudé focus (F/36) of the telescope. It was designed for stellar spectroscopy using high resolutions ranging from R = 45,000 to 190,000 in the 3500 – 10000 Å spectral region. The lowest resolving power mode (sufficient for our programme) allows one to obtain spectra of targets as faint as 10m with a sufficient (100) S/N;
All spectra were processed and measured in a standard way using both IRAF (Tody, 1986) and our own DECH222http://www.gazinur.com/Download.html codes. The spectral resolutions provided by the abovementioned instruments are not identical but all are high enough to precisely measure the strengths of atomic and molecular interstellar lines and, especially, of the broad DIBs.
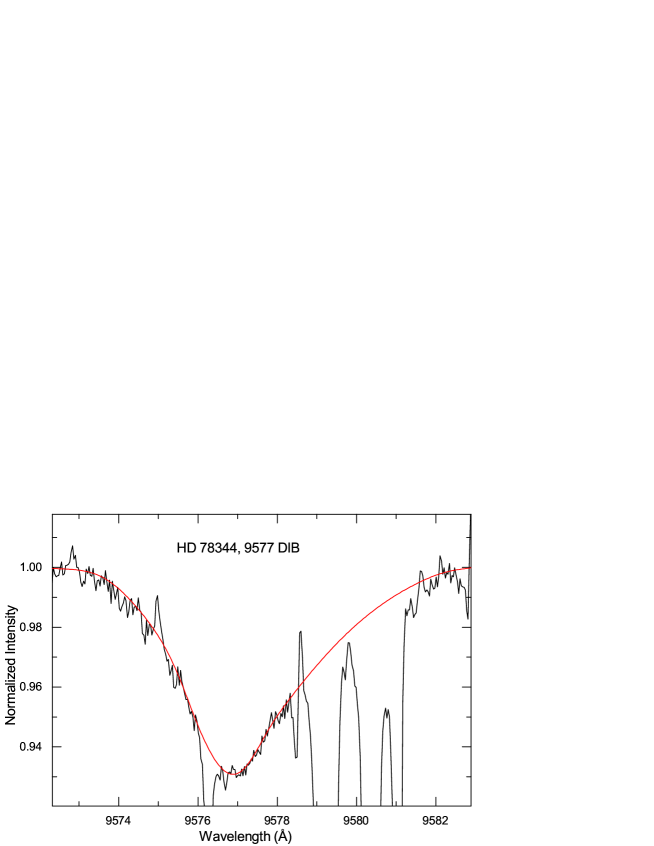
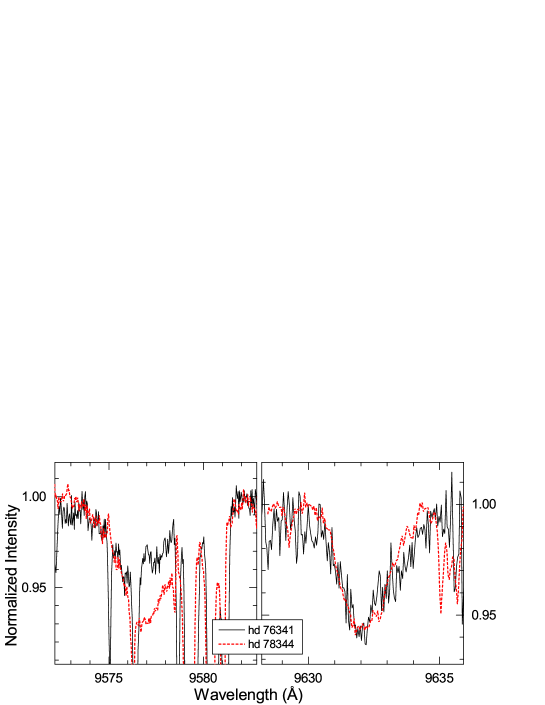
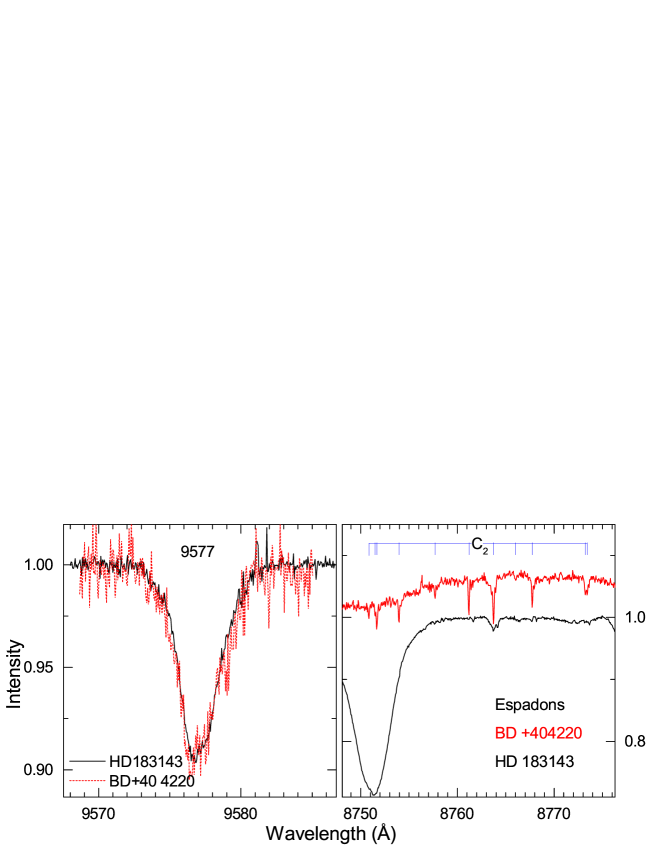
Measuring the DIBs 9633 and 9577 is not a simple procedure because of strong telluric line remnants and, sometimes, a high level of noise. In most cases, to measure the equivalent width, we used the manual profile fit method: a cubic spline fit over manually set profile points (see Fig. 1). The method provides the possibility to measure lines of any complex, irregular shape. The resulting data for the DIBs 9577 and 9633 are presented in Tab.1. The equivalent width errors were estimated using Eq. 7 from Vollmann & Eversberg (2006) where both spectral noise and uncertainty of the continuum normalization are taken into account.
2.1 Contamination of the DIBs 9633 and 9577 by telluric and stellar spectra
The near-IR wavelength range suffers strong contamination by telluric lines. To eliminate the contamination we applied the classical method based on the use of a divisor — a spectrum of a hot, unreddened, and preferably rapidly rotating star. The method permits one to adjust both the positional and intensity differences of the telluric lines in the studied object and divisor spectra. We used several stars as telluric line divisors, always trying to observe the one closest to the chosen target. As a divisor we used spectra of Spica (HD 116658, B1V), HD120315 (B3V), HD218045 (B9III) and some other targets with characteristics satisfying the requirements given above. Our method is described in detail by Galazutdinov et al. (2017). Here we used the same procedures, only the number of analyzed targets is more than twice as large as in Galazutdinov et al. (2017).
Complex and variable spectra of the chosen divisors, when used for the removal of telluric lines, may introduce unwanted distortions into the resulting profiles of relatively broad bands, e.g. 9633, since real spectra contain stellar lines. On the other hand the telluric lines (mostly of the atmospheric H2O) are in many cases saturated, which makes their removal practically impossible. Thus some remnants of the telluric spectrum are still seen in our resultant spectra. With such small contamination we can still reliably measure the chosen DIBs (manually fitting the profile to the undisturbed points). However, in many cases the telluric contamination is the main source of uncertainty for the equivalent width measurements given in Tab. 1.
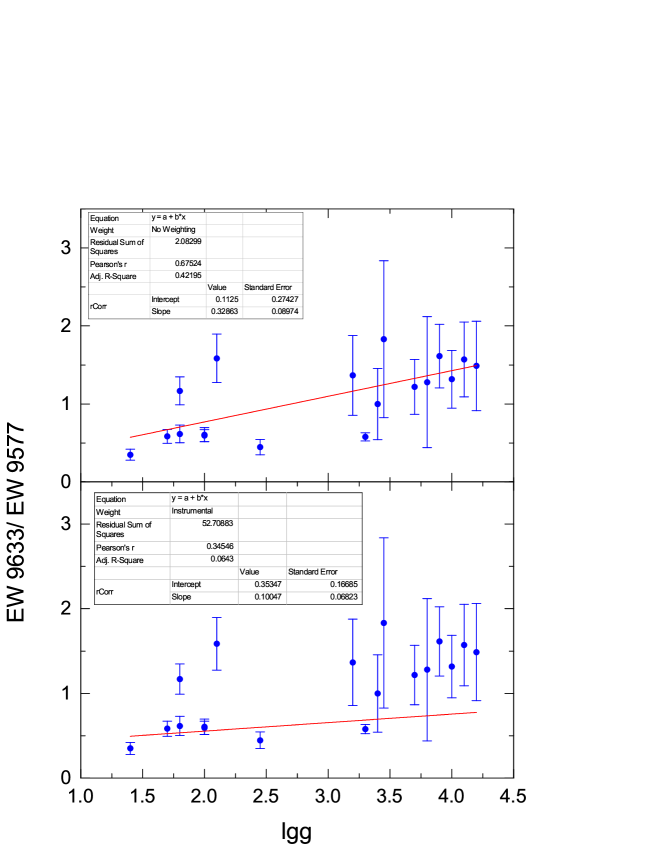
It is worth mentioning that the stellar contamination of the DIB 9633 depends on the effective temperature being relatively large in late-B type atmospheres (like HD183143) and small in very hot O stars (like HD76341). The problems of the elimination of the stellar Mgii line from the profile of the DIB 9633 was discussed broadly in Galazutdinov et al. (2017). The applied method was criticized by Lallement et al. (2018) who claimed that the ratio of the two strong features, 9577/9633 correlates with the surface gravity of the star (see their Fig. 1), i.e. the stellar contamination effect is not properly addressed. However, the linear fit, shown in the abovementioned figure, was calculated neglecting the weighting procedure by the individual error bars. If the straight line is calculated using proper weights the trend disappears, i.e. the determinations of stellar parameters by Galazutdinov et al. (2017) are correct and we use these values also in the current paper (see Fig. 2). However, to improve the statistics, we have added additional targets. Some of them are very hot stars (similar to HD76341) where the Mgii contamination to the DIB 9633 profile is negligibly small, although the equivalent width of the DIB 9633 may be slightly overestimated. For cooler targets we have measured the DIB 9577 only. It is of basic importance to check whether the strength ratio of the two strong DIBs 9577 and 9633 is close or not to the laboratory predictions. If not, the idea that C is their carrier must be postponed until we have a lab spectra of C with a variable ratio of these major features due to the variation of some physical/chemical parameter, e.g. rotational temperature.
| Object | SpL or Teff/lgg | vsini | 9633 | 9577 | Object | SpL or Teff/lgg | vsini | 9633 | 9577 | |
|---|---|---|---|---|---|---|---|---|---|---|
| BD-14 5037 | 18000/1.8 | 42 | 12515 | 10710 | HD148379 | 17000/1.7 | 51 | 8011 | 1379 | |
| CD-32 4348 | 19500/2.45 | 36 | 7516 | 16811 | HD148605 | 20500/4.2 | 145 | 11935 | 8020 | |
| BD+40 4220 | O6.5f+O5.5f | 200 | 26362 | 35078 | HD148937 | O6fp | 14323 | 13034 | ||
| BD+59 2735 | B0Ib | 16314 | 368150 | HD149038 | O9.7Iab | 52 | 10027 | 8620 | ||
| Cyg OB2 7 | O3If | 75 | 16314 | 23555 | HD149757 | O9.2IVnn | 303 | 9630 | 7250 | |
| Cyg OB2 8 | O6Ib+O4.5III | 20045 | HD150136 | O4III+O8 | 10827 | 12058 | ||||
| Cyg OB2 12 | B3Iae | 39070 | HD151804 | O8Iaf | 72 | 12619 | 7526 | |||
| HD13256 | B1Ia | 9554 | HD152408 | O8Iape | 11020 | 9522 | ||||
| HD22951 | B0.5V | 10 | 7222 | HD152424 | OC9.2Ia | 59 | 16150 | 13649 | ||
| HD23180 | 24000/3.45 | 78 | 14146 | 7734 | HD153919 | O6Iafcp | 11424 | 11028 | ||
| HD27778 | 15500/3.8 | 92 | 6417 | 5030 | HD155806 | O7.5V | 52 | 8640 | 8040 | |
| HD36861 | O8III | 52 | 7122 | 7040 | HD167264 | 29000/3.2 | 82 | 8220 | 6017 | |
| HD37022 | O7Vp | 29 | 7215 | 7120 | HD167971 | O8Iaf(n)+O4/5 | 65 | 17813 | 19020 | |
| HD37041 | O9.5IVp | 134 | 10814 | 9440 | HD168607 | B9Iaep | 335120 | |||
| HD40111 | B0III | 141 | 7623 | 6735 | HD168625 | B6Iap | 19425 | 32025 | ||
| HD54662 | O7Vzvar | 95 | 6020 | 6020 | HD169454 | 21000/2.1 | 39 | 13020 | 8210 | |
| HD55879 | O9.7III | 26 | 5720 | HD170740 | 21000/3.9 | 40 | 15020 | 9320 | ||
| HD57061 | O9II | 51 | 6517 | 9447 | HD183143 | 11500/1.4 | 37 | 10520 | 30020 | |
| HD76341 | 34000/3.7 | 66 | 13430 | 11020 | HD184915 | 27000/3.4 | 220 | 7025 | 7020 | |
| HD78344 | 31000/3.3 | 98 | 17013 | 29415 | HD190603 | B4 Ia | 45 | 155111 | 15020 | |
| HD80077 | 17000/2.0 | 47 | 9511 | 16010 | HD194279 | B5Ia | 48 | 16152 | ||
| HD91824 | O7V | 51 | 6033 | 8428 | HD204827 | O9.5IV | 1010 | |||
| HD104705 | B0III/IV | 9640 | 10040 | HD208501 | B8Iab | 41 | 9754 | |||
| HD113904 | WC5+B0III+O9IV | 106 | 10038 | 11364 | HD219287 | B0Ia+ | 14474 | |||
| HD136239 | 17000/1.8 | 43 | 12020 | 19515 | HD226868 | O9.7Ib | 106 | 12938 | ||
| HD143275 | B0.3IV | 165 | 9426 | HD228712 | B0.5Ia | 22252 | ||||
| HD144470 | B1V | 95 | 10321 | 5825 | HD228779 | O9Ia | 10432 | |||
| HD145502 | 21000/4.0 | 98 | 15820 | 12030 | HD229059 | B2Iab | 20535 | |||
| HD147165 | B1 III | 22 | 23033 | 19036 | HD235825 | O9IV | 11040 | |||
| HD147888 | 16000/4.1 | 104 | 11012 | 7020 | HD254577 | B0.5Ib | 18590 | |||
| HD147889 | B1.5V | 100 | 2618 | HD281159 | binary | 584 | 22782 |
| pair of DIBs | R | n | pair of DIBs | R | n | |
|---|---|---|---|---|---|---|
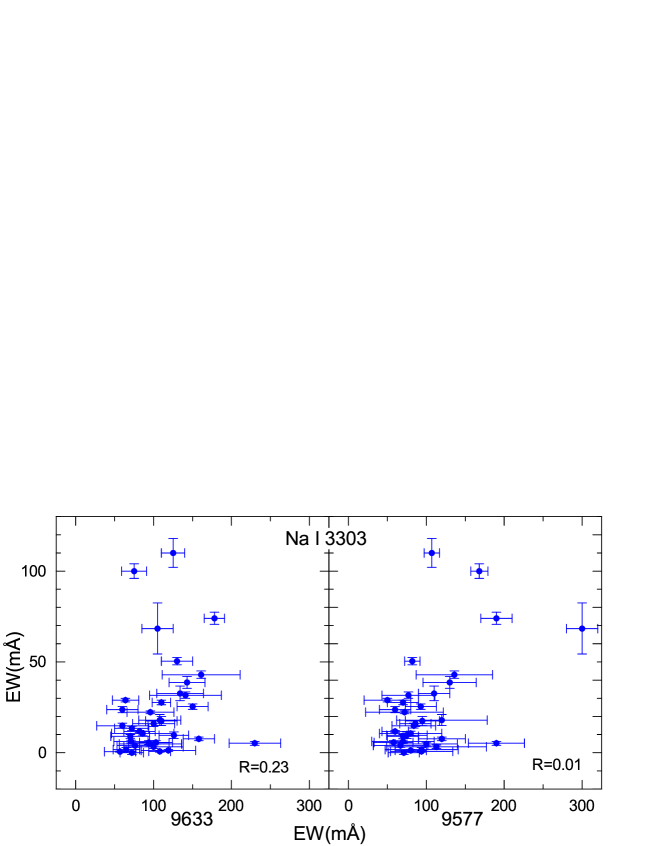
| 9633/9577 | 0.37 | 37 | 9633/NaI 3303 | 0.23 | 36 | |
| 9633/E(B-V) | 0.50 | 45 | 9577/NaI 3303 | 0.01 | 33 | |
| 9577/E(B-V) | 0.47 | 60 | 9633/TiII 3242 | -0.25 | 32 | |
| 9633/6196 | 0.54 | 45 | 9577/TiII 3242 | 0.02 | 30 | |
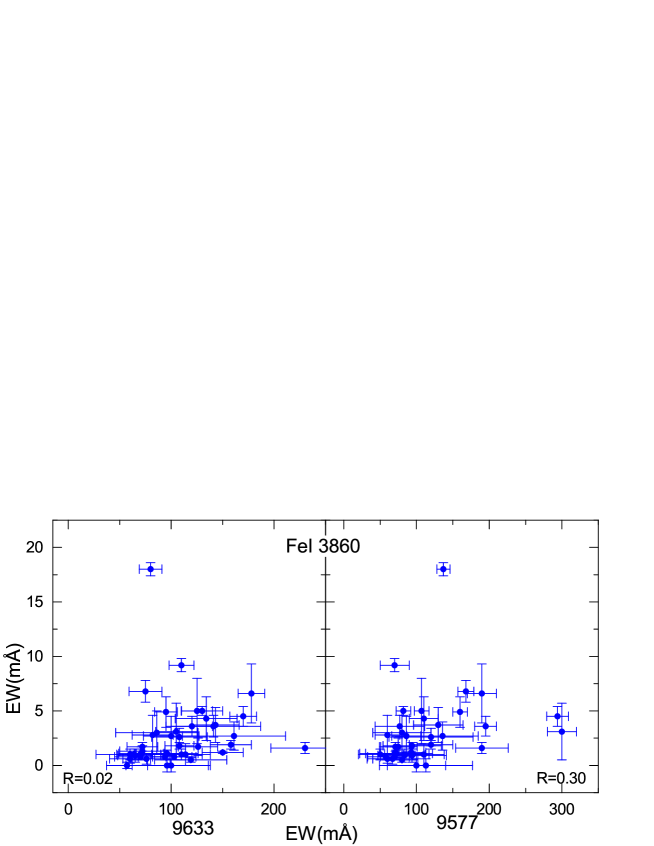
| 9577/6196 | 0.70 | 62 | 9633/FeI 3860 | 0.02 | 41 | |
| 9633/6284 | 0.25 | 45 | 9577/FeI 3860 | 0.30 | 38 | |
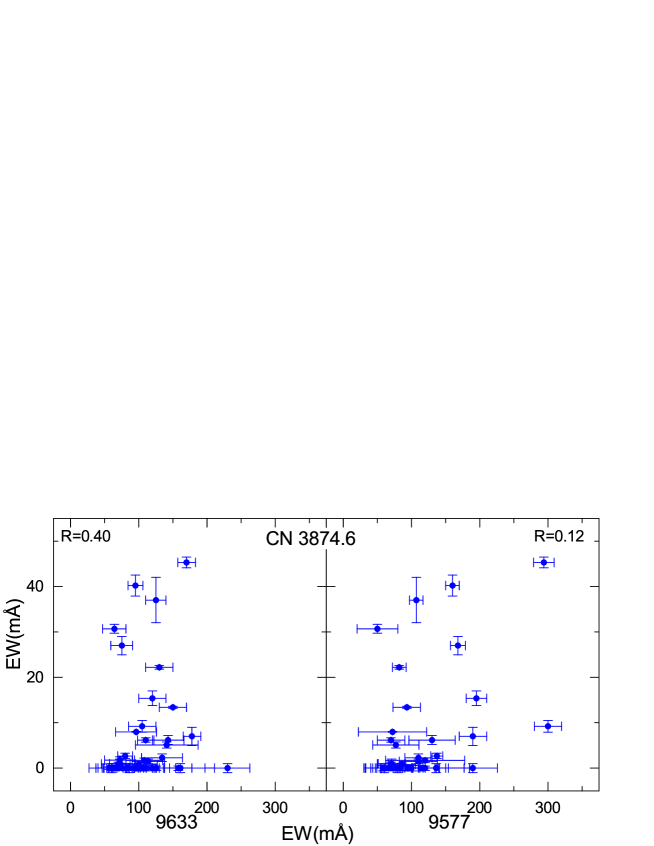
| 9577/6284 | 0.65 | 62 | 9633/CN 3874.6 | 0.40 | 41 | |
| 9633/5780 | 0.44 | 44 | 9577/CN 3874.6 | 0.11 | 39 | |
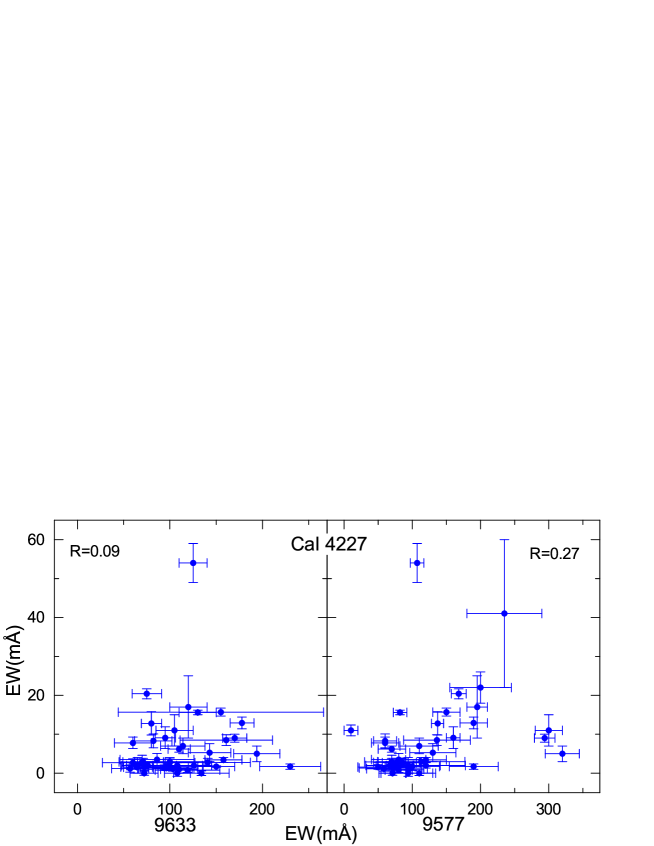
| 9577/5780 | 0.71 | 61 | 9633/CaI 4227 | 0.09 | 43 | |
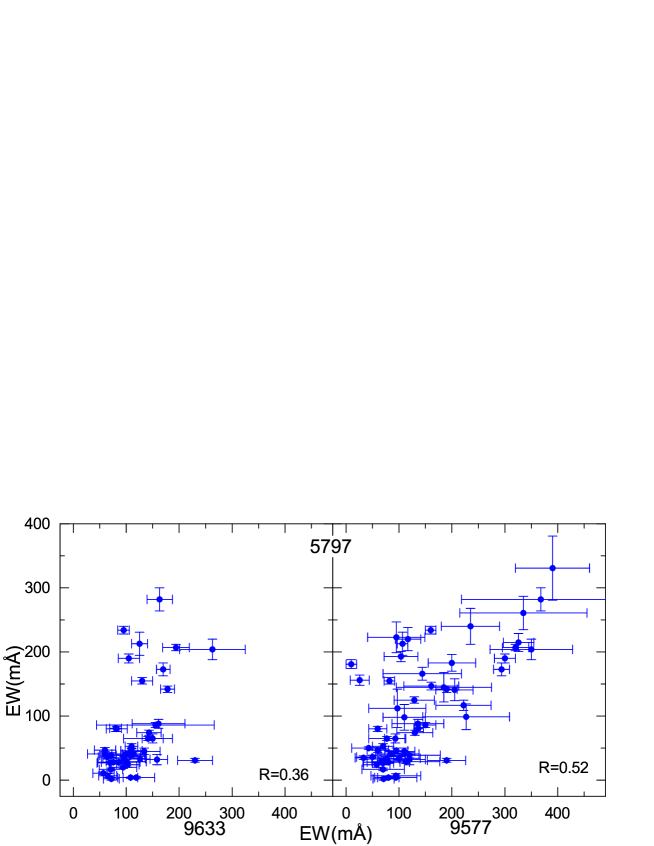
| 9633/5797 | 0.36 | 43 | 9577/CaI 4227 | 0.27 | 43 | |
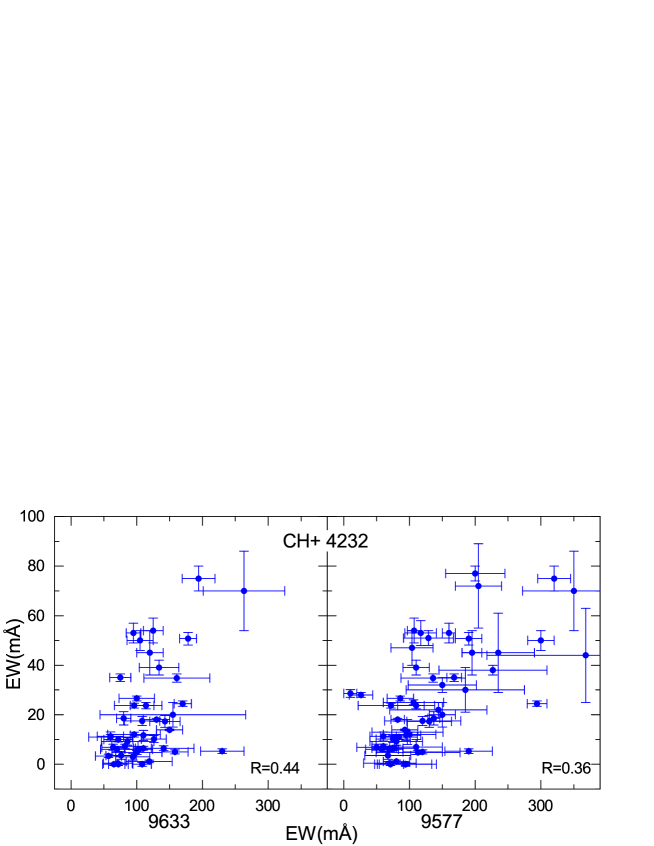
| 9577/5797 | 0.52 | 60 | 9633/CH+ 4232 | 0.44 | 44 | |
| 9633/6614 | 0.37 | 44 | 9577/CH+ 4232 | 0.36 | 57 | |
| 9577/6614 | 0.77 | 61 | 9633/CH 4300 | 0.25 | 44 | |
| 9633/6269 | 0.32 | 45 | 9577/CH 4300 | 0.22 | 57 | |
| 9577/6269 | 0.66 | 62 |
3 Results
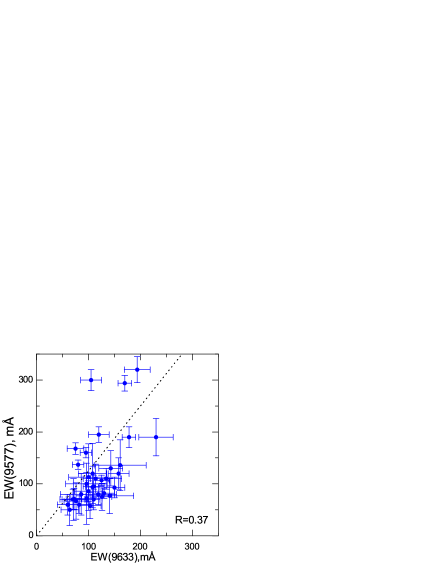
Using our sample of reddened stars we measured the DIB 9577 in 62 objects and the DIB 9633 in 43 objects. In some of our targets the latter DIB is not available or is contaminated by the Mgii stellar line (Galazutdinov et al., 2017). In our sample of DIB 9633 measurements we included only the hottest stars where the stellar contamination is negligible. If both the 9633 and 9577 bands, attributed to C, share the same carrier, their ratio should be similar to that obtained in the laboratory measurements and thus their strengths should correlate tightly. The correlation between the two features, shown in Fig. 3, is surprisingly poor in contrast to the expectations. Moreover, the correlation coefficient between the DIBs 9633 and 9577 is among the lowest for any pair of diffuse bands. Perhaps this can be partially explained by the relatively high uncertainty of the measured equivalent width due to the imperfection of the telluric line removal procedure. However, as is shown in the bottom part of Fig.3, the variability of the 9577/9633 ratio cannot be completely explained by the influence of telluric lines. It is worth mentioning that all of the correlation coefficients were calculated with the measurement error taken as a weight in the form of 1/.
The poor correlation between the DIBs 9577 and 9633 casts doubts on whether they are of the same origin, i.e. whether they do represent the spectrum of the C molecule. We now check to see how both DIB carriers are possibly related to other interstellar species.
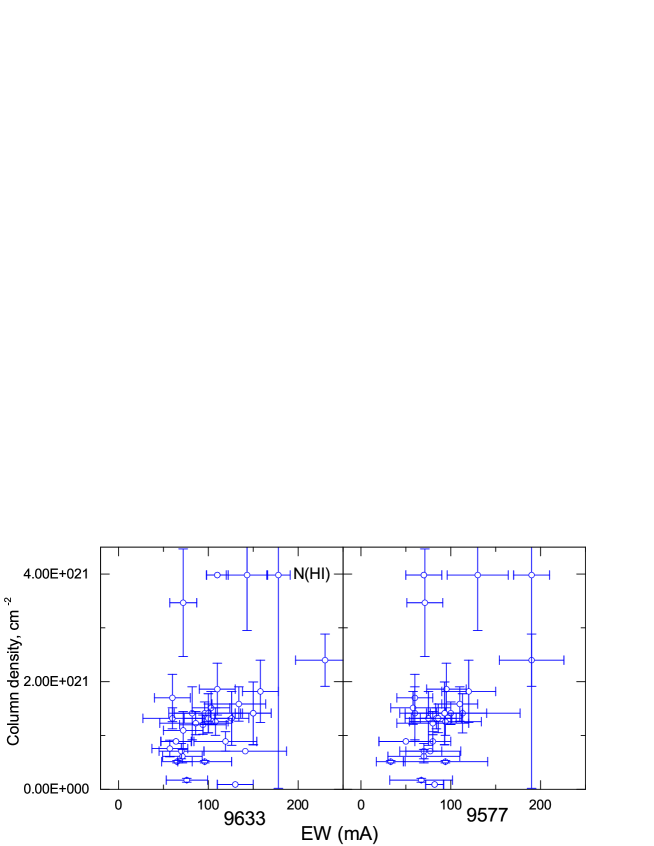
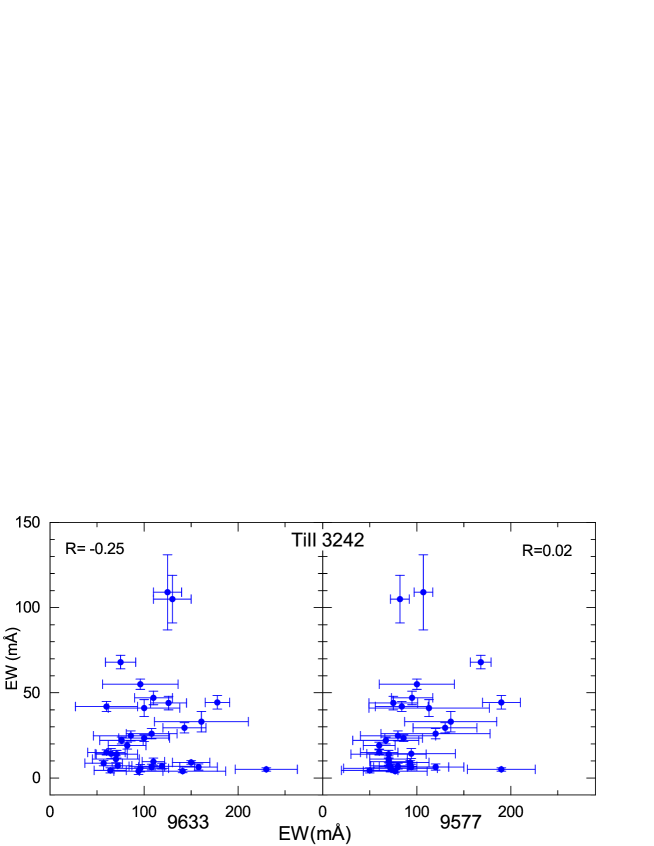
It is certainly of interest to investigate whether C is mixed well with the interstellar atomic hydrogen. In Fig. 4 we try to relate both DIBs to the hydrogen column density taken from the compilation of Gudennavar et al.(2012), based on measurements of absorptions observed by space-born instruments. As seen in Fig. 4 both of the considered DIBs hardly correlate with the hydrogen column density. The correlation coefficients are 0.35 and 0.46 for the DIBs 9633 and 9577, respectively. Apparently the DIB carriers are not evenly distributed in the interstellar Hi clouds and the Hi column density does not allow one to predict the intensities of both DIBs. The same situation is observed in the cases of all atomic gases: Tiii, Nai, Cai or Fei; for all these relations the correlation coefficients are very small (see the online figure set associated with Fig. 4).
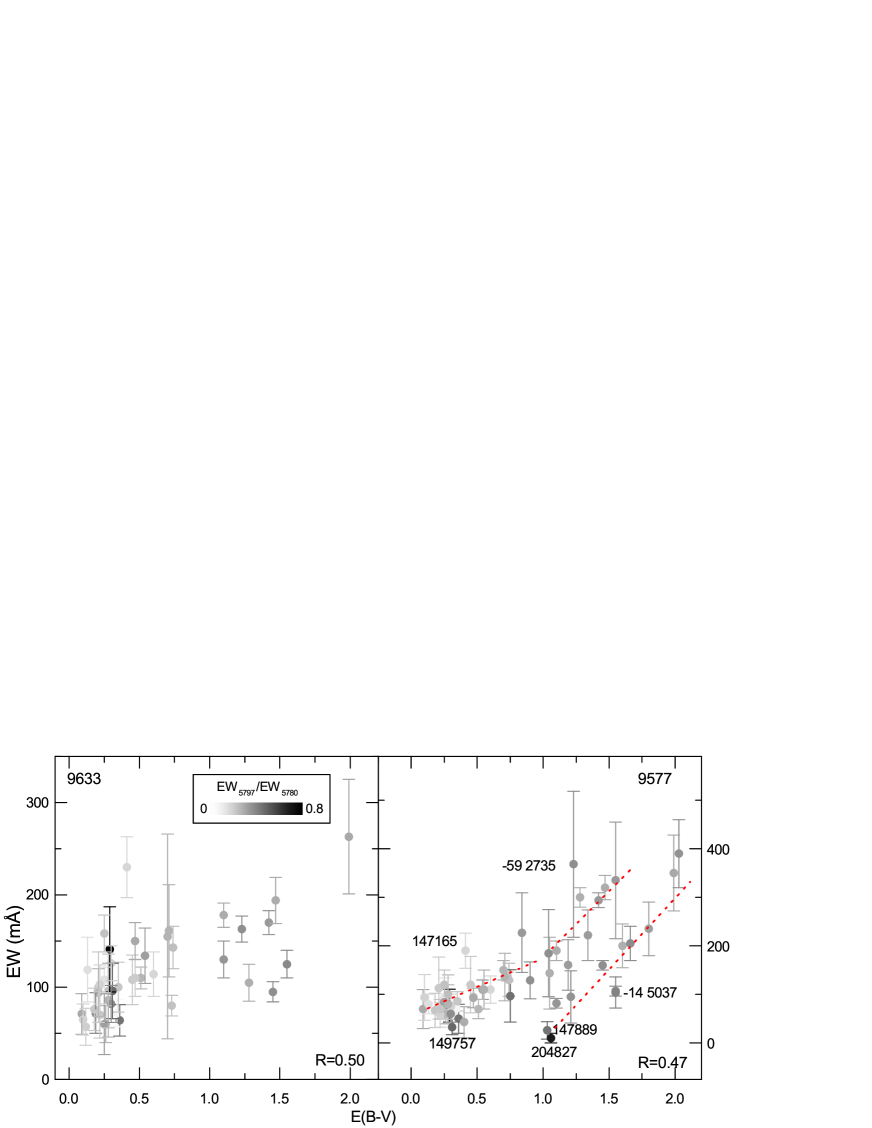
Another interesting question is whether our DIBs are related in some way to interstellar dust. The optical depth of the latter is usually measured using the color excess E(B-V). Traditionally a feature that correlates with E(B-V) is considered as interstellar. Fig. 6 relates both strong DIBs to E(B-V) and proves a rather poor correlation between the DIB carriers and the dust grains. The color intensity of the symbols in the plots is associated with the equivalent width ratio of the major DIBs at 5797 and 5780 Å, i.e. darker colors correspond to a stronger effect, i.e. a higher equivalent width (5797/5780)) ratio. It is evident that -type objects have a tendency to present weak C associated DIBs. A rather speculative issue is the possible presence of two sequences in the relation between the equivalent width of the DIB 9577 and the reddening, roughly marked by the red dashed lines in the right panel. This possible split cannot be explained by / progressions. Indeed, a heavily reddened -type object HD204827 and the progenitor of -type clouds HD149757 both exhibit a very weak DIB 9633. If any, the split can be explained, for example, by a presence of two independent diffuse bands at 9633. However, a much more representative sample of measured objects is necessary to confirm or reject this hypothesis.
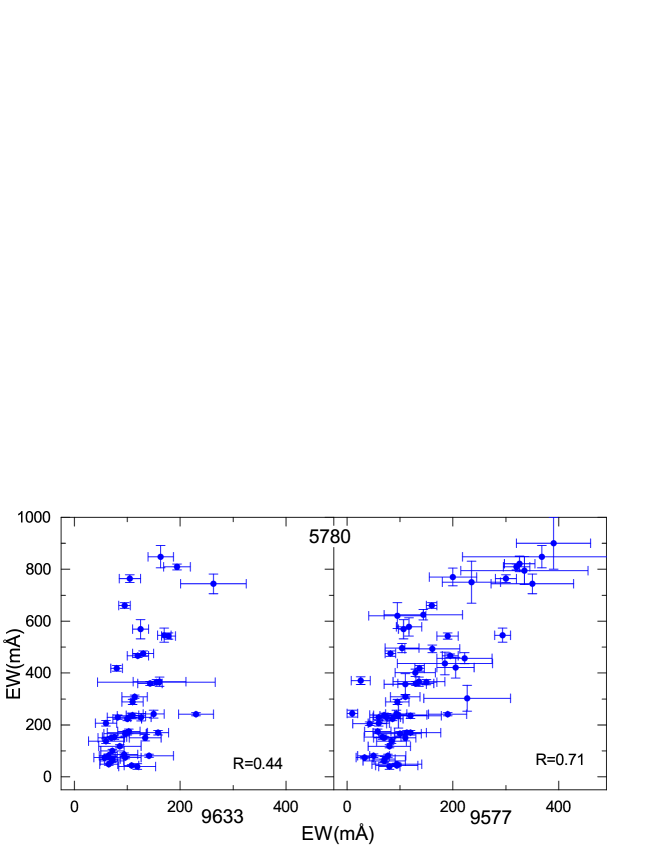
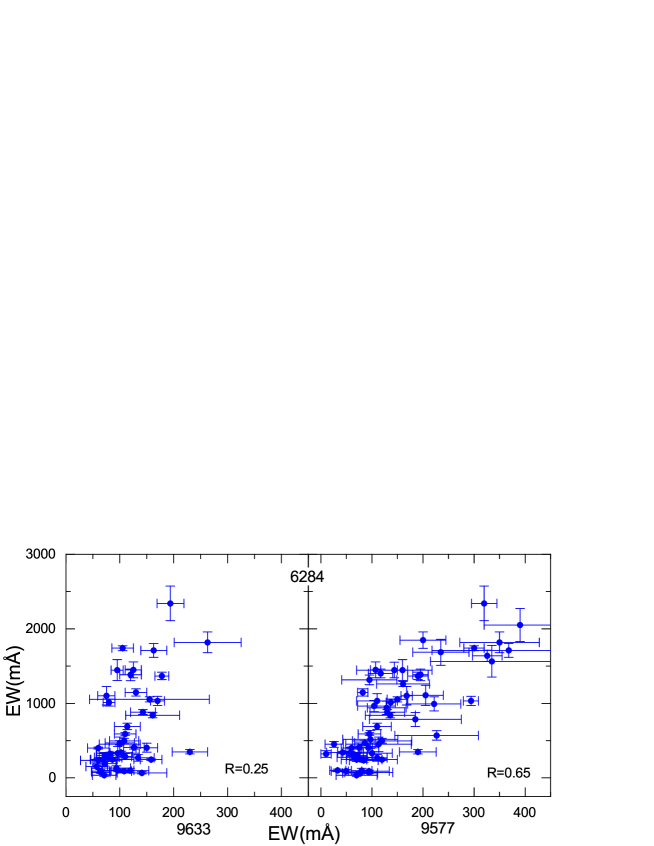
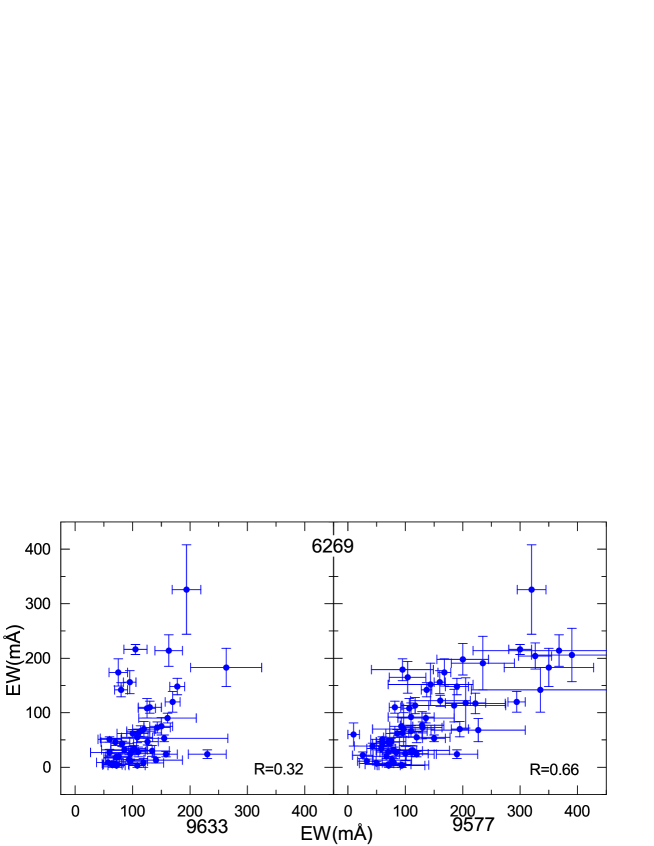
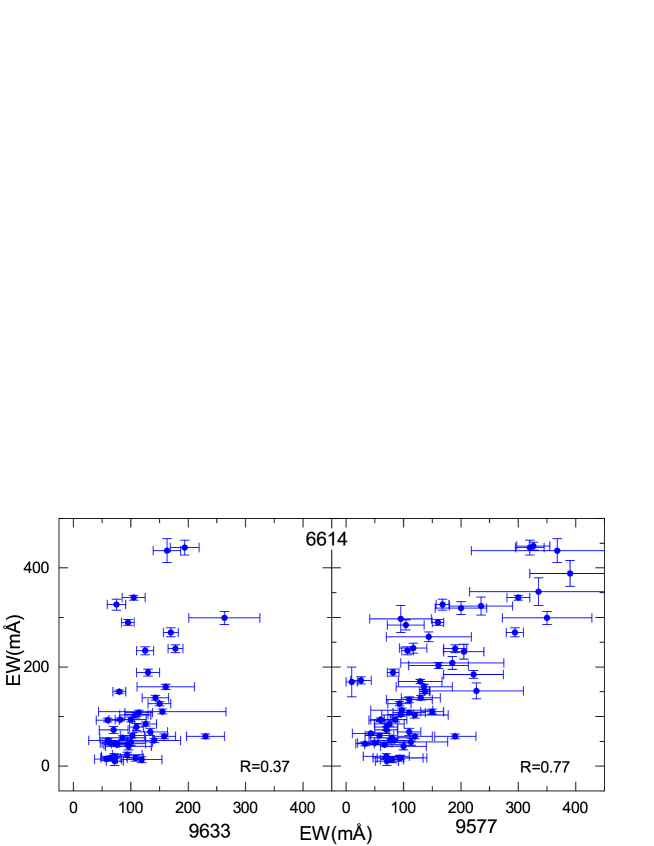
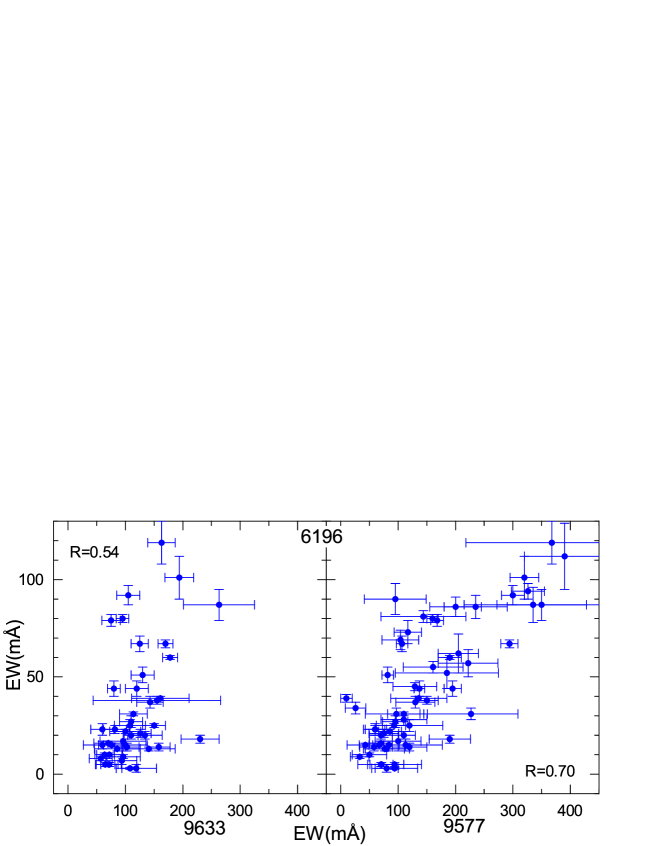
As mentioned in the Introduction, diffuse bands usually do correlate quite tightly. Even the major DIBs 5780 and 5797 Å, well known as being of a very variable depth ratio (Krełowski & Westerlund 1988; Krełowski et al. 2019), exhibit reasonably well a correlation of equivalent widths if a sufficiently large sample is considered (Bailey et al. 2016). How are the DIBs 9577 and 9633 related to the other ones? Fig. 7 depicts their relations to the narrow DIB 6196. The latter is known to correlate very tightly with practically all optical DIBs, especially with the one at 6614. Both near-IR DIBs, but 9577 especially, do correlate reasonably tightly with the narrow optical DIBs. However, the correlation is poor in comparison with those between all possible optical DIBs (Moutou et al., 1999). Other DIBs usually correlate less tightly with the suspected C DIBs. 9577 is also quite well correlated with the DIB 5780 (R=0.71). However, the same correlation coefficient for 9633 is only 0.44. All correlation coefficients are listed in Tab. 2. Generally they are smaller for the DIB 9633 than for DIB 9577, although the DIB 9633 sample size is systematically smaller. This is another argument for the binary origin of the DIB 9577: like the cumulative effect of the average of many clouds increases the magnitude of mutual correlation between diffuse bands, the blending of diffuse bands smears the peculiarities and, might provoke an increasing correlation coefficient.
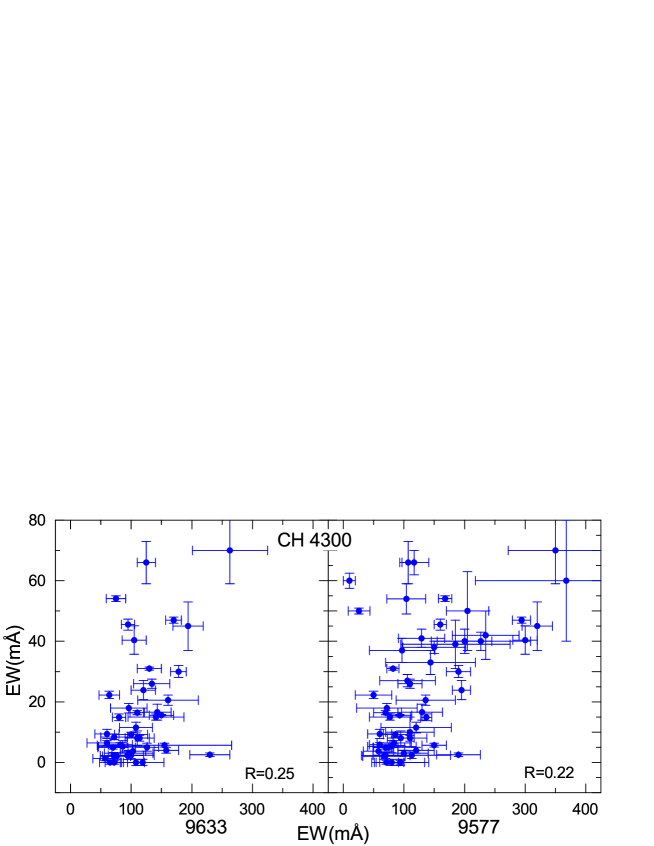
It is of interest whether the considered DIBs show any correlation with interstellar features of simple radicals. Fig. 8 illustrates the relation between the two DIBs and the strongest line of a simple CH molecule. The correlation coefficient is 0.25 and 0.22 for the DIBs 9633 and 9577, respectively, which is in fact negligible. Apparently the DIB carriers are not well mixed with the simple radicals. The correlations for CH+ and CN are not much better. On other hand, the correlation of DIBs 9577,9633 with CH+ is almost two times higher than that with CH. Perhaps this is not just a statistical fluctuation but an observational fact supporting our idea that these DIBs are stronger in -type clouds. The C2 radical seems to be the most interesting, as such small, carbon molecules may be considered as building blocks for more complex species such as C. Fig. 9 shows that apparently the abundance of C2 is not related in any way to C. This casts additional doubt on the identification of the DIBs 9577 and 9633 as carried by C.
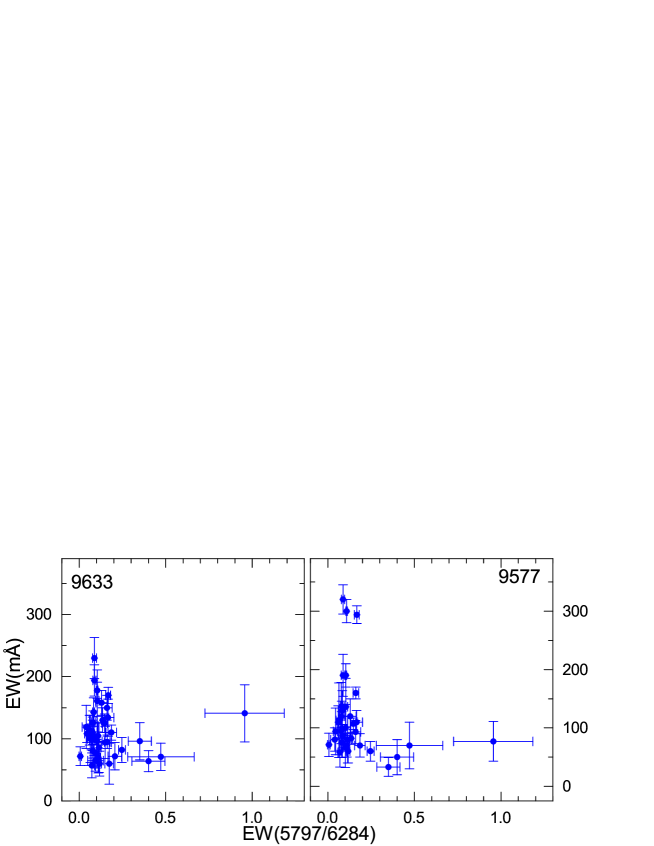
Since 1988 (Krełowski & Westerlund, 1988) interstellar clouds are being divided into and types. This division is based on the strength ratio of the major DIBs: 5780 or 6284 and 5797 or 6379. It is thus interesting how the intensities of 9577 and 9633 react to the 5797/6284 ratio. This is illustrated in Fig. 10. The points in this figure are distributed in the form of the letter "L". Narrow diffuse bands may be very strong when our so-called C DIBs are very weak. The opposite situation is possible as well. However, both sequences intercept each other. This may suggest that DIBs 9577 and 9633 are stronger in -type clouds, i.e. the carriers of these features follow the intensity of reasonably broad DIBs which are strong in the lines of sight where the UV flux from the very hot nearby stars plays an important role.
4 Conclusions
Our considerations allow us to infer the following conclusions.
-
•
The two strong, so-called C DIBs (9577 and 9633), exhibit a poor mutual correlation, which casts doubt on their common origin. However the lack of correlation can be explained, e.g. if the DIB 9577 is a blend of two features (see Fig. 6 and the text).
-
•
The relation of the two DIBs to E(B-V) is also quite poor. Again, this might be due to a possible blending effect in DIB 9577.
-
•
The intensities of the two strong DIBs are poorly related to the Hi column density and, generally, to all molecular/atomic features analyzed in this article, although the correlation coefficients vary from feature to feature (see Tab. 2). In particular, the two DIB carriers do not seem to be related to simple interstellar radicals such as CH but also CH+ and CN. A particular difficulty concerns C2 as the latter may be considered as a building block for C60.
-
•
Also, the DIBs 9633 and 9577 are stronger in -type clouds, i.e. the carriers of these features follow the intensity of reasonably broad DIBs, which are strong in the lines of sight where the UV flux from very hot nearby stars plays an important role. An additional argument in favor of this suggestion is the correlation of DIBs 9577,9633 with CH+, quite weak though but twice as high as that with CH.
Poor mutual correlation of the 9577 and 9633 diffuse bands as well poor correlations of these DIBs with other interstellar features may be partially explained by the influence of: (i) imperfection of the telluric line removal procedure, (ii) contamination by stellar lines, and finally, by (iii) an unresolved blend with other DIBs. The remedy for the first two issues is evident though not easy to perform: extensive observation of both reddened and unreddened targets with the aid of space telescopes, with subsequent correction of the intrinsic parameters of the stellar lines in order to precisely model the stellar spectra. The third issue might be quite difficult to resolve without essentially increasing measurement quality and the quantity of the studied lines of sight. Indeed, it is difficult to detect and measure precisely the moderately reddened targets in the near-IR because of the weakness of near-IR DIBs in objects lacking an essential amount of dust.
There are widely spread reports in favor of the identification of interstellar C (see, e.g. Linnartz et al. 2020, Woods 2020). However, in our opinion the identification cannot be decisively recognized without explaining the issues raised from the observational facts presented in this article.
References
- Bailey et al. (2016) Bailey, M., van Loon, J. T., Farhang, A., et al. 2016, A&A, 585, A12
- Cami et al. (2010) Cami J., Bernard-Salas J., Peeters E., Malek S.E., 2010, Science, 329, 1180
- Campbell et al. (2015) Campbell E. K., Holz M., Gerlich D., Maier J. P., 2015, Nature, 523, 322
- Campbell et al. (2016a) Campbell E. K., Holz M., Maier J.P., Gerlich D., Walker G.A.H., Bohlender D., 2016, ApJ, 822, 17
- Campbell et al. (2016b) Campbell E. K., Holz M., Maier J. P., 2016, ApJ, 826, L4
- Campbell & Maier (2018) Campbell, E. K. & Maier, J. P., 2018, ApJ, 858, 36
- Cordiner et al. (2019) Cordiner, M. A., Linnartz, H., Cox, N. L. J., Cami, J. et al. 2019, ApJ, 875, 28
- Dekker et al. (2000) Dekker, H., D’Odorico, S, Kaufer, A., Delabre, B. & Kotzlowski, H., 2000, Proc. SPIE 4008, p. 534
- Foing & Ehrenfreund (1994) Foing B. H., Ehrenfreund P., 1994, Nature, 369, 296
- Galazutdinov et al. (2000) Galazutdinov G.A., Krełowski J., Musaev F. A., Ehrenfreund P., Foing B.H., 2000, MNRAS, 317, 750
- Galazutdinov & Krełowski (2017) Galazutdinov, G. A. & Krełowski, J. 2017, Acta Astronomica 67, 159
- Galazutdinov et al. (2017) Galazutdinov G. A., Shimansky V. V., Bondar A., Valyavin G. & Krełowski, J. 2017, MNRAS, 465, 3956
- Gudennavar et al. (2012) Gudennavar S.B., Bubbly S.G., Preethi K., Murthy J., 2012, ApJ Suppl. Ser., 199, 8
- Kaufer et al. (1999) Kaufer, A. et al. 1999, The Messenger 95, 8
- Kim et al. (2007) Kim K.-M., Han I., Valyavin G.G., Plachinda S. et al., 2007, PASP, 119, 1052
- Krełowski & Westerlund (1988) Krełowski, J. & Westerlund, B. E., 1988, A&A, 190, 339
- Krełowski et al. (2016) Krełowski, J., Galazutdinov, G. A., Bondar, A. & Beletsky, Y., 2016, MNRAS, 460, 2706
- Krełowski et al. (2019) Krełowski, J., Galazutdinov, G., & Bondar, A. 2019, MNRAS, 486, 3537.
- Krełowski et al. (2020) Krełowski, J., Galazutdinov, G. A., & Siebenmorgen, R. 2020, ApJ, 899, L2
- Kroto (1985) Kroto H.W., Heath J.R., Obrien S.C., Curl R.F., Smalley R.E., 1985, Nature, 318, 162
- Lallement et al. (2018) Lallement, R., Cox, N. L. J., Cami, J., Smoker, J. et al. 2018, A&A, 614, 28
- Linnartz et al. (2020) Linnartz, H., Cami, J., Cordiner, M., et al. 2020, Journal of Molecular Spectroscopy, 367, 111243
- Moutou et al. (1999) Moutou, C.; Krełowski, J., D’Hendecourt, L. & Jamroszczak, J. 1999, A&A, 351, 680
- Musaev et al. (1999) Musaev, F. A., Galazutdinov, G. A., Sergeev, A. V., et al. 1999, Kinematics and Physics of Celestial Bodies, 15, 216
- Sellgren et al. (2010) Sellgren K., Werner, M.W., Ingalls J.G., Smith J.D.T., Carleton T. M., Joblin C., 2010, ApJ, 722, L54
- Tody (1986) Tody D., 1986, "The IRAF Data Reduction and Analysis System" in Proc. SPIE, Instrumentation in Astronomy VI, ed. D.L. Crawford, 627, 733
- Vollmann & Eversberg (2006) Vollmann, K., Eversberg, T. 2006, Astron. Nachr., 327, 862
- Walker (2015) Walker G. A. H., Bohlender D. A., Maier J. P., Campbell E. K., 2015, ApJL, 812, 8
- Walker (2016) Walker G. A. H., Campbell E. K., Maier J. P. et al. 2016, ApJ, 831, 130
- Woods (2020) Woods, P. 2020, Nature Astronomy, 4, 299