Predicting Future Cognitive Decline with Hyperbolic Stochastic Coding
Abstract
††footnotetext: Data used in preparation of this article were obtained from the Alzheimer’s Disease Neuroimaging Initiative (ADNI) database (adni.loni.usc.edu). As such, the investigators within the ADNI contributed to the design and implementation of ADNI and/or provided data but did not participate in analysis or writing of this report. A complete listing of ADNI investigators can be found at: https://adni.loni.usc.edu/wp-content/uploads/how_to_apply/ADNI_Acknowledgement_List.pdfE-mail: ylwang@asu.edu
Hyperbolic geometry has been successfully applied in modeling brain cortical and subcortical surfaces with general topological structures. However, such approaches, similar to other surface-based brain morphology analysis methods, usually generate high dimensional features. It limits their statistical power in cognitive decline prediction research, especially in datasets with limited subject numbers. To address the above limitation, we propose a novel framework termed as hyperbolic stochastic coding (HSC). We first compute diffeomorphic maps between general topological surfaces by mapping them to a canonical hyperbolic parameter space with consistent boundary conditions and extracts critical shape features. Secondly, in the hyperbolic parameter space, we introduce a farthest point sampling with breadth-first search method to obtain ring-shaped patches. Thirdly, stochastic coordinate coding and max-pooling algorithms are adopted for feature dimension reduction. We further validate the proposed system by comparing its classification accuracy with some other methods on two brain imaging datasets for Alzheimer’s disease (AD) progression studies. Our preliminary experimental results show that our algorithm achieves superior results on various classification tasks. Our work may enrich surface-based brain imaging research tools and potentially result in a diagnostic and prognostic indicator to be useful in individualized treatment strategies.
keywords:
Alzheimer’s disease (AD), Hyperbolic Space, Ring-shaped Patches, Sparse Coding, Classificationtotalfigures \NewTotalDocumentCountertotaltables \NewTotalDocumentCounterappendixchapters \DeclareAssociatedCountersfiguretotalfigures \DeclareAssociatedCounterstabletotaltables
1 Introduction
Alzheimer’s Disease (AD), an irreversible neurodegenerative disaese, is the most common cause of dementia among older adults. It is generally agreed that accurate presymptomatic diagnosis and preventive treatment of AD could have enormous public health benefits. Brain structural magnetic resonance imaging (sMRI) analysis has the potential to provide valid diagnostic biomarkers of the preclinical stage as well as symptomatic AD (Frisoni et al., 2010). For example, a single-valued sMRI-based atrophy is used as a neurodegeneration marker in the recently proposed AD descriptive “A/T/N” (amyloid, tau, neurodegeneration) system (Jack et al., 2016) to clinically define AD. Tosun et al. proposed MRI-based approaches to impute Abeta status (Tosun et al., 2014, 2016). Their results demonstrated that sMRI can be used to predict the amyloid status of MCI individuals and mild AD patients. Recently, brain morphology measures have been integrated with machine learning algorithms to classify individual subjects into different diagnostic groups (e.g. Sun et al., 2009; Ferrarini et al., 2008; Wang et al., 2013; Li et al., 2014). It offers a promising approach to computer-aided cognitive decline prediction by leveraging both sensitive brain image features and powerful machine learning techniques.
Although most brain sMRI analysis approaches use cortical and subcortical volumes (e.g. Jack et al., 2003; Vemuri et al., 2008; den Heijer et al., 2010; Wolz et al., 2010), recent research has demonstrated that surface-based analyses, (e.g. Styner et al., 2005; Thompson et al., 2004b; Ferrarini et al., 2008; Qiu et al., 2010; Costafreda et al., 2011) can offer advantages over volume measures, due to their sub-voxel accuracy and the capability of detecting subtle subregional changes. In surface-based brain imaging research, a practical approach to model brain landmark curves is to model them as surface boundaries by cutting open cortical surfaces along these landmarks. Thus they are modeled as open boundaries to be matched across subjects (Tsui et al., 2013; Shi and Wang, 2020) or be used as shape indices (Zeng et al., 2013; Shi et al., 2017). Similarly, adding open boundaries have been proved to be useful in modeling ventricular surfaces which have a concave shape and complex branching topology (Wang et al., 2010; Shi et al., 2015). We call these genus-zero surfaces with more than two open boundaries as general topological surfaces and hyperbolic geometry has been demonstrated to be useful to model general topological surfaces. However, most of current hyperbolic space-based brain imaging methods have been focused on studying group difference between diagnostic groups. To develop brain imaging methods for personal medicine research, it would be advantageous to design powerful machine learning methods that work on general topological surface features for the identification of AD symptoms on an individual basis.
One of the major challenges to directly apply vertex-wise surface features, such as surface tensor-based morphometry (TBM) (Thompson et al., 2000; Chung et al., 2008), to cognitive decline prediction research is that the surface feature dimension is usually much larger than the number of subjects, the so-called high dimension-small sample problem. Existing feature dimension reduction approaches include feature selection (Fan et al., 2005; Jain and Zongker, 1997), feature extraction (Saadi et al., 2007; Guyon et al., 2008; Scholkopft and Mullert, 1999; Jolliffe, 2011) and sparse coding-based methods (Vounou et al., 2010; Donoho, 2006; Wang et al., 2013). In most cases, information is lost when mapping high-dimenstional features into a lower-dimensional space. However, by defining a better lower-dimensional subspace, sparse coding (Lee et al., 2006; Mairal et al., 2009) may limit such information loss. Sparse coding has been previously proposed to learn an over-complete set of basis vectors (dictionary) to represent input vectors efficiently and concisely (Donoho and Elad, 2003). It has shown to be efficient for many tasks such as image deblurring (Yin et al., 2008), super-resolution (Yang et al., 2010), classification (Mairal et al., 2009), functional connectivity (Zhang et al., 2018b; Lv et al., 2015b, 2017; Jiang et al., 2015; Lv et al., 2015a) and structural morphometry analysis (Zhang et al., 2017c; Li et al., 2017). However, solving sparse coding remains a computationally challenging problem, especially when dealing with large-scale datasets and learning large size dictionaries (Lin et al., 2014).
To generalize sparse coding to process general topological surface features (Mairal et al., 2009), we propose a novel pipeline to extract sparse hyperbolic features for classification termed hyperbolic stochastic coding (HSC), consisting of our unique farthest point sampling with breadth-first search (FPSBS) method for ring-shaped surface patches extraction, stochastic coordinate coding (SCC) and max-pooling methods for feature dimension reduction, to extract critical low-dimensional shape features from the hyperbolic TBM maps. We call such features as HSC measures. Then the AdaBoost classifier (Freund and Schapire, 1997) is further adopted on these HSC measures for AD clinical group classification and cognitive decline prediction. We hypothesize that our HSC measures may outperform volume, area and shape-based cortical structural measures on discriminating clinical groups related with AD (Li et al., 2014; Ferrarini et al., 2008; Jack et al., 1999; Leung et al., 2010) We validate our system in a publicly available brain image dataset, Alzheimer’s Disease Neuroimaging Initiative (ADNI) cohort (Weiner et al., 2013). With the sMRI baseline data of 133 mild cognitive impairment (MCI) subjects, consisting of 71 MCI converter (MCIc) and 62 MCI stable (MCIs) subjects (Shi et al., 2015) and 115 subjects (30 AD, 44 MCI and 40 cognitively unimpaired (CU) subjects) (Shi and Wang, 2020), we set out to test our hypothesis by performing classification accuracy comparison with three other popular structural measures (volume, area, and shape-based biomarkers).
2 Subjects and Methods
2.1 Subjects
Data for testing the performances of our proposed HSC are obtained from the ADNI database (adni.loni.usc.edu). The ADNI was launched in 2003 as a public-private partnership, led by Principal Investigator Michael W. Weiner, MD. The primary goal of ADNI is to test whether biological markers such as serial MRI and positron emission tomography (PET), combined with clinical and neuropsychological assessments can measure the progression of MCI and early AD. Determination of sensitive biomarkers aids researchers and clinicians to develop new treatments and monitor their clinical effectiveness, as well as lessen the time and cost of clinical trials. The initial ADNI (ADNI-1) database recruited 800 subjects from over 50 sites across the U.S. and Canada and it has been followed by ADNI-GO and ADNI-2. To date, these three databases have recruited over 1500 adults, ages 55 to 90, consisting of elderly cognitive unimpaired individuals, people with early or late MCI, and people with early AD. The follow up duration of each subject is specified in their corresponding protocols for ADNI-1, ADNI-2 and ADNI-GO. Subjects of ADNI-1 and ADNI-GO had the option to be followed in ADNI-2. For up-to-date information, see www.adni-info.org.
We use two ADNI datasets to validate our system. They are the same datasets used in our prior work (Shi et al., 2015; Shi and Wang, 2020) which mainly studied group differences between different clinical groups. As a generalization of our prior work, the current work studies personalized diagnosis with the same datasets. Studies indicate that ventricular enlargement is an important measure related with AD progression (Shi et al., 2015; Thompson et al., 2004a). In Dataset I, we select 133 subjects from the MCI group in the ADNI-1 (Weiner et al., 2013) baseline dataset as (Shi et al., 2015; Zhang et al., 2016a). All subjects have both sMRI and fluorodeoxyglucose positron emission tomography (FDG-PET) data. They include 71 subjects (age: ) who develop incident AD during the subsequent 36 months, which we call the MCI converter (MCIc) group, and 62 subjects (age: years) who do not during the same period, which we call the MCI stable (MCIs) group. These subjects are chosen on the basis of having at least 36 months of longitudinal data. If a subject developed incident AD more than 36 months after baseline, it is assigned to the MCIs group. All subjects undergo thorough clinical and cognitive assessments at the time of acquisition, including the Mini-Mental State Examination (MMSE) score, Alzheimer’s disease assessment scale – Cognitive (ADAS-COG) (Rosen et al., 1984) and Auditory Verbal Learning Test (AVLT) (Rey, 1964). The demographic statistical information of this dataset is shown in Table 1.
| Group | Gender (F/M) | Education | Age | MMSE |
|---|---|---|---|---|
| MCIc | 26/45 | 15.992.73 | 74.776.81 | 26.831.60 |
| MCIs | 18/44 | 15.872.76 | 75.427.83 | 27.661.57 |
In Dataset II, we study cortical morphometry for tracking AD progression. Dataset II has 115 T1-weighted MRIs from the ADNI-1 (Weiner et al., 2013) baseline dataset, including 30 AD patients, 45 MCI subjects and 40 CU subjects (Shi and Wang, 2020). All subjects underwent through MMSE (Folstein et al., 1975). The demographic statistics with matched gender, education, age and MMSE are shown in Table 2.
| Group | Gender (F/M) | Education | Age | MMSE |
|---|---|---|---|---|
| AD | 15/15 | 15.222.61 | 76.227.34 | 23.072.02 |
| MCI | 19/26 | 16.112.56 | 73.868.20 | 26.951.34 |
| CU | 18/22 | 17.251.90 | 76.536.02 | 29.111.03 |
2.2 Overview of the Proposed Framework
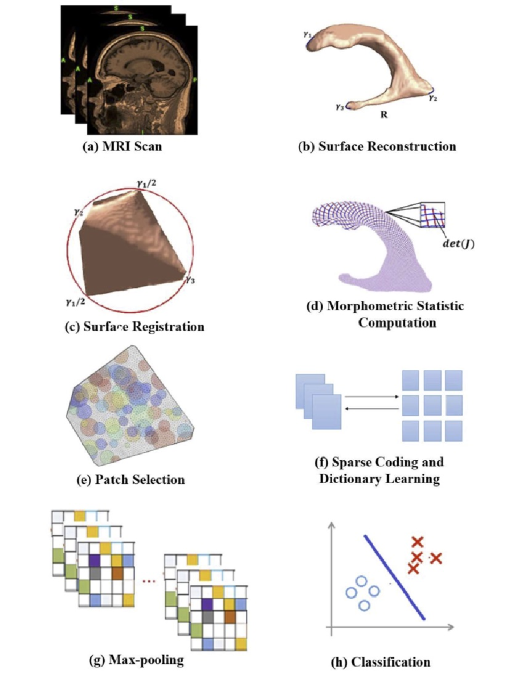
The major computational steps of our proposed work are illustrated in Fig. 1 where we take a left ventricular surface as an example. There are two major stages in the process. In the first stage, we perform ventricular surface reconstruction from MRI data, surface registration and surface TBM feature computation. The second stage is for HSC measure computation. Specifically, we build ring-shaped patches on the hyperbolic parameter space by FPSBS to initialize the original dictionary. Dictionary learning and max-pooling are performed for feature dimension reduction. Following that, Adaboost is adopted to diagnose different clinical groups and predict future AD conversions.
2.3 Brain Surface Registration with Hyperbolic Ricci Flow and Harmonic Map
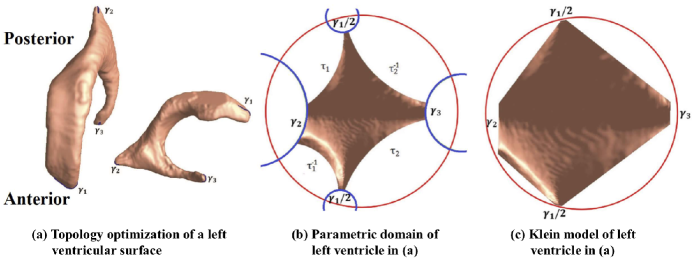
Taking a left ventricular surface as an example, the corresponding framework is summarized in Algorithm1 (Shi et al., 2015) and Fig. 1 (c). Its critical steps are shown in Fig.2. Following our prior work (Shi et al., 2015), three horns of a ventricular surface are identified and three cuts are made on these horns (Fig.2 (a)). We term this step as topology optimization. As a result, each ventricular surface becomes a topologically multiply connected surface and admits the hyperbolic geometry. We apply the hyperbolic Ricci flow method to compute its discrete hyperbolic uniformization metric. With the hyperbolic uniformization metric, we can embed onto the Poincaré disk. In the obtained Poincaré disk, we apply the geodesic curve lifting algorithm (Shi et al., 2015) to obtain a canonical parameter space (Fig.2 (b)). Furthermore, we convert the Poincaré disk to the Klein model. It converts the canonical fundamental domains of the ventricular surfaces to a Euclidean octagon, as shown in Fig.2 (c). Then we compute surface harmonic map with the Klein disk as the canonical parameter space for the following surface morphometry analysis (Shi et al., 2015).
2.4 Surface Tensor-Based Morphometry
Suppose is a map from surface to surface . The derivative map of is the linear map between the tangent spaces , induced by the map , which also defines the Jacobian matrix of . The derivative map is approximated by the linear map from one face to another one . First, we isometrically embed the triangles and onto the Klein disk, the planar coordinates of the vertices are denoted by , which represent the 3D position of points Then, the Jacobian matrix for the derivative map can be computed as
Based on the derivative map , the surface TBM is defined as , which measures the amount of local area changes in a surface with the map (Fig. 1 (d)). As pointed out in (Chung et al., 2005), each step in the processing pipeline including MRI acquisition, surface deformation, etc., are expected to introduce noise in the deformation measurement. The deformation is applied to map each subject’s surface to a template surface. The Jacobian matrices of the transformation were used per subject. To account for the noise effects, we apply surface heat kernel smoothing algorithm proposed in (Chung et al., 2005) to improve SNR in the TBM features and boost the sensitivity of statistical analysis. The vertical-wise surface TBM features are used as the inputs for dictionary learning. We use the coordinates of these vertices to localize the ring-shaped patches and we use 3-dimentional TBM features as the feature map of ring-shape patches.
2.5 Ring-Shaped Patch Selection
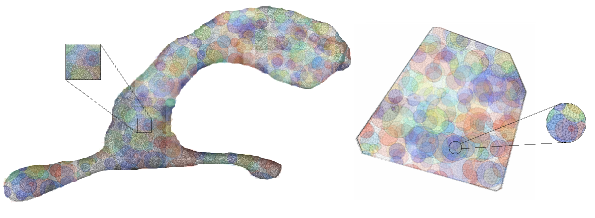
The hyperbolic space is different from the original Euclidean space. The common rectangle patch construction developed in Euclidean space (Zhang et al., 2017c) cannot be directly applied to the hyperbolic space. Therefore, we propose FPSBS on hyperbolic space to initialize dictionaries for sparse coding (Fig. 1 (e)). The intuition of the algorithm is that we want to select patches without losing the geometry information and all vertices on the hyperbolic space selected at least once. This will guarantee we learn complete information from the hyperbolic space. Fig. 3 (right) is the visualization of patch selection on the hyperbolic parameter domain. And Fig. 3 (left) projects the selected patches on the hyperbolic parameter domain back to the original ventricular surface, which still maintains the same topological structure as the parameter domain. In Fig. 3, each patch has a unique color and patches may overlap with each other. Together all patches cover the entire surfaces. In the following paragraph, we explain how these patches are selected.
We first randomly select a patch center point on the hyperbolic space , where and is the set of all discrete vertices on the hyperbolic space. We then find all vertices connected with the center point and is the -th vertex connected with . The procedure is called breadth-first search (BFS) (Patel et al., 2015), which is an algorithm for searching graph data structures. It starts at the tree root and explores the neighbor nodes first, before moving to the next level neighbors. We use the same BFS procedure to find all connected vertices with , which are . is the number of connected vertices with center point . Finally, we get a vertex set (no duplicate vertices) as follows, we call it a selected ring-shape patch on hyperbolic space and the patch center is .
| (1) |
The dimension of is and . We construct the topological patches based on hyperbolic geometry and the edge connections among different points from . is the first selected patch. To select the second patch center, we sample the farthest point with , s.t. radius . We now find the second patch center with the farthest distance of . We follow the farthest point sampling scheme (Moenning and Dodgson, 2003), the sampling principle is repeatedly placing the next sample point in the middle of the least known area of the sampling domain, which can guarantee the randomness of the patch selection.
Here, is the hyperbolic distance in the Klein model. Given two points and , draw a straight line between them; the straight line intersects the unit circle at points and , so is defined as follows:
| (2) |
where and .
denotes the set of selected patch centers ( when we compute ). After selecting the second patch , we add into (). We iterate the patch selection procedure times to get patches which cover every surface vertex at least once ( patches on each side result in patches per subject). The details of FPSBS are summarized in Algorithm 2.
2.6 Sparse Coding and Dictionary Learning
We model surface TBM features as a sparse linear combination of atoms selected from a dictionary which is initialized by FPSBS on the hyperbolic parameter space. This modeling procedure is known as sparse coding (Mairal et al., 2009). Our aim is to reduce the original surfaces dimension with the over-complete dictionary and find a linear combination of the dictionary bases to reconstruct the original surface statistics. The problem statement of sparse coding is described as below.
Given a finite training set of ring-shaped patches (as the description in Sec II. C) , and , , where is the dimension of each ring-shaped patch and is the total number of patches. In this paper, we use superscript to represent -th epoch and use subscript to represent -th coordinate. We use boldface lower case letters to denote vectors and use boldface upper case letters to denote matrices. We then learn dictionary and sparse codes for these input patch features using sparse coding.
We use to represent the optimization problem of sparse coding for each patch :
| (3) |
where is the regularization parameter, is the standard Euclidean norm and . In Eq. 3, each input vector will be represented by a linear combination of a few basis vectors of a dictionary. The first term of Eq. 3 is the reconstruction error, which measures how well the new feature represents the input vector. The second term of Eq. 3 ensures the sparsity of the learned feature . Each is often called the sparse code. Since is sparse, there are only a few entries in which are non-zero. We call its non-zero entries as its support, i.e., supp() . is so called dictionary, each column represents a basis vector.
Specifically, suppose there are atoms , where the number of atoms is much smaller than (the total number of training image patches) but larger than (the dimension of the image patches). can be represented by . In this way, the -dimensional vector is represented by a -dimensional vector (). To prevent an arbitrary scaling of the sparse codes, the columns are constrained by , s.t. . Thus, we use to represent the sparse coding problem for , we then rewrite as a matrix factorization problem:
| (4) |
where is the Frobenius norm. Eq. 4 is a non-convex problem. However, it is a convex problem when either or is fixed. When the dictionary is fixed, solving each sparse code is a Lasso problem (Tibshirani, 1994). Otherwise, when the are fixed, it becomes a simple quadratic problem. Here we adopt the SCC method (Lin et al., 2014) to optimize Eq. 4, which has been studied in a number of prior work (e.g., Lin et al., 2014; Lv et al., 2015a, b, 2017; Zhang et al., 2017a, 2016a, c, 2018a). Following Lin et al. (2014), we update via one or a few steps of coordinate descent (CD) (Wu and Lange, 2008):
| (5) |
The updated sparse code is then denoted by . A detailed derivation of CD utilizing software thresholding shrinkage function (Combettes and Wajs, 2005) can be found in Lin et al. (2014). We then update the dictionary by using stochastic gradient descent (SGD) (Bottou, 1998):
| (6) |
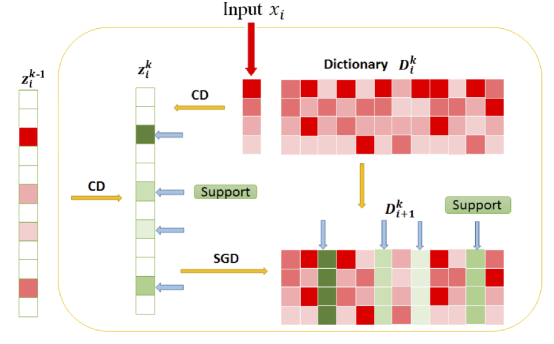
where is the shrinkage function, is the feasible set of and is the learning rate of -th step in -th epoch. We set the learning rate as an approximation of the inverse of the Hessian matrix . We illustrate the algorithmic framework in Fig. 4. At each iteration, with a ring-shaped patch , we perform one step of CD to find the supports of the sparse code . Next, we perform a few steps of CD on the supports to obtain a new sparse code . Then we update the supports of the dictionary by the second order SGD to obtain a new dictionary .
2.7 Max-Pooling and Adaboost Classifier
With a trained dictionary , for a set of ring-shaped patches from a new subject, , , is the patch number of an individual subject, we can learn its sparse features , . In theory, one could use all learned features as input data of a classifier but it poses intractable computational challenges. Thus, to describe our surface features efficiently, one natural approach is to aggregate statistics of these features at various locations. A key component of deep learning models, max-pooling (Boureau et al., 2010) takes the most responsive node of a given region of interest. In our system, we borrow the idea of max-pooling and apply it to the extracted sparse coding surface features (sparse codes) from HSC (Fig. 1 (g)). Specifically, one could compute the max value for each feature ( features obtained from HSC) over all patches ( patches per subject), which is equivalent to applying a high-pass filter to the learned sparse codes. These summary statistics are much lower in dimension compared to using all of the learned surface patch features and reduce over fitting. Finally, Adaboost (Rojas, 2009) classifier is used for binary classification, as shown in Fig. 1 (h).
3 Results
3.1 Dataset I: MCI Converter vs. MCI stable Subjects
In Dataset I, we try to use ventricular morphometry features to discriminate between MCIc and MCIs subjects. To extract hyperbolic surface features, we automatically segment lateral ventricular volumes with the multi-atlas fluid image alignment (MAFIA) method (Chou et al., 2010) from each MRI scan. We then use a topology-preserving level set method (Han et al., 2009) to build surface models and the marching cube algorithm (Lorensen and Cline, 1987) is applied to construct triangular surface meshes (Fig. 1 (b)). After the topology optimization, we apply hyperbolic Ricci flow method and conformally map the ventricular surface to the Poincaré disk and register them via harmonic map (Shi et al., 2015). We finally compute the surface TBM features (Shi et al., 2015) and smooth them with surface heat kernel method (Chung et al., 2005).
Here we select ring-shaped patches (300-vertex, Fig. 3) by the FPSBS method (Alg. 2) on each side of ventricle for each subject and finally have ring-shaped patches. The generated patches are consistent across all subjects since surfaces are registered already (Shi et al., 2015). Surface TBM is a scalar feature defined on each vertex on the hyperbolic domain so the feature number of each subject is (, in notations of Sec. 2.6, 2.7). We initialize the dictionary via selecting random patches (Coates and Ng, 2011), which has been shown to be a very efficient method in practice. Then we learn the dictionary and sparse codes by HSC using the initial dictionary. All our experiments involve training for ten epochs with a batch size of one. After the optimization, all subjects use the same dictionary (, in notation of Sec. 2.6). With the sparse coding, we obtain samples each of which has sparse codes per subject. After that, max-pooling is adopted to choose the maximum value for each sparse code as a feature on these samples. Our final feature dimension for classification is per subject.
We take a nested cross-validation approach by pre-separating training, validation and testing sets. Specifically, we use the ratio of 7:1:2 for training, validation and testing. We select the hyper parameters based on the validation set and test all methods on the same testing set. Besides, we also compare our work with some other measures and methods. We compute bilateral ventricular volumes and surface areas, which are used as MRI biomarkers in AD research. We also compare HSC with a ventricular surface shape method in (Ferrarini et al., 2008) (Shape), which automatically generates comparable meshes of all ventricles. The deformations based on the morphometry model are employed with repeated permutation tests and then used as geometry features. With our ventricle surface registration results, we follow the Shape work (Ferrarini et al., 2008) for selecting biomarkers and use support vector machine (SVM) for classification on the same dataset. We implement the low-rank shared dictionary learning (LRSDL) method, based on the paper (Vu and Monga, 2017) and the github source code 111 https://github.com/tiepvupsu/DICTOL_python. We select the hyper-parameter for LRSDL by using the same strategy as HSC on the training set. We run LRSDL 50 iterations with , , , , . Same as HSC, we apply the LRSDL on ring-shape patches and apply max-pooling as post processing on the learnt sparse codes. The same classifier is applied on the learnt features on the same test set as HSC. We test HSC, Shape, volume, area and LRSDL measures on the left, right and whole ventricle, respectively. Accuracy (ACC), Sensitivity (SEN), Specificity (SPE) and compute Area Under The Curve (AUC) are computed to evaluate classification results. Table 3 shows classification performances of four methods.
| Dataset I | HSC | Shape | Volume | Area | LRSDL | |
|---|---|---|---|---|---|---|
| whole | ACC | 85.19% | 70.37% | 66.67% | 59.26% | 77.78% |
| SEN | 76.92% | 100.00% | 85.71% | 78.57% | 75.00% | |
| SPE | 81.25% | 57.89% | 63.16% | 57.89% | 80.00% | |
| AUC | 0.8516 | 0.7857 | 0.6731 | 0.5934 | 0.7775 | |
| left | ACC | 74.07% | 81.48% | 62.96% | 59.26% | 70.37% |
| SEN | 76.92% | 76.92% | 61.54% | 83.33% | 76.92% | |
| SPE | 71.43% | 75.00% | 56.52% | 52.63% | 64.29% | |
| AUC | 0.7418 | 0.8159 | 0.6264 | 0.5907 | 0.706 | |
| right | ACC | 70.37% | 66.67% | 62.96% | 59.26% | 70.37% |
| SEN | 53.85% | 84.62% | 84.62% | 78.57% | 69.23% | |
| SPE | 78.57% | 57.14% | 57.89% | 57.89% | 71.43% | |
| AUC | 0.7088 | 0.6703 | 0.6319 | 0.5879 | 0.7033 |
From the experimental results, we can find that the best accuracy (85.19%) and the best specificity (81.25%) are achieved when we use TBM features on ventricle hyperbolic space of both sides (whole) for training and testing. The comparison shows that our new framework selects better features, and achieves better and more meaningful classification results. The HSC algorithm with whole ventricle TBM features achieves the best AUC (0.8516). The comparison demonstrates that our proposed algorithm may be useful for AD diagnosis and prognosis research.
3.2 Dataset II: ADNI Baseline Cortical Surfaces
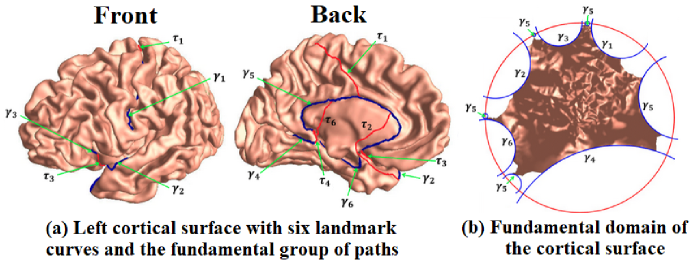
Many researches have analyzed that the cortial surface morphometry is a valid imaging biomarker for AD (Shi and Wang, 2020; Thompson et al., 2004b; Chung et al., 2008). In Dataset II, we apply HSC to analyze cortical morphometry for AD related clinical group classification. We use the left hemispheric cerebral cortices and follow (Shi and Wang, 2020) to preprocess cortical surface data. We first use FreeSurfer software (Fischl, 2012) to preprocess the MRIs of 115 subjects and reconstruct their left cortical surfaces. The Caret software (Van Essen, 2012) is then used to automatically label six major brain landmarks, which include the Central Sulcus, Anterior Half of the Superior Temporal Gyrus, Sylvian Fissure, Calcarine Sulcus, Medial Wall Ventral Segment and Medial Wall Dorsal Segment. Fig. 5 (a) shows an example of the landmark curves on the left cortical surface, where the six landmark curves are modeled as open boundaries and denoted as . The fundamental group of paths are computed by connecting boundary to every other boundary and the path is denoted as . Fig. 5 (b) shows that they are embedded into the Poincaré disk. After we cut the cortical surfaces along the delineated landmark curves, the cortical surfaces become genus-0 surfaces with six open boundaries. We finally randomly select the left cortical surface of a CU subject, who is not in the studied subject dataset, as the template surface, and perform the processing steps described in Sec. 2.3 and Sec. 2.4 to get the hyperbolic surface TBM features.
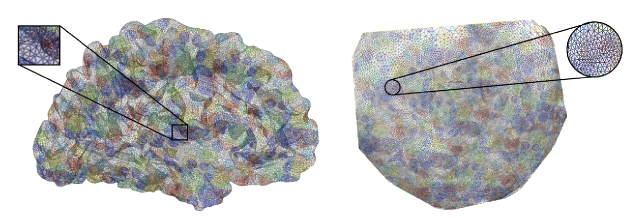
For Dataset II, since there are only 115 subject for three classes, we use the same hyperparameter as what we used in Dataset I for training. We apply five-fold cross-validation to evaluate our algorithm, which guarantees the model is tested on all subjects. All experiments are trained for epochs with a batch size of 1. The regularization parameter is set to , is a classical normalization factor (Bickel et al., 2009) and the constant 1.2 has been shown to produce about 10 non-zero coefficients. We select ring-shaped patches as shown in Fig. 6 by FPSBS on the cortical surface and we have ring-shaped patches for Dataset II. Fig. 6 (right) is the visualization of cortical morphometry on the hyperbolic parameter domain and Fig. 6 (left) projects the selected patches on the hyperbolic parameter domain back to the original cortical surface. Our FPSBS patch selection algorithm can maintain the same topological structure as the parameter domain.
After learning the sparse codes via HSC, we apply max-pooling (Boureau et al., 2010) for further dimension reduction. Finally, we employ the Adaboost (Rojas, 2009) to do the binary classification and distinguish individuals from different groups. We report the classification results of (1) AD vs. CU, (2) AD vs. MCI and (3) MCI vs. CU in Table 4.
| Dataset II | AD vs. CU | AD vs. MCI | MCI vs. CU |
|---|---|---|---|
| ACC | 88.57% | 82.67% | 80% |
| SEN | 89.29% | 84.00% | 79.17% |
| SPE | 83.33% | 70.00% | 84.44% |
| AUC | 0.879 | 0.8111 | 0.7944 |
In our prior work (Shi and Wang, 2020), we have shown that the hyperbolic surface features are significantly associated with the diagnostic disease severity. However, it is difficult to directly use hyperbolic surface features for different stages of disease diagnosis classification due to the large amount of features and limited subject numbers. Table 4 shows that HSC overcomes the above issue and FPSBS has a good generalization capability to capture the meaningful features from ring-shaped patches. HSC works well on even more subtle difference classification problem (CU vs. MCI) compared with AD vs. CU. Our new framework makes meaningful and high performances on different groups and may be useful for AD diagnosis and prognosis researches.
4 Discussion
The current work presents our initial efforts to develop efficient machine learning methods to work with brain sMRI features computed from general topological surfaces. We validate our proposed FPSBS and HSC methods on two datasets and the preliminary experimental results demonstrate that the proposed algorithms outperform some other works on classification accuracy. By reducing the dimension of hyperbolic TBM features with the novel HSC algorithm, the present study is capable of applying the low-dimensional HSC measures to diagnose AD and its prodromal stages. In Dataset I, the proposed system successfully distinguishes the ventricular HSC measures of MCIc subjects from MCIs subjects with a higher accuracy () than the classification systems using whole ventricular volume, area and surface-based biomarkers. In Dataset II, the proposed system has an outstanding performance to discriminate the cortical HSC measures of AD, MCI and CU groups (accuracy). These experimental results are consistent with our hypothesis that the lower-dimensional TBM statistics (or HSC measures) may outperform volume, area and shape-based structural measures on discriminating kinds of symptomatic groups related with AD.
Our study has two main findings. First, in order to better initialize the dictionary for sparse coding on the hyperbolic parameter domain, we propose a ring-shaped patch selection algorithm – FPSBS – to capture the surface features. The extracted patch structures help reduce feature noises and enhance statistical power of the computed surface TBM features. Second, we propose an efficient sparse coding and dictionary framework defined in the hyperbolic parameter space – HSC. To the best of our knowledge, HSC is the first sparse coding framework which is designed for general topological surfaces admitting the hyperbolic geometry. Our work may shed new lights on how to extract important surface features from hyperbolic geometry analyses.
In this paper, similar to our prior work on Euclidean parameter domain (Zhang et al., 2016b) and spherical parameter domain (Zhang et al., 2017b) , we propose patch-based sparse coding feature selection method to leverage the surface analysis for early disease diagnosis. Differently, our current ring-shaped patch selection algorithm, farthest point sampling with breadth-first search (FPSBS) method, captures the surface features within the hyperbolic space. The proposed FPSBS method can better capture surface features to initialize the dictionary for sparse coding. It is worth noting that the FPSBS is a general algorithm and can also be applied to any Riemann surfaces. The current application to surfaces with general topology is remarkable because, different from Euclidean and spherical parameter domains, it is difficult to generate regular grids on the hyperbolic parameter domain. Our method provides a convenient way to take advantage of the intrinsic geometry structure of hyperbolic parameter domain and generate efficient patch coverage for surfaces with general topology. Therefore, the ring shaped patch selection is an important component of the current brain image analysis system.
We present an efficient sparse coding and dictionary learning method which works on features extracted from surfaces with general topology admitting the hyperbolic geometry. The work is a generalization and enrichment of existing SCC research (Lin et al., 2014; Lv et al., 2015a, b, 2017; Zhang et al., 2016a, 2017c, 2018a, 2017a). Overall, our work show that the proposed HSC may extract critical shape features for classifying different stages of AD. Our work should be very useful and meaningful in brain image analysis, shape analysis and machine learning research. HSC has the potential to be a useful tool to study 3D surfaces with general topology structures.
To identify patients as early as possible in the course of MCI, ADNI subdivided MCI into “early” and “late” stages based on the Wechsler Memory Scale-Revised (WMS-R) Logical Memory II Story A score (Petersen et al., 2010). Studies under this MCI staging framework reveal distinguished biomarkers of “early” MCIs (EMCL) as compared to other clinical groups (Wee et al., 2019; Tosun et al., 2014). We also applied our proposed method on EMCI and “late” MCI (LMCI) in our recent work, and achieved 84% accuracy, on ADNI2-dataset with 37 LMCI and 73 EMCI (Zhang et al., 2017b). However, studies of (Brooks et al., 2007, 2008; De Rotrou et al., 2005) show that it is overinclusive to use this ADNI staging method based on a single test score, the study of (Edmonds et al., 2019) revealed that ADNI’s early MCI group included a large proportion (56%) of false-positive diagnostic errors.
Another important problem in AD diagnosis research is to identify the probability of MCI patients converting to dementia. Identifying MCI converters from the MCI stable is critical for clinical management. Based on MRI data, Shi et al. (2015) successfully revealed significant ventricular morphometry differences between MCI converter group and MCI stable group using a novel ventricular morphometry analysis system. Using the same MRI cohorts, this work further proposes HSC to extract effective structural features and classify 71 MCI converters versus 62 nonconverters. The AUC is 0.85. Moradi et al. (2015) proposed a low density separation scheme to learn aggregate biomarkers to discriminate 164 MCI converters from 100 stable MCI patients. They achieved a 0.7661 AUC. The study of (Sørensen et al., 2016) applied hippocampal texture features and support vector machine (SVM) classifier to predict 8 MCI converters versus 17 nonconverters. The best prognostic AUC was 0.83. Chincarini et al. (2011) applied a medial temporal lobe intensity and textural features and SVM classifier to separate 136 MCI converters from 166 MCI non converters with AUC=0.74. Collij et al. (2016) applied SVM classifier to predict arterial spin labeling perfusion maps of 12 patients with MCI diagnosis converted to AD versus 12 subjects with stable MCI. The AUC was 0.71. Table 5 presents the AUC values of this work and the above studies. Compared to other single modality neuroimaging-based classifiers, our proposed system has a larger or comparable AUC on predicting MCI converters versus nonconverters. There are also studies demonstrating that multimodality machine learning models have superior performances than single modality classifiers (Varatharajah et al., 2019; Rathore et al., 2017; Moradi et al., 2015). We have developed a series of surface-based biomarkers of various brain structures for AD research (Dong et al., 2020b; Wang et al., 2010, 2011; Dong et al., 2019; Fan et al., 2018). Our latest work (Dong et al., 2020a) has indicated that combining these biomarkers could empower the prediction of AD progression. In future work, we expect to improve the MCI conversion prediction performance by introducing these effective multiple statistics. We also note that the study (Edmonds et al., 2019) proposed a neuropsychological approach to improve the reliability of staging early and late MCI. We expect that our biomarkers for predicting MCI converters versus nonconverters also work well with reliable neuropsychological tests for staging early and late MCI. We will study it in our future work.
| Method | Subjects (MCIc/MCInc) | Feature | AUC | |||
| HSC (this paper) | 71/62 |
|
0.85 | |||
|
164/100 | Gray matter density | 0.77 | |||
|
8/17 | Hippocampal texture | 0.83 | |||
| SVM (Chincarini et al., 2011) | 136/166 |
|
0.74 | |||
| SVM (Collij et al., 2016) | 12/12 |
|
0.71 |
There are three important caveats when applying the proposed framework to AD diagnosis and prognosis. First, because of the overlapping patch selection and max-pooling scheme, we generally cannot visualize the selected features and it decreases the comprehensibility although we may always visualize statistically significant regions in our prior group difference studies (Shi et al., 2013; Wang et al., 2013). However, our recent work (Zhang et al., 2018a) made some progress which may potentially better address this problem. In our recent work (Zhang et al., 2018a), instead of randomly selecting patches to build the initial dictionary, we use group lasso screening to select the most significant features. Therefore, the features used in sparse coding may be visualized on the surface map. In future, we will incorporate this idea into our current framework to improve its interpretation ability. Second, our current work, similar to several other work (e.g. Fan et al., 2007; Colliot et al., 2008; Klöppel et al., 2008; Gerardin et al., 2009; Magnin et al., 2009; Cuingnet et al., 2011; Liu et al., 2011; Shen et al., 2012; Ben Ahmed et al., 2015), uses clinical diagnoses as the “ground truth” diagnoses for training and cross-validation. However, some recent work (e.g. Beach et al., 2012) has reported that neuropathological diagnoses only had limited accuracy values (e.g. only 80 - 90% of the labels are correct) when confirmed with AD histopathology. Under this limitation, we should be cautious when making inferences and conclusions on our work for the AD diagnosis since our discovered features are not necessarily real AD biomarkers. Even so, our recent work (Wu et al., 2018) has studied hippocampal morphometry on a cohort consisting of positive AD () and matched negative cognitively unimpaired subjects () where positivity was determined using mean-cortical standard uptake value ratio (SUVR) with cerebellum as the reference region over the amyloid PET images. With our Euclidean SCC work (Zhang et al., 2016b) integrating the proposed HSC and MP methods, we achieved an accuracy rate of 90.48% in that task (Wu et al., 2018). The results demonstrate that our proposed framework may potentially help discover pathology-confirmed AD biomarkers. Third, as our initial attempt to integrate geometry analysis and machine learning method for AD diagnosis, the current work reports very limited experimental results since we mainly reuse the data in our prior published work (Shi et al., 2015; Shi and Wang, 2020). The geometry analysis part involves multiple steps, including image segmentation, surface registration, surface parameterization, etc. Our ongoing work, e.g. (Mi et al., 2020), is developing novel approaches which will make the whole process more automatic and more accurate. Once they are available, we will apply the proposed method to analyze more longitudinal ADNI data.
5 Conclusions and Future Works
Here we present a hyperbolic sparse coding with ring-shaped patch selection algorithm, which may improve the accuracy for AD diagnosis and prognosis with sMRI biomarkers. In the future, we will explore whether the proposed framework will work with other shape statistics, such as spherical harmonics and radial distance. In our previous preclinical AD study (Dong et al., 2019), we found APOE-e4 does effects on hippocampal morphometry of cognitively unimpaired subjects. In our future work, we will further explore whether the proposed FPSBS and HSC methods are useful for such preclinical AD study.
Acknowledgements
This research is supported in part by National Institutes of Health (RF1AG051710, R21AG065942, R01EB025032, U54EB020403, R01AG031581 and P30AG19610), National Science Foundation (IIS-1421165) and Arizona Alzheimer’s Consortium.
Data collection and sharing for this project was funded by the Alzheimer’s Disease Neuroimaging Initiative (ADNI) (National Institutes of Health Grant U01 AG024904) and DOD ADNI (Department of Defense award number W81XWH-12-2-0012). ADNI is funded by the National Institute on Aging, the National Institute of Biomedical Imaging and Bioengineering, and through generous contributions from the following: AbbVie, Alzheimers Association; Alzheimers Drug Discovery Foundation; Araclon Biotech; BioClinica, Inc.; Biogen; Bristol-Myers Squibb Company; CereSpir, Inc.; Cogstate; Eisai Inc.; Elan Pharmaceuticals, Inc.; Eli Lilly and Company; EuroImmun; F. Hoffmann-La Roche Ltd and its affiliated company Genentech, Inc.; Fujirebio; GE Healthcare; IXICO Ltd.; Janssen Alzheimer Immunotherapy Research & Development, LLC.; Johnson & Johnson harmaceutical Research & Development LLC.; Lumosity; Lundbeck; Merck & Co., Inc.; Meso Scale Diagnostics, LLC.; NeuroRx Research; Neurotrack Technologies; Novartis Pharmaceuticals Corporation; Pfizer Inc.; Piramal Imaging; Servier; Takeda Pharmaceutical Company; and Transition Therapeutics. The Canadian Institutes of Health Research is providing funds to support ADNI clinical sites in Canada. Private sector contributions are facilitated by the Foundation for the National Institutes of Health (www.fnih.org). The grantee organization is the Northern California Institute for Research and Education, and the study is coordinated by the Alzheimers Therapeutic Research Institute at the University of Southern California. ADNI data are disseminated by the Laboratory for NeuroImaging at the University of Southern California.
References
References
- Beach et al. (2012) Beach, T.G., Monsell, S.E., Phillips, L.E., Kukull, W., 2012. Accuracy of the clinical diagnosis of Alzheimer disease at National Institute on Aging Alzheimer Disease Centers, 2005-2010. J. Neuropathol. Exp. Neurol. 71, 266–273.
- Ben Ahmed et al. (2015) Ben Ahmed, O., Mizotin, M., Benois-Pineau, J., Allard, M., Catheline, G., Ben Amar, C., 2015. Alzheimer’s disease diagnosis on structural MR images using circular harmonic functions descriptors on hippocampus and posterior cingulate cortex. Comput Med Imaging Graph 44, 13–25.
- Bickel et al. (2009) Bickel, P.J., Ritov, Y., Tsybakov, A.B., 2009. Simultaneous analysis of lasso and dantzig selector. The Annals of Statistics , 1705–1732.
- Bottou (1998) Bottou, L., 1998. Online learning and stochastic approximation. Online Learning and Neural Networks, Cambridge University Press, Cambridge, UK .
- Boureau et al. (2010) Boureau, Y.L., Ponce, J., LeCun, Y., 2010. A theoretical analysis of feature pooling in visual recognition, in: Proceedings of the 27th international conference on machine learning (ICML-10), pp. 111–118.
- Brooks et al. (2008) Brooks, B.L., Iverson, G.L., Holdnack, J.A., Feldman, H.H., 2008. Potential for misclassification of mild cognitive impairment: A study of memory scores on the Wechsler Memory Scale-III in healthy older adults. Journal of the International Neuropsychological Society 14, 463–478.
- Brooks et al. (2007) Brooks, B.L., Iverson, G.L., White, T., 2007. Substantial risk of “Accidental MCI” in healthy older adults: Base rates of low memory scores in neuropsychological assessment. Journal of the International Neuropsychological Society 13, 490–500.
- Chincarini et al. (2011) Chincarini, A., Bosco, P., Calvini, P., Gemme, G., Esposito, M., Olivieri, C., Rei, L., Squarcia, S., Rodriguez, G., Bellotti, R., et al., 2011. Local MRI analysis approach in the diagnosis of early and prodromal Alzheimer’s disease. Neuroimage 58, 469–480.
- Chou et al. (2010) Chou, Y.Y., Leporé, N., Saharan, P., Madsen, S.K., Hua, X., Jack, C.R., Shaw, L.M., Trojanowski, J.Q., Weiner, M.W., Toga, A.W., et al., 2010. Ventricular maps in 804 ADNI subjects: correlations with CSF biomarkers and clinical decline. Neurobiology of aging 31, 1386–1400.
- Chung et al. (2008) Chung, M.K., Dalton, K.M., Davidson, R.J., 2008. Tensor-based cortical surface morphometry via weighted spherical harmonic representation. Medical Imaging, IEEE Transactions on 27, 1143–1151.
- Chung et al. (2005) Chung, M.K., Robbins, S.M., Dalton, K.M., Davidson, R.J., Alexander, A.L., Evans, A.C., 2005. Cortical thickness analysis in autism with heat kernel smoothing. NeuroImage 25, 1256–1265.
- Coates and Ng (2011) Coates, A., Ng, A.Y., 2011. The importance of encoding versus training with sparse coding and vector quantization, in: Proceedings of the 28th International Conference on Machine Learning (ICML-11), pp. 921–928.
- Collij et al. (2016) Collij, L.E., Heeman, F., Kuijer, J.P., Ossenkoppele, R., Benedictus, M.R., Möller, C., Verfaillie, S.C., Sanz-Arigita, E.J., van Berckel, B.N., van der Flier, W.M., , Scheltens, P., Barkhof, F., Wink, A.M., 2016. Application of machine learning to arterial spin labeling in mild cognitive impairment and Alzheimer disease. Radiology 281, 865–875.
- Colliot et al. (2008) Colliot, O., Chételat, G., Chupin, M., Desgranges, B., Magnin, B., Benali, H., Dubois, B., Garnero, L., Eustache, F., Lehéricy, S., 2008. Discrimination between alzheimer disease, mild cognitive impairment, and normal aging by using automated segmentation of the hippocampus. Radiology 248, 194–201.
- Combettes and Wajs (2005) Combettes, P.L., Wajs, V.R., 2005. Signal Recovery by Proximal Forward-Backward Splitting. Multiscale Modeling & Simulation 4, 1168–1200.
- Costafreda et al. (2011) Costafreda, S.G., Dinov, I.D., Tu, Z., Shi, Y., Liu, C.Y., Kloszewska, I., Mecocci, P., Soininen, H., Tsolaki, M., Vellas, B., Wahlund, L.O., Spenger, C., Toga, A.W., Lovestone, S., Simmons, A., 2011. Automated hippocampal shape analysis predicts the onset of dementia in Mild Cognitive Impairment. Neuroimage 56, 212–219.
- Cuingnet et al. (2011) Cuingnet, R., Gerardin, E., Tessieras, J., Auzias, G., Lehéricy, S., Habert, M.O., Chupin, M., Benali, H., Colliot, O., 2011. Automatic classification of patients with Alzheimer’s disease from structural MRI: a comparison of ten methods using the ADNI database. neuroimage 56, 766–781.
- De Rotrou et al. (2005) De Rotrou, J., Wenisch, E., Chausson, C., Dray, F., Faucounau, V., Rigaud, A.S., 2005. Accidental MCI in healthy subjects: a prospective longitudinal study. European Journal of Neurology 12, 879–885.
- Dong et al. (2020a) Dong, Q., Zhang, J., Li, Q., Wang, J., Lepore, N., Thompson, P.M., Caselli, R.J., Ye, J., Wang, Y., 2020a. Integrating convolutional neural networks and multi-task dictionary learning for cognitive decline prediction with longitudinal images. J. Alzheimers Dis. 75, 971–992.
- Dong et al. (2020b) Dong, Q., Zhang, W., Stonnington, C.M., Wu, J., Gutman, B.A., Chen, K., Su, Y., Baxter, L.C., Thompson, P.M., Reiman, E.M., Caselli, R.J., Wang, Y., 2020b. Applying surface-based morphometry to study ventricular abnormalities of cognitively unimpaired subjects prior to clinically significant memory decline. Neuroimage Clin 27, 102338.
- Dong et al. (2019) Dong, Q., Zhang, W., Wu, J., Li, B., Schron, E.H., McMahon, T., Shi, J., Gutman, B.A., Chen, K., Baxter, L.C., Thompson, P.M., Reiman, E.M., Caselli, R.J., Wang, Y., 2019. Applying surface-based hippocampal morphometry to study APOE-E4 allele dose effects in cognitively unimpaired subjects. Neuroimage Clin 22, 101744.
- Donoho (2006) Donoho, D.L., 2006. Compressed sensing. IEEE Transactions on information theory 52, 1289–1306.
- Donoho and Elad (2003) Donoho, D.L., Elad, M., 2003. Optimally sparse representation in general (nonorthogonal) dictionaries via minimization. Proc. Natl. Acad. Sci. U.S.A. 100, 2197–2202.
- Edmonds et al. (2019) Edmonds, E.C., McDonald, C.R., Marshall, A., Thomas, K.R., Eppig, J., Weigand, A.J., Delano-Wood, L., Galasko, D.R., Salmon, D.P., Bondi, M.W., 2019. Early versus late MCI: Improved MCI staging using a neuropsychological approach. Alzheimer’s & Dementia 15, 699–708.
- Fan et al. (2005) Fan, Y., Shen, D., Davatzikos, C., 2005. Classification of structural images via high-dimensional image warping, robust feature extraction, and SVM. Med Image Comput Comput Assist Interv 8, 1–8.
- Fan et al. (2007) Fan, Y., Shen, D., Gur, R.C., Gur, R.E., Davatzikos, C., 2007. COMPARE: classification of morphological patterns using adaptive regional elements. IEEE Trans Med Imaging 26, 93–105.
- Fan et al. (2018) Fan, Y., Wang, G., Lepore, N., Wang, Y., 2018. A tetrahedron-based heat flux signature for cortical thickness morphometry analysis, in: International Conference on Medical Image Computing and Computer-Assisted Intervention, Springer. pp. 420–428.
- Ferrarini et al. (2008) Ferrarini, L., Palm, W.M., Olofsen, H., van der Landen, R., van Buchem, M.A., Reiber, J.H., Admiraal-Behloul, F., 2008. Ventricular shape biomarkers for Alzheimer’s disease in clinical MR images. Magn Reson Med 59, 260–267.
- Fischl (2012) Fischl, B., 2012. Freesurfer. Neuroimage 62, 774–781.
- Folstein et al. (1975) Folstein, M.F., Folstein, S.E., McHugh, P.R., 1975. “mini-mental state”: a practical method for grading the cognitive state of patients for the clinician. Journal of psychiatric research 12, 189–198.
- Freund and Schapire (1997) Freund, Y., Schapire, R.E., 1997. A decision-theoretic generalization of on-line learning and an application to boosting. Journal of computer and system sciences 55, 119–139.
- Frisoni et al. (2010) Frisoni, G.B., Fox, N.C., Jack, C.R., Scheltens, P., Thompson, P.M., 2010. The clinical use of structural MRI in Alzheimer disease. Nat Rev Neurol 6, 67–77.
- Gerardin et al. (2009) Gerardin, E., Chételat, G., Chupin, M., Cuingnet, R., Desgranges, B., Kim, H.S., Niethammer, M., Dubois, B., Lehéricy, S., Garnero, L., Eustache, F., Colliot, O., 2009. Multidimensional classification of hippocampal shape features discriminates Alzheimer’s disease and mild cognitive impairment from normal aging. Neuroimage 47, 1476–1486.
- Guyon et al. (2008) Guyon, I., Gunn, S., Nikravesh, M., Zadeh, L.A., 2008. Feature extraction: foundations and applications. volume 207. Springer.
- Han et al. (2009) Han, X., Xu, C., Prince, J.L., 2009. A Moving Grid Framework for Geometric Deformable Models. Int J Comput Vis 84, 63–79.
- den Heijer et al. (2010) den Heijer, T., van der Lijn, F., Koudstaal, P.J., Hofman, A., van der Lugt, A., Krestin, G.P., Niessen, W.J., Breteler, M.M., 2010. A 10-year follow-up of hippocampal volume on magnetic resonance imaging in early dementia and cognitive decline. Brain 133, 1163–1172.
- Jack et al. (1999) Jack, C., Petersen, R.C., Xu, Y.C., O’Brien, P.C., Smith, G.E., Ivnik, R.J., Boeve, B.F., Waring, S.C., Tangalos, E.G., Kokmen, E., 1999. Prediction of AD with MRI-based hippocampal volume in mild cognitive impairment. Neurology 52, 1397–1397.
- Jack et al. (2003) Jack, C., Slomkowski, M., Gracon, S., Hoover, T.M., Felmlee, J.P., Stewart, K., Xu, Y., Shiung, M., O’Brien, P.C., Cha, R., Knopman, D., Petersen, R.C., 2003. MRI as a biomarker of disease progression in a therapeutic trial of milameline for AD. Neurology 60, 253–260.
- Jack et al. (2016) Jack, C.R., Bennett, D.A., Blennow, K., Carrillo, M.C., Feldman, H.H., Frisoni, G.B., Hampel, H., Jagust, W.J., Johnson, K.A., Knopman, D.S., Petersen, R.C., Scheltens, P., Sperling, R.A., Dubois, B., 2016. A/T/N: an unbiased descriptive classification scheme for Alzheimer disease biomarkers. Neurology 87, 539–547.
- Jain and Zongker (1997) Jain, A., Zongker, D., 1997. Feature selection: Evaluation, application, and small sample performance. IEEE transactions on pattern analysis and machine intelligence 19, 153–158.
- Jiang et al. (2015) Jiang, X., Li, X., Lv, J., Zhang, T., Zhang, S., Guo, L., Liu, T., 2015. Sparse representation of HCP grayordinate data reveals novel functional architecture of cerebral cortex. Hum Brain Mapp 36, 5301–5319.
- Jolliffe (2011) Jolliffe, I., 2011. Principal component analysis, in: International encyclopedia of statistical science. Springer, pp. 1094–1096.
- Klöppel et al. (2008) Klöppel, S., Stonnington, C.M., Chu, C., Draganski, B., Scahill, R.I., Rohrer, J.D., Fox, N.C., Jack Jr, C.R., Ashburner, J., Frackowiak, R.S., 2008. Automatic classification of MR scans in Alzheimer’s disease. Brain 131, 681–689.
- Lee et al. (2006) Lee, H., Battle, A., Raina, R., Ng, A., 2006. Efficient sparse coding algorithms, in: Advances in neural information processing systems, pp. 801–808.
- Leung et al. (2010) Leung, K.K., Barnes, J., Ridgway, G.R., Bartlett, J.W., Clarkson, M.J., Macdonald, K., Schuff, N., Fox, N.C., Ourselin, S., 2010. Automated cross-sectional and longitudinal hippocampal volume measurement in mild cognitive impairment and Alzheimer’s disease. NeuroImage 51, 1345–1359.
- Li et al. (2014) Li, S., Yuan, X., Pu, F., Li, D., Fan, Y., Wu, L., Chao, W., Chen, N., He, Y., Han, Y., 2014. Abnormal changes of multidimensional surface features using multivariate pattern classification in amnestic mild cognitive impairment patients. Journal of Neuroscience 34, 10541–10553.
- Li et al. (2017) Li, Y., Chen, H., Jiang, X., Li, X., Lv, J., Li, M., Peng, H., Tsien, J.Z., Liu, T., 2017. Transcriptome Architecture of Adult Mouse Brain Revealed by Sparse Coding of Genome-Wide In Situ Hybridization Images. Neuroinformatics 15, 285–295.
- Lin et al. (2014) Lin, B., Li, Q., Sun, Q., Lai, M.J., Davidson, I., Fan, W., Ye, J., 2014. Stochastic coordinate coding and its application for drosophila gene expression pattern annotation. arXiv preprint arXiv:1407.8147 .
- Liu et al. (2011) Liu, Y., Paajanen, T., Zhang, Y., Westman, E., Wahlund, L.O., Simmons, A., Tunnard, C., Sobow, T., Mecocci, P., Tsolaki, M., Vellas, B., Muehlboeck, S., Evans, A., Spenger, C., Lovestone, S., Soininen, H., 2011. Combination analysis of neuropsychological tests and structural MRI measures in differentiating AD, MCI and control groups–the AddNeuroMed study. Neurobiol. Aging 32, 1198–1206.
- Lorensen and Cline (1987) Lorensen, W.E., Cline, H.E., 1987. Marching cubes: A high resolution 3D surface construction algorithm, in: ACM siggraph computer graphics, ACM. pp. 163–169.
- Lv et al. (2015a) Lv, J., Jiang, X., Li, X., Zhu, D., Chen, H., Zhang, T., Zhang, S., Hu, X., Han, J., Huang, H., Zhang, J., Guo, L., Liu, T., 2015a. Sparse representation of whole-brain fMRI signals for identification of functional networks. Med Image Anal 20, 112–134.
- Lv et al. (2015b) Lv, J., Jiang, X., Li, X., Zhu, D., Zhang, S., Zhao, S., Chen, H., Zhang, T., Hu, X., Han, J., Ye, J., Guo, L., Liu, T., 2015b. Holistic atlases of functional networks and interactions reveal reciprocal organizational architecture of cortical function. IEEE Trans Biomed Eng 62, 1120–1131.
- Lv et al. (2017) Lv, J., Lin, B., Li, Q., Zhang, W., Zhao, Y., Jiang, X., Guo, L., Han, J., Hu, X., Guo, C., Ye, J., Liu, T., 2017. Task fMRI data analysis based on supervised stochastic coordinate coding. Med Image Anal 38, 1–16.
- Magnin et al. (2009) Magnin, B., Mesrob, L., Kinkingnéhun, S., Pélégrini-Issac, M., Colliot, O., Sarazin, M., Dubois, B., Lehéricy, S., Benali, H., 2009. Support vector machine-based classification of Alzheimer’s disease from whole-brain anatomical MRI. Neuroradiology 51, 73–83.
- Mairal et al. (2009) Mairal, J., Bach, F., Ponce, J., Sapiro, G., 2009. Online dictionary learning for sparse coding, in: Proceedings of the 26th annual international conference on machine learning, ACM. pp. 689–696.
- Mi et al. (2020) Mi, L., Zhang, W., Wang, Y., 2020. Regularized wasserstein means for aligning distributional data, in: Proceedings of 34th Conference on Artificial Intelligence (AAAI-20), pp. 5166–5173.
- Moenning and Dodgson (2003) Moenning, C., Dodgson, N.A., 2003. Fast Marching farthest point sampling. Technical Report UCAM-CL-TR-562. University of Cambridge, Computer Laboratory. URL: https://www.cl.cam.ac.uk/techreports/UCAM-CL-TR-562.pdf.
- Moradi et al. (2015) Moradi, E., Pepe, A., Gaser, C., Huttunen, H., Tohka, J., 2015. Machine learning framework for early MRI-based Alzheimer’s conversion prediction in MCI subjects. Neuroimage 104, 398–412.
- Patel et al. (2015) Patel, J.R., Shah, T.R., Shingadiya, V.P., Patel, V.B., 2015. Comparison between breadth first search and nearest neighbor algorithm for waveguide path planning. Int. J. Research and Scientific Innovation 2, 19–21.
- Petersen et al. (2010) Petersen, R.C., Aisen, P., Beckett, L.A., Donohue, M., Gamst, A., Harvey, D.J., Jack, C., Jagust, W., Shaw, L., Toga, A., et al., 2010. Alzheimer’s disease neuroimaging initiative (ADNI): clinical characterization. Neurology 74, 201–209.
- Qiu et al. (2010) Qiu, A., Brown, T., Fischl, B., Ma, J., Miller, M.I., 2010. Atlas generation for subcortical and ventricular structures with its applications in shape analysis. IEEE Trans Image Process 19, 1539–1547.
- Rathore et al. (2017) Rathore, S., Habes, M., Iftikhar, M.A., Shacklett, A., Davatzikos, C., 2017. A review on neuroimaging-based classification studies and associated feature extraction methods for alzheimer’s disease and its prodromal stages. NeuroImage 155, 530–548.
- Rey (1964) Rey, A., 1964. L’examen clinique en psychologie. Presses Universitaires de France; Paris.
- Rojas (2009) Rojas, R., 2009. Adaboost and the super bowl of classifiers a tutorial introduction to adaptive boosting. Freie University, Berlin, Tech. Rep .
- Rosen et al. (1984) Rosen, W.G., Mohs, R.C., Davis, K.L., 1984. A new rating scale for Alzheimer’s disease. The American journal of psychiatry .
- Saadi et al. (2007) Saadi, K., Talbot, N.L., Cawley, G.C., 2007. Optimally regularised kernel Fisher discriminant classification. Neural Netw 20, 832–841.
- Scholkopft and Mullert (1999) Scholkopft, B., Mullert, K.R., 1999. Fisher discriminant analysis with kernels. Neural networks for signal processing IX 1, 1.
- Shen et al. (2012) Shen, K.K., Fripp, J., Mériaudeau, F., Chételat, G., Salvado, O., Bourgeat, P., 2012. Detecting global and local hippocampal shape changes in Alzheimer’s disease using statistical shape models. Neuroimage 59, 2155–2166.
- Shi et al. (2015) Shi, J., Stonnington, C.M., Thompson, P.M., Chen, K., Gutman, B., Reschke, C., Baxter, L.C., Reiman, E.M., Caselli, R.J., Wang, Y., 2015. Studying ventricular abnormalities in Mild Cognitive Impairment with hyperbolic Ricci flow and Tensor-based morphometry. NeuroImage 104, 1–20.
- Shi et al. (2013) Shi, J., Thompson, P.M., Gutman, B., Wang, Y., 2013. Surface fluid registration of conformal representation: application to detect disease burden and genetic influence on hippocampus. Neuroimage 78, 111–134.
- Shi and Wang (2020) Shi, J., Wang, Y., 2020. Hyperbolic Wasserstein Distance for Shape Indexing. IEEE Trans Pattern Anal Mach Intell 42, 1362–1376.
- Shi et al. (2017) Shi, J., Zhang, W., Tang, M., Caselli, R.J., Wang, Y., 2017. Conformal invariants for multiply connected surfaces: Application to landmark curve-based brain morphometry analysis. Med Image Anal 35, 517–529.
- Sørensen et al. (2016) Sørensen, L., Igel, C., Liv Hansen, N., Osler, M., Lauritzen, M., Rostrup, E., Nielsen, M., 2016. Early detection of Alzheimer’s disease using MRI hippocampal texture. Human Brain Papping 37, 1148–1161.
- Styner et al. (2005) Styner, M., Lieberman, J.A., McClure, R.K., Weinberger, D.R., Jones, D.W., Gerig, G., 2005. Morphometric analysis of lateral ventricles in schizophrenia and healthy controls regarding genetic and disease-specific factors. Proc. Natl. Acad. Sci. U.S.A. 102, 4872–4877.
- Sun et al. (2009) Sun, D., van Erp, T.G., Thompson, P.M., Bearden, C.E., Daley, M., Kushan, L., Hardt, M.E., Nuechterlein, K.H., Toga, A.W., Cannon, T.D., 2009. Elucidating a magnetic resonance imaging-based neuroanatomic biomarker for psychosis: classification analysis using probabilistic brain atlas and machine learning algorithms. Biol. Psychiatry 66, 1055–1060.
- Thompson et al. (2000) Thompson, P.M., Giedd, J.N., Woods, R.P., MacDonald, D., Evans, A.C., Toga, A.W., 2000. Growth patterns in the developing brain detected by using continuum mechanical tensor maps. Nature 404, 190–193.
- Thompson et al. (2004a) Thompson, P.M., Hayashi, K.M., De Zubicaray, G.I., Janke, A.L., Rose, S.E., Semple, J., Hong, M.S., Herman, D.H., Gravano, D., Doddrell, D.M., Toga, A.W., 2004a. Mapping hippocampal and ventricular change in Alzheimer disease. Neuroimage 22, 1754–1766.
- Thompson et al. (2004b) Thompson, P.M., Hayashi, K.M., Sowell, E.R., Gogtay, N., Giedd, J.N., Rapoport, J.L., de Zubicaray, G.I., Janke, A.L., Rose, S.E., Semple, J., Doddrell, D.M., Wang, Y., van Erp, T.G., Cannon, T.D., Toga, A.W., 2004b. Mapping cortical change in Alzheimer’s disease, brain development, and schizophrenia. Neuroimage 23 Suppl 1, 2–18.
- Tibshirani (1994) Tibshirani, R., 1994. Regression shrinkage and selection via the LASSO. Journal of the Royal Statistical Society, Series B 58, 267–288.
- Tosun et al. (2016) Tosun, D., Chen, Y.F., Yu, P., Sundell, K.L., Suhy, J., Siemers, E., Schwarz, A.J., Weiner, M.W., 2016. Amyloid status imputed from a multimodal classifier including structural mri distinguishes progressors from nonprogressors in a mild alzheimer’s disease clinical trial cohort. Alzheimer’s & Dementia 12, 977–986.
- Tosun et al. (2014) Tosun, D., Joshi, S., Weiner, M.W., 2014. Multimodal MRI-based imputation of the A+ in early mild cognitive impairment. Annals of clinical and translational neurology 1, 160–170.
- Tsui et al. (2013) Tsui, A., Fenton, D., Vuong, P., Hass, J., Koehl, P., Amenta, N., Coeurjolly, D., DeCarli, C., Carmichael, O., 2013. Globally optimal cortical surface matching with exact landmark correspondence. Inf Process Med Imaging 23, 487–498.
- Van Essen (2012) Van Essen, D.C., 2012. Cortical cartography and caret software. Neuroimage 62, 757–764.
- Varatharajah et al. (2019) Varatharajah, Y., Ramanan, V.K., Iyer, R., Vemuri, P., 2019. Predicting short-term MCI-to-AD progression using imaging, CSF, genetic factors, cognitive resilience, and demographics. Scientific reports 9, 1–15.
- Vemuri et al. (2008) Vemuri, P., Gunter, J.L., Senjem, M.L., Whitwell, J.L., Kantarci, K., Knopman, D.S., Boeve, B.F., Petersen, R.C., Jack, C.R., 2008. Alzheimer’s disease diagnosis in individual subjects using structural MR images: validation studies. Neuroimage 39, 1186–1197.
- Vounou et al. (2010) Vounou, M., Nichols, T.E., Montana, G., Initiative, A.D.N., et al., 2010. Discovering genetic associations with high-dimensional neuroimaging phenotypes: A sparse reduced-rank regression approach. Neuroimage 53, 1147–1159.
- Vu and Monga (2017) Vu, T.H., Monga, V., 2017. Fast low-rank shared dictionary learning for image classification. IEEE Transactions on Image Processing 26, 5160–5175.
- Wang et al. (2011) Wang, Y., Song, Y., Rajagopalan, P., An, T., Liu, K., Chou, Y.Y., Gutman, B., Toga, A.W., Thompson, P.M., Initiative, A.D.N., et al., 2011. Surface-based TBM boosts power to detect disease effects on the brain: an N=804 ADNI study. Neuroimage 56, 1993–2010.
- Wang et al. (2013) Wang, Y., Yuan, L., Shi, J., Greve, A., Ye, J., Toga, A.W., Reiss, A.L., Thompson, P.M., 2013. Applying tensor-based morphometry to parametric surfaces can improve MRI-based disease diagnosis. Neuroimage 74, 209–230.
- Wang et al. (2010) Wang, Y., Zhang, J., Gutman, B., Chan, T.F., Becker, J.T., Aizenstein, H.J., Lopez, O.L., Tamburo, R.J., Toga, A.W., Thompson, P.M., 2010. Multivariate tensor-based morphometry on surfaces: application to mapping ventricular abnormalities in HIV/AIDS. Neuroimage 49, 2141–2157.
- Wee et al. (2019) Wee, C.Y., Liu, C., Lee, A., Poh, J.S., Ji, H., Qiu, A., Initiative, A.D.N., et al., 2019. Cortical graph neural network for ad and mci diagnosis and transfer learning across populations. NeuroImage: Clinical 23, 101929.
- Weiner et al. (2013) Weiner, M.W., Veitch, D.P., Aisen, P.S., Beckett, L.A., Cairns, N.J., Green, R.C., Harvey, D., Jack, C.R., Jagust, W., Liu, E., Morris, J.C., Petersen, R.C., Saykin, A.J., Schmidt, M.E., Shaw, L., Shen, L., Siuciak, J.A., Soares, H., Toga, A.W., Trojanowski, J.Q., 2013. The Alzheimer’s Disease Neuroimaging Initiative: a review of papers published since its inception. Alzheimers Dement 9, e111–194.
- Wolz et al. (2010) Wolz, R., Heckemann, R.A., Aljabar, P., Hajnal, J.V., Hammers, A., Lotjonen, J., Rueckert, D., 2010. Measurement of hippocampal atrophy using 4D graph-cut segmentation: application to ADNI. Neuroimage 52, 109–118.
- Wu et al. (2018) Wu, J., Zhang, J., Shi, J., Chen, K., Caselli, R.J., Reiman, E.M., Wang, Y., 2018. Hippocampus morphometry study on pathology-confirmed alzheimer’s disease patients with surface multivariate morphometry statistics, in: 2018 IEEE 15th International Symposium on Biomedical Imaging (ISBI 2018), IEEE. pp. 1555–1559.
- Wu and Lange (2008) Wu, T.T., Lange, K., 2008. Coordinate Descent Algorithms for LASSO Penalized Regression. The Annals of Applied Statistics 2, 224–244.
- Yang et al. (2010) Yang, J., Wright, J., Huang, T.S., Ma, Y., 2010. Image super-resolution via sparse representation. IEEE Trans Image Process 19, 2861–2873.
- Yin et al. (2008) Yin, W., Osher, S., Goldfarb, D., Darbon, J., 2008. Bregman iterative algorithms for -minimization with applications to compressed sensing. SIAM Journal on Imaging sciences 1, 143–168.
- Zeng et al. (2013) Zeng, W., Shi, R., Wang, Y., Yau, S.T., Gu, X., Alzheimer’s Disease Neuroimaging Initiative, 2013. Teichmüller shape descriptor and its application to alzheimer’s disease study. Int. J. Comput. Vision 105, 155–170.
- Zhang et al. (2017a) Zhang, J., Fan, Y., Li, Q., Thompson, P.M., Ye, J., Wang, Y., 2017a. Empowering cortical thickness measures in clinical diagnosis of Alzheimer’s disease with spherical sparse coding. Proc IEEE Int Symp Biomed Imaging 2017, 446–450.
- Zhang et al. (2017b) Zhang, J., Fan, Y., Li, Q., Thompson, P.M., Ye, J., Wang, Y., 2017b. Empowering cortical thickness measures in clinical diagnosis of alzheimer’s disease with spherical sparse coding, in: 2017 IEEE 14th International Symposium on Biomedical Imaging (ISBI 2017), IEEE. pp. 446–450.
- Zhang et al. (2017c) Zhang, J., Li, Q., Caselli, R.J., Thompson, P.M., Ye, J., Wang, Y., 2017c. Multi-Source Multi-Target Dictionary Learning for Prediction of Cognitive Decline. Inf Process Med Imaging 10265, 184–197.
- Zhang et al. (2016a) Zhang, J., Shi, J., Stonnington, C., Li, Q., Gutman, B.A., Chen, K., Reiman, E.M., Caselli, R., Thompson, P.M., Ye, J., et al., 2016a. Hyperbolic space sparse coding with its application on prediction of Alzheimer’s disease in Mild Cognitive Impairment, in: Med Image Comput Comput Assist Interv, Springer. pp. 326–334.
- Zhang et al. (2016b) Zhang, J., Stonnington, C., Li, Q., Shi, J., Bauer, R.J., Gutman, B.A., Chen, K., Reiman, E.M., Thompson, P.M., Ye, J., Wang, Y., 2016b. Applying sparse coding to surface multivariate tensor-based morphometry to predict future cognitive decline. Proc IEEE Int Symp Biomed Imaging 2016, 646–650.
- Zhang et al. (2018a) Zhang, J., Tu, Y., Li, Q., Caselli, R.J., Thompson, P.M., Ye, J., Wang, Y., 2018a. Multi-task sparse screening for predicting future clinical scores using longitudinal cortical thickness measures, in: Proc IEEE Int Symp Biomed Imaging, pp. 1406–1410.
- Zhang et al. (2018b) Zhang, W., Lv, J., Li, X., Zhu, D., Jiang, X., Zhang, S., Zhao, Y., Guo, L., Ye, J., Hu, D., Liu, T., 2018b. Experimental comparisons of sparse dictionary learning and independent component analysis for brain network inference from fMRI data. IEEE Trans Biomed Eng .