Artificial Intelligence Enhanced Rapid and Efficient Diagnosis of Mycoplasma Pneumoniae Pneumonia in Children Patients
Abstract
Artificial intelligence methods have been increasingly turning into a potentially powerful tool in the diagnosis and management of diseases. In this study, we utilized logistic regression (LR), decision tree (DT), gradient boosted decision tree (GBDT), support vector machine (SVM), and multilayer perceptron (MLP) as machine learning models to rapidly diagnose the mycoplasma pneumoniae pneumonia (MPP) in children patients. The classification task was carried out after applying the preprocessing procedure to the MPP dataset. The most efficient results are obtained by GBDT. It provides the best performance with an accuracy of 93.7%. In contrast to standard raw feature weighting, the feature importance takes the underlying correlation structure of the features into account. The most crucial feature of GBDT is the “pulmonary infiltrates range” with a score of 0.5925, followed by “cough” (0.0953) and “pleural effusion” (0.0492). We publicly share our full implementation with the dataset and trained models at https://github.com/zhenguonie/2021_AI4MPP.
keywords:
Artificial Intelligence , Mycoplasma Pneumoniae Pneumonia , Rapid Diagnosis , Machine Learning , Feature Importance1 Introduction
Mycoplasma Pneumoniae Pneumonia (MPP) is one of the major pathogens in respiratory tract infections in children and young adults, manifesting from asymptomatic infection to potential fatal pneumonia. MPP accounts for 10%-40% community-acquired pneumonia (CAP) of school-aged children and adolescents [1, 2, 3]. MPP infections show an endemic transmission pattern with cyclic epidemics every 3-5 years [4, 5], which increases the rate of morbidity, mortality, as well as the cost of healthcare in society. Although most MPP infections in children are known as mild and self-limiting, some cases need hospitalization, even in rare cases, MPP can cause extrapulmonary manifestations, including neurologic, dermatologic, hematologic and cardiac syndromes which can result in hospitalization and death [6, 7]. Macrolide antibiotics are commonly used drugs for the treatment of MPP infection. With the widespread or inappropriate use of antibiotics, and has become an emerging threat worldwide [8, 9, 10], especially in Asia in recent years [11, 12, 13].
Artificial intelligence methods have emerged as a potentially powerful tool to aid in diagnosis and management of diseases, mimicking and perhaps even augmenting the clinical decision-making of human physicians [14]. Due to the high infection rate and severe sequelae of MPP in children patients, there may be a crucial role for AI approaches for the rapid diagnosis based on the basic routine inspections, including demographics and clinical presentations. AI-based systems, which can assist in the diagnosis of MPP as precisely under the epidemic and emergency of MMP, precision can decrease macrolide-resistant mycoplasma pneumoniae (MRMP) [15, 16, 17, 18, 19], on the other aspect, it is convenient in some areas, especially in which few healthcare providers in rural China. However, to the best of our knowledge, there is little research in AI based rapid diagnosis on MPP in children patients.
Firstly, we implement five machine learning based classifiers, including logistic regression (LR), decision tree (DT), gradient boosted decision tree(GBDT), support vector machine (SVM), and multilayer perceptron (MLP), in the rapid diagnosis. We collect the training data in multi-center inpatient departments of china. All five AI classifiers are trained and validated on the dataset. The result shows that GBDT produced the best results with an overall accuracy rate of 0.937, and the decision tree came out as the second best with an overall accuracy of 0.884, followed by MLP and logistic regression with overall accuracy rates of 0.863 and 0.695 respective. Besides, feature importance analysis indicates the pulmonary infiltrates range plays a predominant role among all the 42 symptom features with a weight of 0.5925.
2 Related Work
Our review focuses on studies that highlight AI-aided pneumonia diagnosis and five machine learning frameworks closely related to our work.
2.1 Artificial Intelligence for pneumonia diagnosis
Pneumonia is an important infectious disease in the world, which is related to high morbidity and mortality. In 2019, data from the World Health Organization showed that pneumonia is the biggest cause of death from infectious diseases in children.
Over the past decades, more and more researchers were using artificial intelligence technology to diagnose pneumonia. Integrating artificial intelligence into pneumonia diagnosis has become a trend. We use "Pneumonia" as the subject term to search on the Web of Science database with the topic related to “Artificial Intelligence” from January 1, 2006 to October 23, 2020. We analyze the scientific production by country during the past fifteen years.
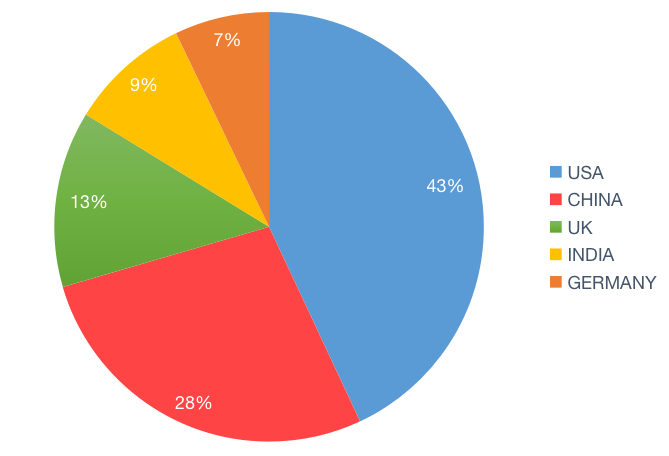
A total of 1,851 publications are received. The scientific production in this research field has increased massively in the past years, from only 33 publications in 2006 to 833 in 2020. USA, China, UK, India, and Germany are the top five most productive countries. Figure 1 shows the proportion of these five countries, and Figure 2 shows their growth over the past fifteen years.
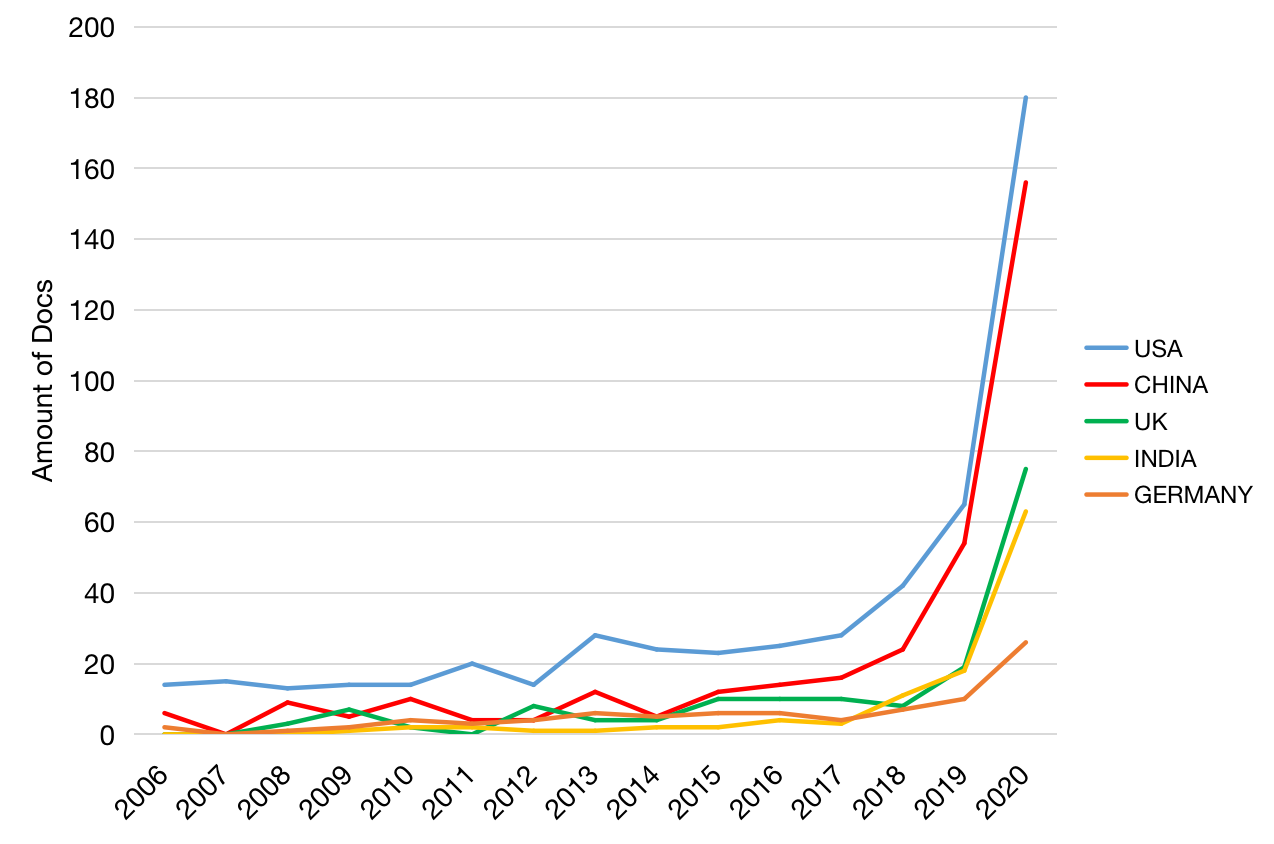
USA is the most productive country with a proportion of 28.039%, then followed by China (17.882%), UK (8.644%), India (5.943%) and Germany (4.646%). As shown in Table 1, Table 2, Table 3 and Table4. We list the top 10 countries with the most publications in every five years from 2006 to 2020. It also shows the proportion and evolution over time.
| Country | No. of docs | % | PPD |
| USA | 519 | 28.039 | -8.486 |
| China | 331 | 17.882 | 5.291 |
| UK | 160 | 8.644 | 3.353 |
| India | 110 | 5.943 | 6.009 |
| Germany | 86 | 4.646 | -0.39 |
| Canada | 78 | 4.214 | 1.677 |
| Italy | 75 | 4.052 | -1.401 |
| France | 67 | 3.62 | -3.062 |
| Netherlands | 60 | 3.241 | -2.161 |
| Australia | 58 | 3.133 | 1.219 |
| Country | No. of docs | % |
| USA | 70 | 34.146 |
| China | 30 | 14.634 |
| Spain | 13 | 6.341 |
| France | 12 | 5.854 |
| Italy | 12 | 5.854 |
| UK | 12 | 5.854 |
| Japan | 11 | 5.366 |
| Netherlands | 10 | 4.878 |
| Germany | 9 | 4.39 |
| Canada | 6 | 2.927 |
| Country | No. of docs | % |
| USA | 109 | 33.956 |
| China | 37 | 11.526 |
| UK | 26 | 8.1 |
| Germany | 24 | 7.477 |
| France | 18 | 5.607 |
| Netherlands | 14 | 4.361 |
| Australia | 12 | 3.738 |
| Canada | 11 | 3.427 |
| Switzerland | 11 | 3.427 |
| Belgium | 10 | 3.115 |
| Country | No. of docs | % |
| USA | 340 | 25.66 |
| China | 264 | 19.925 |
| UK | 122 | 9.207 |
| India | 99 | 7.472 |
| Canada | 61 | 4.604 |
| Italy | 59 | 4.453 |
| Germany | 53 | 4 |
| Australia | 42 | 3.17 |
| France | 37 | 2.792 |
| Netherlands | 36 | 2.717 |
2.2 Logistic Regression
Logistic regression (LR) is a machine learning model commonly used for binary classification problems. It assumes that the data obeys a continuous probability distribution, and uses maximum likelihood estimation to estimate the parameters [20]. LR is theoretically supported by the linear regression. The difference is that LR introduces non-linear factors through the Sigmoid function, so it can easily handle the 0/1 classification problem. It outputs the mathematical logic of the result (Eq. (1)).
| (1) |
The logical model (also known as logit) is a sigmoid function, denoted as , and its output is a number between 0 and 1. The definition is shown in Eq. (2).
| (2) |
Once the logistic regression model estimates the probability that the sample x is classified the positive class, then the prediction y can be easily made (Eq. (3))
| (3) |
2.3 Decision Tree
The decision tree (DT) is a commonly used classification method in supervised learning. DT generates a tree-like structure through the splitting of nodes and thresholds, and judges the category of input samples.The goal of DT is to predict the outcome of a sample by learning simple decision rules from data features [21].
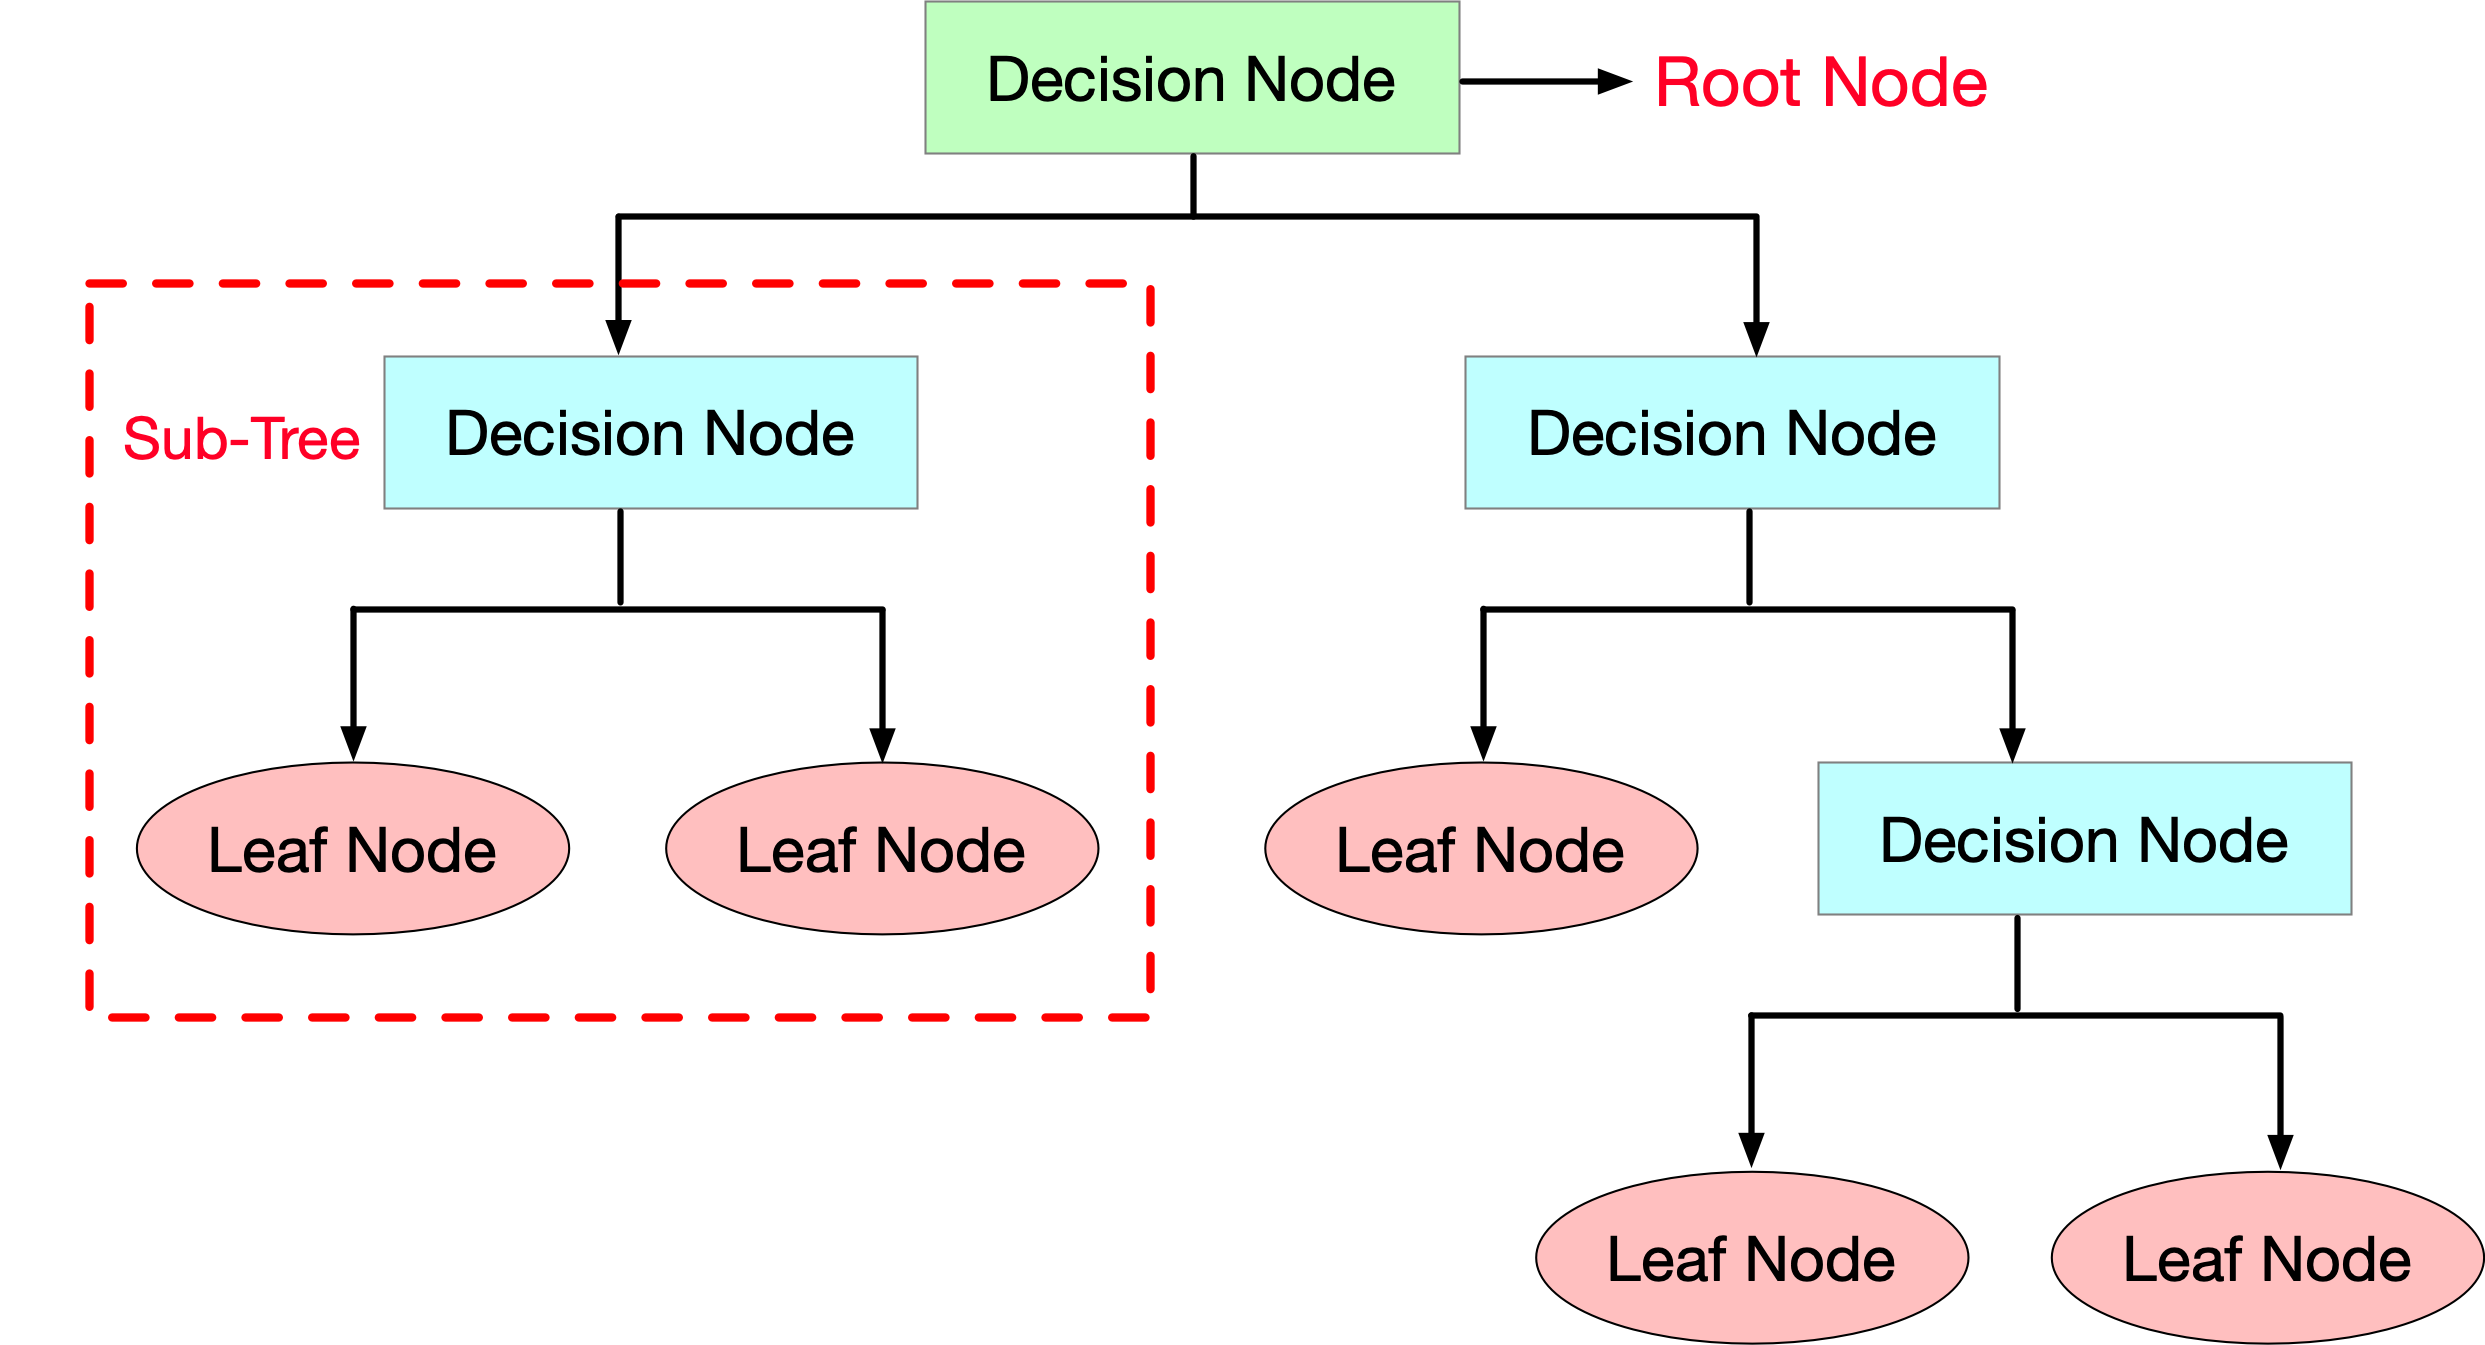
Figure 3 shows the architecture of DT. The process of constructing a complete decision tree is the process of selecting what attributes are the nodes. There are three kinds of nodes in the decision tree: root node, internal node and leaf node. Root node and internal node are the nodes that make decisions. Leaf node is the decision result. There is a parent-child relationship between nodes. Which attributes are selected as decision nodes and when to stop splitting determines the generalization performance of a DT. Controlling the depth of the DT is also a commonly used method in the modeling process.
2.4 Gradient Boosted Decision Tree
Gradient Boosted Decision Tree (GBDT) is a traditional machine learning algorithm and one of the best algorithms that fits the real distribution.It uses DT as weak learners and uses Gradient Boosting strategy for training. As shown in Figure 4, it describes how GBDT works.
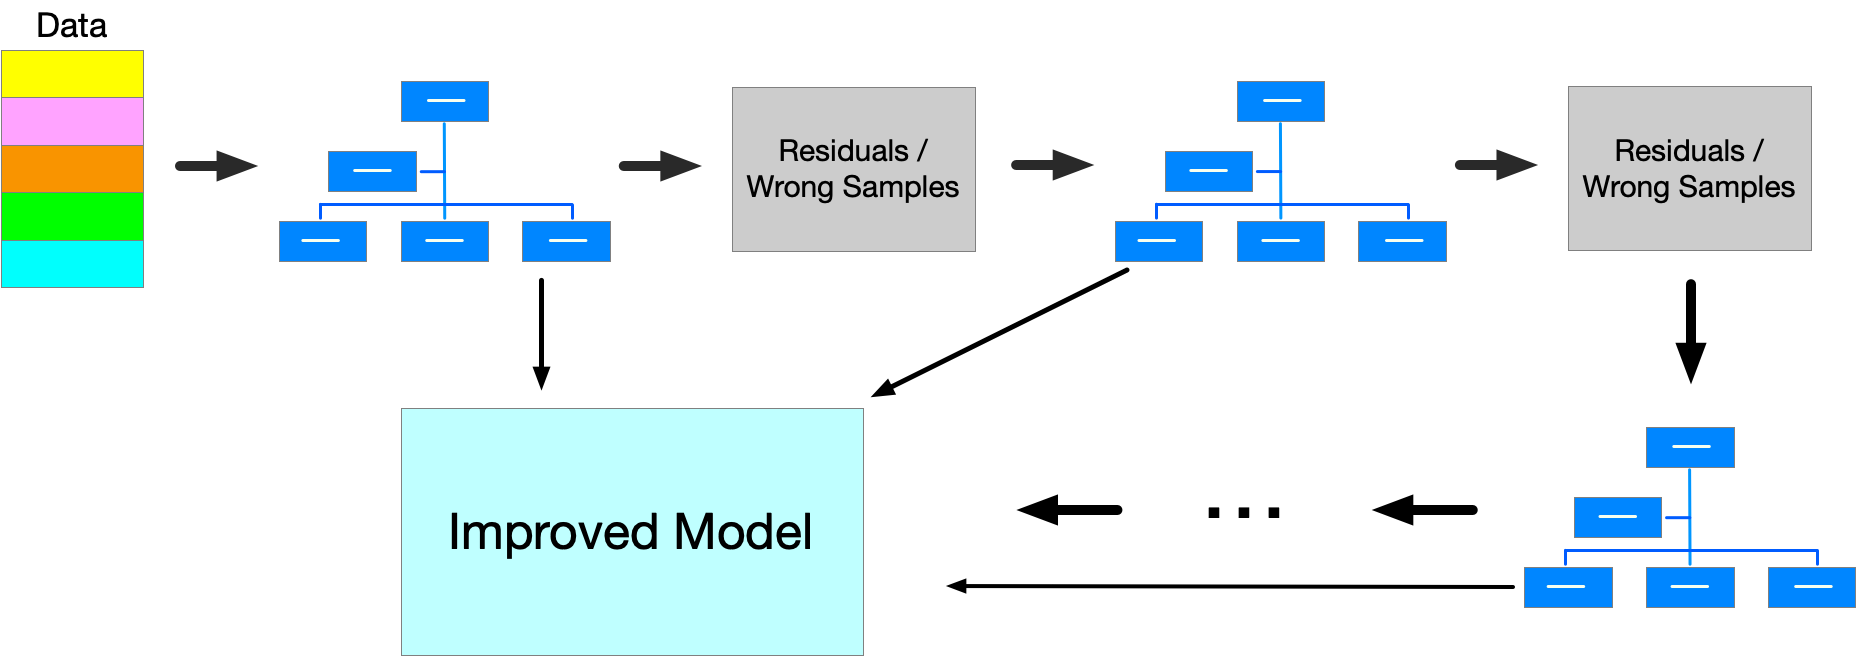
GBDT will conduct multiple rounds of training, and each round of training is carried out on the basis of the residual of the previous round of training. The residual here is the negative gradient value of the current model. This requires that the residual subtraction of the output of the weak classifier is meaningful during each iteration. The result of the GBDT model is a combination of a set of classification decision trees. The final output of the GBDT model is the sum of the results of a sample in each tree [22].
2.5 SVM
Support Vector Machine (SVM) is a linear classification model that maximizes the interval defined in the feature space. It is commonly used in classification tasks [23].
The goal of SVM is to find the separating hyperplane that can correctly divide the training data set and maximize the geometric interval. As shown in Figure 5, for a linearly separable dataset, there are many possible hyperplanes, but there is one optimal hyperplane with the largest geometric interval. The data points that are at the edge of the hyperplane are support vectors. The loss function used in SVM is hinge loss, which can be defined as:
| (4) |
For , hinge loss is ‘0’. However, when , then hinge loss increases massively. With the loss function, SVM takes partial derivatives concerning the weights to find the gradients and update the weights after. SVM will use the the regularization parameter to update the gradient when a misclassification is found.
2.6 Multilayer Perceptron
Multilayer perceptron (MLP) is also called Artificial Neural Network (ANN). In addition to the input and output layers, MLP can have one or more hidden layers in between. The simplest MLP only contains one hidden layer, which is a three-layer structure.
As shown in Figure 6, in MLP, information is gradually transferred from the input layer to the forward layers. Except the input layer, all the neurons in the other layers use nonlinear activation function. At the beginning of training process, the instance feature vector of the training set is passed to the input layer, and then the weight of the connected node is passed to the next layer. The output of the previous layer is the input of the next layer. After the output is compared with the known label, MLP adjusts the weight accordingly (the weight usually starts with a random initialization value). This process will repeat until the model reach the maximum number of allowed iterations or an acceptable error rate.
3 Technical Approach
Five popular classifiers (i.e. LR, DT, GBDT, SVM, and MLP) are built and compared using their predictive accuracy on the retained data samples.
3.1 Dataset Description
Research data are collected from multi-center inpatient department, including Shanghai Tenth People’s Hospital, Hainan Maternal and Children’s Medical Center, Maternity Service Center of Pengzhou Maternal & Child Health Care Hospital, Huai’an First People’s Hospital, Nanjing Medical University. We performed a retrospective AI-based analysis of medical records of patients with MP pneumonia. Patients had been hospitalised and confirmed according to systems, signs and laboratory data of patients. Characteristics analysed included demographics (age, gender ), clinical presentation (pulmonary symptoms, clinical examination:general conditions, fever, continuous days of fever, cough, apastia or dehydration, disturbance of consciousness, respiratory rate, cyanosis, groaning, nasal flaring, three concave sign, lung infiltration area, pleural effusion, oxygen saturation, extrapulmonary complications, lung auscultation,visual examination, palpation, percussion, serum IgM and IgG of acute and convalescence, PCR test of nasopharyngeal/oropharyngeal (NP/OP) swabs; biochemistry: hepatic function(alanine amino-transferase (ALT) and aspartate amino-transferase (AST) and renal function(blood urea nitrogen (BUN), creatinine (CREA), lactate dehydrogenase (LDH), creatine kinase MB (CK-MB), leukocyte, neutrophil, lymphocyte, platelet, erythrocyte sedimentation rate(ESR) , procalcitonin (PCT), serum ferritin(SF), C-reactive protein (CRP), D-dimer, treatment with normal macrolide antibiotics for more than seven days. A CAP patient with a positive MP PCR NP/OP specimen or serum IgM titre more than 1:160 is considered to have MPP. The severity of MPP is consistent with CAP[16,17]. Hepatic and renal function (ALT,AST,BUN,CREA,CK-MB) means whether there is any damage outside the lung system when infected MP. Leukocyte, neutrophil, lymphocyte, platelet, erythrocyte sedimentation rate (ESR) , procalcitonin (PCT), serum ferritin (SF), C-reactive protein (CRP), D-dimer, treatment with normal macrolide antibiotics for more than seven days indicate the severity of the infection[18].All data including clinical symptoms, signs and biochemistry are given in TableLABEL:feature.
| Clinical Variables | Reference Range | Clinical Significanc |
|---|---|---|
| Age | 0.1-13year | - |
| Gender | 0:female, 1:male | - |
| Seasons | 0:spring, 1:summer, 2:autumn, 3:winter | - |
| General Condition | 0:good, 1:poor condition, 2:very bad condition | Judge the severity of pneumonia |
| Classification of Fever | 0:normal, 1:low heat, 2:moderate heat, 3:hyperpyrexia, 4:ultra-hyperpyrexia | Ultra-hyperpyrexia indicates the severity |
| Fever With More Than Seven Days | 0:no, 1:yes | it indicates the severity and refractory |
| Cough Nature | 0:without cough, 1:dry cough, 2:phlegmy cough | A symptom |
| Apastia or Dehydration | 0:no, 1:yes | Judge the severity |
| Consciousness Disturbance | 0:no, 1:yes | Judge the severity |
| Respiratory Rate | 0:normal, 1:breathing faster, 2:breathing noticeably faster | Judge the severity |
| Cyanosis | 0:no, 1:yes | Judge the severity |
| Groaning | 0:no, 1:yes | Judge the severity |
| Nasal Flaring | 0:no, 1:yes | Judge the severity |
| Three Concave Sign | 0:no, 1:yes | Judge the severity |
| Lung Infiltration Area | 0:no, 1:mild, 2:severe | Judge the severity |
| Pleural Effusion | 0:no, 1:yes | Judge the severity |
| Pulse Blood Oxygen Saturation | 0:normal, 1:abnormal | Judge the severity |
| Extropulmonary Complications | 0:no, 1:yes | Judge the severity |
| Rhonchus or Wheeze | 0:no, 1:left, 2:right, 3:left and right | The sign of the disease |
| Moist Crackles | 0:no, 1:left, 2:right, 3:left and right | The sign of the disease |
| Decreased Breath Sounds | 0:no;1:yes | The sign of the disease |
| Reduced Breathing Movement | 0:no;1:yes | The sign of the disease |
| Enhancement Tactile Fremitus | 0:no;1:yes | The sign of the disease |
| Lung Percussion | 0:normal;1:dullness, 2:flatness | The sign of the disease |
| Pleural Friction Rub | 0:no, 1:yes | The sign of the disease |
| IgM(acute stage) | -1:not check, 0:negative;1:positive | Positive indicates the infection of MP |
| IgG(acute stage) | 0:negative, 1:positive | Positive indicates infected in the past |
| IgM (Convalescence) | -1:not check, 0:negative;1:positive | - |
| IgG (Convalescence) | 0:negative, 1:positive | Positive indicates antibody production |
| Nucleic Acid PCR(NP/OP) | -1:not check;0:negative;1:positive | Positive indicates the infection of MP |
| ALT( Alanine Amino- transferase) | 0-40u/L | Indicates whether hepatic function damage |
| AST(Aspartate Amino- transferase) | 0-40U/L | Indicates whether hepatic function damage |
| BUN(Blood Urea Nitrogen) | 1.8-6.5 mmol/L | Indicates whether kidney function damage |
| CREA(Creatinine) | 24.9-69.7mmol/L | Indicates whether kidney function damage |
| LDH(Lactate Dehydrogenase) | 100-300U/L | Indicates whether myocardial injury and refractory |
| CK-MB(creatine kinase MB)(mass) | <0.6ng/ml | Indicates whether myocardial damage |
| CK-MB(activity) | 0-24U/L | Indicates whether myocardial injury |
| Leukocyte | (4-10)*109 | Indicates infection |
| Neutrophil% | 43%-76% | Indicates infection |
| Lymphocyte% | 17%-48% | Indicates infection |
| Platelet | (100-300)*109 | Indicates infection |
| CRP(C Reactive Protein) | <10mg/L | Indicates infection |
| ESR(Erythrocyte Sedimentation Rate) | male:0-15mm/h;female:0-20mm/h | Indicates infection |
| PCT(Procalcitonin) | <0.5ng/ml | Indicates infection |
| SF(Serum Ferritin) | female:12-150ug/L;male:15-200ug/L | Indicates infection |
| D-Dimer | <0.5mg/L | Indicates whether hypercoagulability |
| After seven days or more of normal treatment with macrolide antibiotics | 0:no;1:persistent fever;2:aggravated clinical signs;3:extrapulmonary complications;4:progression in imaging;5:extension course | It indicates the severity and refractory |
3.2 Prediction Models
In this study, the proposed method consists of four stages. In the first stage, several feature engineering operations, such as feature selection and feature cleaning, are conducted to obtain an improved dataset. In the second stage, a 5-fold cross-validation approach is utilized to estimate the performance of the prediction models. In cross validation, 5 is one of the optimal number for folds. It can effectively reduce the deviation and variance generated in the verification process, and can also shorten the test time. The original dataset is split into five independent subsets in our approach, and the subsets are directly mutually exclusive. Each fold is used separately to test the performance of the model, and finally five performance estimates are obtained. In the third stage, we test the machine learning models that are selected in our approach. Since we use a 5-fold cross-validation, each model will perform five independent experiments. Finally, the classification performance of the five machine learning models are compared. The pictorial depiction of our proposed method is shown in Figure 7.
In this approach, five classic classification methods (i.e., LR, DT, GBDT, SVM and MLP) are built and compared to each other using their predictive accuracy on the retained samples. An LR model is built to predict the odds of the mycoplasma pneumonia occurrence, instead of predicting a point estimate of the disease itself. A DT model is constructed by asking a series of questions with respect to a record of the pneumonia dataset we have got. A GBDT model conducts an optimized loss function and use decision-tree as a weak learner. Each decision tree makes predictions. Then an additive model is built to add them to minimize the loss function. SVM uses hinge loss function to achieve the maximum margin hyperplane to distinguish data points belong to different classes. MLP uses forward propagation to continuously update model‘s weights until the best prediction performance is obtained.
3.3 Evaluation Metrics
In machine learning algorithms, confusion matrix is a method to use a specific matrix to present the visualization of algorithm’s performance. Each column represents the predicted value, and each row represents the actual category [24]. In this paper, our classification problem is a 3-class classification problem. The prediction result for each sample will be: 0, 1 or 2. 0 means the patient is not infected, 1 means the patient is mildly infected, and 2 means the patient is severely infected.
We conduct the confusion matrix for 3-class classification in our study. Unlike positive or negative classes in binary classification, we aim to find the metrics of the confusion matrix for each individual class. For example, if we take class 1 (mildly infected), the class 0 and 2 will be combined as an opposite class. With the confusion matrix generated, we can calculate the performance measure for class 1. Similarly, we can calculate the measures for the other two classes.
In our study, we present various performance measures to evaluate and compare the five models for mycoplasma pneumonia diagnosis. Accuracy gives the fraction of the total samples that were correctly classified by the classifier. Precision reflects the model’s ability to distinguish negative samples, and recall reflects the classification model’s ability to recognize positive samples. F1-score is a combination of precision and recall. It indicates the robustness of the classification model. From a perspective of the confusion matrix, the formula for calculating accuracy, precision, recall, and f1-score are defined as follows, where TP is Ture Positive, TN is True Negative, FP is False Positive , and FN is False Negative:
| (5) |
| (6) |
| (7) |
| (8) |
4 Results and Discussion
The training and test experiments are conducted on our own dataset, which is composed of 960 records.The experimental results show that GBDT has the best performance among the five methods with an overall accuracy rate of 0.937.
4.1 Prediction Performance
We use the original dataset which was composed of 960 records in the experiments. As shown in Figure 8, based on the 5-fold cross-validation, the GBDT produces the best results with an overall accuracy rate of 0.937, and the decision tree comes out as the second best with an overall accuracy of 0.884, followed by MLP and logistic regression with overall accuracy rates of 0.863 and 0.695 respectively. SVM achieves an overall accuracy of 0.653 which is not as good as other models.
The other classification results are given in Table 6, 7 and 8. The best result is obtained by GBDT. In practice, we pay more attention to the predictive performance of mild and severe infections. The precision and recall of class “1:mild infected” reaches 0.946 and 0.946 in GBDT, while the precision and recall of class “2:severe infected” reaches 1 and 0.895. The F1-score of the three classes (i.e., 0:none, 1:mild, 2:severe ) in GBDT are 0.905,0.946 and 0.944 .
| Model | Precision | Recall | F1 score |
| GBDT | 0.863 | 0.951 | 0.905 |
| Logistics | 0.932 | 0.178 | 0.611 |
| Decision tree | 0.944 | 0.851 | 0.895 |
| SVM | 0.875 | 0.35 | 0.5 |
| MLP | 0.81 | 0.952 | 0.869 |
| Model | Precision | Recall | F1 score |
| GBDT | 0.946 | 0.946 | 0.946 |
| Logistics | 0.704 | 0.892 | 0.787 |
| Decision tree | 0.961 | 0.892 | 0.925 |
| SVM | 0.638 | 0.946 | 0.962 |
| MLP | 0.962 | 0.716 | 0.821 |
| Model | Precision | Recall | F1 score |
| GBDT | 1 | 0.895 | 0.944 |
| Logistics | 0.625 | 0.263 | 0.370 |
| Decision tree | 0.680 | 0.895 | 0.773 |
| SVM | 0.510 | 0.105 | 0.174 |
| MLP | 0.644 | 0.974 | 0.776 |
Since the decision rules of our machine learning models are hardly accessible to humans and cannot easily be used to gain insights about the mycoplasmal pneumonia diagnosis in children. Therefore, we display the Feature Importance in our study, which by retrospective analysis of arbitrary learning machines achieve both excellent predictive performance and superior interpretation.
In contrast to standard raw feature weighting, the feature importance takes the underlying correlation structure of the features into account. Thereby, it is able to discover the most relevant features, even if their appearance in the training data is entirely prevented by noise.
We list the top 10 features ranked by feature importance scores in GBDT. As shown in Table 9, the most important feature is the “Pulmonary infiltrates range” with the score of 0.5925, follow by “Cough” (0.0953) and “Pleural effusion” (0.0492). “Pulmonary signs” is also an important feature that cannot be ignored.
The chest radiographic examination is an essential part of the diagnosis of pneumonia including MPP. Furthermore, chest radiographs play an important role in assessing a patient’s current condition and prognosis, as well as in determining the treatment plan, which is consistent with our study result. In the present day, Pulmonary infiltrates range is the most important clinical variable, it demonstrates that it is an important role in evaluating the severity of MPP. Cough is a common symptom of respiratory disease including MPP. So It is a sensitive but poorly specific indicator of MPP Wang et al. [25].In our study, it also shows that it plays an important role in the diagnosis of MPP. Pleural effusion is an important feature in helping clinicians to distinguish the mild and severity of MPP. Dry rale and wheezing are also a vital characteristic of MPP, it perhaps confirms the previous study result indirectly that a small part of children suffered from recurrent wheezing after MPP and children increased the risk of wheezing experience when they had MP infection [26]. Wet rale is a common clinical sign in pneumonia,and is also a diagnostic indicator of MPP. Other characters, such as WBC, CRP, renal function (CREA and BUN) and CK-MB, are also indicators in estimating the severity and prognosis of MPP.
| Rank | Name of Feature | Feature Importance |
| 1 | Pulmonary infiltrates range | 0.5925, |
| 2 | Cough | 0.0953 |
| 3 | Pleural effusion | 0.0492 |
| 4 | Pulmonary sign, whether there are dry rales, wheezing | 0.0453 |
| 5 | Pulmonary sign, whether there is wet rale | 0.0397 |
| 6 | White blood cells (WBC) | 0.0195 |
| 7 | Renal function (CREA, Umol/L) | 0.0154 |
| 8 | CK-MB, U/L (active) | 0.0152 |
| 9 | C-reactive protein (CRP) mg/L | 0.0131 |
| 10 | Renal function (BUN, mmol/L) | 0.0104 |
5 Conclusions
In this work, we utilize LR, DT, GBDT, SVM and MLP models to rapidly predict MPP diagnosis in children patients. We collect and organize the raw MPP dataset from five different center inpatient departments within the past two years. We employ the preprocessing procedure to the original dataset to ensure the best prediction effectiveness of the models. After the classification tasks, we conduct a three-class confusion matrix in the evaluation of our prediction experiments. GBDT outperforms other machine learning models in terms of all the three classes (i.e., no infected, mild infected, severe infected). It achieves the highest accuracy of 93.7%.
Finally, through the feature importance analysis, we list the most importance features in our study. “pulmonary infiltrates range” is the most important feature of GBDT with the score of 0.5925, follow by “cough” (0.0953) and “pleural effusion” (0.0492).
In our future work, we will implement these machine learning methods on a larger dataset with more children MPP cases. Data mining and deeper feature correlation analysis will be taken into account, in order to obtain better prediction performance.
Compliance with Ethical Standards
This article does not contain any studies with human participants or animals performed by any of the authors.
References
- Biondi et al. [2014] E. Biondi, R. McCulloh, B. Alverson, A. Klein, A. Dixon, S. Ralston, Treatment of mycoplasma pneumonia: a systematic review, Pediatrics 133 (2014) 1081–1090.
- Bradley et al. [2011] J. S. Bradley, C. L. Byington, S. S. Shah, B. Alverson, E. R. Carter, C. Harrison, S. L. Kaplan, S. E. Mace, G. H. McCracken Jr, M. R. Moore, et al., The management of community-acquired pneumonia in infants and children older than 3 months of age: clinical practice guidelines by the pediatric infectious diseases society and the infectious diseases society of america, Clinical infectious diseases 53 (2011) e25–e76.
- Korppi et al. [2004] M. Korppi, T. Heiskanen-Kosma, M. Kleemola, Incidence of community-acquired pneumonia in children caused by mycoplasma pneumoniae: serological results of a prospective, population-based study in primary health care, Respirology 9 (2004) 109–114.
- AtkinsonTP [2008] B. AtkinsonTP, Waiteskb. epidemiology, clinical manifestations, pathogenesis and laboratory detection of mycoplasma pneumoniae infections, FEMS Microbiol Rev 32 (2008) 956–73.
- Lind et al. [1997] K. Lind, M. Benzon, S. Jensen, W. Clyde, A seroepidemiological study of mycoplasma pneumoniae infections in denmark over the 50-year period 1946–1995, European journal of epidemiology 13 (1997) 581–586.
- Olson et al. [2015] D. Olson, L. K. F. Watkins, A. Demirjian, X. Lin, C. C. Robinson, K. Pretty, A. J. Benitez, J. M. Winchell, M. H. Diaz, L. A. Miller, et al., Outbreak of mycoplasma pneumoniae–associated stevens-johnson syndrome, Pediatrics 136 (2015) e386–e394.
- Tsiodras et al. [2005] S. Tsiodras, I. Kelesidis, T. Kelesidis, E. Stamboulis, H. Giamarellou, Central nervous system manifestations of mycoplasma pneumoniae infections, Journal of Infection 51 (2005) 343–354.
- Diaz et al. [2015] M. H. Diaz, A. J. Benitez, J. M. Winchell, Investigations of mycoplasma pneumoniae infections in the united states: trends in molecular typing and macrolide resistance from 2006 to 2013, Journal of clinical microbiology 53 (2015) 124–130.
- Dumke et al. [2010] R. Dumke, H. von Baum, P. C. Lück, E. Jacobs, Occurrence of macrolide-resistant mycoplasma pneumoniae strains in germany, Clinical Microbiology and Infection 16 (2010) 613–616.
- Pereyre et al. [2013] S. Pereyre, A. Touati, J. Petitjean-Lecherbonnier, A. Charron, A. Vabret, C. Bébéar, The increased incidence of m ycoplasma pneumoniae in f rance in 2011 was polyclonal, mainly involving m. pneumoniae type 1 strains, Clinical Microbiology and Infection 19 (2013) E212–E217.
- Ho et al. [2015] P.-L. Ho, P. Y. Law, B. W. Chan, C.-W. Wong, K. K. To, S. S. Chiu, V. C. Cheng, W.-C. Yam, Emergence of macrolide-resistant mycoplasma pneumoniae in hong kong is linked to increasing macrolide resistance in multilocus variable-number tandem-repeat analysis type 4-5-7-2, Journal of clinical microbiology 53 (2015) 3560–3564.
- Peirano et al. [2014] G. Peirano, A. K. van der Bij, J. L. Freeman, L. Poirel, P. Nordmann, M. Costello, V. L. Tchesnokova, J. D. Pitout, Characteristics of escherichia coli sequence type 131 isolates that produce extended-spectrum -lactamases: global distribution of the h30-rx sublineage, Antimicrobial agents and chemotherapy 58 (2014) 3762–3767.
- Tanaka et al. [2017] T. Tanaka, T. Oishi, I. Miyata, S. Wakabayashi, M. Kono, S. Ono, A. Kato, Y. Fukuda, A. Saito, E. Kondo, et al., Macrolide-resistant mycoplasma pneumoniae infection, japan, 2008–2015, Emerging infectious diseases 23 (2017) 1703.
- Perer et al. [2015] A. Perer, F. Wang, J. Hu, Mining and exploring care pathways from electronic medical records with visual analytics, Journal of biomedical informatics 56 (2015) 369–378.
- Zech et al. [2018] J. R. Zech, M. A. Badgeley, M. Liu, A. B. Costa, J. J. Titano, E. K. Oermann, Variable generalization performance of a deep learning model to detect pneumonia in chest radiographs: a cross-sectional study, PLoS medicine 15 (2018) e1002683.
- Ge et al. [2019] Y. Ge, Q. Wang, L. Wang, H. Wu, C. Peng, J. Wang, Y. Xu, G. Xiong, Y. Zhang, Y. Yi, Predicting post-stroke pneumonia using deep neural network approaches, International Journal of Medical Informatics 132 (2019) 103986.
- Stephen et al. [2019] O. Stephen, M. Sain, U. J. Maduh, D.-U. Jeong, An efficient deep learning approach to pneumonia classification in healthcare, Journal of healthcare engineering 2019 (2019).
- Toğaçar et al. [2020] M. Toğaçar, B. Ergen, Z. Cömert, F. Özyurt, A deep feature learning model for pneumonia detection applying a combination of mrmr feature selection and machine learning models, IRBM 41 (2020) 212–222.
- Jakhar and Hooda [2018] K. Jakhar, N. Hooda, Big data deep learning framework using keras: A case study of pneumonia prediction, in: 2018 4th International Conference on Computing Communication and Automation (ICCCA), IEEE, 2018, pp. 1–5.
- Kleinbaum et al. [2002] D. G. Kleinbaum, K. Dietz, M. Gail, M. Klein, M. Klein, Logistic regression, Springer, 2002.
- Myles et al. [2004] A. J. Myles, R. N. Feudale, Y. Liu, N. A. Woody, S. D. Brown, An introduction to decision tree modeling, Journal of Chemometrics: A Journal of the Chemometrics Society 18 (2004) 275–285.
- Ke et al. [2017] G. Ke, Q. Meng, T. Finley, T. Wang, W. Chen, W. Ma, Q. Ye, T.-Y. Liu, Lightgbm: A highly efficient gradient boosting decision tree, Advances in neural information processing systems 30 (2017) 3146–3154.
- Pal and Foody [2010] M. Pal, G. M. Foody, Feature selection for classification of hyperspectral data by svm, IEEE Transactions on Geoscience and Remote Sensing 48 (2010) 2297–2307.
- Godbole and Sarawagi [2004] S. Godbole, S. Sarawagi, Discriminative methods for multi-labeled classification, in: Pacific-Asia conference on knowledge discovery and data mining, Springer, 2004, pp. 22–30.
- Wang et al. [2012] K. Wang, P. Gill, R. Perera, A. Thomson, D. Mant, A. Harnden, Clinical symptoms and signs for the diagnosis of mycoplasma pneumoniae in children and adolescents with community-acquired pneumonia, Cochrane Database of Systematic Reviews (2012).
- Rhim et al. [2019] J. W. Rhim, H. M. Kang, E. A. Yang, K. Y. Lee, Epidemiological relationship between mycoplasma pneumoniae pneumonia and recurrent wheezing episode in children: an observational study at a single hospital in korea, BMJ open 9 (2019) e026461.