S. Dubey
University of Hawaii, Honolulu, Hawaii 96822
T. E. Browder
University of Hawaii, Honolulu, Hawaii 96822
H. Aihara
Department of Physics, University of Tokyo, Tokyo 113-0033
S. Al Said
Department of Physics, Faculty of Science, University of Tabuk, Tabuk 71451
Department of Physics, Faculty of Science, King Abdulaziz University, Jeddah 21589
D. M. Asner
Brookhaven National Laboratory, Upton, New York 11973
T. Aushev
Higher School of Economics (HSE), Moscow 101000
R. Ayad
Department of Physics, Faculty of Science, University of Tabuk, Tabuk 71451
V. Babu
Deutsches Elektronen–Synchrotron, 22607 Hamburg
S. Bahinipati
Indian Institute of Technology Bhubaneswar, Satya Nagar 751007
P. Behera
Indian Institute of Technology Madras, Chennai 600036
J. Bennett
University of Mississippi, University, Mississippi 38677
M. Bessner
University of Hawaii, Honolulu, Hawaii 96822
B. Bhuyan
Indian Institute of Technology Guwahati, Assam 781039
S. Bilokin
Ludwig Maximilians University, 80539 Munich
J. Biswal
J. Stefan Institute, 1000 Ljubljana
A. Bobrov
Budker Institute of Nuclear Physics SB RAS, Novosibirsk 630090
Novosibirsk State University, Novosibirsk 630090
G. Bonvicini
Wayne State University, Detroit, Michigan 48202
A. Bozek
H. Niewodniczanski Institute of Nuclear Physics, Krakow 31-342
M. Bračko
University of Maribor, 2000 Maribor
J. Stefan Institute, 1000 Ljubljana
M. Campajola
INFN - Sezione di Napoli, 80126 Napoli
Università di Napoli Federico II, 80126 Napoli
D. Červenkov
Faculty of Mathematics and Physics, Charles University, 121 16 Prague
B. G. Cheon
Department of Physics and Institute of Natural Sciences, Hanyang University, Seoul 04763
K. Chilikin
P.N. Lebedev Physical Institute of the Russian Academy of Sciences, Moscow 119991
H. E. Cho
Department of Physics and Institute of Natural Sciences, Hanyang University, Seoul 04763
K. Cho
Korea Institute of Science and Technology Information, Daejeon 34141
Y. Choi
Sungkyunkwan University, Suwon 16419
S. Choudhury
Indian Institute of Technology Hyderabad, Telangana 502285
D. Cinabro
Wayne State University, Detroit, Michigan 48202
S. Cunliffe
Deutsches Elektronen–Synchrotron, 22607 Hamburg
S. Das
Malaviya National Institute of Technology Jaipur, Jaipur 302017
R. Dhamija
Indian Institute of Technology Hyderabad, Telangana 502285
F. Di Capua
INFN - Sezione di Napoli, 80126 Napoli
Università di Napoli Federico II, 80126 Napoli
Z. Doležal
Faculty of Mathematics and Physics, Charles University, 121 16 Prague
D. Dossett
School of Physics, University of Melbourne, Victoria 3010
S. Eidelman
Budker Institute of Nuclear Physics SB RAS, Novosibirsk 630090
Novosibirsk State University, Novosibirsk 630090
P.N. Lebedev Physical Institute of the Russian Academy of Sciences, Moscow 119991
D. Epifanov
Budker Institute of Nuclear Physics SB RAS, Novosibirsk 630090
Novosibirsk State University, Novosibirsk 630090
T. Ferber
Deutsches Elektronen–Synchrotron, 22607 Hamburg
B. G. Fulsom
Pacific Northwest National Laboratory, Richland, Washington 99352
R. Garg
Panjab University, Chandigarh 160014
V. Gaur
Virginia Polytechnic Institute and State University, Blacksburg, Virginia 24061
N. Gabyshev
Budker Institute of Nuclear Physics SB RAS, Novosibirsk 630090
Novosibirsk State University, Novosibirsk 630090
A. Garmash
Budker Institute of Nuclear Physics SB RAS, Novosibirsk 630090
Novosibirsk State University, Novosibirsk 630090
A. Giri
Indian Institute of Technology Hyderabad, Telangana 502285
P. Goldenzweig
Institut für Experimentelle Teilchenphysik, Karlsruher Institut für Technologie, 76131 Karlsruhe
B. Golob
Faculty of Mathematics and Physics, University of Ljubljana, 1000 Ljubljana
J. Stefan Institute, 1000 Ljubljana
D. Greenwald
Department of Physics, Technische Universität München, 85748 Garching
Y. Guan
University of Cincinnati, Cincinnati, Ohio 45221
K. Gudkova
Budker Institute of Nuclear Physics SB RAS, Novosibirsk 630090
Novosibirsk State University, Novosibirsk 630090
C. Hadjivasiliou
Pacific Northwest National Laboratory, Richland, Washington 99352
K. Hayasaka
Niigata University, Niigata 950-2181
H. Hayashii
Nara Women’s University, Nara 630-8506
M. T. Hedges
University of Hawaii, Honolulu, Hawaii 96822
W.-S. Hou
Department of Physics, National Taiwan University, Taipei 10617
C.-L. Hsu
School of Physics, University of Sydney, New South Wales 2006
K. Inami
Graduate School of Science, Nagoya University, Nagoya 464-8602
A. Ishikawa
High Energy Accelerator Research Organization (KEK), Tsukuba 305-0801
SOKENDAI (The Graduate University for Advanced Studies), Hayama 240-0193
R. Itoh
High Energy Accelerator Research Organization (KEK), Tsukuba 305-0801
SOKENDAI (The Graduate University for Advanced Studies), Hayama 240-0193
M. Iwasaki
Osaka City University, Osaka 558-8585
Y. Iwasaki
High Energy Accelerator Research Organization (KEK), Tsukuba 305-0801
E.-J. Jang
Gyeongsang National University, Jinju 52828
Y. Jin
Department of Physics, University of Tokyo, Tokyo 113-0033
C. W. Joo
Kavli Institute for the Physics and Mathematics of the Universe (WPI), University of Tokyo, Kashiwa 277-8583
K. K. Joo
Chonnam National University, Gwangju 61186
A. B. Kaliyar
Tata Institute of Fundamental Research, Mumbai 400005
T. Kawasaki
Kitasato University, Sagamihara 252-0373
H. Kichimi
High Energy Accelerator Research Organization (KEK), Tsukuba 305-0801
C. H. Kim
Department of Physics and Institute of Natural Sciences, Hanyang University, Seoul 04763
D. Y. Kim
Soongsil University, Seoul 06978
S. H. Kim
Seoul National University, Seoul 08826
Y.-K. Kim
Yonsei University, Seoul 03722
T. D. Kimmel
Virginia Polytechnic Institute and State University, Blacksburg, Virginia 24061
K. Kinoshita
University of Cincinnati, Cincinnati, Ohio 45221
S. Korpar
University of Maribor, 2000 Maribor
J. Stefan Institute, 1000 Ljubljana
P. Križan
Faculty of Mathematics and Physics, University of Ljubljana, 1000 Ljubljana
J. Stefan Institute, 1000 Ljubljana
R. Kroeger
University of Mississippi, University, Mississippi 38677
P. Krokovny
Budker Institute of Nuclear Physics SB RAS, Novosibirsk 630090
Novosibirsk State University, Novosibirsk 630090
T. Kuhr
Ludwig Maximilians University, 80539 Munich
R. Kulasiri
Kennesaw State University, Kennesaw, Georgia 30144
R. Kumar
Punjab Agricultural University, Ludhiana 141004
K. Kumara
Wayne State University, Detroit, Michigan 48202
Y.-J. Kwon
Yonsei University, Seoul 03722
K. Lalwani
Malaviya National Institute of Technology Jaipur, Jaipur 302017
J. S. Lange
Justus-Liebig-Universität Gießen, 35392 Gießen
S. C. Lee
Kyungpook National University, Daegu 41566
C. H. Li
Liaoning Normal University, Dalian 116029
J. Li
Kyungpook National University, Daegu 41566
L. K. Li
University of Cincinnati, Cincinnati, Ohio 45221
Y. B. Li
Peking University, Beijing 100871
L. Li Gioi
Max-Planck-Institut für Physik, 80805 München
J. Libby
Indian Institute of Technology Madras, Chennai 600036
D. Liventsev
Wayne State University, Detroit, Michigan 48202
High Energy Accelerator Research Organization (KEK), Tsukuba 305-0801
C. MacQueen
School of Physics, University of Melbourne, Victoria 3010
M. Masuda
Earthquake Research Institute, University of Tokyo, Tokyo 113-0032
Research Center for Nuclear Physics, Osaka University, Osaka 567-0047
T. Matsuda
University of Miyazaki, Miyazaki 889-2192
M. Merola
INFN - Sezione di Napoli, 80126 Napoli
Università di Napoli Federico II, 80126 Napoli
F. Metzner
Institut für Experimentelle Teilchenphysik, Karlsruher Institut für Technologie, 76131 Karlsruhe
K. Miyabayashi
Nara Women’s University, Nara 630-8506
R. Mizuk
P.N. Lebedev Physical Institute of the Russian Academy of Sciences, Moscow 119991
Higher School of Economics (HSE), Moscow 101000
G. B. Mohanty
Tata Institute of Fundamental Research, Mumbai 400005
S. Mohanty
Tata Institute of Fundamental Research, Mumbai 400005
Utkal University, Bhubaneswar 751004
T. J. Moon
Seoul National University, Seoul 08826
M. Nakao
High Energy Accelerator Research Organization (KEK), Tsukuba 305-0801
SOKENDAI (The Graduate University for Advanced Studies), Hayama 240-0193
A. Natochii
University of Hawaii, Honolulu, Hawaii 96822
L. Nayak
Indian Institute of Technology Hyderabad, Telangana 502285
M. Nayak
School of Physics and Astronomy, Tel Aviv University, Tel Aviv 69978
N. K. Nisar
Brookhaven National Laboratory, Upton, New York 11973
S. Nishida
High Energy Accelerator Research Organization (KEK), Tsukuba 305-0801
SOKENDAI (The Graduate University for Advanced Studies), Hayama 240-0193
K. Nishimura
University of Hawaii, Honolulu, Hawaii 96822
S. Ogawa
Toho University, Funabashi 274-8510
H. Ono
Nippon Dental University, Niigata 951-8580
Niigata University, Niigata 950-2181
Y. Onuki
Department of Physics, University of Tokyo, Tokyo 113-0033
P. Oskin
P.N. Lebedev Physical Institute of the Russian Academy of Sciences, Moscow 119991
G. Pakhlova
Higher School of Economics (HSE), Moscow 101000
P.N. Lebedev Physical Institute of the Russian Academy of Sciences, Moscow 119991
S. Pardi
INFN - Sezione di Napoli, 80126 Napoli
S.-H. Park
Yonsei University, Seoul 03722
T. K. Pedlar
Luther College, Decorah, Iowa 52101
R. Pestotnik
J. Stefan Institute, 1000 Ljubljana
L. E. Piilonen
Virginia Polytechnic Institute and State University, Blacksburg, Virginia 24061
T. Podobnik
Faculty of Mathematics and Physics, University of Ljubljana, 1000 Ljubljana
J. Stefan Institute, 1000 Ljubljana
E. Prencipe
Forschungszentrum Jülich, 52425 Jülich
M. T. Prim
Institut für Experimentelle Teilchenphysik, Karlsruher Institut für Technologie, 76131 Karlsruhe
A. Rostomyan
Deutsches Elektronen–Synchrotron, 22607 Hamburg
N. Rout
Indian Institute of Technology Madras, Chennai 600036
G. Russo
Università di Napoli Federico II, 80126 Napoli
D. Sahoo
Tata Institute of Fundamental Research, Mumbai 400005
Y. Sakai
High Energy Accelerator Research Organization (KEK), Tsukuba 305-0801
SOKENDAI (The Graduate University for Advanced Studies), Hayama 240-0193
S. Sandilya
Indian Institute of Technology Hyderabad, Telangana 502285
A. Sangal
University of Cincinnati, Cincinnati, Ohio 45221
L. Santelj
Faculty of Mathematics and Physics, University of Ljubljana, 1000 Ljubljana
J. Stefan Institute, 1000 Ljubljana
T. Sanuki
Department of Physics, Tohoku University, Sendai 980-8578
V. Savinov
University of Pittsburgh, Pittsburgh, Pennsylvania 15260
G. Schnell
University of the Basque Country UPV/EHU, 48080 Bilbao
IKERBASQUE, Basque Foundation for Science, 48013 Bilbao
C. Schwanda
Institute of High Energy Physics, Vienna 1050
Y. Seino
Niigata University, Niigata 950-2181
K. Senyo
Yamagata University, Yamagata 990-8560
M. E. Sevior
School of Physics, University of Melbourne, Victoria 3010
M. Shapkin
Institute for High Energy Physics, Protvino 142281
C. Sharma
Malaviya National Institute of Technology Jaipur, Jaipur 302017
J.-G. Shiu
Department of Physics, National Taiwan University, Taipei 10617
B. Shwartz
Budker Institute of Nuclear Physics SB RAS, Novosibirsk 630090
Novosibirsk State University, Novosibirsk 630090
E. Solovieva
P.N. Lebedev Physical Institute of the Russian Academy of Sciences, Moscow 119991
M. Starič
J. Stefan Institute, 1000 Ljubljana
Z. S. Stottler
Virginia Polytechnic Institute and State University, Blacksburg, Virginia 24061
J. F. Strube
Pacific Northwest National Laboratory, Richland, Washington 99352
K. Sumisawa
High Energy Accelerator Research Organization (KEK), Tsukuba 305-0801
SOKENDAI (The Graduate University for Advanced Studies), Hayama 240-0193
M. Takizawa
Showa Pharmaceutical University, Tokyo 194-8543
J-PARC Branch, KEK Theory Center, High Energy Accelerator Research Organization (KEK), Tsukuba 305-0801
Meson Science Laboratory, Cluster for Pioneering Research, RIKEN, Saitama 351-0198
U. Tamponi
INFN - Sezione di Torino, 10125 Torino
K. Tanida
Advanced Science Research Center, Japan Atomic Energy Agency, Naka 319-1195
Y. Tao
University of Florida, Gainesville, Florida 32611
F. Tenchini
Deutsches Elektronen–Synchrotron, 22607 Hamburg
K. Trabelsi
Université Paris-Saclay, CNRS/IN2P3, IJCLab, 91405 Orsay
M. Uchida
Tokyo Institute of Technology, Tokyo 152-8550
Y. Unno
Department of Physics and Institute of Natural Sciences, Hanyang University, Seoul 04763
S. Uno
High Energy Accelerator Research Organization (KEK), Tsukuba 305-0801
SOKENDAI (The Graduate University for Advanced Studies), Hayama 240-0193
Y. Ushiroda
High Energy Accelerator Research Organization (KEK), Tsukuba 305-0801
SOKENDAI (The Graduate University for Advanced Studies), Hayama 240-0193
Y. Usov
Budker Institute of Nuclear Physics SB RAS, Novosibirsk 630090
Novosibirsk State University, Novosibirsk 630090
S. E. Vahsen
University of Hawaii, Honolulu, Hawaii 96822
R. Van Tonder
University of Bonn, 53115 Bonn
G. Varner
University of Hawaii, Honolulu, Hawaii 96822
C. H. Wang
National United University, Miao Li 36003
E. Wang
University of Pittsburgh, Pittsburgh, Pennsylvania 15260
P. Wang
Institute of High Energy Physics, Chinese Academy of Sciences, Beijing 100049
M. Watanabe
Niigata University, Niigata 950-2181
S. Watanuki
Université Paris-Saclay, CNRS/IN2P3, IJCLab, 91405 Orsay
X. Xu
Soochow University, Suzhou 215006
B. D. Yabsley
School of Physics, University of Sydney, New South Wales 2006
W. Yan
Department of Modern Physics and State Key Laboratory of Particle Detection and Electronics, University of Science and Technology of China, Hefei 230026
S. B. Yang
Korea University, Seoul 02841
H. Ye
Deutsches Elektronen–Synchrotron, 22607 Hamburg
J. H. Yin
Korea University, Seoul 02841
Z. P. Zhang
Department of Modern Physics and State Key Laboratory of Particle Detection and Electronics, University of Science and Technology of China, Hefei 230026
V. Zhilich
Budker Institute of Nuclear Physics SB RAS, Novosibirsk 630090
Novosibirsk State University, Novosibirsk 630090
V. Zhukova
P.N. Lebedev Physical Institute of the Russian Academy of Sciences, Moscow 119991
Abstract
We report the first search for the penguin-dominated process using a semi-inclusive method. A 121.4 integrated luminosity data set collected by the Belle experiment, at the KEKB asymmetric-energy collider, is used. We observe no statistically significant signal and, including all uncertainties, we set a 90% confidence level upper limit on the partial branching fraction at 1.4 10-3 for 2.4 GeV/.
††preprint: Belle Preprint 2021-01KEK Preprint 2020-40
The study of the decay of mesons — bound states of a antiquark and either a , , , or quark — has been fruitful for the interrogation of rare processes, elucidating the strong and weak interactions of the Standard Model (SM) of particle physics. According to the SM flavor-changing neutral currents are forbidden in decays at leading-order, but may effectively occur at higher-order in “penguin” processes, where is the beauty quantum number [1].
The CLEO collaboration measured a larger than expected branching fraction (BF) for the charmless decay (decays whose primary decay products lack a charm quark) as = [4.6 1.1 (stat.) 0.4 (syst.) 0.5 (bkg.)] 10-4, with 2.35 GeV/, where the third uncertainty is due to the background subtraction [2, 3]. BABAR measured = [3.9 0.8 (stat.) 0.5 (syst.) 0.8 (model)] 10-4, for the same requirement [4]. Here, “model” refers to the fragmentation uncertainty of the . Belle previously measured the BF for the related process as () = [26.1 3.0 (stat.) (syst.) (model)] [5].
While the meson itself is interesting [6] as its mass is higher than is expected from symmetry considerations, it is the unexpected BF enhancement seen in the measurements that has generated considerable interest. In Ref. [7], for example, the predicted BF for a four-quark SM prediction for is 1.3 . Explanations for this apparent enhancement focus on processes such as the transition, which is modified to an anomalous process, where , with the gluon coupling to the singlet [8, 9, 10, 11, 12, 13, 14]. Hence, glueball coupling may provide an explanation for these decays involving the
Inclusive processes have not yet been investigated using the meson. We report the first search for the decay using a semi-inclusive method [15] with data collected at the resonance by the Belle detector at the KEKB asymmetric-energy collider in Japan [16].
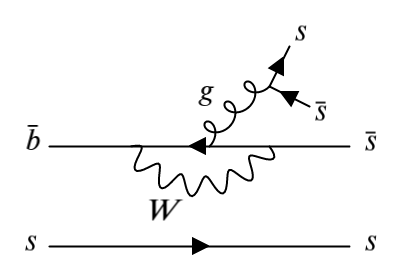
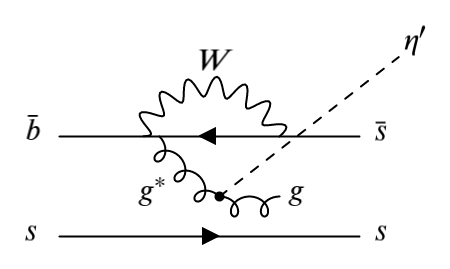
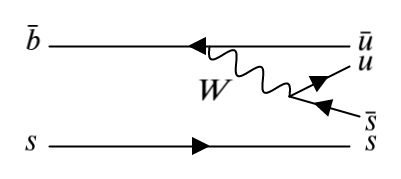
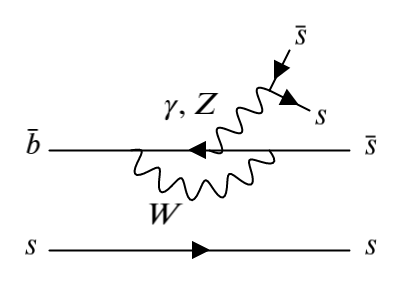
To lowest order, the amplitude for contains contributions from QCD penguin diagrams 111In Fig. 1(b), there is a soft gluon in the hadronization process, which is required to conserve color but is conventionally not shown in the Feynman diagram [18], the anomalous coupling, the tree-level color-suppressed diagram, and the electroweak penguin diagrams, shown in Fig. 1. Contributions from penguin annihilation diagrams are typically omitted as they are suppressed by a factor of , where is the quantum chromodynamic scale and is the mass of the beauty quark [18].
(a)QCD Penguin
(b)QCD Penguin
(c) Coupling
(d)Color-Suppressed Tree
(e)Electroweak Penguin
(f)Color-Suppressed Electroweak Penguin
Figure 1: Lowest-order diagrams contributing to .
The Belle detector is a large-solid-angle magnetic
spectrometer that consists of a silicon vertex detector (SVD),
a 50-layer central drift chamber (CDC), an array of
aerogel threshold Cherenkov counters (ACC),
a barrel-like arrangement of time-of-flight
scintillation counters (TOF), and an electromagnetic calorimeter
comprised of CsI(Tl) crystals (ECL) located inside
a superconducting solenoid coil that provides a 1.5 T
magnetic field. An iron flux-return located outside of
the coil is instrumented to detect mesons and to identify
muons. For the data sample, Belle used a 1.5 cm radius beampipe, a 4-layer SVD, and a small-inner-cell CDC [19].
We use the 121.4 data sample recorded by Belle, taken at the center-of-mass (CM) energy , which corresponds to the resonance. The decays to pairs with a branching fraction of 0.172 0.030 and of this fraction the has three channels for the decays: , and , and . The rates are 87.0%, 7.3%, and 5.7%, respectively [20]. This corresponds to (7.11 1.30) 106 pairs, the world’s largest sample in collisions. A blind analysis is performed, whereby the selection criteria are first optimized on Monte Carlo (MC) simulations before being applied to the data. A signal MC sample for is generated using EvtGen [21] and the detector response is simulated using GEANT3 [22], with PHOTOS describing final-state radiation [23]. The MC-generated mass of the system is bounded below by the two-(charged) kaon mass 0.987 GeV/ and has an upper bound of 3.0 GeV/. The mass is generated as a flat distribution and is fragmented by Pythia 6 [24]. The flat distribution reduces model dependence and allows for an analysis that does not depend on the mass distribution.
The () and () candidates are reconstructed using a semi-inclusive method in which the is reconstructed as a system of two kaons, either or , and up to four pions with at most one , where the decays via the channel . The is reconstructed in the channel . The experimental signature is divided into two classes of decay modes: without () and with () a . These classes are analyzed separately, with the weighted average BFs taken at the end. Charge-conjugate decays are included unless explicitly stated otherwise.
Charged particle tracks are required to satisfy loose impact parameter requirements to remove mismeasured tracks [15], and have transverse momenta greater than 50 MeV/. Separation of the charged kaons and charged pions is provided by the CDC [25], ACC [26], and the TOF [27] systems. Information from these subdetectors is combined to form a likelihood ratio for the charged kaon hypothesis: = /( + ). For this analysis, the selections 0.6 for and 0.6 for are applied. The efficiency to correctly identify a pion (kaon) is 98% (88)%, with a misidentification rate of 4% (12)% [5].
The candidate mass range is [0.089, 0.180] GeV/ (5 window). The candidates are kinematically constrained to the nominal mass [28]. In the ECL, the photons constituting the are required to have energies greater than 50 MeV in the barrel region, greater than 100 MeV in the endcaps, and the ratio of their energy depositions in a 33 ECL crystal array to that in a 55 crystal array around the central crystal, is required to be greater than 0.9. To further reduce combinatorial background, a requirement on the laboratory-frame momentum to be greater than 0.2 GeV/ is imposed.
The is reconstructed in a two-photon asymmetric invariant mass window [0.476, 0.617] GeV/ (4.5, 9.2, from signal MC samples, after all final selections are applied), where and refer to the left and right sides of the mean of the mass distribution. The asymmetry is due to energy leakage in the ECL, causing the mass distribution to be asymmetric. Each photon is required to have 0.1 GeV. A requirement on the photon-energy asymmetry ratio 0.6 is applied to further suppress the background. The mesons are reconstructed in a maximally efficient mass window [0.933, 0.982] GeV/ (approximately 7.0, from signal MC samples, after all final selections are applied). The and masses are kinematically fit to the world average [28]. The mass range of the is [0.487, 0.508] GeV/ (3 window).
The system is reconstructed as a system of kaons and pions, which is in turn combined with the to form candidates. Two variables important in extracting the signal are the energy difference , defined as and the beam-energy-constrained mass, defined as , where , is the energy of the , and is the magnitude of the three-momentum in the CM frame of the colliding beams.
The dominant nonpeaking background is from continuum with others coming from generic and decays. An initial reduction in continuum background (, = , , , ) is done with a selection on the ratio of the second to the zeroth order Fox-Wolfram moments 0.6 [29]. A neural network (NN), NeuroBayes [30], is used to further suppress continuum background, with other backgrounds being reduced as well. The NN is trained to primarily discriminate between event topologies using event shape variables [31]. Signal events have a spherical topology, while continuum background events are jetlike. The NN is trained using these variables on independent signal and continuum background MC simulations. The NN output variable describes, effectively, the probability that a candidate came from an event whose topology is spherical or jetlike.
To obtain a specific selection, the figure-of-merit (FOM) is optimized as a function of , where and are the fitted signal and background yields from an MC sample that is passed through the trained network. This MC contains an approximately data-equivalent background and an enhanced signal. This was done assuming () = 210-4; this is 1.6 standard deviations below the BABAR central value for . The value of corresponding to the maximum value of the FOM is selected. Events having values below this selection are rejected. Separate optimizations are done for and , which have substantially different background levels and efficiencies. The NN requirement reduces continuum background by more than 97% in both cases, while preserving 39% and 53% of signal events for and , respectively.
After an initial requirement of GeV/, GeV, and 2.4 GeV/, and after all final selections are applied, there are an average of 6.4 candidates per event for and 26.0 for . To select the best candidate per event, the candidate with the smallest given by is selected, where is calculated on a candidate-by-candidate basis, and is the mean energy difference of the distribution, obtained through studies of signal MC of individual exclusive decay modes; is the width of these distributions. Here is the reduced from a successful vertex fit of the primary charged daughter particles of the .
From signal MC, the efficiency of the best candidate selection is 85.5% for and 43.2% for , in the signal region. The fraction of candidates passing best candidate selection that are correctly reconstructed is 94.0% for and 60.4% for . These numbers are obtained after all final selections are applied.
Other backgrounds were studied as sources of potential peaking background. Due to the signal final state, it is difficult to have backgrounds that will be equivalent in topology and strangeness, and that are not highly suppressed. However, one such unmeasured mode is . Reconstruction efficiency is estimated using MC events and an expected number of peaking events is determined. For the BF is assumed to be similar to , for which the world average is [1.1 1.0] [28]. After applying all final selections, the total number of expected peaking events is less than one. There is a negligible amount of peaking background based on studies of MC samples.
The decay can contribute to peaking background if the pion from is misidentified. The world average BF is [2.8 0.6] [28]. From this and the pion misidentification rate, we expect the background contribution from this mode to be negligible.
The color-suppressed, tree-level process , with could potentially contribute to the peaking background. However, has a measured BF of = [1.38 0.16] 10-4. The process is Cabibbo-suppressed and has a measured BF of = [4.08 0.06] 10-3 [28]. Assuming symmetry, we expect there to be less than one event from , for this analysis.
For signal extraction, fitting is done in 0.2 GeV/ bins of mass, up to 2.4 GeV/, using unbinned maximum-likelihood fits. All submodes are combined for fitting. Signal extraction is done by fitting the distribution in the region GeV/, 0.12 0.05 GeV.
The has three channels for decays: , and , and . The corresponding rates are 87.0%, 7.3%, and 5.7%, respectively [20]. The low-energy photon from is not reconstructed. This has the effect of shifting the mean of the distribution to a value of approximately 50 MeV. As a result, there are three signal peaks in the beam-energy-constrained mass distribution.
The signal in beam-energy-constrained mass is modeled as the sum of three Gaussian probability density functions (PDFs) that correspond to the three decays described above. Their shape parameters (means and widths of the signal Gaussians) are determined from a data control sample and are fixed in the fit to data. The nonpeaking background fit component is an ARGUS PDF [32] with a fixed shape parameter, determined from fits to data NN sidebands. The ARGUS endpoint is fixed at 5.434 GeV/, the kinematic limit of . The full model is the sum of the signal and background PDFs, with the signal and background yields allowed to float.
The signal reconstruction efficiency, defined as , is determined from fitting signal MC sample, in each mass bin after all selections are applied. Here, , is the number of generated mesons in the signal MC sample. The quantity is the number of generated mesons that do not belong to either of the two classes of signal modes: and 222The number of unreconstructed modes is discussed in the the appendix. The quantity is the number of events found from the Gaussian signal fit in the th mass bin.
The BF is calculated as
, where denotes the mass bins of , the are the bin-by-bin MC signal reconstruction efficiencies , corrected for data-MC discrepancies in NN selection, best candidate selection, particle identification, tracking efficiency, reconstruction, reconstruction, and reconstruction. The quantity is the number of fitted signal events and the quantity is the total number of produced pairs.
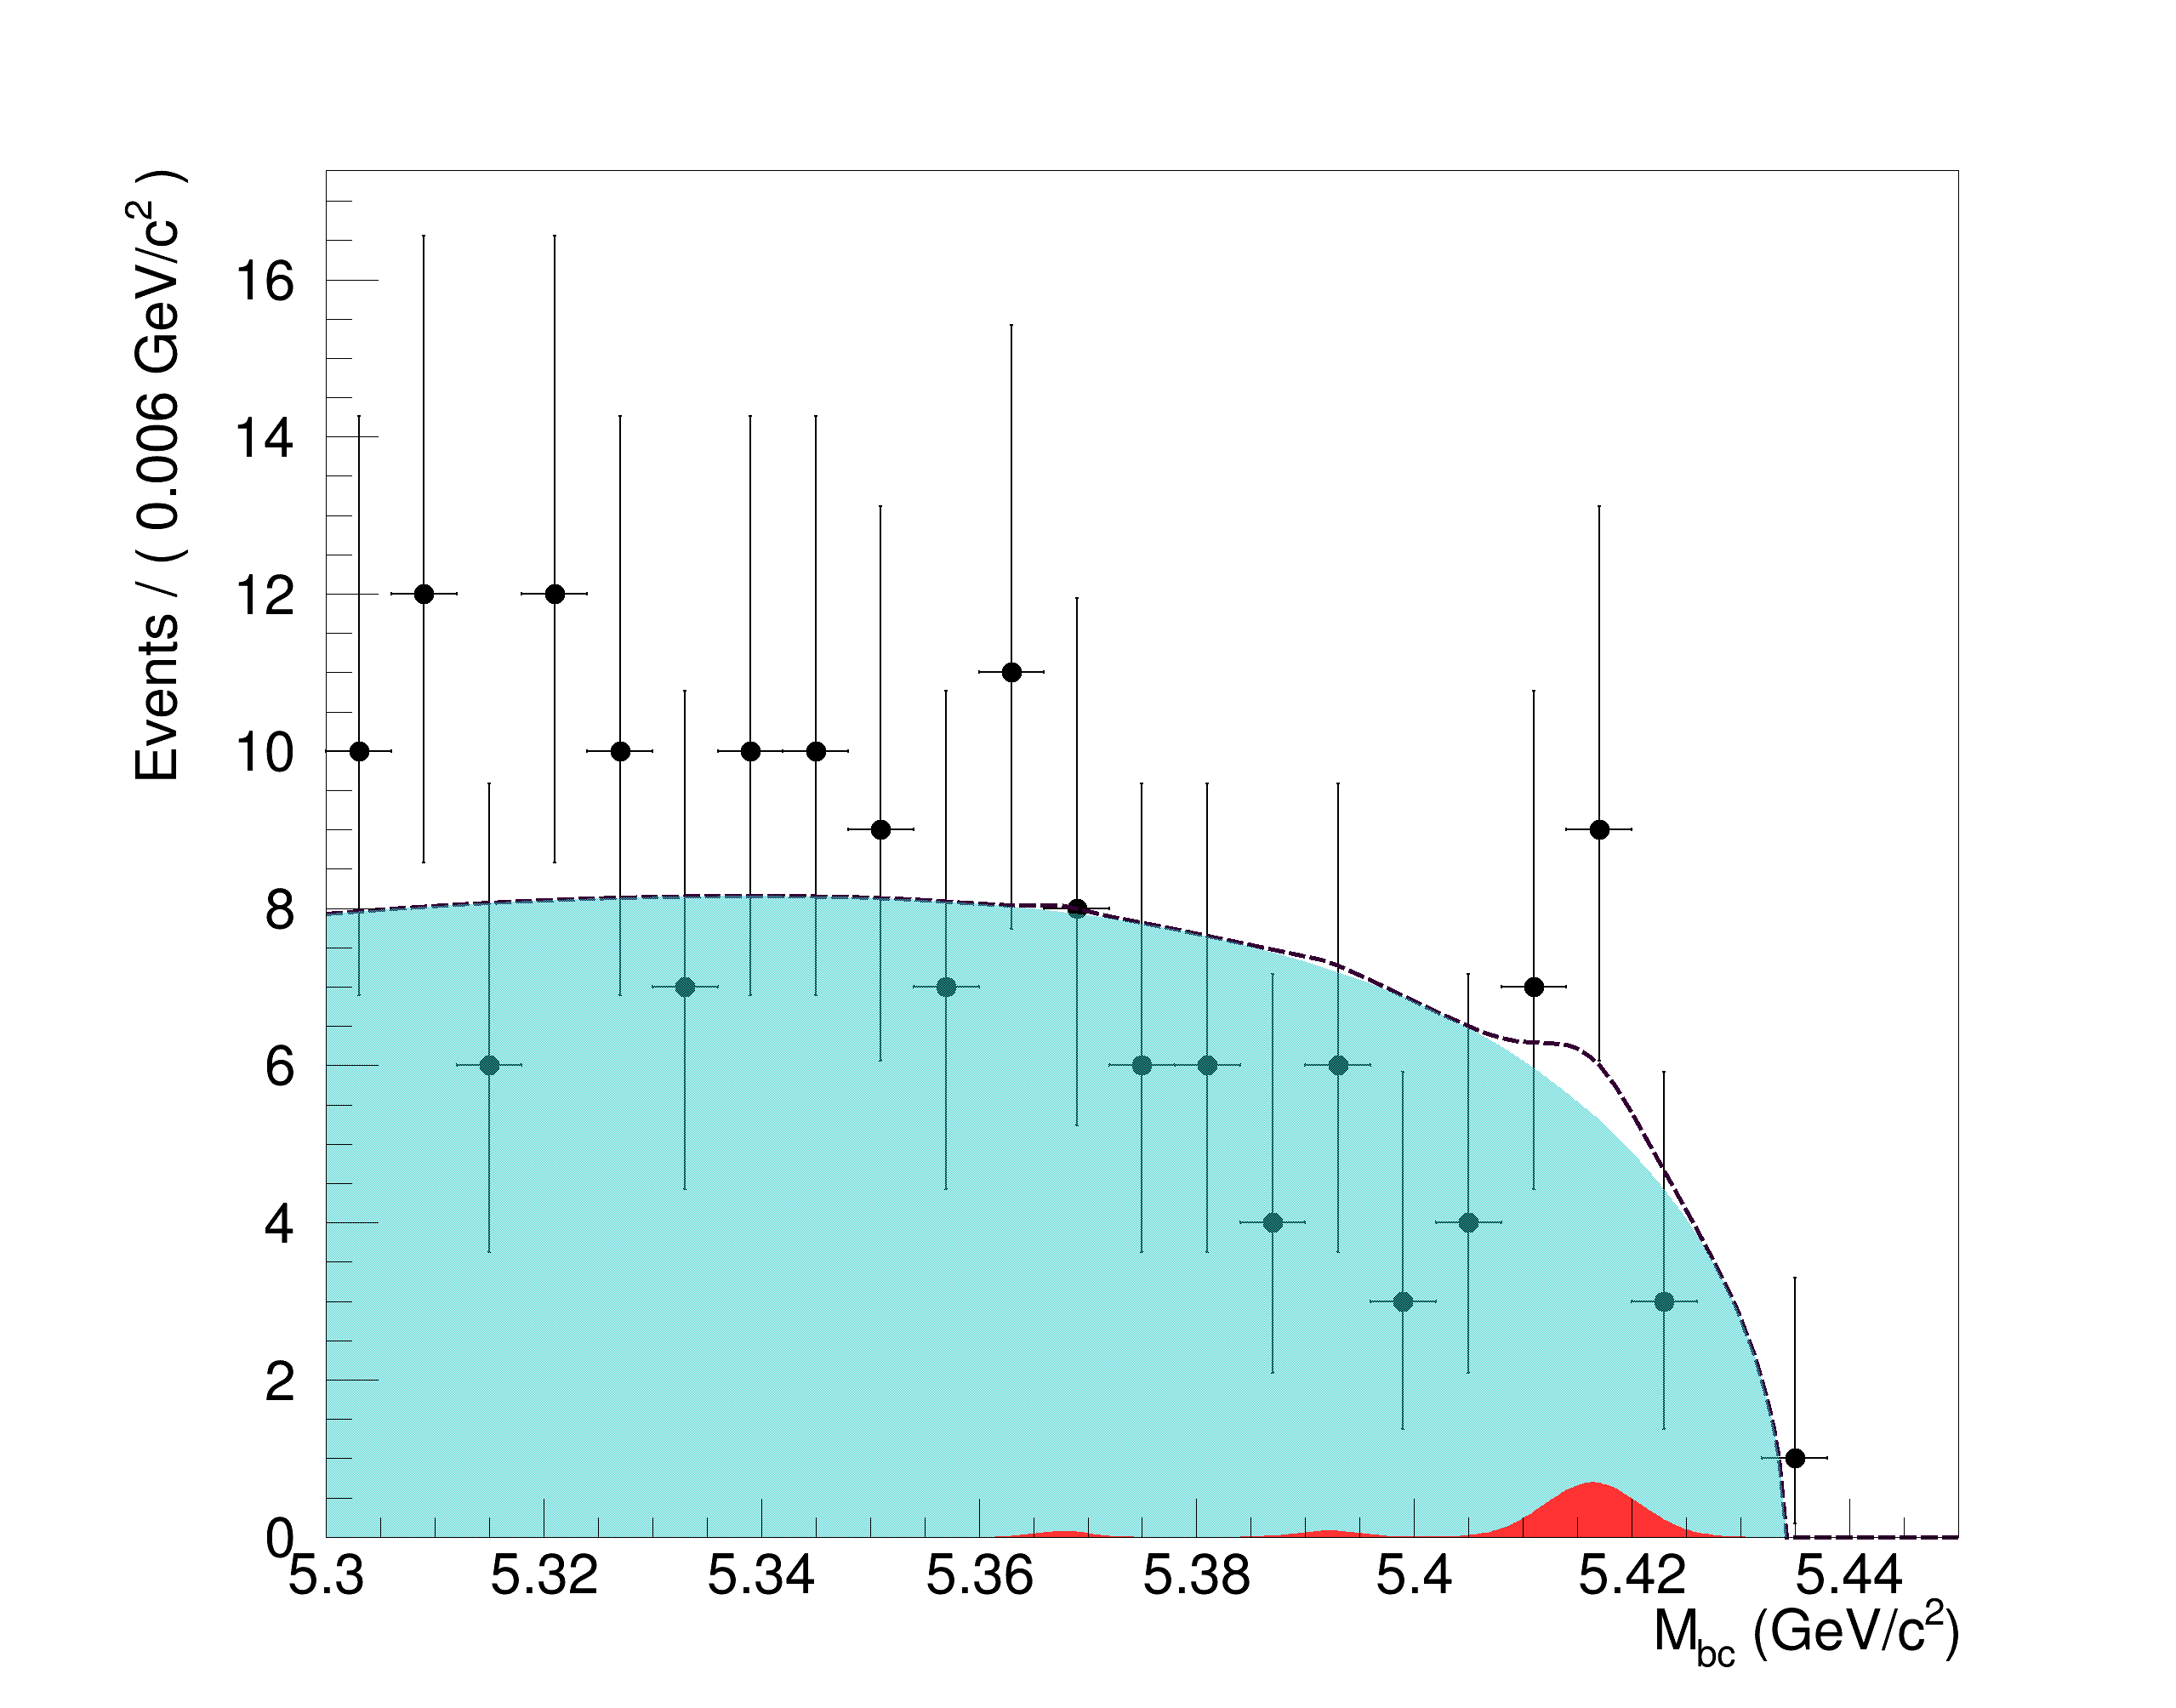
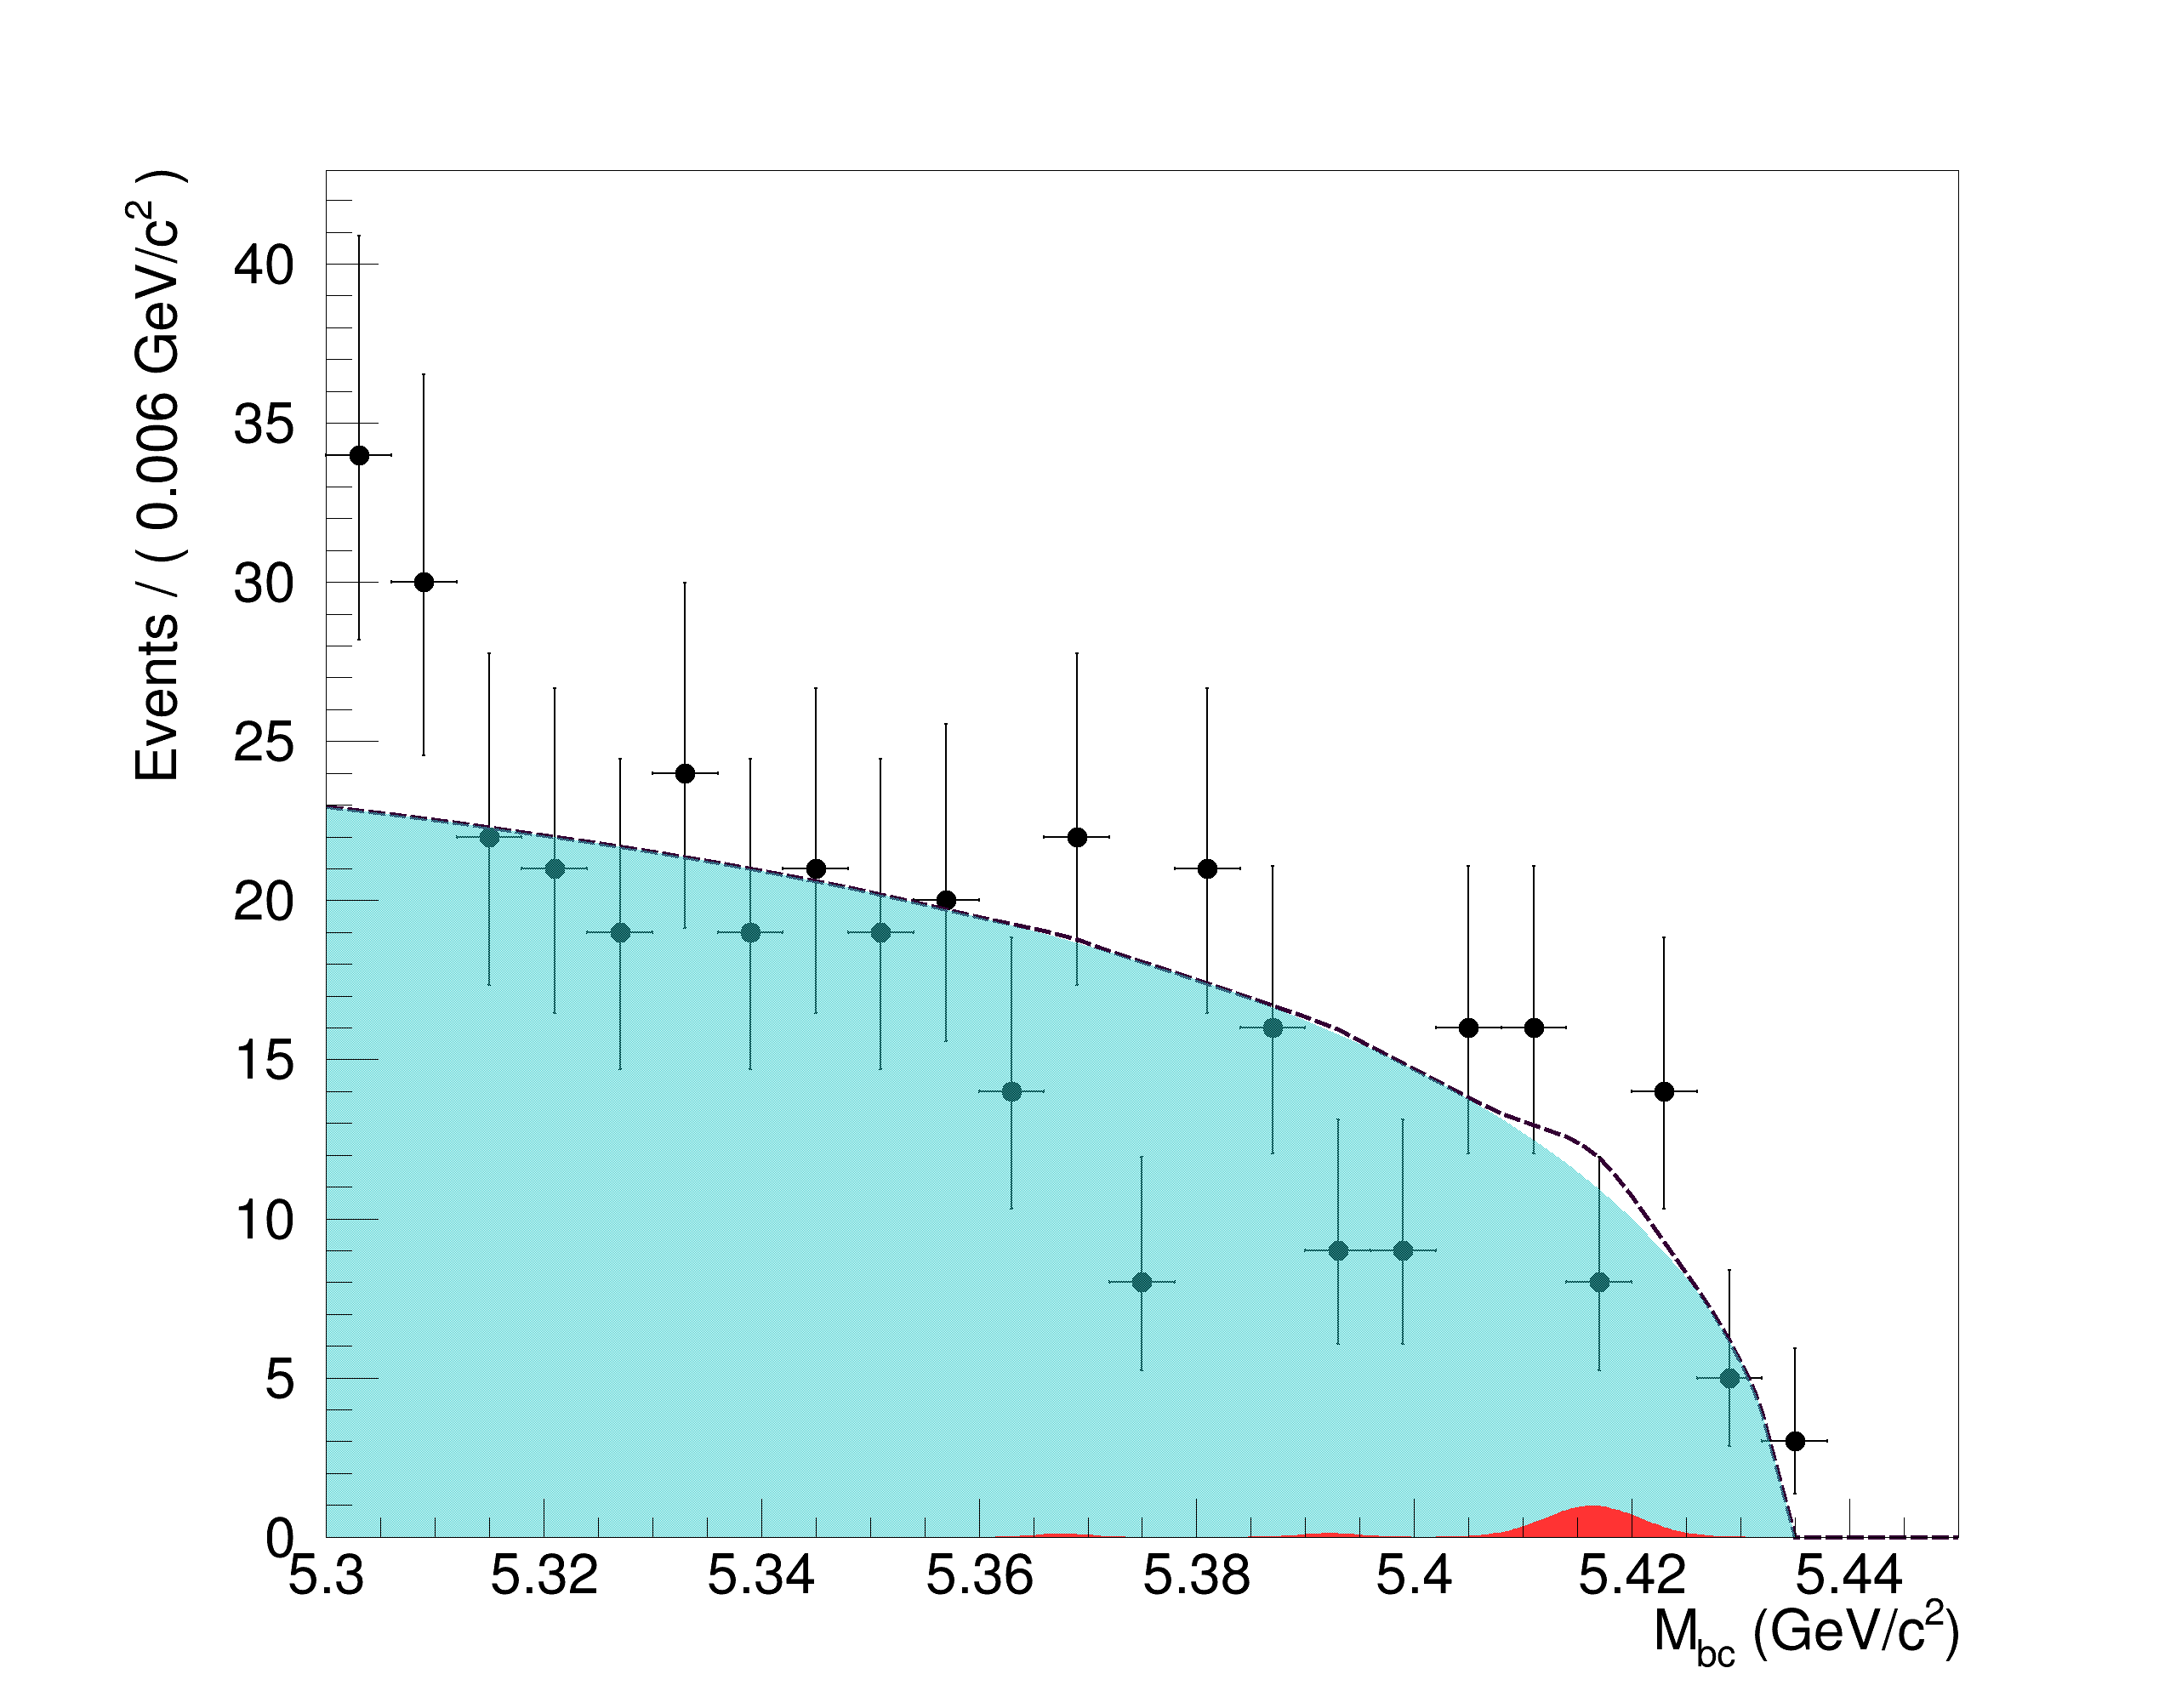
Figures 2 and 3 show the sum of the fits, whose results are listed in Tables 1 and 2, respectively, overlaid on the data. The central value for () is estimated to be the weighted average of the total BF central values for and . These are obtained by summing the BFs listed in Tables 1 and 2, for and , respectively. The weights for the average central value are obtained from the statistical uncertainties.
The dominant uncertainties are due to the fragmentation. Other systematic uncertainties include neural network selection, uncertainties related to track finding and identification, best candidate selection, neutral meson reconstruction, subdecay branching fractions, production models, and the number of pairs. A detailed discussion of the uncertainties is given in the accompanying appendix. Systematic uncertainties are added in quadrature; fragmentation model (FM) 333The term “FM” is used in this paper but is known as “model” in Ref. [4]. uncertainties are added linearly within a class and for the final weighted average, these class sums are added in quadrature.
The statistical significance in each mass bin is calculated as , where is the likelihood at zero signal yield and is the maximum likelihood. No statistically significant excess of events is observed in any mass bin. We set an upper limit on the partial BF (a BF with the requirement 2.4 GeV/) at 90% confidence level by integrating a Gaussian likelihood function whose standard deviation is estimated by the sum in quadrature of the positive statistical and systematic uncertainties. The standard deviation, , is approximately 8.6 10-4. The integral is restricted to the physically allowed region above zero, giving an upper limit on (). As a result, 1.68 is added to the weighted average central value to obtain the 90% confidence level upper limit.
Figure 2: Sum of the fits to all bins overlaid on the distribution, for the decay for submodes and 2.4 GeV/ and with all selections applied. The light blue shaded region is the sum of the background fits, the red shaded region is the sum of the signal fits, and the black dashed curve is the sum of the two.Figure 3: Sum of the fits to all bins overlaid on the distribution, for the decay for submodes and 2.4 GeV/ and with all selections applied. The light blue shaded region is the sum of the background fits, the red shaded region is the sum of the signal fits, and the black dashed curve is the sum of the two.
Table 1: Results for the submodes, from the 121.4 fb-1 data set; the table contains the bin in units of GeV/, corrected reconstruction efficiency (), number of fitted signal events , and , the central value of the partial BF.
(%)
(10-4)
1.0 - 1.2
3.60 0.08
0.4
0.05 (stat.) (syst.)
1.2 - 1.4
2.82 0.08
0.08
0.01 (stat.) (syst.)
1.4 - 1.6
0.90 0.04
0.7
0.3 (stat.) (syst.)
1.6 - 1.8
0.54 0.03
0.4
0.3 (stat.) syst.)
1.8 - 2.0
0.34 0.03
1.4
1.7 (stat.) (syst.)
2.0 - 2.2
0.22 0.02
0.3
0.6 (stat.) (syst.)
2.2 - 2.4
0.14 0.02
2.3
7.0 (stat.) (syst.)
Table 2: Results for the submodes, from the 121.4 fb-1 data set; rows with dashes indicate bins where no events, background or signal, were found; the table contains the bin in units of GeV/, corrected reconstruction efficiency (), number of fitted signal events , and , the central value of the partial BF.
(%)
(10-4)
1.0 - 1.2
0.016 0.006
0.0
-
1.2 - 1.4
0.24 0.02
0.3
0.5 (stat.) (syst.)
1.4 - 1.6
0.86 0.04
2.0
1.0 (stat.) (syst.)
1.6 - 1.8
0.65 0.04
1.2
0.8 (stat.) (syst.)
1.8 - 2.0
0.45 0.03
4.8
4.4 (stat.) (syst.)
2.0 - 2.2
0.36 0.03
2.4
2.8 (stat.) (syst.)
2.2 - 2.4
0.16 0.02
1.1
2.6 (stat.) (syst.)
The central value of the BF is () = [0.7 8.1 (stat.) 0.7 (syst.) (FM) 0.1 (N)] 10-4 for 2.4 GeV/.
The FM uncertainty is obtained by considering alternate sets of fragmentation parameter values in Pythia and redetermining the signal reconstruction efficiency 444Estimates of the FM uncertainty are given in the appendix..
The corresponding upper limit at 90% confidence level on the partial BF, including all uncertainties, is 1.4 10-3 for 2.4 GeV/. If symmetry holds, then the BFs of and would be equivalent and their ratio, () = ()/() would be close to 1 [18]. The measured BF for the decay is [3.9 0.8 (stat.) 0.5 (syst.) 0.8 (model)] 10-4 [4]. Using this and the weighted average BF given previously for , () is approximately 0.2 . Applying the same method as used to calculate the upper limit on (), the 90% confidence level upper limit on () is 3.5.
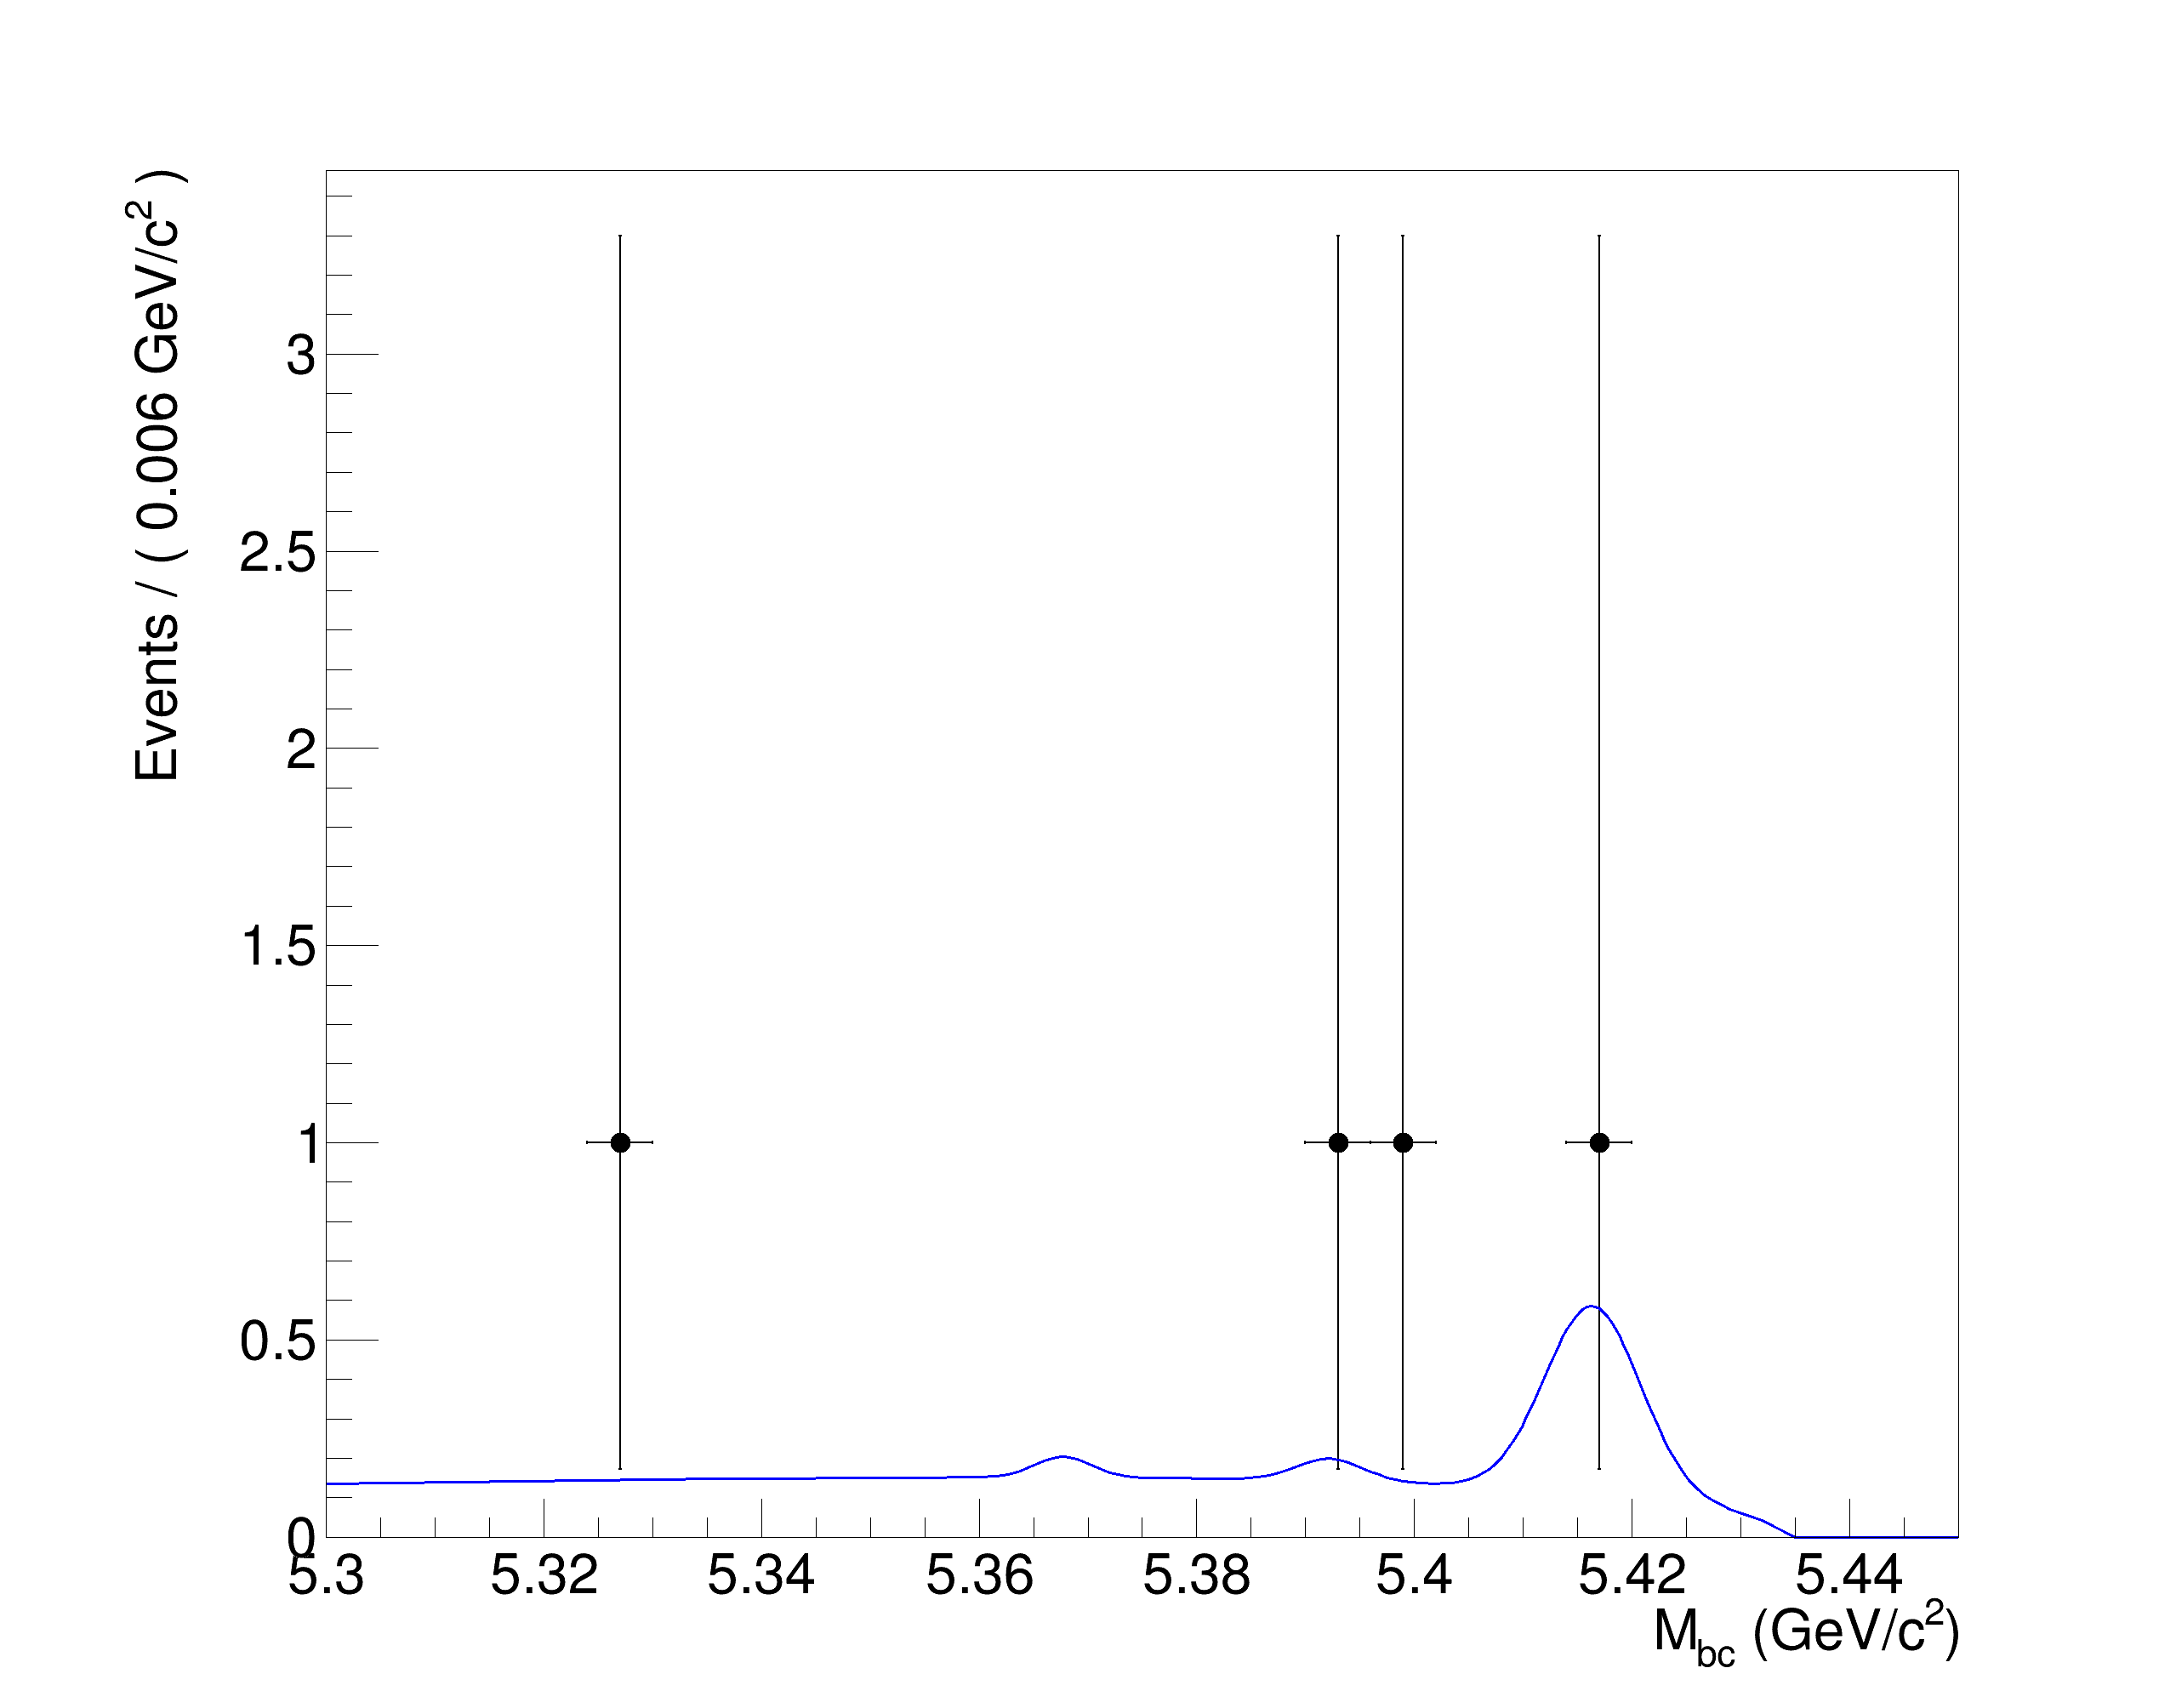
As a by-product of the preceding measurement, we searched for the decay , with . This decay was searched for in the mass subrange [1.006, 1.03] GeV/ (3 window). From MC simulations, the reconstruction efficiency is determined to be 7.90 0.03%. No statistically significant signal is found and the upper limit at 90% confidence level is determined to be 3.610-5. The result from fitting is shown in Fig. 4. LHCb determines the upper limit at 90% confidence level to be 8.210-7 [36].
Figure 4: decay results for M() 3 mass range
To conclude, we set an upper limit on the partial BF for the decay , for 2.4 GeV/. Including all uncertainties, the upper limit at 90% confidence level is determined to be 1.4 10-3. This is the first result for the inclusive decay and should motivate further studies, both experimental and theoretical, of inclusive meson processes and symmetries.
Acknowledgements.
We thank the KEKB group for the excellent operation of the
accelerator; the KEK cryogenics group for the efficient
operation of the solenoid; and the KEK computer group, and the Pacific Northwest National
Laboratory (PNNL) Environmental Molecular Sciences Laboratory (EMSL)
computing group for strong computing support; and the National
Institute of Informatics, and Science Information NETwork 5 (SINET5) for
valuable network support. We acknowledge support from
the Ministry of Education, Culture, Sports, Science, and
Technology (MEXT) of Japan, the Japan Society for the
Promotion of Science (JSPS), and the Tau-Lepton Physics
Research Center of Nagoya University;
the Australian Research Council including grants
DP180102629, DP170102389, DP170102204, DP150103061, FT130100303; Austrian Federal Ministry of Education, Science and Research (FWF) and
FWF Austrian Science Fund No. P 31361-N36;
the National Natural Science Foundation of China under Contracts
No. 11435013, No. 11475187, No. 11521505, No. 11575017, No. 11675166, No. 11705209; Key Research Program of Frontier Sciences, Chinese Academy of Sciences (CAS), Grant No. QYZDJ-SSW-SLH011; the CAS Center for Excellence in Particle Physics (CCEPP); the Shanghai Pujiang Program under Grant No. 18PJ1401000; the Shanghai Science and Technology Committee (STCSM) under Grant No. 19ZR1403000; the Ministry of Education, Youth and Sports of the Czech
Republic under Contract No. LTT17020;
Horizon 2020 ERC Advanced Grant No. 884719 and ERC Starting Grant No. 947006 “InterLeptons” (European Union);
the Carl Zeiss Foundation, the Deutsche Forschungsgemeinschaft, the
Excellence Cluster Universe, and the VolkswagenStiftung;
the Department of Atomic Energy (Project Identification No. RTI 4002) and the Department of Science and Technology of India;
the Istituto Nazionale di Fisica Nucleare of Italy;
National Research Foundation (NRF) of Korea Grant
Nos. 2016R1D1A1B01010135, 2016R1D1A1B02012900, 2018R1A2B3003643,
2018R1A6A1A06024970, 2018R1D1A1B07047294, 2019K1A3A7A09033840,
2019R1I1A3A01058933;
Radiation Science Research Institute, Foreign Large-size Research Facility Application Supporting project, the Global Science Experimental Data Hub Center of the Korea Institute of Science and Technology Information and KREONET/GLORIAD;
the Polish Ministry of Science and Higher Education and
the National Science Center;
the Ministry of Science and Higher Education of the Russian Federation, Agreement 14.W03.31.0026, and the HSE University Basic Research Program, Moscow; University of Tabuk research grants
S-1440-0321, S-0256-1438, and S-0280-1439 (Saudi Arabia);
the Slovenian Research Agency Grant Nos. J1-9124 and P1-0135;
Ikerbasque, Basque Foundation for Science, Spain;
the Swiss National Science Foundation;
the Ministry of Education and the Ministry of Science and Technology of Taiwan;
and the United States Department of Energy and the National Science Foundation.
*
Appendix A DISCUSSION OF SYSTEMATIC UNCERTAINTIES
The upper limits at 90% confidence level up to a given mass bin are given in Table 3.
Table 3: 90% upper limits. Upper limit per bin corresponds to the upper limit up to and including that bin in units of .
(10-4)
(10-4)
1.2
0.05 0.26 (stat.) (syst.)
0.4
1.4
0.08 0.40 (stat.) (syst.)
0.7
1.6
0.6 1.0 (stat.) (syst.)
1.9
1.8
1.1 1.5 (stat.) (syst.)
3.1
2.0
3.8 2.7 (stat.) (syst.)
7.6
2.2
3.4 4.8 (stat.) (syst.)
11.1
2.4
0.7 8.1 (stat.) (syst.)
13.8
Additive systematic uncertainties are from the PDF parameterization and fit bias. The parameters of the Gaussian signal PDF are allowed to float within their 1 errors (determined from the control fit to the data) and the data are refitted for the signal yield. The difference in signal yield between the fixed and floated parameterization is taken as the PDF uncertainty. The same is done for the background ARGUS PDF.
The fit bias uncertainty is determined by generating and fitting 5000 MC pseudoexperiments for several assumptions of the branching fraction. This is done using RooStats [37]. The number of fitted signal events versus the number of generated signal events is fitted with a first-order polynomial and the offset from zero of the fit along the y-axis is taken as the uncertainty due to fit bias. The fit bias uncertainty is less than one event. The PDF and fit bias uncertainties are added in quadrature for a total additive systematic uncertainty. This is combined with the statistical errors and quoted as the first uncertainty in Tables I and II in the main report. For , an uncertainty of 1.1 (26% of the fitted, positive statistical uncertainty) and 1.3 (34%) events are obtained in mass bins 1.8 - 2.0 GeV/ and 2.0 - 2.2 GeV/, respectively. All others had uncertainties of less than one event. For , the 1.6 - 1.8 GeV/, 1.8 - 2.0 GeV/, 2.0 - 2.2 GeV/, and 2.2 - 2.4 GeV/ bins have uncertainties of 1.0 (55%), 1.2 (54%), 3.1 (156%), and 3.0 (132%) events, respectively. All other mass bins each have an uncertainty of less than one event. Additive systematic uncertainties are added in quadrature with the asymmetric fit errors on the signal yield.
Multiplicative systematic uncertainties due to the fragmentation model (FM) of by Pythia 6 [24] are obtained by varying a group of Jetset parameters - PARJ(1, 2, 3, 4, 11, 12, 13, 25, 26), described in Table 4 - which are varied together away from the standard Belle default to reduce and enhance the (uncorrected) reconstruction efficiency, giving two sets of parameters for each bin. These alternative tunings (“AT”) are given in Table 5. They are motivated by the parameter studies in other inclusive analyses [38, 39, 5, 40, 41]. The uncertainty is determined from the fractional change in efficiency with respect to the Belle default parameters. This procedure includes the effect of the change in the proportion of unreconstructed modes. If no increase or decrease in efficiency is found then an uncertainty of zero is assigned. Values for the FM uncertainty, in each mass bin, are given in Tables 8 and 9, obtained from the (uncorrected) efficiencies in Tables 6 and 7.
Table 4: Jetset parameter descriptions
Parameter
Description
PARJ(1)
baryon suppression
PARJ(2)
vs quark suppression
PARJ(3)
quark further suppression
PARJ(4)
spin-1 diquark suppression vs spin-0 diquarks
PARJ(11)
probability of spin-1 light mesons
PARJ(12)
probability of spin-1 strange meson
PARJ(13)
probability of spin-1 meson with or heavier quark
PARJ(25)
suppression factor
PARJ(26)
suppression factor
Table 5: Jetset parameters used to tune the fragmentation of the system in Pythia. Alternative tunings (AT) AT1 and AT2 are used to obtain the systematic uncertainties due to fragmentation.
Table 6: Comparison of uncorrected reconstruction efficiencies and their associated relative systematic uncertainties (%) between Pythia tunings (Standard, AT1, and AT2) given in Table 5, used in systematic uncertainty estimation; tuning is done in 0.2 GeV/ mass bins for modes.
Standard
AT1
AT2
1.0-1.2
3.76 0.09
3.99 0.09
3.75 0.09
1.2-1.4
2.96 0.08
3.04 0.08
2.77 0.08
1.4-1.6
0.96 0.05
1.04 0.05
0.89 0.04
1.6-1.8
0.58 0.04
0.78 0.04
0.49 0.03
1.8-2.0
0.36 0.03
0.48 0.03
0.29 0.03
2.0-2.2
0.24 0.02
0.32 0.03
0.17 0.02
2.2-2.4
0.15 0.02
0.23 0.02
0.11 0.02
Table 7: Comparison of uncorrected reconstruction efficiencies and their associated relative systematic uncertainties (%) between Pythia tunings (Standard, AT1, and AT2) given in Table 5, used in systematic uncertainty estimation; tuning is done in 0.2 GeV/ mass bins for modes.
Standard
AT1
AT2
1.0-1.2
0.016 0.006
0.001 0.004
0.012 0.006
1.2-1.4
0.25 0.02
0.26 0.03
0.21 0.02
1.4-1.6
0.90 0.05
0.79 0.04
0.84 0.05
1.6-1.8
0.68 0.04
0.76 0.04
0.60 0.04
1.8-2.0
0.48 0.04
0.55 0.04
0.38 0.03
2.0-2.2
0.38 0.03
0.47 0.04
0.26 0.03
2.2-2.4
0.18 0.03
0.32 0.03
0.19 0.03
Table 8: Summary of FM multiplicative systematic uncertainties for .
FM (%)
1.0 - 1.2
1.2 - 1.4
1.4 - 1.6
1.6 - 1.8
1.8 - 2.0
2.0 - 2.2
2.2 - 2.4
Table 9: Summary of FM multiplicative systematic uncertainties for .
FM (%)
1.0 - 1.2
1.2 - 1.4
1.4 - 1.6
1.6 - 1.8
1.8 - 2.0
2.0 - 2.2
2.2 - 2.4
From the signal MC that is generated and used to determine signal reconstruction efficiency, the proportion of unreconstructed modes is determined by searching in the generated signal MC for modes that contain an decay submode but fall outside the criteria for a reconstructed submode, i.e. submodes that contain more than one , modes with a , or modes with more than six daughter particles (excluding the ). The proportion of unreconstructed events, defined as /( + ), where is the number of generated events from unreconstructed signal modes in signal MC, and is the number of generated events from reconstructed modes. For , 1.1% of events are unreconstructed in the 1.4-1.6 GeV/ bin, increasing monotonically to 14.5% in the 2.2-2.4 GeV/ bin. For modes, as they are only reconstructed as , there is a corresponding class of modes that involve a instead of a . This causes the proportion of generated signal events to be higher. In the 1.0-1.2 GeV/ bin, 48.1% of reconstructable events are unreconstructed, due to unreconstructed modes. This increases monotonically to 59.7% in the 2.2-2.4 GeV/ bin, of which 84% is due to unreconstructed modes. Using the same signal MC, it is also found that the signal cross-feed efficiency is less than 0.05% in each mass bin and is included in the multiplicative systematic uncertainties.
The control sample is used to determine the systematic uncertainty with respect to the neural network (NN) selection. This uncertainty is obtained by determining the signal yield with and without the neural network selection in both MC and data. The double ratio of these results is determined and its absolute difference from unity is used as the systematic uncertainty. This gives an uncertainty of 6.5% for and 2.1% for . The control sample is also used to obtain the uncertainty for best candidate selection (BCS). The uncertainty is obtained by determining the signal yield with and without best candidate selection in both MC and data. The double ratio of these results is determined and its absolute difference from unity is used as the systematic uncertainty. This gives an uncertainty of 1.0% for and 4.4% for , using the neural network selection of these associated classes of signal modes. The uncertainty for the reconstruction of and is 3.0% [42].
The uncertainty on charged track reconstruction is 0.35% per track [43]. The uncertainty on the efficiency to identify charged kaons and pions is a function of their momenta and polar angles. The uncertainty for and identification is 0.95% and 1.8%, respectively. The reconstruction uncertainty is 1.6% [44]. The total track uncertainty, for each source, per mass bin, is obtained by determining the average charged kaon and charged pion multiplicity () in signal MC and multiplying the uncertainty by that multiplicity, e.g. (0.182). These uncertainties are added linearly as they are uncertainties of common daughters of a single mother particle () and are thus correlated.
The production model (PM) uncertainty leads to a fractional change in reconstruction efficiency of -wave () states in a control sample MC, with and without the model in [45], is implemented. The uncertainty is approximately 0.2% for and 1.1% for . The uncertainty on the subdecay mode branching fractions and are 0.2% and 0.7%, respectively [28]. Estimates of individual multiplicative systematic uncertainties are given in Table 10. Totals of these uncertainties are determined in individual mass bins.
Table 10: Summary of multiplicative systematic uncertainties. The uncertainties for particle identification and reconstruction are evaluated per mass bin.
Uncertainty Source
Value (%)
reconstruction
3.0
reconstruction
1.6
Charged track reconstruction
0.4
ID
0.95
ID
1.3
PM ()
0.2
PM ()
1.1
reconstruction
3.0
NN Selection ()
6.5
NN Selection ()
2.1
BCS ()
1.0
BCS ()
4.4
0.2
0.7
18.3
References
Bevan et al. [2014]A. J. Bevan et al., Eur.
Phys. J. C 74, 3026 (2014).
[15]S. Dubey, Ph.D. thesis, University of
Hawaii at Manoa, Honolulu, HI, 2020
(unpublished), https://docs.belle2.org/record/2344.
Abe et al. [2013]T. Abe et al., Prog.
Theor. Exp. Phys. 2013, 03A001 (2013).
Note [1]In Fig. 1(b), there is a soft gluon in the
hadronization process, which is required to conserve color but is
conventionally not shown in the Feynman diagram [18].
[18]A. Datta (University of Mississippi), private communication.
Brodzicka et al. [2012]J. Brodzicka et al., Prog. Theor. Exp. Phys. 2012, 04D001 (2012).