Percolation thresholds on triangular lattice for neighbourhoods containing sites up-to the fifth coordination zone
Abstract
We determine thresholds for random-site percolation on a triangular lattice for all available neighborhoods containing sites from the first to the fifth coordination zones, including their complex combinations. There are 31 distinct neighbourhoods. The dependence of the value of the percolation thresholds on the coordination number are tested against various theoretical predictions. The newly proposed single scalar index (depending on the coordination zone number , the neighbourhood coordination number and the square-distance to sites in -th coordination zone from the central site) allows to differentiate among various neighbourhoods and relate to . The thresholds roughly follow a power law with .
I Introduction
The concepts of site and bond percolation Stauffer and Aharony (1994); Wierman (2014) introduced in middle fifties Broadbent and Hammersley (1957); Hammersley (1957) and since then have been applied in various fields of science ranging from agriculture Ramírez et al. (2020) via studies of polymer composites Zhang et al. (2020), materials science Cheng et al. (2020), forest fires Malarz et al. (2002), oil and gas exploration Ghanbarian et al. (2020), quantifying urban areas Cao et al. (2020), Bitcoins transfer Bartolucci et al. (2020), diseases propagation Ziff (2021) to transportation networks Dong et al. (2020) (see Refs. Li et al., 2021; Saberi, 2015 for reviews).
Percolation is an example of phenomenon where a geometrical phase transition (on -dimensional lattice) takes place. The critical parameter (called percolation threshold Frisch et al. (1961)) separates two phases: one for a low occupation probability and the other for . In the low- phase the system behaves as an insulator (without connectivity path leading between system boundaries) while for the high- phase there is a giant component spanning the system and connecting opposite boundaries; in effect the system behaves as a conductor, when one refers to the electric analogy.
The percolation thresholds were initially estimated for nearest neighbour interactions Dean (1963); Dean and Bird (1967) but later also complex (or extended) neighbourhoods were studied for 2D (square Dalton et al. (1964); Domb and Dalton (1966); Gouker and Family (1983); Malarz and Galam (2005); Galam and Malarz (2005); Majewski and Malarz (2007); Xun et al. (2021), triangular Dalton et al. (1964); Domb and Dalton (1966); d’Iribarne et al. (1999); Malarz (2020), honeycomb Dalton et al. (1964)), 3D (simple cubic Kurzawski and Malarz (2012); Malarz (2015); Xun et al. (2021)) and 4D (simple hyper-cubic Kotwica et al. (2019)) lattices.
Very recently, we have computed percolation thresholds for random site percolation on triangular lattice with complex neighbourhoods with hexagonal symmetry Malarz (2020). Here we supplement these results with 31 percolation thresholds estimations for all neighbourhoods on triangular lattice containing sites from the first, the second, the third, the fourth and the fifth coordination zones (see Figure 1). Some of these neighbourhoods—those containing sites from the fifth coordination zone—are presented in Figure A1 in Ref. Sup, . The lattice names follow convention proposed in Ref. Xun et al., 2021 reflecting lattice topology (here tr, i.e. triangular lattice) and numerical string specifying the coordination zones, where sites constituting the neighbourhood come from.
Additionally—for triangular lattice and complex neighbourhoods—we test the dependence of on the coordination number , following the idea of Ref. Xun et al., 2021. However, instead of values of the percolation thresholds for selected (mainly compact) neighbourhoods, we use the mean values of percolation thresholds averaged over all available neighbourhoods with given coordination number . Unfortunately, values of do not follow any of dependencies proposed in Ref. Xun et al., 2021.
Finally, we propose a scalar quantity which may be helpful for differentiating among various neighbourhoods. The quantity is based on the coordination zone , the sites number and the sites distances to the central site in the neighbourhood. The dependency of on this newly proposed index follows roughly a power law with an exponent close to .
II Methods
In order to evaluate the percolation thresholds we follow the scheme applied previously in Ref. Malarz, 2020. Namely, we combine Newman and Ziff (2001), Bastas et al. (2014) algorithms with finite size corrections Stauffer and Aharony (1994); Privman (1990) to estimate :
-
1.
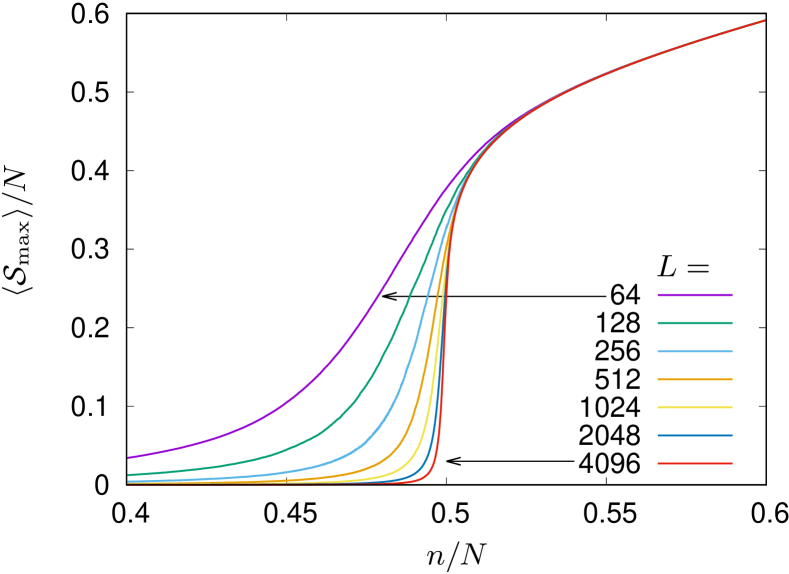
Based on the Newman and Ziff (2001) algorithm we calculate the size of the largest cluster on the number of occupied sites (Figure 2(a)). The brackets represent averaging over lattice realizations. Applying a Gaussian approximation to the Bernoulli distribution
(1) one can calculate
(2) for different values of the occupation probability using the Gauss function:
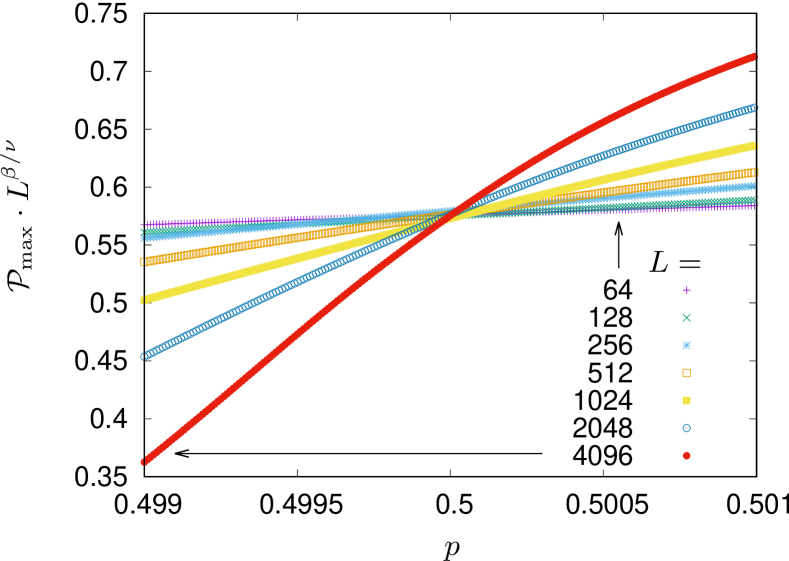
(3) with the expected value and variance . The dependence yields a probability that an arbitrarily chosen site belongs to the largest cluster
(4) for system with sites and the linear system size , 128, 256, 512, 1024, 2048 and 4096 as presented in Figure 2(b);
-
2.
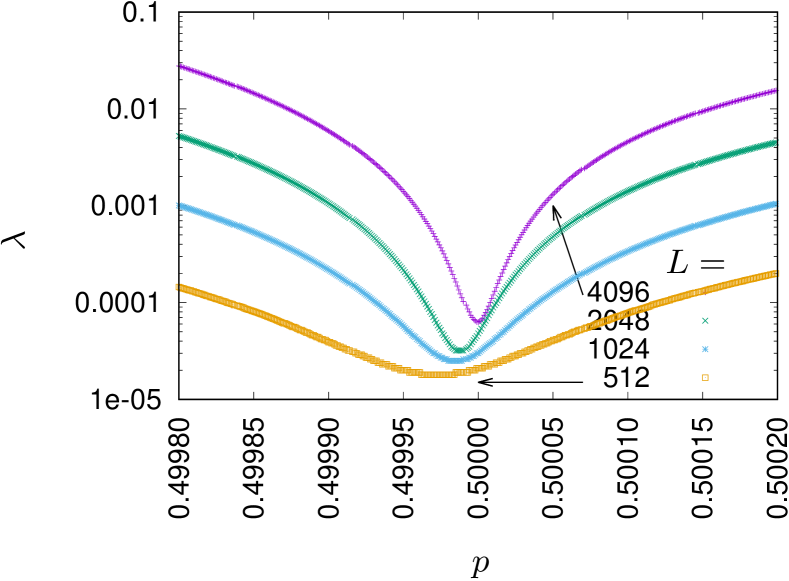
Using Bastas et al. (2014) algorithm we minimize the pair-wise difference
(5) function (see Figure 2(c)) with Bastas et al. (2011) and with exponents and (Stauffer and Aharony, 1994, p. 54). The minimum of estimates the percolation threshold ;
-
3.
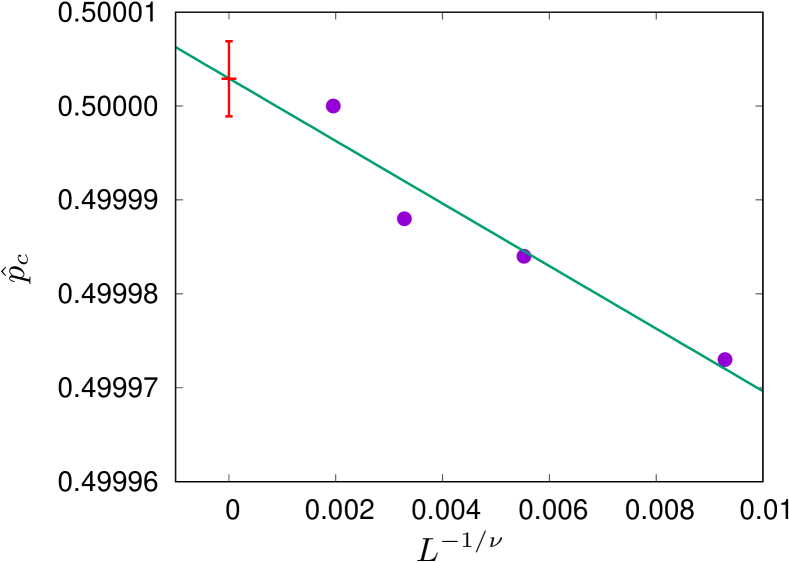
Finally, in Figure 2(d) we plot the estimated values of percolation thresholds for different ranges of summation in Equation 5—up to , , and . According to the standard finite size scaling (Stauffer and Aharony, 1994, p. 77)
(6) where is the percolation threshold for an infinitely large system. The least squares linear fit to data presented in Figure 2(d) predicts and its uncertainty .
| lattice | at | earlier estimations | ||||
| with | ||||||
| tr-1,2,3,4,5 | 36 | 54.8 | 0.1157 40111 | 0.1157370(74)11footnotemark: 1 | 0.1157399(58)11footnotemark: 1 | 0.115847(21) Malarz (2020) |
| tr-2,3,4,5 | 30 | 48.8 | 0.1174 4011footnotemark: 1 | 0.117467(15)11footnotemark: 1 | 0.117460(10)11footnotemark: 1 | 0.117579(41) Malarz (2020) |
| tr-1,3,4,5 | 30 | 45.8 | 0.1215 4811footnotemark: 1 | 0.121583(14)11footnotemark: 1 | 0.1215730(83)11footnotemark: 1 | |
| tr-1,2,4,5 | 30 | 46.8 | 0.1225 9311footnotemark: 1 | 0.1226215(68)11footnotemark: 1 | 0.1226119(30)11footnotemark: 1 | |
| tr-1,2,3,5 | 24 | 33.8 | 0.1522 59 | 0.152297(17) | 0.152282(10) | |
| tr-3,4,5 | 24 | 39.8 | 0.1255 48 | 0.1255511(43) | 0.1255483(43) | |
| tr-2,4,5 | 24 | 40.8 | 0.1266 22 | 0.126653(11) | 0.1266400(40) | |
| tr-2,3,5 | 18 | 27.8 | 0.1616 45 | 0.161664(15) | 0.161653(15) | |
| tr-1,4,5 | 24 | 37.8 | 0.1316 69 | 0.1316677(13) | 0.13166484(66) | 0.131792(58) Malarz (2020) |
| tr-1,3,5 | 18 | 24.8 | 0.1700 42 | 0.1700473(87) | 0.170039(10) | |
| tr-1,2,5 | 18 | 25.8 | 0.1762 42 | 0.176263(11) | 0.1762610(92) | |
| tr-4,5 | 18 | 31.8 | 0.1402 43 | 0.1402453(79) | 0.1402382(92) | 0.140286(5) Malarz (2020) |
| tr-3,5 | 12 | 18.8 | 0.1957 03 | 0.1956981(14) | 0.1957039(24) | |
| tr-2,5222equivalent of TR-1,2 | 12 | 19.8 | 0.2902 68 | 0.290280(20) | 0.290279(17) | |
| tr-1,5 | 12 | 16.8 | 0.2095 62 | 0.209563(13) | 0.209561(10) | |
| tr-5333equivalent of TR-1 | 6 | 10.8 | 0.5000 00 | 0.5000029(40) | 0.4999961(55) | Malarz (2020) |
| tr-1,2,3,4 | 30 | 44 | 0.1358 1311footnotemark: 1 | 0.135817(29)11footnotemark: 1 | 0.135823(27)11footnotemark: 1 | |
| tr-2,3,4 | 24 | 38 | 0.1391 15 | 0.1391118(33) | 0.1391117(26) | |
| tr-1,3,4 | 24 | 35 | 0.1443 07 | 0.1443064(38) | 0.1443074(32) | |
| tr-1,2,4 | 24 | 36 | 0.1489 78 | 0.1489791(88) | 0.1489757(74) | |
| tr-3,4 | 18 | 29 | 0.1519 32 | 0.1519532(26) | 0.1519393(35) | |
| tr-2,4 | 18 | 30 | 0.1584 53 | 0.1584634(54) | 0.1584620(43) | |
| tr-1,4 | 18 | 27 | 0.1651 88 | 0.165186(14) | 0.165186(12) | |
| tr-4 | 12 | 21 | 0.1924 37 | 0.1924356(68) | 0.1924428(50) | 0.192410(43) Malarz (2020) |
| tr-1,2,3 | 18 | 23 | 0.2154 62 | 0.21546261(91) | 0.2154657(17) | 0.215484(19) Malarz (2020), 0.215 d’Iribarne et al. (1999) |
| tr-2,3 | 12 | 17 | 0.2320 12 | 0.232019(23) | 0.232020(20) | 0.232008(38) Malarz (2020) |
| tr-1,3 | 12 | 14 | 0.2645 25 | 0.264545(25) | 0.264539(21) | |
| tr-333footnotemark: 3 | 6 | 8 | 0.5000 24 | 0.500027(31) | 0.500013(23) | Malarz (2020) |
| tr-1,2 | 12 | 15 | 0.2902 67 | 0.290261(22) | 0.290258(19) | 0.295 Dalton et al. (1964) |
| tr-233footnotemark: 3 | 6 | 9 | 0.4999 85 | 0.499987(20) | 0.499978(20) | Malarz (2020) |
| tr-1 | 6 | 6 | 0.4999 93 | 0.499994(17) | 0.499996(14) | (Stauffer and Aharony, 1994, p. 17) |
III Results
In Figure 2 we present examples of results used to predict the percolation thresholds as described in Section II.
In Figure 2(a) the dependence of on the number of occupied sites (normalized to the system size ) are presented. The dependence for all discussed neighbourhoods is presented in Figure A2 in Ref. Sup, . With the increase of the system size the curves describing this dependence become steeper and steeper. For infinitely large systems the function becomes discontinuous at .
In Figure 2(b) we show the dependence of the normalized probability of a randomly chosen site belonging to the largest cluster on the sites occupation probability for various linear system sizes . The curves representing this dependence for all discussed neighbourhoods are presented in Figure A3 in Ref. Sup, . The abscissas of the points where curves intercept each other estimate the percolation thresholds .
In Figure 2(c) the dependence of on the occupation probability is presented. The curves representing this dependence for all discussed neighbourhoods are presented in Figure A4 in Ref. Sup, . The minima of give estimates of the percolation thresholds .
In Figure 2(d) finite size corrections to according to Equation 6 are presented. The curves representing this dependence for all discussed neighbourhoods are presented in Figure A5 in Ref. Sup, . The initial value of the linear fit function predicts the percolation threshold values .
The obtained percolation thresholds together with their uncertainties and earlier estimates are gathered in Table 1. We used all lattice sizes for the estimation of (they are collected in the sixth column of Table 1), while estimations given in the fifth column rely on systems with (i.e. the smallest systems, for , have been excluded from calculations). For neighbourhoods containing 30 or more sites we were able to carry out simulations for lattices up to . To check how the minimisation of pair-wise difference function (5) reduces the finite size effects we present also values of for which reaches the minimum when is scanned with accuracy (see the fourth column of Table 1).
IV Discussion
In Ref. Xun et al., 2021 several analytical formulas for the dependence of the percolation threshold on the coordination number were tested, with
| (7) |
| (8) |
among the others. These formulas work fine for “compact” neighbourhoods (for instance tr-1, tr-1,2,3 and tr-1,2,3,4,5, here).
Unfortunately, for complex neighbourhoods these formulas must fail as the dependence on is “degenerated”, i.e. several values of are associated with the same number of sites in the neighbourhood (see Figure 3(a), and also Figure 4b in Ref. Majewski and Malarz, 2007 for the square lattice). These degeneration is also observed for basic neighbourhoods what brought some brickbats van der Marck (1997) on the possibility of existing universal formulas for the percolation threshold (depending solely on the spatial dimension of the system and the coordination number ), as proposed by Galam and Mauger (1996).
To remove this degeneracy we tested formulas (7) and (8) for the mean values of percolation thresholds. The averaging, denoted by the bar, goes over percolation thresholds for neighbourhoods for fixed number . For instance is the mean value of for tr-1, tr-2, tr-3, tr-5 lattices, while is based on values of for tr-1,2,3,4, tr-1,2,4,5, tr-1,3,4,5 and tr-2,3,4,5 lattices, respectively. Additionally, we checked the quality of such fits for the Galam–Mauger formula Galam and Mauger (1996), which for fixed network topology reduces to the following power-law dependence
| (9) |
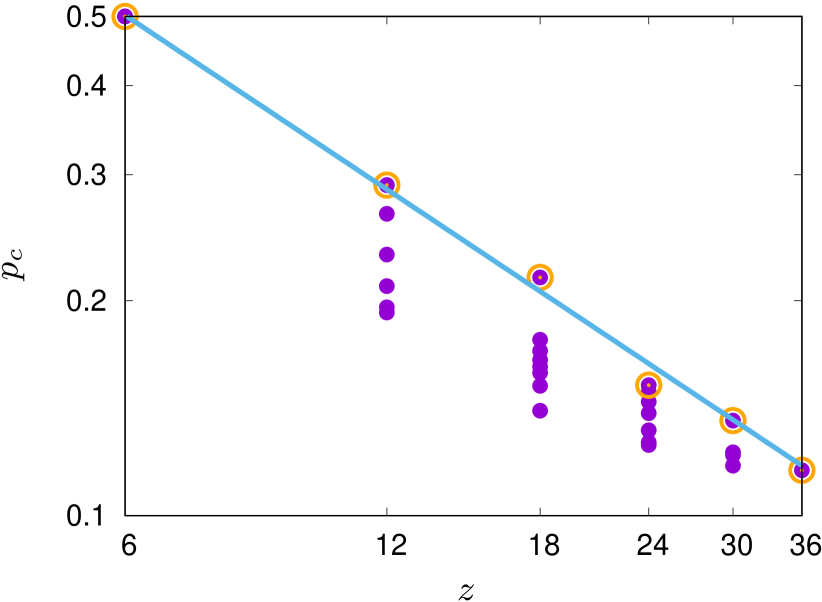
Unfortunately, the formulas describing the dependence on are not consistent with either (7) or (8) or (9). However, we notice that the maximum value of for the fixed value of coordination number follows a power law
| (10) |
with the power (see Figure 3(a)).
As the combination of and seems to be insufficient to differentiate among various lattices with assumed neighbourhoods we are looking for another index which may be useful for both: deriving a formula and removing the -degeneracy. The attempts for such index identification were undertaken also in graph theory (for topological invariants for trees Piec et al. (2005)) and in organic chemistry (for molecular topological index Gutman (1994); Schultz (1989); Wiener (1947)).
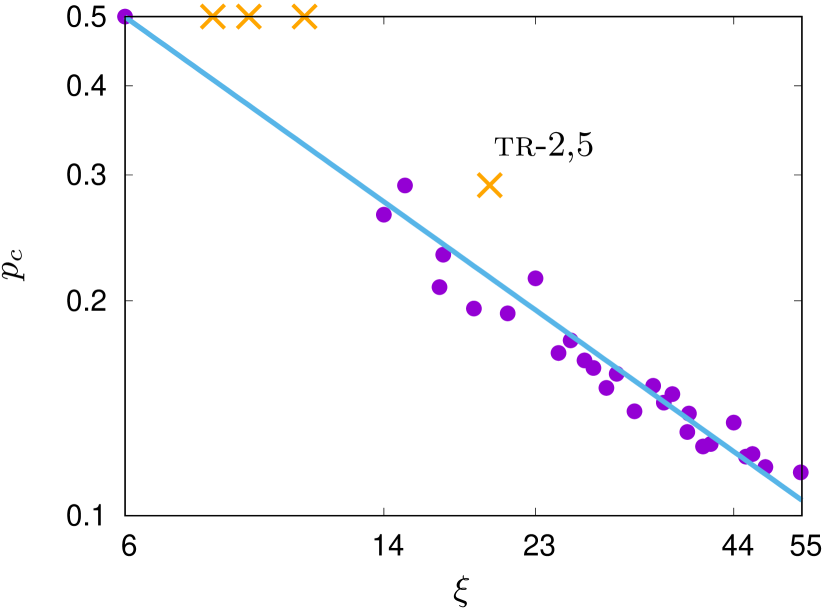
The primary reason why the formula (9) does not work in our case seems to be related to the fact that it does not take into account spatial distribution of neighbors. We expect some corrections depending on the distance of neighbors from the central node. To implement this basic intuition, we found, using trial and error method, that a relatively simple heuristic formula
| (11) |
does the job, in the sense that the percolation thresholds for complex neighborhoods in the studied model are indeed very well described by the scaling
| (12) |
with , except of a single value of for tr-2,5 (see Figure 3(b)). It remains to check in other models of this type how universal is the scaling of the percolation thresholds in the effective weighted coordination number (11).
The values of are presented in Table 1.
Please note that are exactly the same and equal to as these neighbourhoods are equivalent to each other as described in Ref. Malarz, 2020. Thus values for tr-2, tr-3, tr-5 neighbourhoods are excluded from fitting. The same occurs for tr-2,5 which is equivalent to tr-1,2 as presented in Figure 4. In general, in case of neighbourhood equivalence the system should be characterized by value associated with this neighbourhood which has the smallest indices that characterize the connection.
V Conclusions
Concluding, in this paper we estimated percolation thresholds for random site triangular lattice percolation and for neighborhoods containing sites from the first to fifth coordination zone. The estimated values of percolation thresholds are collected in Table 1.
We note that the method Bastas et al. (2014) allows (at least partially) to get rid of finite size effects. The minima of the pairwise difference function presented in Table 1 are consistent with a five digit accuracy with the percolation threshold obtained for infinite lattice according to Equation 6. The five digit accuracy seems to outperform by at least one order of magnitude practical requirements on experimenters in any field of science where percolation theory may be applied.
Percolation thresholds for extended neighbourhoods were utilised in studies ranging from agriculture Ramírez et al. (2020), materials chemistry Alguero et al. (2020), magnetic Ueland et al. (2018); Keeney et al. (2017); Buczek et al. (2016) and electronic Jeong et al. (2018) properties of solids, nanoengineering Xu et al. (2014), etc. These applications utilised results for square or simple cubic lattices. However, also finding percolation thresholds for extended neighbourhoods on honeycomb lattice may be attractive for better understanding some phenomena as proposed for instance in Ref. Castro et al., 2006. Thus application of the results for triangular lattice presented here cannot be excluded.
As the percolation thresholds are multiply degenerated, we propose the weighted square distance to differentiate among various neighbourhoods. This index seems to be effective in this respect (at least for neighbourhoods investigated here).
References
- Stauffer and Aharony (1994) D. Stauffer and A. Aharony, Introduction to Percolation Theory, 2nd ed. (Taylor and Francis, London, 1994).
- Wierman (2014) J. Wierman, “Percolation theory,” in Wiley StatsRef: Statistics Reference Online (American Cancer Society, 2014) pp. 1–9.
- Broadbent and Hammersley (1957) S. R. Broadbent and J. M. Hammersley, “Percolation processes: I. Crystals and mazes,” Mathematical Proceedings of the Cambridge Philosophical Society 53, 629–641 (1957).
- Hammersley (1957) J. M. Hammersley, “Percolation processes: II. The connective constant,” Mathematical Proceedings of the Cambridge Philosophical Society 53, 642–645 (1957).
- Ramírez et al. (2020) J. E. Ramírez, C. Pajares, M. I. Martínez, R. Rodríguez Fernández, E. Molina-Gayosso, J. Lozada-Lechuga, and A. Fernández Téllez, “Site-bond percolation solution to preventing the propagation of Phytophthora zoospores on plantations,” Physical Review E 101, 032301 (2020).
- Zhang et al. (2020) Q. Zhang, B.-Y. Zhang, B.-H. Guo, Z.-X. Guo, and J. Yu, “High-temperature polymer conductors with self-assembled conductive pathways,” Composites Part B—Engineering 192, 107989 (2020).
- Cheng et al. (2020) L. Cheng, P. Yan, X. Yang, H. Zou, H. Yang, and H. Liang, “High conductivity, percolation behavior and dielectric relaxation of hybrid ZIF-8/CNT composites,” Journal of Alloys and Compounds 825, 154132 (2020).
- Malarz et al. (2002) K. Malarz, S. Kaczanowska, and K. Kułakowski, “Are forest fires predictable?” International Journal of Modern Physics C 13, 1017–1031 (2002).
- Ghanbarian et al. (2020) B. Ghanbarian, F. Liang, and H.-H. Liu, “Modeling gas relative permeability in shales and tight porous rocks,” Fuel 272, 117686 (2020).
- Cao et al. (2020) W. Cao, L. Dong, L. Wu, and Y. Liu, “Quantifying urban areas with multi-source data based on percolation theory,” Remote Sensing of Environment 241, 111730 (2020).
- Bartolucci et al. (2020) S. Bartolucci, F. Caccioli, and P. Vivo, “A percolation model for the emergence of the Bitcoin Lightning Network,” Scientific Reports 10, 4488 (2020).
- Ziff (2021) R. M. Ziff, “Percolation and the pandemic,” Physica A: Statistical Mechanics and its Applications 568, 125723 (2021).
- Dong et al. (2020) S. Dong, A. Mostafizi, H. Wang, J. Gao, and X. Li, “Measuring the topological robustness of transportation networks to disaster-induced failures: A percolation approach,” Journal of Infrastructure Systems 26, 04020009 (2020).
- Li et al. (2021) M. Li, R.-R. Liu, L. Lü, M.-B. Hu, S. Xu, and Y.-C. Zhang, “Percolation on complex networks: Theory and application,” Physics Reports (2021), 10.1016/j.physrep.2020.12.003.
- Saberi (2015) A. A. Saberi, “Recent advances in percolation theory and its applications,” Physics Reports 578, 1–32 (2015).
- Frisch et al. (1961) H. L. Frisch, E. Sonnenblick, V. A. Vyssotsky, and J. M. Hammersley, “Critical percolation probabilities (site problem),” Physical Review 124, 1021–1022 (1961).
- Dean (1963) P. Dean, “A new Monte Carlo method for percolation problems on a lattice,” Mathematical Proceedings of the Cambridge Philosophical Society 59, 397–410 (1963).
- Dean and Bird (1967) P. Dean and N. F. Bird, “Monte Carlo estimates of critical percolation probabilities,” Mathematical Proceedings of the Cambridge Philosophical Society 63, 477–479 (1967).
- Dalton et al. (1964) N. W. Dalton, C. Domb, and M. F. Sykes, “Dependence of critical concentration of a dilute ferromagnet on the range of interaction,” Proceedings of the Physical Society 83, 496–498 (1964).
- Domb and Dalton (1966) C. Domb and N. W. Dalton, “Crystal statistics with long-range forces: I. The equivalent neighbour model,” Proceedings of the Physical Society 89, 859–871 (1966).
- Gouker and Family (1983) M. Gouker and F. Family, “Evidence for classical critical behavior in long-range site percolation,” Physical Review B 28, 1449–1452 (1983).
- Malarz and Galam (2005) K. Malarz and S. Galam, “Square-lattice site percolation at increasing ranges of neighbor bonds,” Physical Review E 71, 016125 (2005).
- Galam and Malarz (2005) S. Galam and K. Malarz, “Restoring site percolation on damaged square lattices,” Physical Review E 72, 027103 (2005).
- Majewski and Malarz (2007) M. Majewski and K. Malarz, “Square lattice site percolation thresholds for complex neighbourhoods,” Acta Physica Polonica B 38, 2191–2199 (2007).
- Xun et al. (2021) Z. Xun, D. Hao, and R. M. Ziff, “Site percolation on square and simple cubic lattices with extended neighborhoods and their continuum limit,” Physical Review E 103, 022126 (2021).
- d’Iribarne et al. (1999) C. d’Iribarne, M. Rasigni, and G. Rasigni, “From lattice long-range percolation to the continuum one,” Physics Letters A 263, 65–69 (1999).
- Malarz (2020) K. Malarz, “Site percolation thresholds on triangular lattice with complex neighborhoods,” Chaos 30, 123123 (2020).
- Kurzawski and Malarz (2012) Ł. Kurzawski and K. Malarz, “Simple cubic random-site percolation thresholds for complex neighbourhoods,” Reports on Mathematical Physics 70, 163–169 (2012).
- Malarz (2015) K. Malarz, “Simple cubic random-site percolation thresholds for neighborhoods containing fourth-nearest neighbors,” Physical Review E 91, 043301 (2015).
- Kotwica et al. (2019) M. Kotwica, P. Gronek, and K. Malarz, “Efficient space virtualisation for Hoshen–Kopelman algorithm,” International Journal of Modern Physics C 30, 1950055 (2019).
- (31) See Supplemental Material at [URL will be inserted by publisher]. In Figure A1 neighbourhoods containing sites from coordination zone are presented. In Figure A2 the mean largest cluster size vs. the number of occupied sites, normalized to the system size are presented. Figure A3 shows the probability that an arbitrarily chosen site belongs to the largest cluster vs. occupation probability . Sums of the pairwise difference vs. the occupation probability are presented in Figure A4. In Figure A5 finite size corrections to are presented.
- Newman and Ziff (2001) M. E. J. Newman and R. M. Ziff, “Fast Monte Carlo algorithm for site or bond percolation,” Physical Review E 64, 016706 (2001).
- Bastas et al. (2014) N. Bastas, K. Kosmidis, P. Giazitzidis, and M. Maragakis, “Method for estimating critical exponents in percolation processes with low sampling,” Physical Review E 90, 062101 (2014).
- Privman (1990) V. Privman, “Finite-size scaling theory,” in Finite size scaling and numerical simulation of statistical systems, edited by V. Privman (World Scientific, Singapore, 1990) pp. 1–98.
- Bastas et al. (2011) N. Bastas, K. Kosmidis, and P. Argyrakis, “Explosive site percolation and finite-size hysteresis,” Physical Review E 84, 066112 (2011).
- van der Marck (1997) S. C. van der Marck, “Universal formulas for percolation thresholds — Comment,” Physical Review E 55, 1228–1229 (1997).
- Galam and Mauger (1996) S. Galam and A. Mauger, “Universal formulas for percolation thresholds,” Physical Review E 53, 2177–2181 (1996).
- Piec et al. (2005) S. Piec, K. Malarz, and K. Kułakowski, “How to count trees?” International Journal of Modern Physics C 16, 1527–1534 (2005).
- Gutman (1994) I. Gutman, “Selected properties of the Schultz molecular topological index,” Journal of Chemical Information and Computer Sciences 34, 1087–1089 (1994).
- Schultz (1989) H. P. Schultz, “Topological organic chemistry. 1. Graph theory and topological indices of alkanes,” Journal of Chemical Information and Computer Sciences 29, 227–228 (1989).
- Wiener (1947) H. Wiener, “Structural determination of paraffin boiling points,” Journal of the American Chemical Society 69, 17–20 (1947).
- Alguero et al. (2020) M. Alguero, M. Perez-Cerdan, R. P. del Real, J. Ricote, and A. Castro, “Novel Aurivillius Bi4Ti3-2xNbxFexO12 phases with increasing magnetic-cation fraction until percolation: A novel approach for room temperature multiferroism,” Journal of Materials Chemistry C 8, 12457–12469 (2020).
- Ueland et al. (2018) B. G. Ueland, N. H. Jo, A. Sapkota, W. Tian, M. Masters, H. Hodovanets, S. S. Downing, C. Schmidt, R. J. McQueeney, S. L. Bud’ko, A. Kreyssig, P. C. Canfield, and A. I. Goldman, “Reduction of the ordered magnetic moment and its relationship to Kondo coherence in Ce1-xLaxCu2Ge2,” Physical Review B 97, 165121 (2018).
- Keeney et al. (2017) L. Keeney, C. Downing, M. Schmidt, M. E. Pemble, V. Nicolosi, and R. W. Whatmore, “Direct atomic scale determination of magnetic ion partition in a room temperature multiferroic material,” Scientific Reports 7, 1737 (2017).
- Buczek et al. (2016) P. Buczek, L. M. Sandratskii, N. Buczek, S. Thomas, G. Vignale, and A. Ernst, “Magnons in disordered nonstoichiometric low-dimensional magnets,” Physical Review B 94, 054407 (2016).
- Jeong et al. (2018) J. Jeong, K. J. Park, E.-J. Cho, H.-J. Noh, S. B. Kim, and H.-D. Kim, “Electronic structure change of NiS2-xSex in the metal-insulator transition probed by X-ray absorption spectroscopy,” Journal of the Korean Physical Society 72, 111–115 (2018).
- Xu et al. (2014) F. Xu, Z. Xu, and B. I. Yakobson, “Site-percolation threshold of carbon nanotube fibers—Fast inspection of percolation with Markov stochastic theory,” Physica A 407, 341–349 (2014).
- Castro et al. (2006) E. V. Castro, N. M. R. Peres, K. S. D. Beach, and A. W. Sandvik, “Site dilution of quantum spins in the honeycomb lattice,” Physical Review B 73, 054422 (2006).
- Lebrecht et al. (2021) W. Lebrecht, P. M. Centres, and A. J. Ramirez-Pastor, “Empirical formula for site and bond percolation thresholds on Archimedean and 2-uniform lattices,” Physica A: Statistical Mechanics and its Applications 569, 125802 (2021).