MolCLR: Molecular Contrastive Learning of Representations via Graph Neural Networks
Abstract
Molecular machine learning bears promise for efficient molecule property prediction and drug discovery. However, due to the limited labeled data and the giant chemical space, machine learning models trained via supervised learning perform poorly in generalization. This greatly limits the applications of machine learning methods for molecular design and discovery. In this work, we present MolCLR: Molecular Contrastive Learning of Representations via Graph Neural Networks (GNNs), a self-supervised learning framework trained on large unlabeled datasets containing 10M unique molecules. Specifically, we first build a molecular graph, where each node represents an atom and each edge represents a chemical bond. A GNN is then used to encode the molecule graph. We propose three molecule graph augmentations: atom masking, bond deletion, and subgraph removal. A contrastive estimator is utilized to maximize the agreement of different graph augmentations from the same molecule. Experiments show that molecule representations learned by MolCLR can be transferred to multiple downstream molecular property prediction tasks. Our method thus achieves state-of-the-art performance on many challenging datasets. We also prove the efficiency of our proposed molecule graph augmentations on supervised molecular classification tasks.
Introduction
Molecular representation is fundamental and essential in design of functional and novel chemical compounds [bartok2013representing, ghiringhelli2015big, huang2016communication, david2020molecular]. Due to the enormous magnitude of possible stable chemical compounds, development of an informative representation to generalize among the entire chemical space can be challenging [oprea2001chemography, bade2010characteristics, virshup2013stochastic]. Conventional molecular representations, like SMILES [weininger1988smiles] and ECFP [rogers2010extended], have became standard tools in computational chemistry. Recently with the development of machine learning methods, data-driven molecular representation learning and its applications, including chemical property prediction [duvenaud2015convfingerprint, jastrzkebski2016learning, kusner2017grammar, gilmer2017neural, karamad2020orbital], chemical modeling [chmiela2018towards, deringer2018realistic, wang2019coarse], and drug discovery [altae2017low, chen2018rise, vamathevan2019applications, magar2020potential, liu2020retrognn], have gathered growing attentions.
However, learning such representations can be difficult due to three major challenges. Firstly, it is hard to represent the molecular information thoroughly. For instance, string-based representations, like SMILES [weininger1988smiles], SMARTS [smarts], and SELFIES [krenn2020self], fail to encode the important topology information directly. To preserve the rich structural information, many recent works exploit Graph Neural Networks (GNNs) [kipf2016semi, xu2018how], and have shown promising results in molecular property prediction [gilmer2017neural, schutt2018schnet, yang2019analyzing] and virtual screening [wallach2015atomnet, zheng2019onionnet]. Secondly, the magnitude of chemical space is enormous [kirkpatrick2004chemical], e.g., the size of potential pharmacologically active molecules is estimated to be in the order of [bohacek1996art]. This places a great difficulty for any molecular representations to generalize among the potential chemical compounds. Thirdly, labeled data for molecular learning tasks are expensive and far from sufficient, especially when compared with the size of potential chemical space. Obtaining labels of molecular property usually requires sophisticated and time-consuming lab experiments [brown2019guacamol]. The breadth of chemical research further complicates the challenges, since the properties of interest range from quantum mechanics to biophysics [wu2018moleculenet, polykovskiy2020molecular]. Consequently, the number of labels in most molecular learning benchmarks is far from adequate. Machine learning models trained on such benchmarks can easily get over-fitting and perform poorly on molecules dissimilar to the training set.
Molecular representation learning has been growing rapidly over the last decade with the development and success of machine learning, especially deep learning driven by neural networks [lecun2015deep, duvenaud2015convfingerprint, vamathevan2019applications]. In conventional cheminformatics, molecules are represented in unique fingerprint vectors, such as Extended-Connectivity Fingerprints (ECFP) [rogers2010extended]. Given the fingerprints, deep neural networks are built to predict certain properties or classes [unterthiner2014deep, ma2015deep, ramsundar2015massively]. Besides, SMILES [weininger1988smiles], which maps the molecule into a string, is also widely-used for molecule representation [kusner2017grammar, gupta2018generative]. Language models built upon RNNs are direct fit for learning representation from SMILES [jastrzkebski2016learning, xu2017seq2seq, gomez2018automatic, grisoni2020bidirectional]. With the recent success of transformer-based architectures, such language models have been also utilized in molecular representation learning from SMILES strings [schwaller2019moleculartransformer, maziarka2020moleculeattention]. Recently, GNNs, which naturally encode the structure information, have been introduced to molecular representation learning [duvenaud2015convfingerprint, kearnes2016molecular, feinberg2018potentialnet]. MPNN [gilmer2017neural] and D-MPNN [yang2019analyzing] implement a message-passing architecture to aggregate the information from molecule graphs. Further, SchNet [schutt2018schnet] models quantum interactions within molecules in the GNN. DimeNet [klicpera2020directional] integrates the directional information by transforming messages based on the angle between atoms.
Benefiting from the growth of available molecule data [gaulton2012chembl, sterling2015zinc, wu2018moleculenet, kim2019pubchem], self-supervised/pre-trained molecular representation learning has also been investigated. Self-supervised language models, like BERT [devlin2018bert], has been implemented to learn molecular representation with SMILES as input [chithrananda2020chemberta, wang2019smiles]. On molecule graph, N-Gram Graph [Liu2019NGramGS] builds the representation for the graph by assembling the vertex embedding in short walks, which needs no training. Hu et al. [Hu2020Strategies] propose both node-level and graph-level tasks for GNN pre-training. However, the graph-level pre-training is based on supervised-learning tasks, which is constraint by limited labels. You et al. [you2020graph] extends the contrastive learning to unstructured graph data, but the framework is not specifically designed for the molecular graph learning and only trained on limited molecular data.
In this work, we propose Molecular Contrastive Learning of Representations (MolCLR) via Graph Neural Networks to address all the above challenges. MolCLR is a self-supervised learning framework trained on the large unlabeled molecular dataset with 10M unique molecules. Through contrastive loss [oord2018infonce, chen2020simple], MolCLR learns the representations by contrasting positive molecule graph pairs against negative ones. Three molecule graph augmentation strategies are introduced: atom masking, bond deletion, and subgraph removal. Molecule graph pairs augmented from the same molecule are denoted as positive, while others are denoted as negative. A widely-used GNN model, Graph Isomorphism Network (GIN) [xu2018how], is pre-trained through MolCLR to extract informative representation from the augmented molecule graph. The pre-trained model is then fine-tuned on the downstream molecular property prediction tasks. Experiments show that the performance of our MolCLR surpasses other self-supervised learning and pre-training strategies in multiple molecular benchmarks [wu2018moleculenet]. Besides, in the downstream tasks, our MolCLR rivals or even exceeds supervised learning baselines, which include sophisticated graph convolution operations for molecules or domain-specific featurization. We also demonstrate that our molecule graph augmentation strategies improve the performance of supervised learning on molecular benchmarks when utilized as a direct data augmentation plug-in.
To summarize, (1) We propose MolCLR, a self-supervised learning framework for molecular representation learning. (2) We propose three molecule graph augmentation strategies to generate contrastive pairs, namely atom masking, bond deletion, and subgraph removal. Besides, we also demonstrate the improvement of implementing our proposed molecule graph augmentations in supervised molecular classifications. (3) We achieve the state-of-the-arts on several downstream molecular classification tasks with fine-tuning. This indicates that the MolCLR is capable of learning informative molecular representations without domain knowledge.
Preliminaries
Contrastive Learning.
Contrastive learning [hadsell2006dimensionality] aims at learning representation through contrasting positive data pairs against negative ones. In [dosovitskiy2014discriminative], CNN is trained by discriminating between surrogate classes parameterized by feature vectors. Memory bank is then introduced in [wu2018unsupervised] to store features of each instances. Several works have then adopted and improved the memory bank [tian2019contrastive, cvpr19unsupervised]. MoCo [he2020momentum] proposes a moving-average momentum encoder, which builds an on-the-fly consistent dictionary. Instead of using memory bank, SimCLR [chen2020simple, chen2020big] demonstrates contrastive learning can greatly benefits from the composition of data augmentations and large batch sizes. Based on InfoNCE loss [oord2018infonce], SimCLR proposes the normalized temperature-scaled cross entropy (NT-Xent) loss as given in Eq. 1:
| (1) |
where and are latent vectors extracted from a positive data pair, is the batch size, sim measures the similarity between the two vectors, and is the temperature parameter. Different works have investigated the improvement of contrastive training frameworks, including Moco v2 [chen2020improved], BYOL [grill2020bootstrap], SwAV [caron2020unsupervised]. Following the insight of contrastive learning in computer vision, contrastive learning frameworks have been implemented to various domains, like GraphCL [you2020graph] for unstructured graphs, SimCSE [gao2021simcse] for sentence embeddings, and CLOUD [wang2020cloud] for robotics planning. However, contrastive learning has not yet been investigated comprehensively and elaborately for molecule graphs.
Graph Neural Networks.
Non-euclidean data represented in the form of graphs is common across various domains [bronstein2017geometric, wu2020comprehensive], such as molecule structures we investigate in this work [kearnes2016molecular]. A graph is defined as , where and are nodes and edges respectively [gori2005new, scarselli2008graph]. Modern Graph Neural Networks (GNNs) utilize a neighborhood aggregation operation, which update the node representation iteratively [bruna2014spectral, henaff2015deep, defferrard2016convolutional, kipf2016semi]. The aggregation update rule for a node feature on the -th layer of a GNN is given in Eq. 2:
| (2) |
where is the feature of node at the -th layer and is initialized by node feature . denotes the set of all the neighbors of node . To further extract a graph-level feature , readout operation integrates all the node features among the graph as given in Eq. 3:
| (3) |
Various aggregation operations have been proposed to improve the performance of GNN. GraphSAGE [hamilton2017inductive] proposes a max-pooling operation over a ReLU [maas2013rectifier] activated linear transformation as the aggregation. GCN [kipf2016semi] integrates the aggregation and combination operations by introducing a mean-pooling over the node itself and its adjacencies before the linear transformation. GIN [xu2018how] utilizes an MLP and weighted summation of node features in the aggregation. GAT [velivckovic2017graph] performs the multi-head attention to increase the model’s expressive capability. Various other aggregation operations include diffusion convolution [atwood2015diffusion], message passing [gilmer2017neural], and Gaussian-kernelized weight function [monti2017geometric]. Besides, incorporating edge features into the GNN has also been investigated [gilmer2017neural, gong2019exploiting, Hu2020Strategies, klicpera2020directional, yang2019analyzing, yang2020nenn]. For readout operations, common strategies can be a graph-level summation, averaging, and max pooling. Some works have also developed elaborate graph readout modules to improve predictive performance and computational efficiency of GNNs [zhang2018end, ying2018hierarchical, gong2019exploiting, navarin2019universal].
Results
MolCLR Framework
Our MolCLR model is developed upon the contrastive learning framework [chen2020simple, chen2020big]. Latent representations from positive augmented molecule graph pairs are contrasted with representations from negative pairs. As shown in Figure 1(a), the whole pipeline is composed of four components: data processing and augmentation, GNN-based feature extractor, non-linear projection head, and an NT-Xent [chen2020simple] contrastive loss.
Given a SMILES data from a mini-batch of size , the corresponding molecule graph is built, in which each node represents an atom and each edge represents a chemical bond between atoms. Using molecule graph augmentation strategies (explained in Section Molecule Graph Augmentation), is transformed into two different but correlated molecule graphs: and , where and . In this work, three molecule graph augmentation strategies, including atom masking, bond deletion, and subgraph removal, are applied in composition and stochastically. Molecule graphs augmented from the same molecule are denoted as positive pairs, whereas those from different molecules are denoted as negative pairs. The feature extractor maps the augmented molecule graphs into the representations . Various GNNs can be plugged in to model . In our case, we implement the commonly-used GIN [xu2018how] aggregation operation and an average pooling as the readout operator to extract the molecular representations. A non-linear projection head is modeled by an MLP with one hidden layer, which maps the representations and into latent vectors and respectively. Contrastive loss, NT-Xent, is applied to the latent vectors ’s as given in Eq. 1, and cosine similarity is utilized to calculate .
The MolCLR pre-trained GNN model is utilized for molecular property prediction tasks through fine-tuning as shown in Figure 1(c). Similarly with the pre-training model, the pre-training model is consisted of a GNN backbone and an MLP head, where the former extracts features from molecule graphs and the latter maps features into the estimated molecular property. The GNN backbone in the fine-tuning model is initialized by paramerter sharing from the pre-trained model while the MLP head is initialized randomly. The whole fine-tuning model is then trained in a supervised learning manner on the target molecular property database.
Molecule Graph Augmentation
We employ three molecule graph data augmentation strategies (Figure 1(b)) as transformations for our MolCLR framework: atom masking, bond deletion, and subgraph removal.
Atom Masking
Atoms in the molecule graph are randomly masked with a given ratio. When an atom is masked, its atom feature is replaced by a mask token , which is distinguished from any atom features in the molecular graph. Shown by red shadows in Figure 1(b), six atoms including two Hydrogen, two Carbon, a Nitrogen, and an Oxygen are masked in the molecule graph. Through masking, the model is forced to learn the intrinsic chemical information (such as possible types of atoms connected by certain covalent bond) within molecules.
Bond Deletion
Bond deletion randomly deletes chemical bonds between the atoms with a certain ratio. Unlike atom masking which substitutes the original feature with a mask token, bond deletion is a more rigorous augmentation as it removes the edges completely from the molecule graph. Forming and breaking of chemical bonds between atoms determines the attributes of molecules in chemical reactions [do2019graph]. Bond deletion mimics the breaking of chemical bonds which prompts the model to learn correlations between the involvements of one molecule in various reactions.
Subgraph Removal
Subgraph removal can be considered as a combination of atom masking and bond deletion. Subgraph removal starts from a randomly picked origin atom. The removal process proceeds by masking the neighbors of the original atom, and then the neighbors of the neighbors, until the number of masked atoms reaches a given ratio of the total number of atoms in the molecular graph. The bonds between the masked atoms are then deleted, such that the masked atoms and deleted bonds form an induced subgraph [west2001introduction] of the original molecule graph. As shown in Figure 1(b), the removed subgraph includes all the bonds between the masked atoms. By matching the molecule graphs with different substructures removed, the model learns to find the remarkable motifs within the remaining subgraphs [jin2020hierarchical] which greatly determines the molecular properties.
Molecular Property Predictions
| Dataset | BBBP | Tox21 | ClinTox | HIV | BACE | SIDER | MUV |
| # Molecules | 2039 | 7831 | 1478 | 41127 | 1513 | 1478 | 93087 |
| # Tasks | 1 | 12 | 2 | 1 | 1 | 27 | 17 |
| RF | 71.40.0 | 76.91.5 | 71.35.6 | 78.10.6 | 86.70.8 | 68.40.9 | 63.22.3 |
| SVM | 72.90.0 | 81.81.0 | 66.99.2 | 79.20.0 | 86.20.0 | 68.21.3 | 67.31.3 |
| SchNet [schutt2018schnet] | 84.82.2 | 77.22.3 | 71.53.7 | 70.23.4 | 76.61.1 | 53.93.7 | 71.33.0 |
| MGCN [lu2019molecular] | 85.06.4 | 70.71.6 | 63.44.2 | 73.81.6 | 73.43.0 | 55.21.8 | 70.23.4 |
| D-MPNN [yang2019analyzing] | 71.23.8 | 68.91.3 | 90.55.3 | 75.02.1 | 85.35.3 | 63.22.3 | 76.22.8 |
| HU. et.al [Hu2020Strategies] | 70.81.5 | 78.70.4 | 78.92.4 | 80.20.9 | 85.90.8 | 65.20.9 | 81.42.0 |
| N-Gram [Liu2019NGramGS] | 91.23.0 | 76.92.7 | 85.53.7 | 83.01.3 | 87.63.5 | 63.20.5 | 81.61.9 |
| MolCLR | 73.60.5 | 79.80.7 | 93.21.7 | 80.61.1 | 89.00.3 | 68.01.1 | 88.62.2 |
| Dataset | FreeSolv | ESOL | Lipo | QM7 | QM8 |
|---|---|---|---|---|---|
| # Molecules | 642 | 1128 | 4200 | 6830 | 21786 |
| # Tasks | 1 | 1 | 1 | 1 | 12 |
| RF | 2.030.22 | 1.070.19 | 0.880.04 | 122.74.2 | 0.0420.002 |
| GCN [kipf2016semi] | 2.9000.135 | 1.0680.050 | 0.7120.049 | 118.920.2 | 0.0210.001 |
| SchNet [schutt2018schnet] | 3.220.76 | 1.050.06 | 0.910.10 | 74.26.0 | 0.0200.002 |
| MGCN [lu2019molecular] | 3.350.01 | 1.270.15 | 1.110.04 | 77.64.7 | 0.0220.002 |
| D-MPNN [yang2019analyzing] | 2.180.91 | 0.980.26 | 0.650.05 | 105.813.2 | 0.01430.002 |
| N-Gram [Liu2019NGramGS] | 2.510.19 | 1.100.03 | 0.880.12 | 125.61.5 | 0.03200.003 |
| MolCLR | 2.200.20 | 1.110.01 | 0.650.08 | 87.22.0 | 0.01740.001 |
To demonstrate the performance of proposed MolCLR, we fine-tune the pre-trained model on multiple molecular property prediction benchmarks, including classification and regression tasks.
Table 1 demonstrates the test ROC-AUC performance of our MolCLR model on classification tasks in comparison to baseline models. The average and standard deviation of three individual runs are reported. Bold cells denote the best performing method on each benchmark, either via supervised or self-supervised/pre-training strategy. Observations from Table 1 are the followings. (1) In comparison with other self-supervised learning or pre-training strategies, our MolCLR framework achieves the best performance on 5 out of 7 benchmarks, with an average improvement of 5.0%. Such improvement illustrates that our MolCLR is a powerful self-supervised learning strategy, which is easy to implement and requires little domain-specific sophistication. (2) Compared with the supervised learning baselines, MolCLR also shows rival performance. In some benchmarks, our pre-training model even surpasses the SOTA supervised learning methods. For instance, on ClinTox, MolCLR improves the ROC-AUC by 2.9%. (3) Notably, MolCLR performs remarkably well on datasets with a limited number of molecules, like Clitox, BACE, and SIDER benchmarks. The performance validates that MolCLR learns informative representations that can be transferred among different datasets.
Table 2 demonstrates the test MAE performance of our MolCLR model on regression benchmarks in comparison to baseline models. Regression tasks are more directly related to the molecular properties in comparison with classification which only considers manually-defined discrete labels. Similarly, the average and standard deviation of three individual runs are reported. Observations from Table 2 are the followings. Proposed MolCLR surpasses pre-training baseline N-Gram [Liu2019NGramGS] in 4 out of 5 benchmarks, and achieves rival performance on the remaining benchmark. For instance, on QM7 and QM8, which contains electronic spectra and excited state energy of small molecules, MolCLR improves the performance by and respectively. In comparison with supervised learning models, proposed MolCLR also reaches rival performance. Table 1 and Table 2 show that features from the pre-trained MolCLR can generalize well on molecular property predictions in various aspects, including and not limited to quantum mechanics, biophysics, physiology, and physics chemistry. Such capacity of generalization bears promise for predicting potential molecular properties in drug discovery and design.
Ablation Study
Temperature in Contrastive Loss
| Temperature () | 0.05 | 0.1 | 0.5 |
|---|---|---|---|
| ROC-AUC (%) | 76.81.2 | 80.21.3 | 78.41.7 |
The choice of the temperature parameter in Eq. 1 impacts the performance of contrastive learning [chen2020simple]. An appropriate benefits the model to learn from hard negative samples. To investigate for molecule representation learning, we train MolCLR with three different temperatures: , , and as shown in Table 3. We report the averaged ROC-AUC over all the seven benchmarks using 25% subgraph removal as the augmentation strategy. It is demonstrated that performs the best in the downstream molecular tasks. Therefore, we use this temperature setting in the following experiments.
Composition of Molecule graph Augmentations
To systematically investigate the effect of molecule graph augmentation strategies, we compare different compositions of atom masking, bond deletion, and subgraph removal. Shown in Figure 2 are the ROC-AUC mean and standard deviation of each data augmentation compositions on different benchmarks. Four augmentation compositions are considered. (1) Integration of atom masking and bond deletion with both ratios set to 25%. (2) Subgraph removal with a random ratio from 0% to 25%. (3) Subgraph removal with a fixed 25% ratio. (4) Composition of all the three augmentation strategies. Specifically, a subgraph removal with a random ratio 0% to 25% is first applied. Then if the ratio of masked atoms is smaller than 25%, we continue random atom masking until it reaches the ratio of 25%. Similarly, if the bond deletion ratio is smaller than 25%, more bonds are deleted to reach the set ratio. The four compositions are shown in yellow, gray, blue, and orange respectively in Figure 2.
As Figure 2 illustrates, subgraph removal with a 25% ratio reaches the best performance on average among all the four compositions. This could because that subgraph removal is an intrinsic composition of atom masking and bond deletion, and that subgraph removal further disentangles the local substructures compared with strategy (1). However, subgraph removal with a fixed 25% ratio performs poorly in BBBP dataset, which can be attributed to that molecule structures in BBBP are sensitive, such that a slight topology change can cause great property difference. Besides, it is worth noticing that the composition of all three augmentations, (4), does not improve the performance. On the contrary, it hurts the ROC-AUC compared with single subgraph removal augmentation in most benchmarks. The composition of all the three augmentation strategies can remove a wide range of substructures within the molecule graph, thus eliminate the important topology information.
Molecule Graph Augmentation on Supervised Molecular Classifications
| Dataset | BBBP | Tox21 | ClinTox | HIV | BACE | SIDER | MUV |
|---|---|---|---|---|---|---|---|
| GIN w/o Aug | 65.84.5 | 74.00.8 | 58.04.4 | 75.31.9 | 70.15.4 | 57.31.6 | 71.82.5 |
| GIN w/ Aug | 72.10.9 | 75.01.1 | 64.02.4 | 76.11.2 | 71.60.7 | 65.21.4 | 80.53.1 |
The molecule graph augmentation strategies in our work, namely atom masking, bond deletion, and subgraph removal, can be implemented as a direct data augmentation plug-in for any graph-based molecular learning methods. To validate the effectiveness of molecule graph augmentations on supervised molecular tasks, we train GIN models with/without augmentations from scratch without pre-training. Specifically, subgraph masking with a fixed ratio 25% is implemented as the augmentation. Table 4 documents the mean and standard deviation of test ROC-AUC over the seven molecular property classification benchmarks. On all the seven benchmarks, GINs trained with augmentations surpass the models without augmentations, and improve the averaged ROC-AUC score by 7.2%. Implementation of our molecule graph augmentation strategies on supervised molecular property prediction tasks improves the performance greatly even without pre-training.
MolCLR Representation Visualization
We examine the representations learned by pre-trained MolCLR using t-SNE embedding [van2008visualizing]. The t-SNE algorithm maps similar molecular representations to adjacent points. Shown in Figure 3 are 100K molecules from validation set of the pre-training data embedded to 2D via t-SNE, colored based on the molecular weights. We also include some randomly selected molecules in the figure to illustrate what are the similar/dissimilar molecules learned by MolCLR pre-training. As shown in Figure 3, MolCLR learns close representations for molecules with similar topology structures and functional groups. For instance, the three molecules shown on the top possess carbonyl groups connected with aryls. The two molecules shown on the bottom left have similar structures, where a halogen atom (Fluorine or Chlorine) is connected to benzene. This demonstrates the potentials of MolCLR in application of drug search and drug discovery.
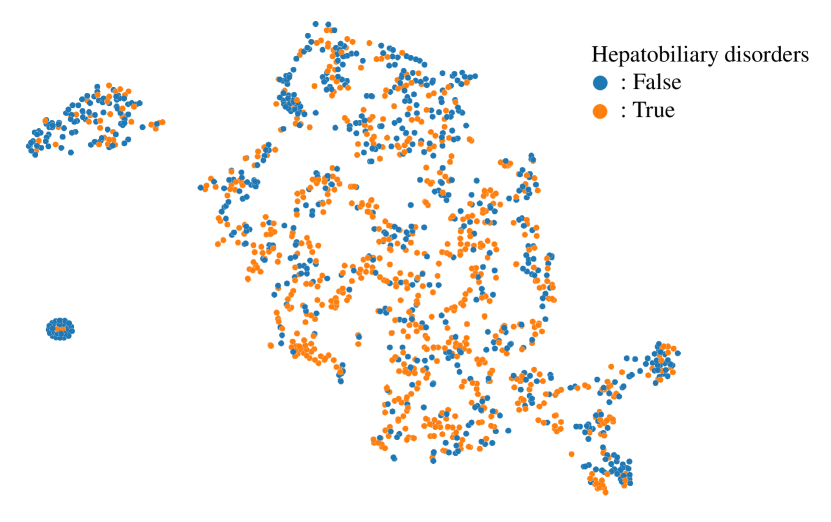
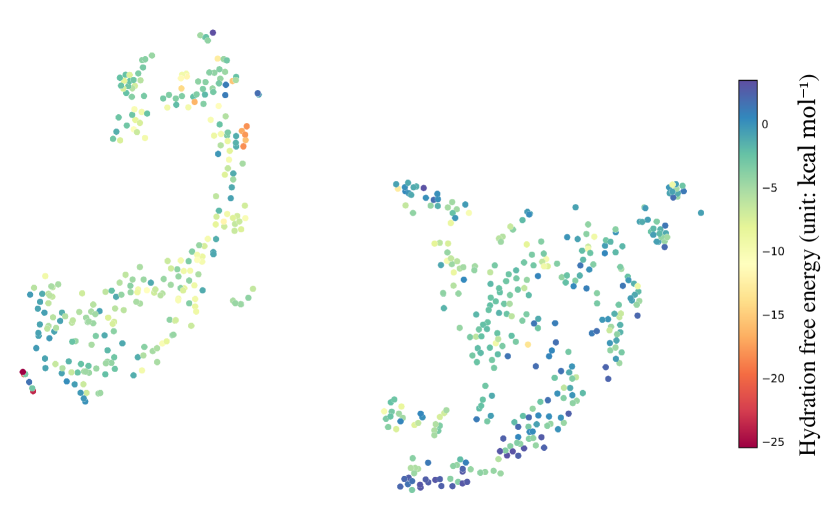
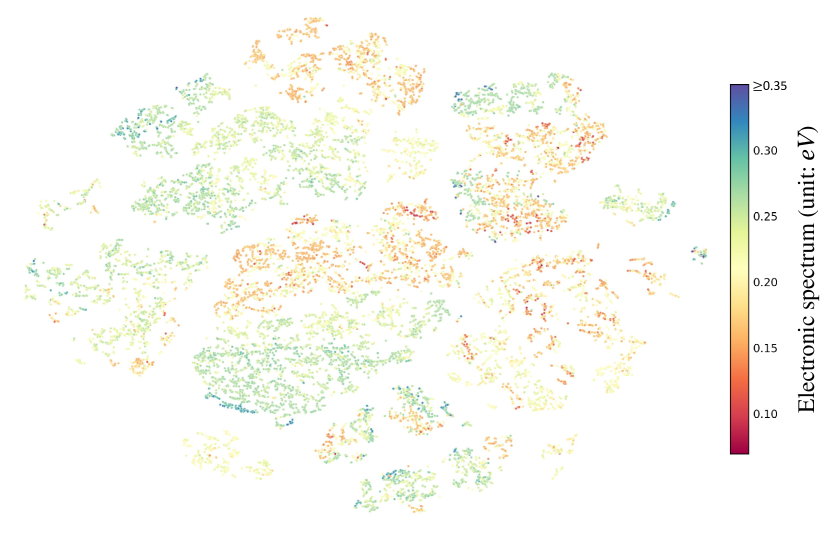
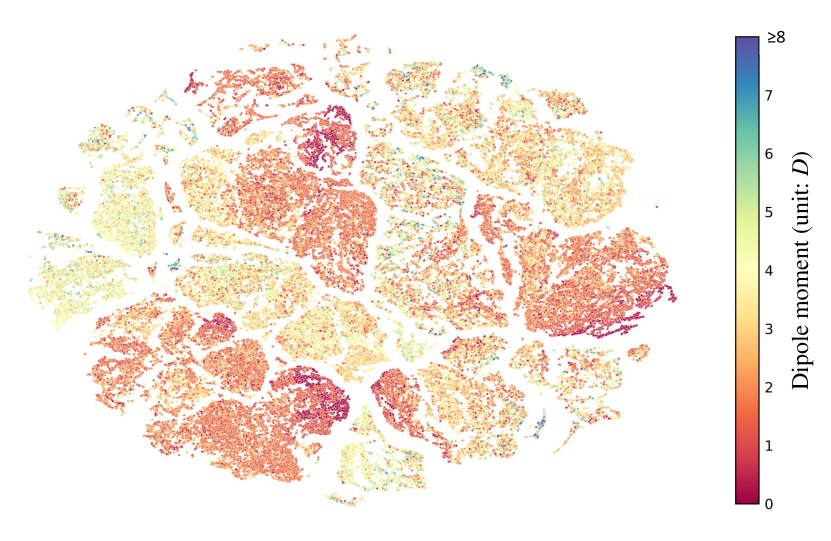
Besides, to illustrate the power of features from the pre-trained MolCLR, we visualize the molecule features via t-SNE, where molecules are from various databases and colored by property labels (Figure 4). Notice that all the features are extracted directlt from pre-trained MolCLR without fine-tuning. Namely, the model has no access to the molecular property labels during training. Figure 4 shows molecules from SIDER [kuhn2016sider], FreeSolv [mobley2014freesolv], QM8 [ruddigkeit2012enumeration, ramakrishnan2015electronic], QM9 [ramakrishnan2014quantum]. Features from pre-trained MolCLR shows clustering based on the labels, even without accessing lanels during training. For instance, in 4(d), molecules are colored by the electronic spectra . Molecules with relatively high (green and blue) are clustered on the bottom right, whereas molecules with low (dark red) are clustered in the center of the plot. Figure 3 and Figure 4 visualize the features from pre-trained MolCLR, and illustrates that even without labels, the model learns intrinsic connections between molecules as molecules with similar properties have close features.
Conclusions and Future Works
In this work, we investigate self-supervised learning for molecular representation. Specifically, we propose Molecular Contrastive Learning of Representations (MolCLR) via GNNs and three molecular graph augmentations strategies: atom masking, bond deletion, and subgraph removal. Through contrasting positive pairs against negative pairs from augmentations, MolCLR learns informative representation with general GNN backbones. Experiments show that MolCLR pre-trained GNN models achieve great improvement on various molecular benchmarks, and show better generalizations compared with models trained in the supervised learning manner.
Molecular representations learned by MolCLR demonstrates the transferability to molecular tasks with limited data and the power of generalization on the large chemical space. There exist many promising directions to investigate as future works. For instance, improvement of the GNN backbones (e.g. transformer-based GNN architectures [yun2019GraphTransformer]) can help extract better molecular representations. Besides, visualization and interpretation of self-supervised learned representations are of great interest [pope2019explainability]. Such investigations can help researchers better understand chemical compounds and benefit drug discovery.
Method
Datasets
Pre-training Dataset.
For MolCLR pre-training, we use 10 million unique unlabeled molecule SMILES from [chithrananda2020chemberta], which are collected from PubChem [kim2019pubchem]. RDKit [greg2006rdkit] is then utilized to add hydrogen atoms to molecule structure and then build the molecule graphs from the SMILES strings. Within the molecule graph, each node represents an atom and each edge represents a chemical bond. We randomly split the pre-training dataset into training and validation set with a ratio of 95/5.
Downstream Datasets.
To benchmark the performance of our MolCLR framework, we use 7 datasets from MoleculeNet [wu2018moleculenet], containing in total 44 binary classification tasks. These tasks cover molecule properties of multiple domains, including physical chemistry, biophysics, and physiology. For each dataset, we use the scaffold split [bemis1996properties] from DeepChem [deepchem] to create an 80/10/10 train/valid/test split as suggested in [Hu2020Strategies]. Unlike the common random split, the scaffold split, which is based on molecular substructures, makes the prediction task more challenging yet realistic.
Training Details
Each atom on the molecule graph is embedded by its atomic number and chirality type [mcnaught1997compendium], while each bond is embedded by its type and direction. We implement a 5-layer Graph Isomorphism Network (GIN) [xu2018how] with ReLU activation [maas2013rectifier] as the GNN backbone, and follow the modification in [Hu2020Strategies] to make GIN compatible with edge features. An average pooling is applied on each graph as the readout operation to extract the 512-dimension molecular representation. An MLP with one hidden layer maps the representation into a 256-dimension latent space. Adam [kingma2014adam] optimizer with weight decay is used to optimize the NT-Xent loss. After the initial 10 epochs with learning rate , cosine annealing without restart [loshchilov2016sgdr] decays the learning rate cyclically. The model is trained with batch size 512 for the total 100 epochs.
For the downstream task fine-tuning, we add a randomly initialized 2-layer MLP with ReLU activation on top of the base feature extractor. For binary classification tasks, softmax cross-entropy loss is implemented. The learning rate of the MLP head is set to and the base GIN extractor is set to . The model is trained using Adam optimizer with batch size 32 for another 50 epochs. For each task, we fine-tune the pre-trained model three times using different random seeds for scaffold splitting to get the average and standard deviation of the performance. The whole framework is implemented based on Pytorch Geometric [Fey/Lenssen/2019].
Baselines
Supervised learning models.
We comprehensively evaluate the performance of our MolCLR model with supervised learning methods. For shallow machine learning models, Random Forest (RF) [ho1995random] and Support Vector Machine (SVM) [cortes1995support] are implemented, which take molecular descriptors as the input. Besides, state-of-the-art graph-based neural networks are also included. Extended GIN [xu2018how, Hu2020Strategies] with edge feature involved in aggregation is compared. D-MPNN [yang2019analyzing] and MGCNN [lu2019molecular], which are graph neural network models designed specifically for molecule prediction tasks, are also included as the baselines.
Self-supervised learning models.
To better demonstrate the power of our MolCLR framework, we further include other molecular self-supervised learning models in the baselines. HU. et.al [Hu2020Strategies] with both node-level and graph-level pre-training is considered. It should be pointed out that though node-level pre-training is based on self-supervision, the graph-level pre-training is supervised on some molecule property labels [Hu2020Strategies]. N-Gram graph [Liu2019NGramGS] is also implemented, which computes a compact representation directly through the molecule graph.
Code availability
Data and codes are attached for review. Please contact Amir Barati Farimani <barati@cmu.edu> for more details.