Dynamics of Collective Modes in an unconventional Charge Density Wave system BaNi2As2
Abstract
BaNi2As2 is a non-magnetic analogue of BaFe2As2, the parent compound of a prototype pnictide high-temperature superconductor, displaying superconductivity already at ambient pressure. Recent diffraction studies demonstrated the existence of two types of periodic lattice distortions above and below the triclinic phase transition, suggesting the existence of an unconventional charge-density-wave (CDW) order. The suppression of CDW order upon doping results in a sixfold increase in the superconducting transition temperature and enhanced nematic fluctuations, suggesting CDW is competing with superconductivity. Here, we apply time-resolved optical spectroscopy to investigate collective dynamics in BaNi2As2. We demonstrate the existence of several CDW amplitude modes. Their smooth evolution through the structural phase transition implies the commensurate CDW order in the triclinic phase evolves from the high-temperature unidirectional incommensurate CDW, and may indeed trigger the structural phase transition. Excitation density dependence reveals exceptional resilience of CDW against perturbation, implying an unconventional origin of the underlying electronic instability.
Introduction
As in cuprate superconductors, high-temperature superconductivity in Fe-based superconductors [1, 2, 3, 4, 5] is found in the proximity to the magnetically ordered state, with the interplay between the magnetic order and superconductivity long being at the forefront of the research. Detailed studies soon revealed the presence of another type of ordering, the electronic nematicity, where the degeneracy between the two equivalent orthogonal directions in the square Fe planes is lifted, inducing a symmetry reduction at from tetragonal to orthorhombic.[6, 7] This so-called nematic phase transition, which in most cases precedes the magnetic one, has been considered to be driven by magnetic fluctuations. Indeed, in the parent compound of the prototypical system, BaFe2As2 (Fe-122), a stripe-type spin-density-wave ground state is realized below 134 K, the transition being slightly preceded by the nematic one at 137 K.[8] Upon doping (or application of pressure) high-temperature superconductivity is realized in this system.
BaNi2As2 (Ni-122) is a non-magnetic analogue of Fe-122. It shares the same tetragonal high-temperature structure while below = 138 K the structure is triclinic. It displays superconductivity already in the undoped case ( K) with no magnetic order reported down to the lowest temperatures.[9] Instead, recent X-ray diffraction studies suggest two distinct charge-density-wave (CDW) orders above and below .[10] What is particularly striking, is the observed six-fold enhancement of the superconducting and a giant phonon softening observed when doping Ni-122 to a level where the structural transition is completely suppressed.[11] Similar enhancement at the possible quantum critical point between the triclinic and tetragonal phases was recently observed also in strontium substituted Ni-122.[12] There, electronic nematic fluctuations were demonstrated and showed a dramatic increase near the suggested quantum critical point.[12] The observed correlation between the enhancement of superconductivity and the increase in nematic fluctuations, with the same B1g symmetry breaking for both the nematic fluctuations and the CDW order, may suggest a charge-order-driven electronic nematicity in Ni-122.[12] The interplay between electronic nematicity, CDW order and superconductivity in Ni-122 system thus presents one of the key topics in the current pnictide research, especially given the parallels to cuprate superconductors[13] that can be drawn.
The existence of the periodic lattice distortion (PLD) in Ni-122 system has been demonstrated by X-ray diffraction studies.[10, 12, 14, 15] In undoped Ni-122 diffuse incommensurate superstructure reflections at () are observed already at room temperature[15] (the indexing throughout of the paper refers to the high-T tetragonal phase). Upon cooling, the correlation length of modulation strongly increases around 150K, yet the system remains tetragonal.[14, 15] Thermal expansion studies[15] reveal a second order phase transition at K, where orthorhombic distortion implies an unidirectional incommensurate CDW, I-CDW1, at (). At K[10] a first order structural phase transition to a triclinic structure takes place (both and are transition temperatures upon warming). In the triclinic phase, a new periodicity of PLD is observed, attributed to I-CDW2 with (, ) superstructure reflections. The discommensuration vanishes, i.e. , slightly below , resulting in a commensurate C-CDW[10, 14, 15] with a wave-vector (, ). There are, however, no abrupt changes in the displacement amplitude at the lock-in transition.[10] Given the fact that the triclinic transition is of the first order, with hysteresis of about 5 K, one can argue that the structural transition is concomitant with the I-CDW1 to C-CDW transition.
In the charge channel, however, optical studies show no signatures of the CDW-induced optical gap.[16, 17] To get further support for the CDW origin of the observed PLD[10, 12, 15] and to gain insights into the relation between CDWs and structure, the information on CDW collective modes is required. To this end, we apply time-resolved optical spectroscopy which has been demonstrated to be particularly sensitive to study low-energy q Raman-active collective modes in systems exhibiting CDW order.[18, 19, 20, 21] While obeying similar selection rules to conventional Raman spectroscopy,[22] the method was able to spectrally resolve modes with line widths as low as 3 GHz ( cm-1),[19] access modes at frequencies down to 100 GHz (3 cm-1),[20] and is suitable also for investigations of disordered/inhomogeneous samples.[23] The information on the temperature ()[18, 19, 20, 21] and excitation fluence () dependent[24, 25, 26] dynamics provide further insights into the nature of collective ground states.
Here, we report systematic - and -dependent study of photoinduced reflectivity dynamics in BaNi2As2. At temperatures below K we observe several oscillatory modes. Comparison to phonon dispersion calculations reveals that several weak modes could be attributed to q Raman active modes. The dominant, strongly temperature dependent modes, however, do not match the calculated q phonon frequencies of the high temperature tetragonal phase. Based on their - and -dependence, which match the behavior seen in prototype CDW systems,[19] we attribute these to collective amplitude modes of the CDW.[19, 27, 28] As these modes appear at temperatures K above the structural phase transition and show a continuous behavior across , we conclude that the in-plane I-CDW1 transforms into the C-CDW by gaining additional periodicity along the c-axis. This result suggests that while in Fe-122 nematicity is driven by magnetic instability, in BaNi2As2 the structural transition may be driven by the CDW instability. Moreover, while the temperature dependence of collective modes in BaNi2As2 follows the behavior seen in conventional Peierls CDW systems, the behavior is substantially different as far as the excitation density dependence is concerned. In particular, no ultrafast collapse of the CDW is observed up to excitation densities over an order of magnitude higher than in prototype Peierls systems,[19, 21, 25, 29, 26] suggesting an unconventional microscopic mechanism.
Results
We studied the - and -dependence of the photoinduced near-infrared reflectivity dynamics in undoped BaNi2As2 using an optical pump-probe technique. The single crystals were cleaved along the plane with the pump and the probe beams at near normal incidence (they were cross-polarized for higher signal to noise ratio). We performed also pump- and probe-polarization dependence of the photoinduced reflectivity, with no significant variation being observed (see Supplementary Information). The reported temperature dependence measurements were performed upon warming. Continuous laser heating was experimentally determined to be about 3 K for mJ cm-2, and has been taken into account (see Supplementary Information).
Photoinduced reflectivity dynamics in the near-infrared
Figure 1a presents the T-dependence of photoinduced reflectivity transients, , recorded upon increasing the temperature from 10 K, with mJ cm-2. This fluence was chosen such that the response is still linear, yet it enables high enough dynamic range to study collective dynamics (see also section on excitation density dependence).
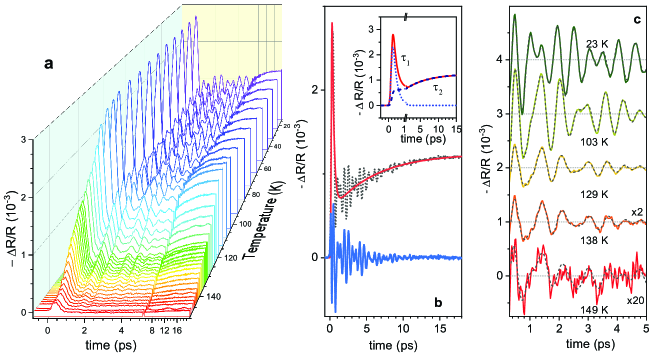
Clear oscillatory response is observed up to K, with the magnitude displaying a strong decrease near and above . Similarly to the oscillatory signal, the overdamped response is also strongly -dependent. As shown in Figure 1b the response can be decomposed into an overdamped and oscillatory response. To analyze the dependence of the oscillatory response on , we first subtract the overdamped components. These can be fit by
| (1) |
where presents the Heaviside step function with an effective rise time . The terms in brackets represent the fast decaying process with and the resulting quasi-equilibrium value , together with the slower buildup process with and , taking place on a 10 ps timescale - see inset to Figure 1b. Figure 1c, presents the oscillatory part of the signal subtracted from the overdamped response at selected temperatures together with the fit (black dashed lines) using sum of four damped oscillators (discussed below).
Collective modes in BaNi2As2
Figure 2 presents the results of the analysis of the oscillatory response. Figure 2a shows the -dependence of the Fast Fourier Transformation (FFT) spectra in the contour plot, where several modes up to THz can be resolved, with the low-T mode frequencies depicted by red arrows. To analyze the temperature dependence of the modes’ parameters we fit the oscillatory response to a sum of damped oscillators, .
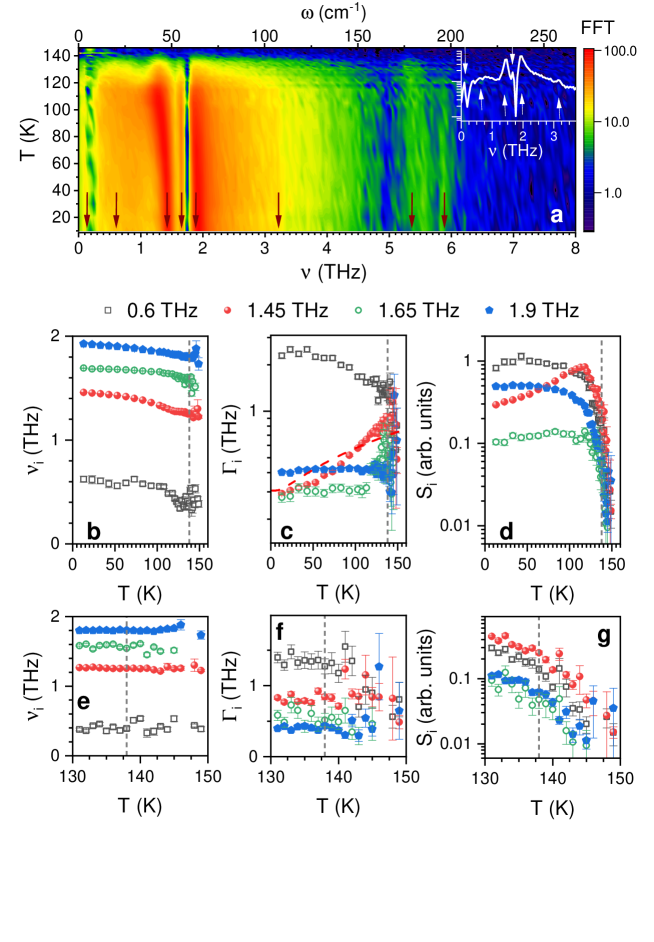
Figure 2b-d presents T-dependences of the extracted mode frequencies (here - see [31]), dampings , and spectral weights () of the four dominant modes (see also Supplementary Information). Noteworthy, all these low frequency modes are observed up to K, well above K and K. While their spectral weights are dramatically reduced upon increasing the temperature through , their frequencies and linewidths remain nearly constant through and .
In Figure 3 we present the result of the phonon dispersion calculations for the high temperature tetragonal structure. None of the experimentally observed low frequency modes matches the calculated q mode frequencies. Therefore, and based on their - and -dependence, discussed below, we attribute these modes to collective amplitude modes of the CDW order.[19, 21, 27, 28, 32] In particular, we argue that these low-temperature q amplitude modes are a result of linear (or higher order[19, 21]) coupling of the underlying electronic modulation with phonons at the wavevector qCDW (or qCDW for the -th order coupling[19, 21]) of the high- phase. Within this scenario,[19, 21, 27, 28, 32, 33] the low- frequencies of amplitude modes should be comparable to frequencies of normal state phonons at qCDW (or qCDW for the higher order coupling), with renormalizations depending on the coupling strengths. Moreover, -dependences of modes’ parameters , and should reflect the temperature variation of the underlying electronic order parameter.[19, 21, 27, 28, 32, 33]
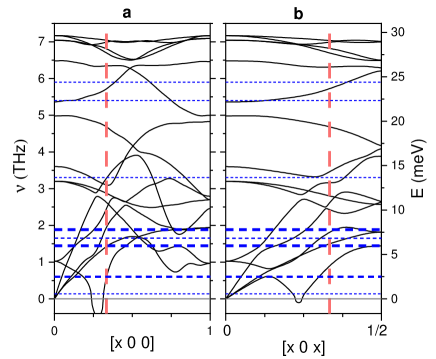
The first support for the assignment of these modes to amplitude modes follows from calculations of the phonon dispersion, presented in Fig. 3. Note that, since these modes appear already above , their frequencies must be compared to phonon dispersion calculations in the high temperature tetragonal phase. Figure 3 presents the calculated phonon dispersion in the [100] and [101] directions, along which the modulation of the I-CDW and C-CDW, respectively, is observed. In Figure 3, frequencies of the experimentally observed modes are denoted by the dashed horizontal lines (the line thicknesses reflect the modes’ strengths).
Indeed, the frequencies of strong 1.45 THz and 1.9 THz modes match surprisingly well with the calculated phonon frequencies at the I-CDW modulation wavevector (given by the vertical dashed line in Figure 3a), supporting the linear-coupling scenario. The corresponding (calculated) frequencies of phonons at the C-CDW wavevector, shown in Figure 3b, are quite similar. As shown in Fig. 2, both modes display a pronounced softening upon increasing temperature, much as the dominant amplitude modes in the prototype quasi-1D CDW system K0.3MoO3,[19, 21] as well as dramatic drop in their spectral weights at high temperatures.[19] Finally, the particular -dependence of for the 1.45 THz mode clearly cannot be described by an anharmonic phonon decay model, given by [30] Instead, the behavior is similar to prototype CDW systems, where damping is roughly inversely proportional to the order parameter.[19, 21]
Given the fact that the structural transition at is of the first order, such a strong T-dependence of frequencies and dampings at may sound surprising. However, as amplitude modes are a result of coupling between the electronic order and phonons at the CDW wavevector,[19, 21, 28] the -dependence of the mode frequencies and dampings reflect the -dependence of the electronic order parameter.[19, 21] Indeed, the -dependence of PLD[10] as well as of the charge/orbital order[15] do display a pronounced -dependence within the C-CDW phase.
A strongly damped mode at 0.6 THz also matches the frequency of the calculated high-temperature optical phonon at qI-CDW. We note, however, that the calculations imply this phonon to have an instability near qI-CDW, thus the matching frequencies should be taken with a grain of salt. The extracted mode frequency does show a pronounced softening (Fig. 2b), though large damping and rapidly decreasing spectral weight result in a large scatter of the extracted parameters at high temperatures. We further note the anomalous reduction in damping of the 0.6 THz mode upon increasing the temperature (Fig. 2c). Such a behavior has not been observed in conventional Peierls CDW systems,[19, 21] and may reflect the unconventional nature of the CDW order in this system. We note, that phonon broadening upon cooling was observed for selected modes in Fe1+yTe1-xSex [34, 35] and NaFe1-xCoxAs [36] above and/or below the respective structural phase transitions. Several interpretation have been put forward for these anomalous anharmonic behaviors, that can have distinct origins.[34, 35, 36]
A weak narrow mode at 1.65 THz is also observed, which does not seem to have a high temperature phonon counterpart at the qI-CDW. Its low spectral weight may reflect the higher-order coupling nature of this mode.
Finally, several much weaker modes are also observed (see Figure 2a). Comparison with phonon calculations suggest 3.3 THz and 5.4 THz modes are likely regular q phonons, the 5.9 THz mode could also be the amplitude collective mode, while the nature of 0.17 THz mode is unclear (see Supplementary Information for further discussion). We note that, as the pump-probe technique is mostly sensitive to Ag symmetry modes that couple directly to carrier density [22, 31], the stronger the coupling to the electronic system, the larger the spectral weight of the mode. Correspondingly, in time-resolved experiments the spectral weights of amplitude modes are much higher than regular q phonons.
Overdamped modes in BaNi2As2
Further support for the CDW order in BaNi2As2[10, 15] is provided by the -dependence of overdamped components. Figure 4a presents the -dependence of signal amplitudes , which corresponds to the peak value, and extracted by fitting the transient reflectivity data using Eq.(1). In CDW systems the fast decay process with has been attributed to an overdamped (collective) response of the CDW condensate,[19, 21] while the slower process (,) has been associated to incoherently excited collective modes.[21] As both are related to the CDW order, their amplitudes should reflect this. Indeed, both components are strongly reduced at high temperatures, with a pronounced change in slope in the vicinity of - see Figure 4a. Component displays a maximum well below , similar to the observation in K0.3MoO3.[37] Above K the reflectivity transient shows a characteristic metallic response, with fast decay on the 100 fs timescale.
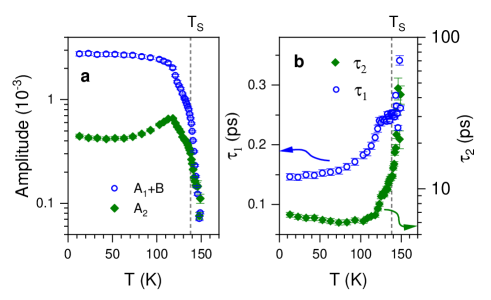
The evolution of timescales and is shown in Figure 4b. In the C-CDW phase, up to K, the two timescales show qualitatively similar dependence as in prototype 1D CDWs:[19, 21, 20] increases with increasing temperature while decreases.[19, 21, 20] As is inversely proportional to the CDW strength,[19, 21] its -dependence is consistent with the observed softening of the amplitude modes. Its increase with increasing temperature is, however, not as pronounced as in CDW systems with continuous phase transitions, where timescales can change by an order of magnitude when gap is closing in a mean-field fashion.[18, 19, 20, 21] From about 130 K remains nearly constant up to K. On the other hand, for K displays a pronounced increase, though the uncertainties of the extracted parameters start to diverge as signals start to faint. Importantly, all of the observables seem to evolve continuously through , despite the pronounced changes in the electronic and structural properties that are observed, e.g., in the c-axis transport[38] or the optical conductivity.[16, 17]
Excitation density dependence
Valuable information about the nature of CDW order can be obtained from studies of dynamics as a function of excitation fluence, . In conventional Peierls CDW systems a saturation of the amplitude of the overdamped response is commonly observed at excitation fluences of the order of 0.1-1 mJ cm-2.[24, 20, 25, 26] The corresponding absorbed energy density, at which saturation is reached, is comparable to the electronic part of the CDW condensation energy.[24, 26] Similarly, the spectral weights of amplitude modes saturate at this saturation fluence. The modes are still observed up to excitation densities at which the absorbed energy density reaches the energy density required to heat up the excited volume up to the CDW transition temperature.[24] The reason for this is an ultrafast recovery of the electronic order on a timescale , which is faster than the collective modes’ periods.[24]
We performed dependence study at 10 K base temperature, with varied between and mJ cm-2. The reflectivity transients are presented in Fig. 5a. Unlike in prototype CDWs, no saturation of the fast overdamped response is observed up to the highest (inset to Fig. 5b). The absence of spectroscopic signature of the CDW induced gap in BaNi2As2[17] suggest that most of the Fermi surface remains unaffected by the CDW order. Thus, the photoexcited carriers can effectively transfer their energy to the lattice,[39] just as in the high- metallic phase. Nevertheless, the fact that the excitation densities used here do exceed saturation densities in conventional CDW systems by over an order of magnitude suggests an unconventional mechanism driving the CDW in BaNi2As2. We note that signal displays a super-linear dependence for mJ cm-2.
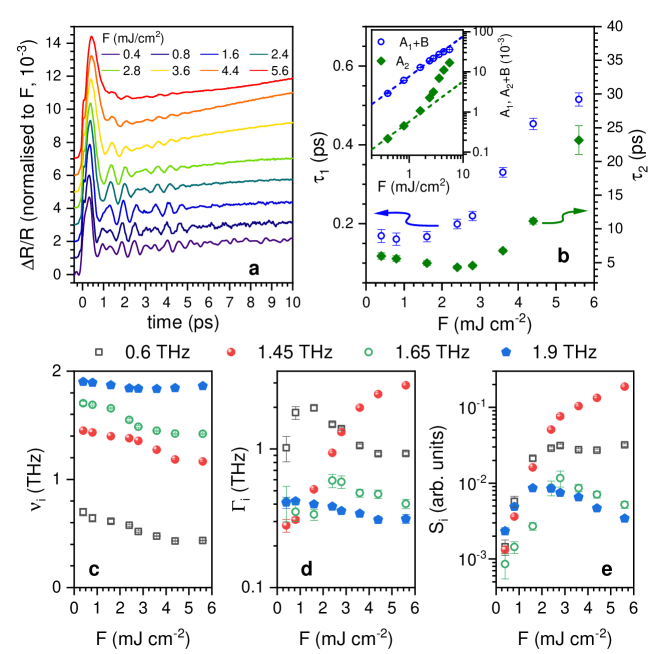
Figure 5b presents and for the data recorded at 10 K. Qualitatively, the -dependence of the two timescales resembles their temperature dependence, similar to observations in Peierls CDW systems.[24] Since reflects the recovery of the electronic part of the order parameter, , and follows ,[19, 21] this observation supports a continuous suppression of the electronic order with increasing . However, in Ni-122 no discontinuous drop in is observed up to the highest fluences. In K0.3MoO3[24] such a drop in is observed at the fluence corresponding to the full suppression of the electronic order.
Figure 5c-e presents the -dependence of the extracted amplitude mode parameters. A softening upon increasing the fluence is observed for all four modes (Fig. 5c). However, above mJ cm-2 the values reach a plateau. Such an unusual behavior is not observed in Peierls CDWs[19, 21] and may hold clues to the interplay between the periodic lattice distortion and the underlying electronic instability. An indication of suppression of the underlying electronic order is observed also as saturation of spectral weights of some of the amplitude modes near mJ cm-2, see Fig. 5e. On the other hand, the mode at 1.45 THz, which is the most similar to main modes in K0.3MoO3, shows no such saturation up to the highest fluences. While the observed anomalies seen near mJ cm-2 may be linked to the underlying microscopic mechanism of CDW order in Ni-122, one could also speculate the anomalies may be related to the photoinduced suppression of commensurability.
To put the observed robustness of the CDW against optical excitation into perspective, we note that mJ cm-2 corresponds to the absorbed energy density of about 180 J cm-3 (110 meV per formula unit). Assuming rapid thermalization between electrons and the lattice, and no other energy decay channels, the resulting temperature of the excited sample volume would reach K (see also Supplementary Information). However, with high conductivity also along the c-axis [38] and the estimated electronic mean free path on 7 nm [40], transport of hot carriers into the bulk on the (sub)picosecond timescale cannot be excluded. Nevertheless, the fact that even at 5.6 mJ cm-2 (0.6 eV per formula unit) the CDW order has not collapsed, underscores an unconventional CDW order in in BaNi2As2.[10, 15]
Conclusion
Our results clearly demonstrate the existence of CDW collective modes in BaNi2As2, which appear well above the triclinic transition. At temperatures well below the triclinic transition, the modes show qualitatively similar temperature dependence as in extensively studied prototype 1D CDW K0.3MoO3 [19, 21, 23]. For temperatures above K, however, only spectral weights of the modes get suppressed, while their central frequencies and dampings remain largely constant up to K. This provides an important insight into the relation between the CDW order and the structural phase transitions. While the XRD data[10, 14, 15] clearly show two distinct modulations above and below TS, the collective modes show no detectable discontinuity of their frequencies and dampings at (nor at ). This suggests that the C-CDW evolves from the I-CDW1 by gaining additional periodicity along the c-axis. The sequence of phase transitions, with orthorhombicity accompanying the appearance of unidirectional I-CDW1,[15] may suggest charge-order driven nematicity in BaNi2As2. Moreover, the fact that coincides with I-CDWC-CDW transition may in fact support the idea of structural phase transition being mediated by the stabilization of the CDW order. In an alternative scenario, the lock-in CDW supports the triclinic phase, which otherwise competes with the tetragonal/orthorhombic one, as suggested by the strong reduction of the c/a ratio when entering the triclinic phase, and the first order nature of the transition. The change of the CDW modulation vector is then triggered by the underlying structural change.
While the -dependence of collective mode dynamics roughly follows the behavior seen in conventional Peierls CDWs, implying the existence of an underlying electronic instability, the resilience of the electronic CDW order against perturbations suggests an unconventional mechanism. Recent photoemission data[41] suggest the band reconstruction to be consistent with the proposed orbitally driven Peierls instability.[42, 43] Such a scenario is further supported by the finding of Ni-Ni dimers.[15] Moreover, also a third type of commensurate CDW order, with q was observed in Ba1-xSrxNi2As2 for .[14] Thus, systematic doping and pressure dependent studies of collective modes may provide valuable additional clues to the underlying microscopic interactions.
Our findings suggest an intimate relation between charge-order and structural instabilities in a Ni-122 system and imply an unconventional origin of the electronic instability, likely associated to orbital ordering.[42, 43] Together with the observed doping dependence of superconducting critical temperature,[11] the results provide important input for theoretical models addressing the interplay between high-temperature superconductivity to a close proximity of a competing electronic instability.
Methods
Single crystals of BaNi2As2
Single crystals of BaNi2As2 with typical dimensions 220.5 mm3 were grown by self-flux method similar to reported literature [11, 38]. Crystals were mechanically freed from the flux and characterized using X-ray diffraction and energy-dispersive x-ray spectroscopy (EDX). The samples were cleaved along the plane before mounting into an optical cryostat and were kept in vacuum during the measurements.
Experimental set-up
A commercial 300 kHz Ti:Sapphire amplifier producing 50 fs laser pulses at = 800 nm (photon energy of 1.55 eV) was used as a source of both pump and probe pulse trains. The beams were at near normal incidence, with polarizations at 90 degrees with respect to each other to reduce noise. The fluence was varied between 0.1 - 5 mJ cm-2 while the probe fluence was about 30 J cm-2. The induced changes of an in-plane reflectivity () were recorded utilizing a fast-scan technique, enabling high signal-to-noise level [19]. Continuous sample heating was experimentally estimated by performing temperature scans at different excitation densities. For the excitation fluence of 0.4 mJ cm-2 the continuous laser heating near results in the probed sample volume about 3 K higher than the base temperature; the continuous laser heating has been taken into account when plotting the temperature dependent data.
Phonon dispersion calculation
Lattice dynamics properties for the high-temperature tetragonal structure were calculated using the linear response or density-functional perturbation theory (DFPT) implemented in the mixed-basis pseudo-potential method [44, 45, 46]. The electron-ion interaction is described by norm-conserving pseudo-potentials, which were constructed following the descriptions of Hamann, Schlüter, Chiang [47] for Ba and Vanderbilt [48] for Ni and As, respectively. Semi-core states Ba-5, Ni-3, Ni-3 were included in the valence space.
In the mixed-basis approach, valence states are expanded in a combination of plane waves and local functions at atomic sites, which allows an efficient description of more localized components of the valence states. Here, plane waves with a cut-off for the kinetic energy of 22 Ry and local functions of , type for Ba and , , type for Ni, respectively, were employed. Brillouin-zone integration was performed by sampling a tetragonal k-point mesh in conjunction with a Gaussian broadening of 50 meV. The exchange-correlation functional was represented by the general-gradient approximation in the Perdew-Burke-Ernzerhof form [49].
Phonon dispersions along the [100] and [101] directions of the tetragonal structure, shown in Figure 3, were obtained by Fourier-interpolation of dynamical matrices calculated by DFPT on a tetragonal mesh. A denser 16 x 1 x 1 mesh was used to better resolve the position of the instability in the [100] direction. Structural parameters were taken from room-temperature measurements after [15].
We find similar phonon branches as in a previous work [50], with one notable exception: there occurs an instability in an optical branch near the critical wavevector of the I-CDW of (0.28,0,0), which was missed in the previous study. This instability only shows up, when a sufficiently dense mesh for the calculation of the dynamical matrices is used, and is easily overlooked otherwise.
Data availability
All relevant data are available from the authors.
References
- [1] Kamihara, Y., Watanabe, T., Hirano, M. & Hosono, H. Iron-based layered superconductor La[O1-xFx]FeAs ( ) with Tc = 26 K. \JournalTitleJournal of the American Chemical Society 130, 3296–3297, DOI: 10.1021/ja800073m (2008).
- [2] Hsu, F.-C. et al. Superconductivity in the PbO-type structure -FeSe. \JournalTitleProceedings of the National Academy of Sciences 105, 14262–14264, DOI: 10.1073/pnas.0807325105 (2008).
- [3] Wang, X. et al. The superconductivity at 18 K in LiFeAs system. \JournalTitleSolid State Communications 148, 538–540, DOI: 10.1016/j.ssc.2008.09.057 (2008).
- [4] Parker, D. R. et al. Structure, antiferromagnetism and superconductivity of the layered iron arsenide NaFeAs. \JournalTitleChem. Commun. 2189–2191, DOI: 10.1039/B818911K (2009).
- [5] Wang, A. F. et al. Phase diagram and calorimetric properties of NaFe1-xCoxAs. \JournalTitlePhys. Rev. B 85, 224521, DOI: 10.1103/PhysRevB.85.224521 (2012).
- [6] Chu, J.-H. et al. In-plane resistivity anisotropy in an underdoped Iron Arsenide superconductor. \JournalTitleScience 329, 824–826, DOI: 10.1126/science.1190482 (2010).
- [7] Fernandes, R. M., Chubukov, A. V. & Schmalian, J. What drives nematic order in iron-based superconductors? \JournalTitleNature Physics 10, 97–104, DOI: 10.1038/nphys2877 (2014).
- [8] Kim, M. G. et al. Character of the structural and magnetic phase transitions in the parent and electron-doped BaFe2As2 compounds. \JournalTitlePhys. Rev. B 83, 134522, DOI: 10.1103/PhysRevB.83.134522 (2011).
- [9] Ronning, F. et al. The first order phase transition and superconductivity in BaNi2As2 single crystals. \JournalTitleJournal of Physics: Condensed Matter 20, 342203, DOI: 10.1088/0953-8984/20/34/342203 (2008).
- [10] Lee, S. et al. Unconventional charge density wave order in the pnictide superconductor Ba(Ni1-xCox)2As2). \JournalTitlePhys. Rev. Lett. 122, 147601, DOI: 10.1103/PhysRevLett.122.147601 (2019).
- [11] Kudo, K., Takasuga, M., Okamoto, Y., Hiroi, Z. & Nohara, M. Giant phonon softening and enhancement of superconductivity by phosphorus doping of . \JournalTitlePhys. Rev. Lett. 109, 097002, DOI: 10.1103/PhysRevLett.109.097002 (2012).
- [12] Eckberg, C. et al. Sixfold enhancement of superconductivity in a tunable electronic nematic system. \JournalTitleNature Physics 16, 346–350, DOI: 10.1038/s41567-019-0736-9 (2020).
- [13] Ghiringhelli, G. et al. Long-range incommensurate charge fluctuations in (Y,Nd)Ba2Cu3O6+x. \JournalTitleScience 337, 821–825, DOI: 10.1126/science.1223532 (2012).
- [14] Lee, S. et al. Multiple charge density waves and superconductivity nucleation at antiphase domain walls in the nematic pnictide Ba1-xSrxNi2As2. \JournalTitlePhys. Rev. Lett. 127, 027602, DOI: 10.1103/PhysRevLett.127.027602 (2021).
- [15] Merz, M. et al. Rotational symmetry breaking at the incommensurate charge-density-wave transition in : Possible nematic phase induced by charge/orbital fluctuations. \JournalTitlePhys. Rev. B 104, 184509, DOI: 10.1103/PhysRevB.104.184509 (2021).
- [16] Chen, Z. G. et al. Origin of the structural phase transition in at 130 K: A combined study of optical spectroscopy and band structure calculations. \JournalTitlePhys. Rev. B 80, 094506, DOI: 10.1103/PhysRevB.80.094506 (2009).
- [17] Chen, Z. G., Hu, W. Z. & Wang, N. L. Different nature of instabilities in BaFe2As2 and BaNi2As2 as revealed by optical spectroscopy. \JournalTitlephysica status solidi (b) 247, 495–499, DOI: https://doi.org/10.1002/pssb.200983069 (2010).
- [18] Demsar, J., Forró, L., Berger, H. & Mihailovic, D. Femtosecond snapshots of gap-forming charge-density-wave correlations in quasi-two-dimensional dichalcogenides and . \JournalTitlePhys. Rev. B 66, 041101, DOI: 10.1103/PhysRevB.66.041101 (2002).
- [19] Schäfer, H., Kabanov, V. V., Beyer, M., Biljakovic, K. & Demsar, J. Disentanglement of the electronic and lattice parts of the order parameter in a 1D charge density wave system probed by femtosecond spectroscopy. \JournalTitlePhys. Rev. Lett. 105, 066402, DOI: 10.1103/PhysRevLett.105.066402 (2010).
- [20] Schaefer, H. et al. Dynamics of charge density wave order in the quasi one dimensional conductor (TaSe4)2I probed by femtosecond optical spectroscopy. \JournalTitleThe European Physical Journal Special Topics 222, 1005–1016, DOI: 10.1140/epjst/e2013-01902-4 (2013).
- [21] Schaefer, H., Kabanov, V. V. & Demsar, J. Collective modes in quasi-one-dimensional charge-density wave systems probed by femtosecond time-resolved optical studies. \JournalTitlePhys. Rev. B 89, 045106, DOI: 10.1103/PhysRevB.89.045106 (2014).
- [22] Stevens, T. E., Kuhl, J. & Merlin, R. Coherent phonon generation and the two stimulated Raman tensors. \JournalTitlePhys. Rev. B 65, 144304, DOI: 10.1103/PhysRevB.65.144304 (2002).
- [23] Dominko, D. et al. Detection of charge density wave ground state in granular thin films of blue bronze by femtosecond spectroscopy. \JournalTitleJournal of Applied Physics 110, 014907, DOI: 10.1063/1.3606418 (2011).
- [24] Tomeljak, A. et al. Dynamics of photoinduced charge-density-wave to metal phase transition in . \JournalTitlePhys. Rev. Lett. 102, 066404, DOI: 10.1103/PhysRevLett.102.066404 (2009).
- [25] Yusupov, R. et al. Coherent dynamics of macroscopic electronic order through a symmetry breaking transition. \JournalTitleNature Physics 6, 681–684, DOI: 10.1038/nphys1738 (2010).
- [26] Stojchevska, L. et al. Mechanisms of nonthermal destruction of the superconducting state and melting of the charge-density-wave state by femtosecond laser pulses. \JournalTitlePhys. Rev. B 84, 180507, DOI: 10.1103/PhysRevB.84.180507 (2011).
- [27] Rice, M. J. Organic linear conductors as systems for the study of electron-phonon interactions in the organic solid state. \JournalTitlePhys. Rev. Lett. 37, 36–39, DOI: 10.1103/PhysRevLett.37.36 (1976).
- [28] Golovko, V. A. & Levanyuk, A. P. Light scattering and the dispersion of susceptibilities in an incommensurate phase. \JournalTitleZh. Eksp. Teor. Fiz. 81, 2296–2313 (1981).
- [29] Schmitt, F. et al. Transient electronic structure and melting of a charge density wave in TbTe3. \JournalTitleScience 321, 1649–1652, DOI: 10.1126/science.1160778 (2008).
- [30] Menéndez, J. & Cardona, M. Temperature dependence of the first-order Raman scattering by phonons in Si, Ge, and : Anharmonic effects. \JournalTitlePhys. Rev. B 29, 2051–2059, DOI: 10.1103/PhysRevB.29.2051 (1984).
- [31] Zeiger, H. J. et al. Theory for displacive excitation of coherent phonons. \JournalTitlePhys. Rev. B 45, 768–778, DOI: 10.1103/PhysRevB.45.768 (1992).
- [32] Thomson, M. D. et al. Phase-channel dynamics reveal the role of impurities and screening in a quasi-one-dimensional charge-density wave system. \JournalTitleScientific Reports 7, 2039, DOI: 10.1038/s41598-017-02198-x (2017).
- [33] Schubert, M. et al. Collective Modes and Structural Modulation in Ni-Mn-Ga(Co) Martensite Thin Films Probed by Femtosecond Spectroscopy and Scanning Tunneling Microscopy. \JournalTitlePhys. Rev. Lett. 115, 076402, DOI: 10.1103/PhysRevLett.115.076402 (2015).
- [34] Gnezdilov, V. et al. Anomalous optical phonons in FeTe chalcogenides: Spin state, magnetic order, and lattice anharmonicity. \JournalTitlePhys. Rev. B 83, 245127, DOI: 10.1103/PhysRevB.83.245127 (2011).
- [35] Um, Y. J. et al. Anomalous dependence of -axis polarized Fe B1g phonon mode with Fe and Se concentrations in Fe1+yTe1-xSex. \JournalTitlePhys. Rev. B 85, 064519, DOI: 10.1103/PhysRevB.85.064519 (2012).
- [36] Um, Y. J., Bang, Y., Min, B. H., Kwon, Y. S. & Le Tacon, M. Superconductivity-induced phonon renormalization on NaFe1-xCoxAs. \JournalTitlePhys. Rev. B 89, 184510, DOI: 10.1103/PhysRevB.89.184510 (2014).
- [37] Demsar, J., Biljaković, K. & Mihailovic, D. Single particle and collective excitations in the one-dimensional charge density wave solid K0.3MoO3 probed in real time by femtosecond spectroscopy. \JournalTitlePhys. Rev. Lett. 83, 800–803, DOI: 10.1103/PhysRevLett.83.800 (1999).
- [38] Sefat, A. S. et al. Structure and anisotropic properties of (, 1, and 2) single crystals. \JournalTitlePhys. Rev. B 79, 094508, DOI: 10.1103/PhysRevB.79.094508 (2009).
- [39] Obergfell, M. & Demsar, J. Tracking the time evolution of the electron distribution function in Copper by femtosecond broadband optical spectroscopy. \JournalTitlePhys. Rev. Lett. 124, 037401, DOI: 10.1103/PhysRevLett.124.037401 (2020).
- [40] Kurita, N. et al. Low-temperature magnetothermal transport investigation of a Ni-based superconductor : Evidence for Fully Gapped Superconductivity. \JournalTitlePhys. Rev. Lett. 102, 147004, DOI: 10.1103/PhysRevLett.102.147004 (2009).
- [41] Noda, T. et al. Orbital-dependent band renormalization in BaNi2(As1-xPx)2 (x = 0.00 and 0.092). \JournalTitleJournal of the Physical Society of Japan 86, 064708, DOI: 10.7566/JPSJ.86.064708 (2017).
- [42] Khomskii, D. & Mizokawa, T. Orbitally induced peierls state in spinels. \JournalTitlePhysical review letters 94, 156402, DOI: 10.1103/PhysRevLett.94.156402 (2005).
- [43] Streltsov, S. V. & Khomskii, D. I. Orbital-dependent singlet dimers and orbital-selective Peierls transitions in transition-metal compounds. \JournalTitlePhys. Rev. B 89, 161112(R), DOI: 10.1103/PhysRevB.89.161112 (2014).
- [44] Heid, R. & Bohnen, K.-P. Linear response in a density-functional mixed-basis approach. \JournalTitlePhys. Rev. B 60, R3709–R3712, DOI: 10.1103/PhysRevB.60.R3709 (1999).
- [45] Louie, S. G., Ho, K.-M. & Cohen, M. L. Self-consistent mixed-basis approach to the electronic structure of solids. \JournalTitlePhys. Rev. B 19, 1774–1782, DOI: 10.1103/PhysRevB.19.1774 (1979).
- [46] Meyer, B., Elsässer, C., F., L. & Fähnle, M. Fortran90 program for mixed-basis pseudopotential calculations for crystals, max-planck-institut für metallforschung. Stuttgart (unpublished).
- [47] Hamann, D. R., Schlüter, M. & Chiang, C. Norm-conserving pseudopotentials. \JournalTitlePhys. Rev. Lett. 43, 1494–1497, DOI: 10.1103/PhysRevLett.43.1494 (1979).
- [48] Vanderbilt, D. Optimally smooth norm-conserving pseudopotentials. \JournalTitlePhys. Rev. B 32, 8412–8415, DOI: 10.1103/PhysRevB.32.8412 (1985).
- [49] Perdew, J. P., Burke, K. & Ernzerhof, M. Generalized gradient approximation made simple. \JournalTitlePhys. Rev. Lett. 77, 3865–3868, DOI: 10.1103/PhysRevLett.77.3865 (1996).
- [50] Subedi, A. & Singh, D. J. Density functional study of BaNi2As2: Electronic structure, phonons, and electron-phonon superconductivity. \JournalTitlePhys. Rev. B 78, 132511, DOI: 10.1103/PhysRevB.78.132511 (2008).
Acknowledgments
This work was funded by the Deutsche Forschungsgemeinschaft (DFG, German Research Foundation) - TRR 288 - 422213477 (projects B03 and B08). The contribution from M.M. was supported by the Karlsruhe Nano Micro Facility (KNMF). R.H. acknowledges support by the state of Baden-Württemberg through bwHPC.
Author contributions
A.R.P, V.G., A.M., T.D. performed ultrafast optical spectroscopy measurements. A.A.H. grew the single crystal samples and performed EDX characterization. M.M. performed XRD measurements. Y.L. performed Raman studies. R.H. performed phonon dispersion calculations. V.G., A.R.P., and JD analyzed the data. V.G., A.R.P. and J.D. wrote the manuscript with contributions from all coauthors. J.D. coordinated the project.
Competing interests
The authors declare no competing interests.