Supernova 1987A: 3D Mixing and light curves for explosion models based on binary-merger progenitors
Abstract
Six binary-merger progenitors of Supernova 1987A (SN 1987A) with properties close to those of the blue supergiant Sanduleak are exploded by neutrino heating and evolved until long after shock breakout in three dimensions (3D), and continued for light-curve calculations in spherical symmetry. Our results confirm previous findings for single-star progenitors: (1) 3D neutrino-driven explosions with SN 1987A-like energies synthesize 56Ni masses consistent with the radioactive light-curve tail; (2) hydrodynamic models mix hydrogen inward to minimum velocities below 40 km s-1 compatible with spectral observations of SN 1987A; and (3) for given explosion energy the efficiency of outward radioactive 56Ni mixing depends mainly on high growth factors of Rayleigh-Taylor instabilities at the (C+O)/He and He/H composition interfaces and a weak interaction of fast plumes with the reverse shock occurring below the He/H interface. All binary-merger models possess presupernova radii matching the photometric radius of Sanduleak and a structure of the outer layers allowing them to reproduce the observed initial luminosity peak in the first 7 days. Models that mix about 0.5 of hydrogen into the He-shell and exhibit strong outward mixing of 56Ni with maximum velocities exceeding the 3000 km s-1 observed for the bulk of ejected 56Ni have light-curve shapes in good agreement with the dome of the SN 1987A light curve. A comparative analysis of the best representatives of our 3D neutrino-driven explosion models of SN 1987A based on single-star and binary-merger progenitors reveals that only one binary model fulfills all observational constraints, except one.
1 Introduction
On February 23, 1987, the outburst of the Type II plateau supernova (SN) 1987A was discovered by Ian Shelton in the Large Magellanic Cloud (LMC) (see Kunkel et al., 1987). This SN became a uniquely peculiar event and one of the most thoroughly studied objects observed from radio wavelengths to gamma-rays. Accurate positional measurement of the SN showed that its position coincided with that of star 1 from the Sanduleak system and a careful examination of the measured magnitudes indicated that this Sanduleak star was a B3 Ia supergiant (cf. West et al., 1987). These data suggest that the blue supergiant (BSG) star was the progenitor of SN 1987A and permit both single-star and binary evolution scenarios of Sanduleak .111Henceforward all references to Sanduleak only refer to star 1.
The fact that SN 1987A was the explosion of the BSG progenitor rather than a red supergiant (RSG) as expected for ordinary Type IIP SNe, triggered construction of a large variety of evolutionary models to explain the observed properties of Sanduleak . In the single-star scenario the relative compactness of the BSG progenitor was achieved either by a metal-deficient composition similar to that of the LMC (Truran & Weiss, 1987; Hillebrandt et al., 1987; Arnett, 1987), a modification of convective mixing through rotation-induced meridional circulation during stellar evolution (Weiss et al., 1988), a restricted semiconvective diffusion and low metallicity (Woosley et al., 1988; Weiss, 1989; Langer, 1991), or both mass loss and convective mixing (Saio et al., 1988).
All of these possibilities were equally promising until the ESO ground-based New Technology Telescope (Wampler et al., 1990) and the NASA/ESA Hubble Space Telescope (HST, Jakobsen et al., 1991) revealed an intricate triple-ring structure around SN 1987A. The existence of this triple-ring structure imposes additional severe constraints on the evolution of the pre-SN, putting the single-star scenario into doubt and favoring a binary evolution scenario. The evolution of stars in an interacting binary is so rich in possibilities that it permits not only the accretion of a substantial amount of matter from the secondary component onto the pre-SN, but also a complete merger of the two stars. Both abundant accretion of matter from the companion star (Podsiadlowski & Joss, 1989) and the merger of the companion star with the primary RSG (Chevalier & Soker, 1989; Hillebrandt & Meyer, 1989; Podsiadlowski et al., 1990, 2007; Menon & Heger, 2017; Urushibata et al., 2018) can explain the observed properties of the SN 1987A progenitor.
Podsiadlowski (1992) devised five observational and theoretical tests (the blue color of the progenitor, the ring surrounding it, the chemical anomalies of the progenitor, the characteristics of the SN explosion, and general consistency with the theory of massive stars) and confronted the available evolutionary models for the progenitor of SN 1987A with them. Podsiadlowski concluded that it is most likely that only binary scenario models (accretion and merger models) are able to fit all above constraints.
It is noteworthy that the chemical anomalies of the progenitor included a high nitrogen abundance that was revealed in the circumstellar matter of SN 1987A by an analysis of ultraviolet lines (Fransson et al., 1989) and the overabundance of barium in the ejecta that was estimated by a non-local thermodynamic equilibrium (non-LTE) modeling of optical spectra of SN 1987A (Mazzali et al., 1992). The latter anomaly was revisited and not confirmed when time-dependent effects were taken into account in addition to the non-LTE treatment of spectra (Utrobin & Chugai, 2005; Dessart & Hillier, 2008), thus softening this constraint.
Over the past quarter of a century, the characteristics of the SN explosion extracted from photometric and spectral observations of SN 1987A have become more and more detailed, especially regarding mixing of radioactive 56Ni and hydrogen in the ejected envelope (see Utrobin et al., 2015, for details). Colgan et al. (1994) analyzed the infrared emission lines of [Ni II] and [Fe II] in the nebular phase and found that the bulk of radioactive 56Ni was moving with a maximum velocity of 3000 km s-1. Additionally, at a higher radial velocity of about km s-1 a unique feature in the infrared emission lines of [Fe II] was found and interpreted as a fast-moving iron clump (Haas et al., 1990). Using the effect of an occultation of this clump by the photosphere on days 29 and 41, Utrobin et al. (1995) estimated its transversal velocity, which together with the radial velocity gives an absolute velocity of 4700 km s-1, and identified this high-velocity feature with a fast 56Ni clump whose luminosity corresponds to a mass of 10. The analysis of the profiles of hydrogen emission lines in SN 1987A during the nebular phase showed that hydrogen is mixed down into the innermost ejecta to velocities of km s-1 (Chugai, 1991; Kozma & Fransson, 1998; Maguire et al., 2012). The reconstruction of a three-dimensional (3D) view of H emission (Larsson et al., 2016) and molecular hydrogen (Larsson et al., 2019) revealed that the lowest velocities of hydrogen are observed at 450 km s-1 and 400 km s-1, respectively. Kozma & Fransson (1998) also constrained quantitatively the mass of hydrogen-rich matter which expanded with velocities less than 2000 km s-1 to about 2.2 .
Systematic optical and infrared photometric observations of the radioactive tail of SN 1987A carried out by different groups with different instruments permitted them to construct the bolometric light curve and, consequently, to estimate the total mass of ejected 56Ni – one of the important properties of SN explosions. Dopita et al. (1988) obtained a 56Ni mass of 0.085 at the Mount Stromlo and Siding Spring Observatories, Suntzeff et al. (1988) got 0.071 at the Cerro Tololo Inter-American Observatory, and Catchpole et al. (1989) found 0.078 at the Sutherland Observatory of the South African Astronomical Observatory. All these masses were obtained with the same distance modulus for the LMC of mag, but different reddening . Note that Suntzeff & Bouchet (1990) found a range of 0.055 to 0.090 for an admissible mass of radioactive 56Ni using the extreme values of the distance modulus to the LMC (18.3 mag and 18.6 mag) and the reddening (0.15 mag and 0.20 mag). More reliable estimates of the 56Ni mass with all essential sources of uncertainties taken into account are () (Bouchet et al., 1991; McCray, 1993) and () (Seitenzahl et al., 2014).
One of the central characteristics of an SN explosion is the mass of oxygen in the ejecta. Assuming the most favorable conditions for powering the luminosity of the forbidden oxygen doublet [O I] , McCray (1993) estimated that a lower limit of the mass of oxygen is about 0.3 . Li & McCray (1992) calculated the evolution of the intensity and the profile of the nebular [O I] doublet using a three-zone model with clumps of oxygen and fitted the observational data with an oxygen mass of 1.3 . Identifying the fluctuations in the profile of the oxygen doublet [O I] with statistical fluctuations of the oxygen clump number, Chugai (1994) found the net oxygen mass to be in the range of 1.2 to 1.5 . Chugai et al. (1997) analyzed the spectrum of SN 1987A, taken with the HST eight years after the explosion, and concluded that the luminosity of the [O I] doublet is consistent with an oxygen mass in the range of 1.5 –2.0 . Applying spectral synthesis non-LTE modeling to the nebular phase spectra, Kozma & Fransson (1998) found that the mass of oxygen gas moving with velocities less than 2000 km s-1 is about 1.9 . In turn, Jerkstrand et al. (2015) used a more elaborate spectral synthesis modeling and estimated an oxygen mass as low as 0.7 , taking the existing uncertainties into account. The mass of oxygen in SN 1987A is thus poorly constrained and ranges from 0.7 to 2.0 .
Since SN ejecta expand freely in the nebular phase, when the matter velocity is directly proportional to the radius, it is possible to combine the spectral information and the images along the line of sight to the observer to infer the 3D distribution of the ejecta for the observed emission lines. Kjær et al. (2010) studied the morphology of the ejecta using images and spectra for the emission lines of [Si I]+[Fe II] () and He I () from the integral field spectroscopy on the Very Large Telescope (VLT) in Chile, which were obtained in October and November 2005. Larsson et al. (2013) presented spectral and imaging observations obtained with the HST between 1994 and 2011 and with the VLT in 2011 at optical and near-infrared wavelengths, particularly in the emission lines of H and [Si I]+[Fe II]. Both Kjær et al. and Larsson et al. stated that all these observations show that the ejecta morphology is highly non-spherical. In the case of the [Si I]+[Fe II] and He I lines, the innermost regions of the ejecta are seen and the observed emission represents well the density distribution of these elements. Kjær et al. (2010) approximated the exact 3D shape of the ejecta by a non-spherical distribution and found that an elongated triaxial ellipsoid fits the observations most accurately.
The early hard X-ray and gamma-ray observations of SN 1987A are a powerful tool to test 3D hydrodynamic simulations of neutrino-driven explosions. These observations were carried out with the Roentgen Observatory, the Solar Maximum Mission, the X-ray astronomy satellite Ginga, and balloon-borne experiments. Alp et al. (2019) computed the hard X-ray and gamma-ray emission based on 3D neutrino-driven explosion simulations of Wongwathanarat et al. (2013, 2015, 2017) and compared the emergent emission with the corresponding spectra, continuum light curves, and line fluxes of SN 1987A. Jerkstrand et al. (2020) reproduced the gamma-ray decay lines and the UVOIR bolometric light curve of SN 1987A up to 600 days by calculating the total gamma-ray deposition for these 3D simulations and found that an ejecta mass around 14 is favored for an explosion energy of erg.
In our previous papers we studied SN 1987A in the framework of the neutrino-driven explosion mechanism (Utrobin et al., 2015, 2019) using available pre-SN models obtained in the scenario of single-star evolution (Shigeyama & Nomoto, 1990; Woosley et al., 1988, 1997; Sukhbold et al., 2016; Utrobin et al., 2019). The corresponding 3D explosion simulations with an approximate, parameterized neutrino engine, when it is tuned to yield the explosion energy observed in SN 1987A, and subsequent hydrodynamic light-curve modeling can explain only some basic observational data. None of the computed models fits all observational constraints, namely, the total 56Ni mass ejected during the explosion, the amounts of outward 56Ni mixing and inward hydrogen mixing, the mass of hydrogen mixed to velocities lower than 2000 km s-1, and the oxygen mass in the SN ejecta. It is noteworthy that only one model yields a maximum velocity of the bulk of 56Ni consistent with spectral observations of SN 1987A, and only this model is able to reproduce the dome of the light curve in reasonable agreement with the observed light curve. However, the corresponding progenitor model cannot fulfill the observational requirements of the location of the BSG Sanduleak star in the Hertzsprung-Russell diagram (HRD).
This failure in satisfying all basic observational constraints by an adequate progenitor model in the single-star evolution scenario and progress in explaining the formation of the mysterious triple-ring system in the binary-merger evolution scenario (Podsiadlowski et al., 2007; Morris & Podsiadlowski, 2009) motivated us to analyze binary-merger progenitor models in the framework of the neutrino-driven explosion mechanism as the next step in our study of SN 1987A. Menon & Heger (2017) presented the results of a systematic study of binary-merger models for the progenitor of SN 1987A, which were evolved until the pre-SN stage. The majority of these models are compact and hot BSG stars, of which six are located in the region of the observed properties of Sanduleak in the HRD. Moreover, these evolutionary models reproduce the observed enrichment of helium and nitrogen in the triple-ring nebula, which is characterized by number ratios of (France et al., 2011), and (Lundqvist & Fransson, 1996). An additional impulse to address the binary-merger progenitors comes from Menon et al. (2019), who computed bolometric light curves using these binary-merger progenitors after exploding them by a piston model in spherical symmetry and applying artificial “boxcar” mixing of chemical species. They obtained a much better agreement of the dome of the light curves with the observations of SN 1987A than that reported by Utrobin et al. (2019) for the hydrodynamic models based on the single-star progenitor models.
Our present study of 3D explosion simulations of SN 1987A in the framework of neutrino-driven explosions based on binary-merger progenitors provides an opportunity to compare them with those based on the single-star progenitor models in Utrobin et al. (2019). Ono et al. (2020) have recently performed 3D hydrodynamic simulations of mixing in SN 1987A triggering the explosion by injecting energy near the Fe/Si composition interface with parameterized aspherical perturbations of the SN shock to mimic the effect of non-radial instabilities. To reproduce the observed morphology of the ejecta, Ono et al. (2020) investigated two BSG progenitors: one model being the result of a single-star evolution and another model based on a slow merger scenario developed by Urushibata et al. (2018).
Our paper is structured as follows. In Section 2.1 we briefly describe the binary-merger progenitor models and in Section 2.2 we summarize our numerical approach to the 3D simulations of the neutrino-driven explosion and to the hydrodynamic light-curve modeling. Section 3 presents and analyzes the results obtained with the binary-merger pre-SN models and compares them with SN 1987A observations. Section 4 formulates possible requirements for the SN 1987A progenitor that are imposed by the hydrodynamic light-curve modeling. In Section 5 we confront the hydrodynamic models based on the single-star and binary-merger pre-SN models with a set of the available observational constraints of SN 1987A. Finally, in Section 6 we summarize our results.
| Model | He/Hsurf | N/Csurf | N/Osurf | ||||||||||||
|---|---|---|---|---|---|---|---|---|---|---|---|---|---|---|---|
| M15-7b | 15 | 7 | 17.5 | 2.48 | 2.90 | 0.42 | 21.06 | 0.117 | 37.0 | 0.6498 | 0.3447 | 0.5542 | 0.134 | 7.11 | 1.30 |
| M15-8b | 15 | 8 | 17.5 | 2.50 | 2.95 | 0.46 | 22.05 | 0.143 | 31.8 | 0.6529 | 0.3416 | 0.5542 | 0.132 | 6.34 | 1.26 |
| M16-4a | 16 | 4 | 3.3 | 3.02 | 4.10 | 1.08 | 19.00 | 0.275 | 34.9 | 0.6458 | 0.3487 | 0.5536 | 0.136 | 7.87 | 1.40 |
| M16-7b | 16 | 7 | 16.6 | 2.81 | 3.41 | 0.60 | 21.98 | 0.182 | 37.3 | 0.6398 | 0.3547 | 0.5536 | 0.140 | 7.55 | 1.38 |
| M17-7a | 17 | 7 | 15.6 | 3.29 | 4.25 | 0.96 | 22.82 | 0.182 | 34.5 | 0.6540 | 0.3404 | 0.5538 | 0.131 | 6.44 | 1.31 |
| M17-8a | 17 | 8 | 15.6 | 3.29 | 4.23 | 0.94 | 23.81 | 0.221 | 33.4 | 0.6574 | 0.3371 | 0.5539 | 0.129 | 6.07 | 1.27 |
Note. — The columns give the name of the pre-SN model; the primary mass, ; the secondary mass, ; the fraction of the He core of the primary that was dredged up, ; the CO-core mass, ; the He-core mass, ; the He-shell mass, ; the pre-SN mass, ; the width of the He shell, ; the pre-SN radius, ; the mass fractions of hydrogen, , helium, , heavy elements, , the number ratios of helium to hydrogen, He/Hsurf, nitrogen to carbon, N/Csurf, and nitrogen to oxygen, N/Osurf, in the hydrogen-rich envelope at the stage of core collapse.
2 Model overview and numerical approach
We consider six pre-SN models obtained in the scenario of binary-merger evolution and use these models as the initial data in our 3D simulations. As in our previous papers, we follow the numerical approach presented in Utrobin et al. (2015). It consists of the three steps: the 3D neutrino-driven explosion simulation until about one day after core collapse, the subsequent mapping of the 3D explosion model to 1D geometry, and the radiation-hydrodynamic modeling of the light curve. We briefly review each step in the corresponding subsection.
2.1 Presupernova models
Menon & Heger (2017) carried out a stellar evolution study of binary-merger models for the progenitor of SN 1987A, based on the scenario proposed by Podsiadlowski et al. (1992, 2007). In this scenario a main-sequence secondary star merges with a primary RSG at the end of core helium burning when helium is depleted down to a mass fraction of in the CO rich convective core,222We define the helium-core mass as the mass enclosed by the shell where the mass fraction of hydrogen drops below a value of when moving inward from the surface of a star. The CO-core mass is determined in the same way, but the mass fraction of helium having a value of . surrounded by a helium layer and an extended, expanding hydrogen envelope driving the merger. During the resulting common envelope phase a fraction of the hydrogen-rich secondary mass penetrates the helium core of the primary, whereby an equivalent mass fraction, , of the He core is dredged up and mixed uniformly in the envelope. Menon & Heger explored an extended parameter space: primary masses of 15 , 16 , and 17 ; secondary masses of 2 , 3 ,…, 8 ; and different depths up to which the secondary star penetrates into the He core of the primary star during the common-envelope phase. After the common-envelope phase, the merged star is evolved until just before iron-core collapse. Six of the 84 pre-SN models match the color-luminosity properties of the BSG Sanduleak star.
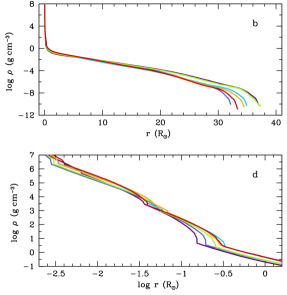
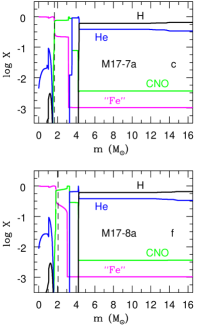
We have investigated these pre-SN models M15-7b, M15-8b, M16-4a, M16-7b, M17-7a, and M17-8a, whose basic properties are listed in Table 1, and whose structure and chemical composition are illustrated by Figures 1 and 2. These binary-merger models having primary stars of 15 to 17 (), secondaries from 4 to 8 (), and a fraction of the He core of the primary that was dredged up of to evolve to compact blue pre-SN models with masses from 19.00 to 23.81 () and radii of 31.8 to 37.3 ().
Because some fraction of the He-shell mass of the helium core333Note that Menon & Heger (2017) restrict mixing to be inside the helium shell in their models, quantified by the parameter in their work. of the primary star is dredged up during the merger, all resultant pre-SN models have helium-core masses () lower than those of the initial primary stars, while their CO-core masses () remain practically unchanged. As a result, these pre-SN models have much higher mass ratios of the CO core to the helium core in the range of 0.737–0.855 (Table 1) compared to the progenitor models that are evolved in the single-star scenario to a BSG configuration with this mass ratio being in the range of 0.392–0.414 (Utrobin et al., 2019).
The helium-core masses of 2.90 to 4.25 (Table 1) are much less than the 6 suggested for Sanduleak as a single star (Saio et al., 1988; Woosley et al., 1988). This should favor stronger outward mixing of radioactive 56Ni into the hydrogen-rich envelope as observed in SN 1987A, because 3D neutrino-driven explosion simulations with BSG models obtained in the scenario of single-star evolution exhibit 56Ni mixing whose strength scales very roughly inversely with the helium-core mass (Utrobin et al., 2019). In turn, the unchanged CO-core masses of 2.48 to 3.29 inherited from moderately massive primary stars (Table 1) should allow for a better match of the oxygen mass observed in the SN 1987A ejecta.
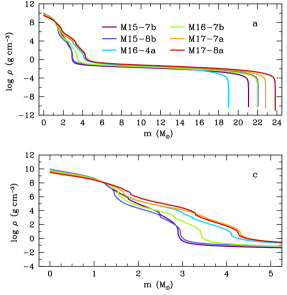
The pre-SN models have different helium core masses in a relatively narrow range of 2.90 to 4.25 (Table 1, Figures 1(a) and (c)), and high ratios of the CO-core mass to the helium-core mass in the range of 0.737–0.855 (Table 1). These facts imply that the structure of the helium core in these models should be quite different from that in the single-star progenitor models. Indeed, the difference becomes evident from an inspection of Figure 1(d), Figure 1(d) in Utrobin et al. (2015), and Figure 1(d) in Utrobin et al. (2019), and we extend our previous work on analyzing the sensitivity of the amount of outward 56Ni mixing and inward hydrogen mixing to the structure of the helium core and the He/H composition interface.
| Model | |||||||||||||||
|---|---|---|---|---|---|---|---|---|---|---|---|---|---|---|---|
| (B) | (km s-1) | ( s) | |||||||||||||
| M15-7b-1 | 1.57 | 19.48 | 1.404 | 3.86 | 14.23 | 7.37 | 7.34 | 3018 | 3185 | 29 | 0.48 | 3.21 | 0.83 | 86.39 | 5.32 |
| M15-7b-2 | 1.55 | 19.49 | 1.428 | 4.91 | 14.96 | 7.34 | 7.31 | 3406 | 3607 | 28 | 0.48 | 3.07 | 0.84 | 86.40 | 5.34 |
| M15-7b-3 | 1.58 | 19.46 | 1.432 | 4.79 | 14.64 | 7.31 | 7.28 | 2980 | 3193 | 29 | 0.49 | 3.10 | 0.83 | 86.39 | 5.20 |
| M15-7b-4 | 1.49 | 19.56 | 1.780 | 4.88 | 17.08 | 7.33 | 7.31 | 3344 | 3553 | 28 | 0.50 | 2.20 | 0.86 | 86.40 | 4.74 |
| M15-8b-1 | 1.32 | 20.73 | 1.567 | 2.67 | 12.07 | 7.42 | 7.40 | 1829 | 1949 | 27 | 0.52 | 3.14 | 0.96 | 86.41 | 4.54 |
| M15-8b-2 | 1.38 | 20.66 | 1.116 | 2.32 | 8.63 | 7.37 | 7.32 | 1439 | 1535 | 27 | 0.44 | 5.50 | 0.96 | 86.40 | 5.29 |
| M16-4a-1 | 1.66 | 17.34 | 1.562 | 4.84 | 14.99 | 7.50 | 7.41 | 2436 | 2732 | 29 | 0.55 | 2.13 | 0.97 | 86.41 | 4.26 |
| M16-4a-2 | 1.87 | 17.13 | 1.068 | 3.79 | 10.25 | 7.74 | 7.28 | 2237 | 2445 | 32 | 0.43 | 3.55 | 0.88 | 86.39 | 5.02 |
| M16-7b-1 | 1.53 | 20.44 | 1.168 | 2.83 | 10.00 | 7.35 | 7.26 | 1639 | 1759 | 29 | 0.51 | 5.01 | 1.13 | 86.41 | 5.87 |
| M16-7b-2 | 1.46 | 20.51 | 1.412 | 2.97 | 11.47 | 7.39 | 7.34 | 1714 | 1838 | 28 | 0.56 | 3.80 | 1.16 | 86.40 | 5.35 |
| M17-7a-1 | 1.68 | 21.13 | 1.516 | 4.28 | 13.91 | 7.48 | 7.36 | 1807 | 1910 | 30 | 0.59 | 3.75 | 1.28 | 86.42 | 4.65 |
| M17-7a-2 | 1.67 | 21.14 | 1.559 | 4.60 | 14.10 | 7.52 | 7.41 | 1713 | 1888 | 29 | 0.56 | 3.60 | 1.29 | 86.41 | 4.55 |
| M17-8a-3 | 2.22 | 21.58 | 1.075 | 7.68 | 11.67 | 7.69 | 7.22 | 2461 | 2653 | 32 | 0.51 | 6.41 | 0.90 | 86.39 | 5.27 |
| M17-8a-4 | 2.06 | 21.75 | 1.216 | 6.52 | 12.67 | 7.51 | 7.25 | 2411 | 2520 | 32 | 0.53 | 5.62 | 1.02 | 86.41 | 5.02 |
Note. — The 3D explosion models are based on the corresponding pre-SN models of Table 1. is the baryonic mass of the neutron star at the end of the 3D simulations; the ejecta mass; the explosion energy; the mass of radioactive 56Ni produced directly by our -chain reaction network; the aggregate mass of directly produced 56Ni and tracer nucleus; the initial 56Ni mass at the onset of the light curve modeling; the 56Ni mass ejected at day 150; the maximum velocity of the bulk mass of 56Ni; the mean velocity of the fast moving 56Ni tail; the minimum velocity of hydrogen mixed into the He shell, specified at the level where the mass fraction of hydrogen drops to a value of ; the mass of hydrogen mixed into the He shell; the mass of hydrogen confined to the inner layers ejected with velocities less than 2000 km s-1; and the total mass of oxygen in the ejecta. is the time at which the 3D simulations are mapped to a spherically symmetric grid. is the epoch of shock breakout in the 1D simulations.
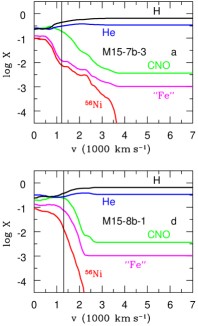
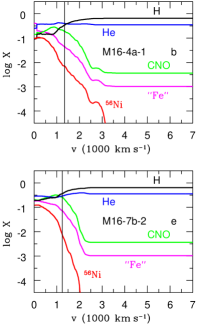
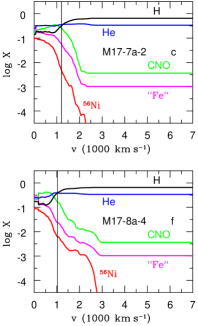
The initial, on the main sequence, chemical composition of the primary and secondary stars was taken to be representative of the subsolar metallicity of the LMC. To produce such a metallicity, the present-day solar chemical composition with the mass fractions of hydrogen , helium , and metals (Asplund et al., 2009) was scaled by reducing the total abundance of heavy elements by about a factor of 2.5 compared to solar. The chemical composition of the LMC becomes , , and . During the binary-merger evolution, the chemical composition at the surface of the primary is enriched with helium and the ashes of CNO-burning dredged up from the core to the envelope, yielding high number ratios of helium to hydrogen (0.129–0.140), nitrogen to carbon (6.07–7.87), and nitrogen to oxygen (1.26–1.40) (Table 1), which are comparable with the observational data (France et al., 2011; Lundqvist & Fransson, 1996). The resultant chemical compositions of the pre-SN models M15-7b, M16-4a, M17-7a, M15-8b, M16-7b, and M17-8a are shown in Figure 2.
2.2 Numerical methods
For completeness, we briefly summarize the numerical methods used in our work in the following, basically repeating the information that we already provided in our previous paper on SN 1987A (Utrobin et al., 2019), because our methodical approach here is identical with the one applied there.
Our 3D neutrino-driven explosion simulations begin shortly after the stellar core has collapsed and a newly formed SN shock wave has propagated to a mass coordinate of approximately 1.25 inside the iron core. The evolution during core collapse and core bounce until about 10 ms after bounce is computed in spherical symmetry (because non-radial hydrodynamic instabilities are not expected to grow until this time). These 1D post-bounce data are then mapped onto a 3D grid. The subsequent 3D calculations are carried out with the time-explicit finite-volume Eulerian multifluid hydrodynamics code Prometheus (Fryxell et al., 1991; Müller et al., 1991a, b). Details of the physics modules implemented into the Prometheus code and our numerical setup have been described in Wongwathanarat et al. (2013) for neutrino-driven explosion simulations and in Wongwathanarat et al. (2015) for simulations of the late-time evolution from approximately 1.3 s after core bounce onward. Nevertheless, we briefly summarize the input physics and numerical methods employed by the Prometheus code as follows.
The Prometheus code uses a dimensionally split version of the piecewise parabolic method (Colella & Woodward, 1984) to solve the multidimensional hydrodynamic equations. A fast and efficient Riemann solver for real gases (Colella & Glaz, 1985) is used to compute numerical fluxes at cell boundaries. Inside grid cells, where a strong shock wave is present, we recompute the inter-cell fluxes using an approximate Riemann solver (Liou, 1996) to prevent numerical artifacts known as the odd-even decoupling (Quirk, 1994). The Yin-Yang overlapping grid (Kageyama & Sato, 2004), implemented into Prometheus as in Wongwathanarat et al. (2010), is employed for efficient spatial discretization of the computational domain. Newtonian self-gravity is taken into account by solving Poisson’s equation in its integral form, using an expansion into spherical harmonics (Müller & Steinmetz, 1995). In addition, a general relativistic correction of the monopole term of the gravitational potential is applied during the explosion simulations following Scheck et al. (2006) and Arcones et al. (2007).
To model the explosive nucleosynthesis approximately, a small -chain reaction network, similar to the network described in Kifonidis et al. (2003), is solved. In order to unambiguously determine the inward mixing of hydrogen, free protons, which are produced when neutrino-heated matter freezes out from nuclear statistical equilibrium, are distinguished from hydrogen originating from the hydrogen-rich stellar envelope by tagging them as different species in our multicomponent treatment of the stellar plasma.
The revival of the stalled SN shock and the explosion are triggered by imposing a suitable value of the neutrino luminosities at an inner radial grid boundary located at an enclosed mass of 1.1 , well inside the neutrinosphere. Outside this boundary, which shrinks with time to mimic the contraction of the proto-neutron star, we model neutrino-matter interactions by solving the neutrino radiation transport equation in a “ray-by-ray” manner and in the gray approximation as described in Scheck et al. (2006). The explosion energy of the model is determined by the imposed isotropic neutrino luminosity, whose temporal evolution we prescribe as well, and by the accretion luminosity that results from the progenitor-dependent mass accretion rate and the gravitational potential of the contracting neutron star.
Our 3D calculations are terminated at approximately one day after the onset of the explosion, i.e. long after the SN shock has swept through the entire progenitor star and has broken out from the stellar surface (about 1–2 hours after core bounce; see Table 2). We use a two-step procedure of mapping at two different mapping epochs: an early-time mapping epoch well prior to the phase of shock breakout and a late-time mapping epoch when the 3D explosion simulations are terminated. The early-time mapping moment is chosen to adequately treat the shock breakout, because this breakout is a complex process including the effects of both hydrodynamics and radiative transfer and has to be modeled with a radiation hydrodynamics code. To this end, we compute angle-averaged profiles of hydrodynamic quantities and chemical abundances of the 3D flow and interpolate these profiles onto the Lagrangian (mass) grid used in the 1D simulations. The resulting data are the initial conditions for the hydrodynamic modeling of the SN outburst. The further time evolution of the SN outburst is modeled in one dimension. At the early-time mapping epoch the hydrodynamic flow is far from homologous expansion. This implies that outward mixing of radioactive 56Ni and inward mixing of hydrogen-rich matter in the ejecta will continue until complete homology is reached. To capture this mixing, we map angle-averaged profiles of chemical abundances of the 3D flow onto the Lagrangian grid at the terminal time of the 3D simulations, when the ejecta expand almost homologously.
After mapping the 3D simulations data to a 1D grid, the evolution of the SN outburst is modeled with the time-implicit Lagrangian radiation hydrodynamics code Crab (Utrobin, 2004, 2007). It integrates the set of spherically symmetric hydrodynamic equations including self-gravity and a radiation transfer equation in the gray approximation (e.g., Mihalas & Mihalas, 1984). The whole SN ejecta can be divided into two regions: the inner optically thick core and the outer semitransparent and optically thin layers. In the inner opaque core, the radiation transport is reduced to the diffusion of equilibrium radiation in the approximation of radiative heat conduction, and the assumption of LTE is valid. In the semitransparent and transparent layers, the time-dependent radiative transfer equation, written in a comoving frame of reference to an accuracy of order ( is the fluid velocity, and is the speed of light), is solved as a system of equations for the zeroth and first angular moments of the nonequilibrium radiation intensity. To close this system of two moment equations, a variable Eddington factor is directly calculated with the scattering terms included explicitly in the source function. The total set of equations is discretized spatially using the method of lines (e.g., Hairer et al., 1993; Hairer & Wanner, 1996). The resultant system of ordinary differential equations is integrated by the implicit method of Gear (1971) with an automatic choice of both the time integration step and the order of accuracy of the method.
The energy deposition of gamma-rays from the decay chain 56Ni Co Fe is determined by solving the gamma-ray transport, while the corresponding positrons are assumed to deposit their kinetic energy locally. The ionization balance for an ideal gas in a nonequilibrium radiation field and under the influence of non-thermal processes provides the level populations to calculate the equation of state, the mean opacities, and the thermal emission coefficient. It includes the elements H, He, C, N, O, Ne, Na, Mg, Si, S, Ar, Ca, Fe, and the negative hydrogen ion H-. In addition, in expanding SN ejecta with a velocity gradient, the contribution of spectral lines to the opacity is evaluated by the generalized formula of Castor et al. (1975). We refer to Utrobin et al. (2015) and references therein for more details of the numerical setup.
3 Results
We carried out fourteen 3D neutrino-driven explosion simulations with the six binary-merger pre-SN models M15-7b, M15-8b, M16-4a, M16-7b, M17-7a, and M17-8a (Table 1) as initial data. Table 2 lists basic properties of these 3D hydrodynamic models that were extracted at the end of the simulations. We define the explosion energy, , as the sum of the total (i.e., internal plus kinetic plus gravitational) energy of all grid cells at the early-time mapping epoch. Throughout this paper, we employ the energy unit erg. To characterize mixing of radioactive 56Ni in radial velocity space, we divide the 56Ni-rich ejecta into two components: a slow-moving bulk of 56Ni containing of the total 56Ni mass (except for places in which it is specially defined), and a fast-moving 56Ni tail containing the remaining . This division is motivated by the observational evidence for a fast 56Ni clump of 10 in SN 1987A (Utrobin et al., 1995).
3.1 Production of 56Ni in neutrino-driven simulations
Along with the explosion energy, the total amount of radioactive 56Ni plays a crucial role in powering the dome-like maximum of the observed light curve of SN 1987A. To study the production of 56Ni during our 3D SN simulations, we solved a small -chain reaction network from helium through 56Ni and are therefore unable to determine the mass fraction of 56Ni in neutron-rich matter very accurately. The so-called “tracer” nucleus collects iron-group and trans-iron species that are formed in neutron-rich () ejecta (Kifonidis et al., 2003; Wongwathanarat et al., 2013). A possible overall production of radioactive 56Ni falls in between the minimum and maximum values: the mass of 56Ni produced directly by our -chain reaction network, , and the aggregate mass of directly produced 56Ni plus tracer nucleus, . 3D neutrino-driven explosion simulations of SN 1987A based on the single-star pre-SNe showed that the 56Ni production is proportional to the explosion energy with the correlation being valid for both the minimum and maximum values (Utrobin et al., 2015, 2019). It should be noted that in those simulations the values of the explosion energy are clearly different to guarantee this correlation. In turn, all of the 3D neutrino-driven explosion simulations based on the binary-merger pre-SNe confirm the results of Utrobin et al. (2015, 2019) for the single-star pre-SNe except for two pairs of hydrodynamic models (M15-7b-2, M15-7b-3) and (M17-8a-3, M17-8a-4) (Table 2). These exceptions are worth to be discussed in the context of uncertainties of the production of 56Ni (see Ertl et al., 2020, for details) and properties of the explosion mechanism itself.
Models M15-7b-2 and M15-7b-3 which explode with nearly the same energies of 1.428 B and 1.432 B, respectively, produce nearly the same mass of radioactive 56Ni plus neutron-rich tracer nucleus, but slightly violate the above 56Ni production–explosion energy correlation for both the minimum and maximum amounts of 56Ni (Table 2). This small difference in the 56Ni production between models M15-7b-2 and M15-7b-3 can arise from a number of reasons. First, Ertl et al. (2020) argued that the mass of nucleosynthesis products that scales with the explosion energy should include all other elements that are present in neutrino-heated ejecta (like -particles, free neutrons, and protons) in addition to radioactive 56Ni and the tracer nucleus. In other words, we have to consider at least the maximum amount of 56Ni as a measure of the explosion energy rather than the minimum amount, but depending on the entropy of the ejecta significant amounts of alpha particles and free nucleons may also be ejected. Second, such a small scattering in the 56Ni production can result from a simple stochasticity of 3D hydrodynamic instabilities and turbulence. Third, it seems that model M15-7b-3 makes more fallback and therefore some of the initially expelled material in the neutrino-heated ejecta falls back, more than in model M15-7b-2, because the mass of the neutron star in model M15-7b-3 is larger than in model M15-7b-2. Note that in model M15-7b-3 the maximum velocity of the bulk mass of 56Ni of 2980 km s-1 is lower than the value of 3406 km s-1 in model M15-7b-2, favoring more fallback of iron-group material in model M15-7b-3. So, we may state that the violation of the 56Ni production–explosion energy correlation in the case of models M15-7b-2 and M15-7b-3 is a subtle effect that depends on small differences in details of the explosion dynamics.
Models M17-8a-3 and M17-8a-4, in turn, show perfect scaling of the mass of directly produced 56Ni plus tracer nucleus, , with the explosion energy (Table 2), which is in agreement with the 56Ni production–explosion energy correlation. Another fact consistent with this correlation is the mass of the neutron star in model M17-8a-4, which is lower than in model M17-8a-3 because more neutrino-heated matter is ejected and contributes to the mass of directly produced 56Ni plus tracer nucleus instead of being added to the neutron star. The inverse correlation of the explosion energy with the mass of directly produced 56Ni, is explained by the fact that model M17-8a-4 produces more tracer matter than model M17-8a-3 at the expense of the directly produced 56Ni.
3.2 Mixing in 3D explosion simulations
The development of neutrino-driven explosions after core bounce and the general picture of concomitant turbulent mixing in 3D simulations are described and studied in detail by Wongwathanarat et al. (2015). Here we only recall that after the SN shock wave is launched by the delayed neutrino-driven mechanism, supported by convective overturn and large-scale aspherical shock oscillations caused by the standing accretion shock instability (SASI), the further evolution of the explosion depends strongly on the density profile of the progenitor. The shock decelerates when it encounters a density profile that falls off less steeply than , and it accelerates for density profiles that are steeper (Sedov, 1959). At the locations of the Si/O, (C+O)/He, and He/H composition interfaces (Figure 2), the value of varies nonmonotonically with radius such that the shock velocity increases when the shock approaches a composition interface and decreases after the shock has crossed the interface. A deceleration of the shock causes a density inversion in the post-shock flow, which means that a dense shell forms. Such shells at the locations of the composition interfaces are subject to Rayleigh-Taylor (RT) instabilities because they are characterized by density and pressure gradients of opposite signs (Chevalier, 1976).
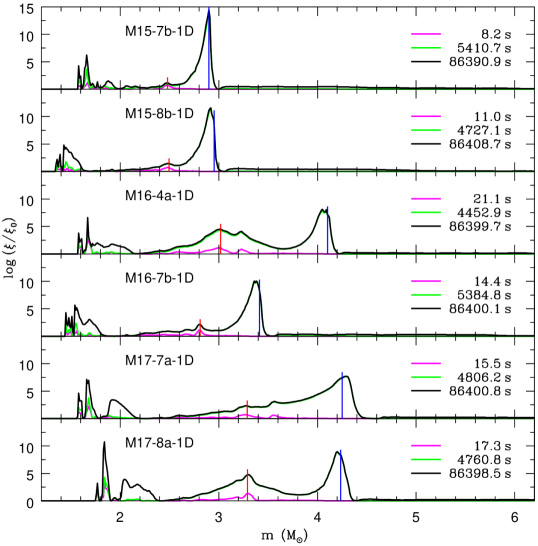
To compare the relative strength of the growth of RT instabilities in different progenitor models, we performed an additional set of 1D neutrino-driven explosion simulations for all progenitor stars given in Table 1, using the same modeling approach as in our 3D simulations. The 1D models in this set develop approximately the same explosion energy of 1.4 B. To qualitatively analyze the RT instabilities found in our 3D simulations, we computed linear RT growth rates as a function of enclosed mass for the 1D models and integrated these rates over a period of time much longer than the time until shock breakout (roughly for a period of one day; see Figure 3). However, because RT instabilities will quickly enter the nonlinear regime in 3D simulations, the results of linear perturbation theory can only provide qualitative information on the relative strength of the expected growth of RT instabilities in different layers of the progenitor star. Nevertheless, the results turned out to be useful for a qualitative understanding of differences in the efficiency of mixing of 56Ni in different single-star progenitors Utrobin et al. (2019), and were useful when analyzing the results of 3D simulations.
Here we focus on the time evolution of the time-integrated RT growth factor at the He/H composition interface (Figure 4) where its value reaches a maximum in our binary-merger progenitors (Figure 3). As Utrobin et al. (2019) we consider a simple phenomenological approach to capture multidimensional effects of RT mixing at a composition interface and to describe the evolution of the nickel velocity:
| (1) |
where is the maximum velocity of the bulk mass of radioactive 56Ni, is an empirical buoyancy coefficient, is the linear RT growth rate
| (2) |
and is the initial value of the radial velocity of 56Ni. The solution of Equation 1 is given by
| (3) |
where
| (4) |
is the time-integrated RT growth factor at time , and is the amplitude of the initial perturbation at a given Lagrangian mass coordinate. Thus, the velocity growth factor at time is proportional to the logarithm of the time-integrated RT growth factor at that time. According to Figure 4, the growth factor increases at the He/H composition interface from a value of unity shortly after the SN shock crosses this interface to its maximum (i.e., final) value at the time of shock breakout. During this time interval the growth factor approximately exhibits a power law dependence
| (5) |
as indicated by the linear slope of the green lines in Figure 4, and where is a constant and is the value of the slope. This approximation implies a simple inverse time dependence of the linear RT growth rate
| (6) |
and hence the occurrence of a local maximum of at a time between shortly after the SN shock crosses the He/H interface and the onset of power law growth.
Before we proceed further, let us recall the origin of the binary-merger progenitors for SN 1987A. The main element of the merger model of Menon & Heger (2017) is merging of a main-sequence secondary star with a RSG primary star in the common-envelope phase when the secondary eventually penetrates the helium core of the primary. The helium core of the resulting merged star inherits the basic property of the RSG primary star evolved as a single star: its density profile is characterized by a low time-integrated RT growth factor near the (C+O)/He composition interface and a very large one at the He/H interface, since the density gradient at the He/H interface is much steeper than at the (C+O)/He interface (Figures 1 and 3). In contrast, the single-star BSG progenitors for SN 1987A demonstrate opposite behavior: a large time-integrated RT growth factor near the (C+O)/He composition interface and a low one at the He/H interface (Utrobin et al., 2019).444The only exception to this is model N20, which originates from a RSG progenitor rather than a BSG star with respect to the structure of the helium core (Nomoto & Hashimoto, 1988; Saio et al., 1988).
This fundamental difference between BSG and RSG progenitors concerning the RT growth factors at the (C+O)/He and He/H interfaces was previously pointed out by Wongwathanarat et al. (2015), and the general properties of radial mixing in the ejecta induced by the 3D neutrino-driven explosions were studied. It was shown that the extent of radial mixing, i.e., the minimum velocity of hydrogen-rich matter and the maximum velocity of 56Ni, depends not only on the initial asphericity and explosion energy, but also on the density profiles and widths of the C+O core and the helium shell, and on the density gradient at the He/H composition interface. A dominant growth rate at the He/H interface in the RSG explosions compared to the BSG cases gives rise to a more strongly RT-unstable layer after the passage of the SN shock, which then develops into more extended inward mixing of hydrogen into the helium core than in the BSG explosions. On the other hand, a dominant growth rate at the (C+O)/He interface in the BSG explosions compared to the RSG ones results in a relatively strong outward mixing of 56Ni in velocity space, which turns out to be comparable to that in the RSG ejecta, where the extended fast 56Ni-rich fingers have more time to grow, because the reverse shock at the He/H interface develops at a much larger radius and thus much later than in the BSG progenitors.
The above findings concerning the inward mixing of hydrogen and the outward mixing of radioactive 56Ni are confirmed by the 3D neutrino-driven explosion simulations based on the single-star progenitors for SN 1987A (BSG pre-SN models except for model N20 in Utrobin et al., 2019) and the binary-merger progenitors (pre-SN models with the RSG-like helium cores, see Figures 1 and 3). Explosions of the single-star BSG progenitors with SN 1987A-like energies show that hydrogen-rich matter mixed into the helium core expands with velocities from 270 km s-1 to 1850 km s-1, and its mass does not exceed 0.15 (Utrobin et al., 2019). In turn, all hydrodynamic models based on the binary-merger progenitors demonstrate that hydrogen is mixed more deeply into the helium core down to velocities lower than 40 km s-1, and its mass constitutes about 0.5 (Table 2). As to the outward mixing of 56Ni, our favorite hydrodynamic models B15-2, based on the single-star progenitor (Utrobin et al., 2019), and M15-7b-3, based on the binary-merger progenitor (Table 2), have nearly the same maximum velocities of the bulk of 56Ni consistent with the observed value of about 3000 km s-1.
3.3 3D morphology of explosion models
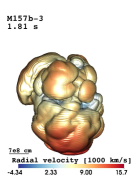
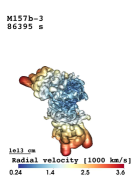
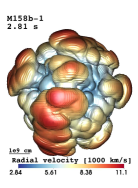
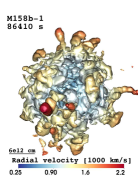
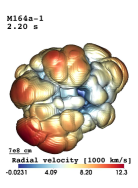
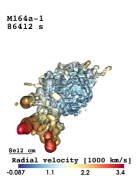
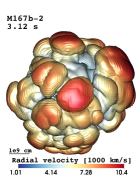
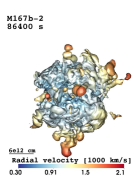
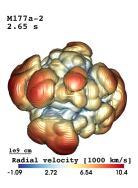
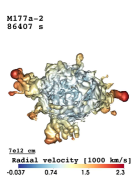
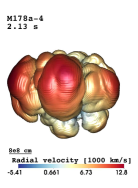
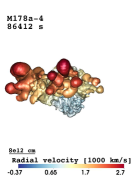
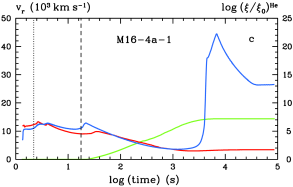
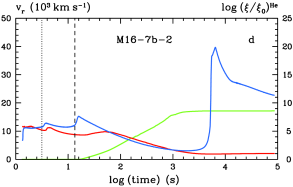
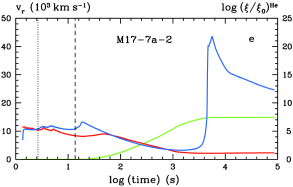
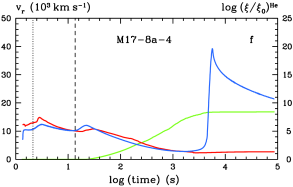
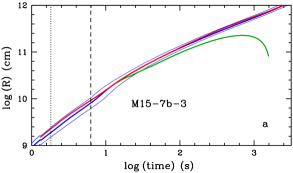
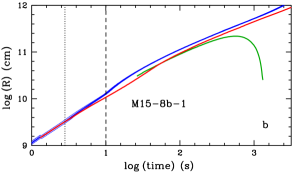
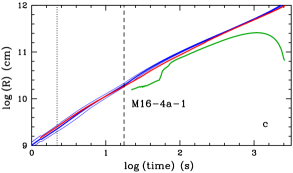
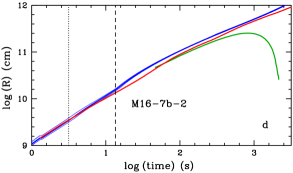
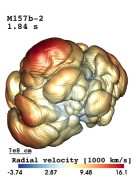
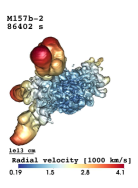
Let us first consider the reference 3D explosion models M15-7b-3, M15-8b-1, M16-4a-1, M16-7b-2, M17-7a-2, and M17-8a-4, which explode with comparable energies (Table 2). The SN shock wave first crosses the Si/O interface and then reaches the (C+O)/He interface, at which time the maximum speed of the bulk mass of the 56Ni-rich matter, , spreads over a rather wide range from 9210 km s-1 to 14 380 km s-1 (Table 3; first and third columns in Figure 5), depending on the progenitor. At this stage the nickel-rich ejecta consist of plume-like or bubble-like structures, some of which move outward with relatively high velocities compared to others. Note that during this phase the maximum radial velocities of these structures are larger than the average velocity of the SN shock in models M15-7b-3, M16-4a-1, and M17-8a-4, and, in contrast, are lower in models M15-8b-1, M16-7b-2, and M17-7a-2 (Figure 4). Figure 4 also shows that in the first three models the average shock velocity and the maximum radial velocity on the surface where the mass fraction of 56Ni plus neutron-rich tracer nucleus equals are most similar (even equal in models M15-7b-3 and M17-8a-4) at the time when the shock crosses the He/H interface. After the SN shock has passed the He/H interface, a reverse shock forms below the He/H interface. In models M15-7b-3, M16-4a-1, and M17-8a-4 a few fastest RT plumes expanding with increasing speed begin to decelerate shortly after the forward shock has entered the helium shell. They remain close to the forward shock, and, consequently, avoid strong deceleration by the reverse shock, because they propagate ahead of the location where the reverse shock forms (Figure 6). As a result, the fastest 56Ni-rich clumps move with velocities of about 2780 km s-1, 3140 km s-1, and 3630 km s-1 at late times in models M17-8a-4, M16-4a-1, and M15-7b-3, respectively (Figure 5, second and fourth columns; Figure 7). In contrast, in models M16-7b-2, M15-8b-1, and M17-7a-2 the 56Ni-rich plumes collide with the reverse shock, move well behind the forward shock (Figure 6), and are compressed in the dense shell that piles up between the forward and reverse shocks. Thus they exhibit a considerably more isotropic overal shape with a much lower velocity contrast between the fastest and slowest structures (Figure 5, second and fourth columns). In models M16-7b-2, M15-8b-1, and M17-7a-2 the peak velocities are only about 2030 km s-1, 2200 km s-1, and 2280 km s-1, respectively (Figure 7).
A striking difference in the final morphology of the 56Ni-rich ejecta results in our reference 3D explosion models (Figure 5, second and fourth columns) from the different structures of the binary-merger progenitors (Figure 1), and their influence on the unsteady SN shock propagation and the development of RT instabilities at the (C+O)/He and He/H composition interfaces (Figure 3). The final morphology of models M15-8b-1, M16-7b-2, and M17-7a-2 (the first group) exhibits a small asphericity in contrast to models M15-7b-3, M16-4a-1, and M17-8a-4 (the second group) which are largely aspherical. This difference may be interpreted as a consequence of the different strength of the interaction between the 56Ni-rich ejecta and the reverse shock at the He/H composition interface. In reality, the extent of 56Ni mixing, measured by the dimensionless ratio of the maximum velocity of the bulk mass of 56Ni ejecta to the mean velocity of the bulk mass of 56Ni (averaged with the 56Ni mass fraction as weight function) increases from the first to the second group of models (Figure 7, Table 3). In other words, the degree of asymmetry in the final morphology of the 56Ni-rich ejecta correlates with the extent of 56Ni mixing in velocity space.


3.4 Variations of explosion energy and stochasticity
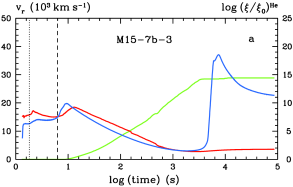
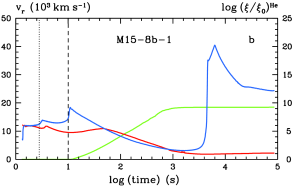
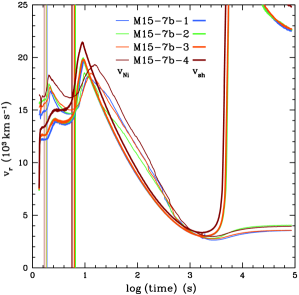
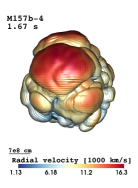
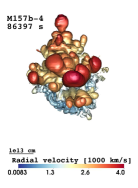
3D neutrino-driven explosion simulations of SN 1987A based on the single-star pre-SNe showed that the extent of 56Ni mixing, measured by the maximum radial velocity of the bulk mass of the 56Ni-rich ejecta, is proportional to the explosion energy (Utrobin et al., 2015, 2019). Such a correlation is also observed for 3D neutrino-driven explosion simulations based on the binary-merger pre-SNe with some exceptions (Table 2). The most prominent exception is demonstrated by models M15-7b-1, M15-7b-2, M15-7b-3, and M15-7b-4 which are based on the same progenitor model M15-7b and explode with a monotonically growing energy (Table 2). This sequence of models provides an opportunity to explore the dependence of their mixing properties not only on the explosion energy itself, but also in models exploding with sufficiently similar energies, on the initial asymmetry of the 56Ni-rich ejecta, created by the stochastic growth of convective and SASI mass motions. In order to realize this opportunity, we analyze the time evolution of the radial velocity of the SN shock and the maximum radial velocity of the radioactive 56Ni-rich ejecta (Figure 8) and the morphology of this matter (Figure 9).
Models M15-7b-1 and M15-7b-4 have considerably different explosion energies and obey the mentioned correlation between the explosion energy and the extent of 56Ni mixing (Table 2). Accordingly, the average velocity of the SN shock and the maximum radial velocity of the 56Ni-rich ejecta are both higher at all times in the more energetic explosion of model M15-7b-4 compared to model M15-7b-1 (Figure 8). We then focus on the interesting results obtained for models M15-7b-2 and M15-7b-3 exploding with nearly the same energies of 1.428 B and 1.432 B, but whose 56Ni-rich ejecta are mixed to quite different maximum velocities of the bulk mass of 56Ni of 3406 km s-1 and 2980 km s-1, respectively (Table 2). Such a significant difference in the maximum velocity of the bulk mass of 56Ni cannot be explained by a negligible difference in the explosion energy.
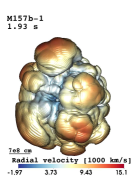
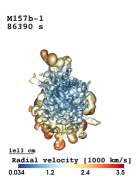
Along with the explosion energy, the initial asymmetry of the 56Ni-rich ejecta is another important property of SN explosions that determines the maximum radial velocity of 56Ni-rich ejecta. Wongwathanarat et al. (2015) found that there is a clear correlation between the asymmetries of the 56Ni-rich ejecta at late times and the early-time asymmetries originating from hydrodynamic instabilities generated during the onset of the SN explosion. In other words, the fundamental features of the morphology of the 56Ni-rich ejecta are imprinted by the “neutrino engine” during the first second of the explosion. When the SN shock approaches the (C+O)/He composition interface, the maximum radial velocity of the 56Ni-rich ejecta in model M15-7b-2 exceeds that of model M15-7b-3 (Figure 8) despite their practically equal explosion energies (Table 2). This fact may be interpreted in terms of a specific morphology of the 56Ni-rich ejecta in these models, which is seeded by different random perturbations and amplified by the stochastic growth of the hydrodynamic instabilities in the neutrino-heating layer. Inspecting the early-time morphology of the 56Ni-rich ejecta of models M15-7b-2 and M15-7b-3 in Figure 9, we see large mushroom-head-like structures in directions of the biggest initial convective plumes observed at the onset of the explosion. These mushroom heads are more prominent and faster in model M15-7b-2 than in M15-7b-3. At late times these large-scale, coherent structures have grown to extended RT fingers with the maximum speed of the bulk mass of the 56Ni-rich matter in model M15-7b-2 being larger than that in model M15-7b-3, similar to the situation at early times. This essential property and difference between models M15-7b-2 and M15-7b-3 is facilitated by the fact that the fast RT plumes in model M15-7b-2 enter the helium shell earlier than in M15-7b-3, which is indicated by the earlier deceleration of the 56Ni-rich ejecta in model M15-7b-2. Consequently, the RT plumes are closer to the SN shock in model M15-7b-2 and undergo a weaker interaction with the reverse shock that forms below the He/H composition interface (Figure 8). Thus, a comparison of models M15-7b-1, M15-7b-2, M15-7b-3, and M15-7b-4 leads to the generalized conclusion that the maximum velocity of the bulk mass of 56Ni is proportional to the explosion energy with some stochastic uncertainty for a given progenitor model.
The morphology of the 56Ni-rich ejecta in models M15-7b-1, M15-7b-2,
M15-7b-3, and M15-7b-4 (Figure 9) exploding with
a monotonically growing energy (Table 2) confirms two
previous findings.
First, these models demonstrate the correlation between the early-time
asymmetries of the 56Ni-rich ejecta and the asymmetries at late times
discussed already by Wongwathanarat et al. (2015).
Second, the size of the asymmetry at early times correlates with the degree of
asymmetry in the final morphology of the 56Ni-rich ejecta, which
in turn correlates with the extent of 56Ni mixing
in velocity space: the global deformation of M15-7b-1 is much less extreme,
models M15-7b-2 and M15-7b-3 have a very pronounced asphericity with
a bipolar elongation, and the morphology of model M15-7b-4 is distinguished
by a strongly one-sided distribution of the 56Ni-rich ejecta,
suggesting a large dipole asymmetry of the SN shock at the onset of
the explosion.
| Model | ||||||||||
|---|---|---|---|---|---|---|---|---|---|---|
| (s) | ( km s-1) | (s) | ||||||||
| M15-7b-1 | 2.90 | 1.933 | 6.46 | 1.344 | 2.629 | 14.51 | 1.16 | 14.4 | 19.0 | 0.607 |
| M15-7b-2 | 2.90 | 1.844 | 6.58 | 1.351 | 2.954 | 14.38 | 1.16 | 14.4 | 18.9 | 0.605 |
| M15-7b-3 | 2.90 | 1.814 | 6.26 | 1.364 | 2.579 | 14.83 | 1.16 | 14.4 | 18.9 | 0.606 |
| M15-7b-4 | 2.90 | 1.668 | 5.64 | 1.500 | 3.344 | 16.36 | 1.16 | 14.4 | 17.5 | 0.600 |
| M15-8b-1 | 2.95 | 2.811 | 10.03 | 0.992 | 1.609 | 9.78 | 1.48 | 11.6 | 10.6 | 0.559 |
| M15-8b-2 | 2.95 | 3.041 | 11.39 | 0.816 | 1.282 | 8.32 | 1.48 | 11.6 | 11.5 | 0.556 |
| M16-4a-1 | 4.10 | 2.200 | 17.63 | 0.951 | 1.997 | 10.79 | 4.49 | 8.1 | 35.9 | 1.049 |
| M16-4a-2 | 4.10 | 2.276 | 19.14 | 0.790 | 1.721 | 10.07 | 4.49 | 8.1 | 41.3 | 1.059 |
| M16-7b-1 | 3.41 | 3.301 | 14.24 | 0.811 | 1.356 | 8.74 | 2.15 | 10.0 | 20.4 | 0.791 |
| M16-7b-2 | 3.41 | 3.154 | 13.45 | 0.881 | 1.485 | 9.42 | 2.15 | 10.0 | 18.2 | 0.760 |
| M17-7a-1 | 4.25 | 2.659 | 13.82 | 0.831 | 1.526 | 9.21 | 2.32 | 7.7 | 28.6 | 0.890 |
| M17-7a-2 | 4.25 | 2.653 | 13.64 | 0.819 | 1.446 | 9.21 | 2.32 | 7.7 | 28.3 | 0.889 |
| M17-8a-3 | 4.23 | 2.064 | 13.87 | 0.941 | 2.068 | 11.12 | 4.80 | 9.0 | 45.1 | 1.003 |
| M17-8a-4 | 4.23 | 2.130 | 13.58 | 0.943 | 2.147 | 11.09 | 4.80 | 9.0 | 43.2 | 1.001 |
Note. — Columns 1 and 2 give the name of the 3D hydrodynamic explosion model and the helium-core mass of the corresponding pre-SN model. Columns 3 and 4 list the times when the SN shock in the 3D explosion models crosses the C+O/He and He/H composition interfaces, respectively. Columns 5, 6, and 7 provide the averaged characteristic velocities for the bulk of 56Ni containing of the total 56Ni mass in the 3D simulations: is the mean velocity of the bulk mass of 56Ni, averaged with the 56Ni mass fraction as weight function at day 150; is the maximum velocity of the bulk mass of 56Ni at the same epoch; and is the maximum velocity of the bulk mass of 56Ni at the moment just after the SN shock has passed the (C+O)/He composition interface. Columns give hydrodynamic properties of 1D explosion models: and are the maximum time-integrated RT growth factors in the close vicinity of the (C+O)/He and He/H composition interfaces, respectively (Figure 3); is the formation time of the reverse shock below the He/H composition interface, which is measured from the moment when the SN shock crosses this composition interface; and is the radius of the reverse shock at the formation epoch.
3.5 Extent of 56Ni mixing and properties of progenitors
Utrobin et al. (2019) interpreted the complex phenomenon of RT mixing (see Section 3.2) in a simple phenomenological approach and found that the efficiency of outward radioactive 56Ni mixing in the framework of the 3D neutrino-driven simulations depends mainly on the following two hydrodynamic properties of the single-star BSG progenitor models: a high growth factor of RT instabilities at the (C+O)/He composition interface, and a weak interaction of fast RT plumes with the reverse shock occurring below the He/H composition interface. It is interesting now to carry out a similar analysis of the binary-merger progenitors which have a RSG-like structure inside the He/H composition interface of their primaries.
This phenomenological approach attempts to capture multidimensional effects of RT mixing at the (C+O)/He composition interface by describing the evolution of the 56Ni velocity by means of a velocity growth factor which is proportional to the logarithm of the time-integrated RT growth factor (see Equation 3). To this end, we calculated the maximum (i.e., final) value of this growth factor, , in the close vicinity of the (C+O)/He composition interface (Figure 3, Table 3).
The fast RT plumes that grow from the C+O core outward through the helium shell can interact with the reverse shock developing below the He/H composition interface. Whether such an interaction happens depends on the ratio of two timescales, namely (1) the time it takes to form the reverse shock, after the SN shock has crossed the He/H composition interface, , and (2) the time needed by RT plumes originating from the (C+O)/He interface to reach the radius, , where the reverse shock forms. The latter timescale is given by the ratio of and the maximum velocity of the bulk mass of 56Ni when the SN shock passes the (C+O)/He composition interface, , multiplied by the growth factor , which takes into account the subsequent evolution of this velocity.
The greater the ratio of the two timescales, the weaker the interaction and the higher the terminal velocity of fast RT plumes in the hydrogen envelope. In Table 3 we give the corresponding quantities that determine the amount of mixing of radioactive 56Ni for all binary-merger models.
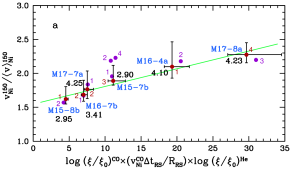
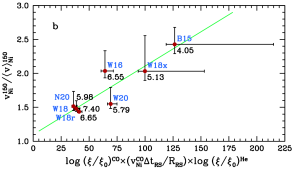
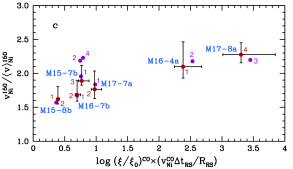
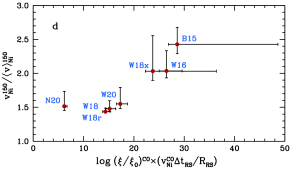
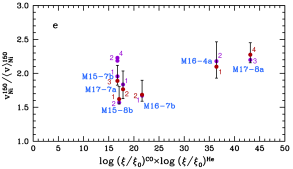
Following Utrobin et al. (2019), we measure the extent of 56Ni mixing by the dimensionless ratio of the maximum velocity of the bulk mass of 56Ni ejecta containing of the total 56Ni mass at day 150, , to the weighted mean velocity of the bulk mass of 56Ni at the same epoch, , whereby we eliminate the influence of slightly different explosion energies of the models. Because the outward mixing of 56Ni depends on the growth factor of RT plumes at the (C+O)/He composition interface as well as on the interaction of those plumes with the reverse shock from the He/H composition interface, we use the product of the corresponding growth factors (as explained above) on the abscissa in Figure 10(c). For comparison, we provide the corresponding plot for the single-star models in Figure 10(d). From an inspection of these figures, it is evident that both the reference binary-merger models and the single-star models exhibit in a quite similar way a correlation between the extent of outward radioactive 56Ni mixing and the hydrodynamic explosion properties linked to the structure of the progenitor models. But there are two relevant exceptions. First, the binary-merger model M15-7b-3 lies well above the correlation relation suggested by Figure 10(c). Second, the single-star model N20 lies far off the correlation suggested by Figure 10(d).
At this point let us recall that the progenitor model M15-7b has the largest time-integrated RT growth factor near the He/H composition interface among all binary-merger progenitor models under consideration (Figure 3 and Table 3), and the single-star progenitor model N20 is a RSG progenitor rather than a BSG one with respect to the structure of the helium core as we have pointed out before. Hence, the locations of these models off the expected correlation lines in Figures 10(c) and (d) might suggest a noticeable influence of the high growth factor of RT instabilities at the He/H composition interface on the outward mixing of radioactive 56Ni. In other words, we have to perform a more careful analysis to account for this influence and to further improve the correlations between nickel mixing and explosion properties of binary-merger and single-star progenitors, respectively.
In our phenomenological approach, which captures multidimensional effects of RT mixing at a composition interface and describes the evolution of the nickel velocity (Equation 3), the terminal maximum velocity of the bulk mass of radioactive 56Ni is proportional to the natural logarithm of the time-integrated RT growth factor at this interface and to the initial value of the radial velocity of 56Ni. Considering the mixing processes around the He/H composition interface, it is therefore natural to use the velocity of the bulk mass of 56Ni – which results from the acceleration of nickel-rich RT plumes at the (C+O)/He interface and their subsequent interaction with the reverse shock from the He/H interface (both are accounted for by the quantity on the horizontal axis of Figures 10(c) and (d)) – as the initial value of the radial velocity of 56Ni at the He/H interface in Equation 3. Thus, multiplying the quantity at the abscissa of Figures 10(c) and (d) by the logarithm of the time-integrated RT growth factor at the He/H composition interface, we reasonably estimate the effect of a high growth factor at this interface on the extent of outward mixing of radioactive 56Ni.
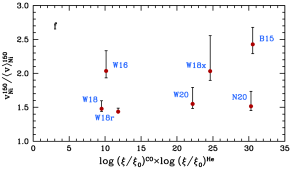
The results of this procedure are shown in Figures 10(a) and (b) for the binary-merger and single-star explosion models, respectively. We find a much better correlation between the normalized extent of 56Ni mixing and the product of the three hydrodynamic properties that favor the mixing of radioactive 56Ni during the explosions of the different progenitors. Our modified measure for the efficiency of 56Ni mixing moves the locations of both the binary-merger model M15-7b-3 and the single-star model N20 to the ideal, linear correlation lines plotted in green. The existence of these correlations confirms the decisive role of the three considered factors for the outward mixing of radioactive 56Ni during 3D neutrino-driven SN simulations of binary-merger and single-star progenitors.
Note that the growth factors at the (C+O)/He and He/H composition interfaces alone cannot explain the final 56Ni-mixing velocities because they result in a weak correlation with significant scatter for both the binary-merger and single-star models as it is shown in Figures 10(e) and (f), respectively. At the same time, this kind of plot can give a crude and a priori (i.e., without any information from 3D simulations) estimate of the maximum velocity of the bulk mass of radioactive 56Ni in explosions of different progenitors on the basis of – and this is the important point here – only the growth factors (derived from linear theory) of RT instabilities at the composition interfaces after shock passage.
From an inspection of Figures 10(a) and (b), it is evident that both the binary-merger and single-star progenitors obey a correlation between the extent of outward radioactive 56Ni mixing and the product of the hydrodynamical quantities on the abscissa equally well. The dimensionless extent of 56Ni mixing varies within 1.6–2.3 and 1.4–2.4, respectively, and the values on the abscissa fall into two non-overlapping intervals of 4.5–30 and 36–127. The slopes of the correlation lines are 0.026 and 0.010 for the reference binary-merger and single-star models, respectively. The significant difference between both the abscissa values and the slopes of the correlation functions is presumably related to the fact that we only performed a scaling analysis of the outward mixing of radioactive 56Ni during 3D neutrino-driven simulations. The difference might be eliminated by a more detailed theory that is able to predict the dependence of the mixing efficiency on the relevant hydrodynamical properties in a quantitative manner.
Utrobin et al. (2019) showed that their set of BSG explosion models based on single-star progenitors exhibits 56Ni mixing with an efficiency that scales roughly inversely with the helium-core mass, which varied from to , i.e., having a spread of (see the numbers next to the model names in Figure 10(b)). In contrast, the binary-merger models in Figure 10(a) fail to reveal any clear correlation between the amount of radial mixing of radioactive 56Ni and the helium-core mass of the progenitor model, which for the considered binary progenitors varies only within , i.e., having a spread of only . The latter spread might be too narrow for detecting such a correlation. However, it is possible to assert that a decrease in the fraction of the He core of the primary that was dredged up, , from to (in models M15-8b-1, M16-7b-2, M17-8a-4, and M16-4a-1) results in a growth of both the He-shell mass, , and the width of this shell, , (Table 1), and it also correlates with the extent of 56Ni mixing in velocity space (Figure 10(a)).
3.6 Light-curve modeling
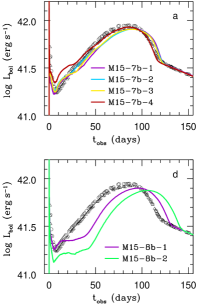
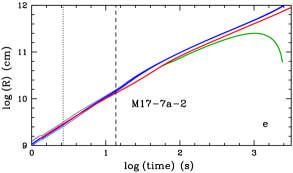
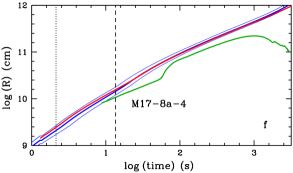
The results of our light-curve modeling based on the averaged 3D explosion simulations are illustrated by the bolometric light curves (Figure 11). They depend on the relevant basic properties of the progenitors (Table 1) and 3D explosion models (Table 2), and on the distributions of chemical composition in velocity space (Figure 7). In the context of the light-curve modeling, the structure of the outermost layers is responsible for the amplitude and width of the initial luminosity peak which forms during shock breakout from the stellar surface and the subsequent adiabatic cooling phase. Analyzing both photometric and spectroscopic observations of SN 1987A, especially the sensitivity of the width of the initial peak to the radius of the pre-SN, Utrobin (2005) found that the radius is . The pre-SN radii of all binary-merger models considered in our study (Table 1) fall in this range and guarantee a good description of the initial luminosity peak during the first 7 days (Figure 11).
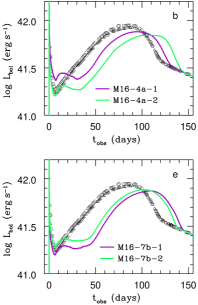
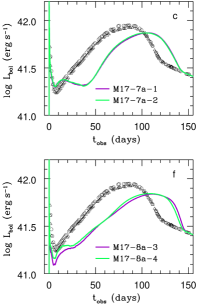
Utrobin et al. (2015) studied the influence of the explosion energy and the ejected 56Ni mass on the calculated light curves for the 3D explosion models based on the single-star progenitors. All models in Figure 11 show the influence of the explosion energy on the calculated light curve for the explosions of the different binary-merger progenitors, except for two model pairs (M15-7b-2, M15-7b-3) and (M17-7a-1, M17-7a-2) with almost equal explosion energies. It is well known that from about day 7 to day 30 the bolometric light curve is mainly determined by the properties of a cooling and recombination wave (CRW): the higher the ratio of explosion energy and ejecta mass, the higher the luminosity in the CRW phase because the ejecta expand and cool more quickly (cf. Utrobin et al., 2015).
After the CRW stage, when radiative diffusion takes place, the radioactive decay of 56Ni and 56Co nuclides becomes dominant in powering the luminosity. Now the bolometric light curve depends on the amount of radioactive material and its distribution over the ejecta for a given progenitor. In other words, there is an indirect influence of the explosive nucleosynthesis and mixing processes during the explosion on the light curve. The total amount of radioactive 56Ni strongly affects the luminosity from about day 30 to the radioactive tail, and gives rise to the second dome-like maximum of the light curve of SN 1987A. While the total amount of 56Ni mainly determines the energy radiated during this period and the highest luminosity of the broad dome-like maximum, the amount of outward 56Ni mixing affects the smoothness of the rising part of the bolometric light curve just after the CRW stage. The more extreme the large-scale mixing of 56Ni in velocity space is, the earlier the luminosity starts to grow to the dome-shaped maximum. The hydrodynamic models based on the pre-SN model M15-7b with maximum velocities of the bulk of ejected 56Ni equal to or exceeding about 3000 km s-1 (Table 2) most clearly demonstrate this dependence in comparison to the other hydrodynamic models (Figure 11). Along with the outward 56Ni mixing, hydrogen-rich matter is mixed down to the center. It increases the optical depth of the inner ejecta, because Thomson scattering off free electrons dominates the opacity of highly ionized matter. This, in turn, gives rise to a wide and luminous dome-shaped light-curve maximum (Figure 11).
For SN 1987A, the total amount of 56Ni in the ejecta is well fixed by the bolometric luminosity in the radioactive tail. Equating the observed bolometric luminosity in the radioactive tail to the gamma-ray luminosity gives a “directly observed” mass of radioactive 56Ni of with a distance modulus for the LMC of mag and a reddening of mag (Utrobin et al., 2015). In all of our hydrodynamic models the initial 56Ni mass at the onset of light-curve modeling, , is chosen such that the 56Ni mass in the ejecta evaluated at day 150, , fits the observed luminosity in the radioactive tail. Taking fallback of 56Ni into account requires to be greater than the value of , which, in turn, exceeds the directly observed mass (Table 2) because of expansion-work effects (Utrobin, 2007). The initial 56Ni masses of all 3D explosion models fall in between the minimum, , and maximum, , values listed in Table 2, and, consequently, these models are able to produce the amount of 56Ni that is needed to explain the SN 1987A observations.
3.7 Comparison with observations
For a comparison of our results of 3D hydrodynamic simulations of neutrino-driven explosions with observations of SN 1987A, we consider the set of models M15-7b-3, M15-8b-1, M16-4a-1, M16-7b-2, M17-7a-2, and M17-8a-4 with comparable and SN 1987A-like explosion energies (Table 2). These hydrodynamic models are based on the corresponding compact blue binary-merger pre-SN models with radii of 31.8 to 37.3 (Table 1), which agree well with the photometric radius of the BSG Sanduleak star of 28.7 to 57.5 (Arnett et al., 1989). Moreover, the pre-SN radii fall into the range of 30 to 40 , which is allowed by the hydrodynamic modeling and the time-dependent atmosphere model that explain both the bolometric light curve and the H profile of SN 1987A (Utrobin, 2005). This and the fact that the outer layers of the pre-SN models have a suitable structure permit us to obtain a good reproduction of the initial luminosity peak within the first 7 days by all binary-merger models listed above (Figure 11). During the transition from the adiabatic cooling phase to the CRW phase a prominent minimum in the luminosity forms, which is observed at around day 7. All models of the subset compared here, except models M16-4a-1 and M17-8a-4, reproduce well the observed minimum (Figure 11). However, only one hydrodynamic model, M15-7b-3, also reproduces fairly well both the smooth rising part of the observed light curve and the major broad maximum with a duration of 100 days. The smoothness of the bolometric light curve of model M15-7b-3 results from the outward mixing of the bulk of radioactive 56Ni in velocity space up to 2980 km s-1 (Table 2), which is consistent with the observed value of about 3000 km s-1 (Colgan et al., 1994), while all other models fall short of the required mixing.
The wide dome-like light curve maximum, in turn, arises from mixing a significant amount of hydrogen-rich matter down to the center. The analysis of the line profiles of hydrogen emission in the nebular phase (Chugai, 1991; Kozma & Fransson, 1998; Maguire et al., 2012), and the 3D view of H emission (Larsson et al., 2016) and molecular hydrogen in SN 1987A (Larsson et al., 2019) show that hydrogen is mixed deeply down to velocities 700 km s-1. It is noteworthy that in all hydrodynamic models hydrogen in the innermost layers of the ejecta expands with velocities lower than 40 km s-1 (Table 2), in good agreement with the observations. The mass of hydrogen confined to the inner layers ejected with velocities less than 2000 km s-1 may be considered as a measure of the optical depth of these layers, because hydrogen is the dominant contributor to opacity and the velocity at the photosphere observed in SN 1987A around the top of the dome-like maximum is about 2000 km s-1 (Phillips et al., 1988). It is the high optical depth of the inner ejecta that produces a wide and dome-shaped light-curve maximum. In model M15-7b-3 the hydrogen mass expanding with velocities less than 2000 km s-1 is 3.1 (Table 2), which is in good agreement with the observational constraint of 2.2 (Kozma & Fransson, 1998).
The bolometric luminosity of SN 1987A in the radioactive tail can be formally fitted by the directly observed mass of radioactive 56Ni (see Section 3.6). In our case the required mass of 56Ni is 0.0722 , which is consistent within the errors with other empirical estimates of () (Bouchet et al., 1991; McCray, 1993) and () (Seitenzahl et al., 2014). Unfortunately, the above observational numbers differ from the exact amount of radioactive 56Ni synthesized and ejected during an SN explosion. Even if there is no fallback of 56Ni, expansion-work effects definitely increase the 56Ni amount required in the hydrodynamic modeling to match the observed bolometric luminosity in the radioactive tail (compare the directly observed mass of 0.0722 with the values of in Table 2). Moreover, both fallback of 56Ni and expansion-work effects make an assessment of the ejected 56Ni mass model-dependent.
Analyzing the evolution of the intensity and the profile of the oxygen doublet [O I] in the nebular phase showed that the mass of oxygen in SN 1987A is in the range from 0.7 to 2.0 (Li & McCray, 1992; Chugai, 1994; Chugai et al., 1997; Kozma & Fransson, 1998; Jerkstrand et al., 2015). Our favorite model M15-7b-3 yields 0.83 (Table 2), which agrees with these observational constraints.
Kjær et al. (2010) and Larsson et al. (2013) studied the morphology of the ejecta using images and spectra in the emission lines of [Si I]+[Fe II] and He I, and in the emission lines of H and [Si I]+[Fe II], respectively, and reconstructed the 3D shape of the inner regions of the ejecta. Kjær et al. (2010) approximated the actual 3D shape of the ejecta by an elongated triaxial ellipsoid. The 3D morphology of the observed emission lines reflects thermal and nonthermal emissivity produced, as a final result, by the energy deposition of gamma rays with energies of about 1 MeV from the decay chain 56Ni Co Fe. These gamma rays undergo Compton scattering by free and bound electrons in the ejecta, resulting in high-energy electrons which, in turn, deposit their energy by heating free electrons or by ionizing and exciting atoms and ions. The energy deposition and the ionization and excitation of individual elements are sensitive to the chemical composition. This fact and both gamma-ray and photon transport are responsible for hiding the details of the density distribution of the radioactive matter, but leave the possibility to trace at least its global properties. In other words, the observed emissivity distribution can provide valuable information about the spatial distribution of radioactive 56Ni. The 3D morphology of the 56Ni-rich ejecta in the model sequence M17-8a-4, M16-4a-1, M15-7b-3, M17-7a-2, M16-7b-2, and M15-8b-1 long after shock breakout gradually changes from a practically one-sided, dipolar configuration to an almost basically spherical one with a dominant monopole (Figure 5, second and fourth columns). Among these models only our favorite model M15-7b-3 has a distribution of 56Ni-rich matter in velocity space with a strong dipole component, which resembles the elongated ellipsoid inferred from observations better than any other model.
4 Constraining the progenitor mass
Alp et al. (2019) showed that our favorite model M15-7b-3 having an ejecta mass of 19.46 fits the early X-ray and gamma-ray emission of SN 1987A best compared to other binary-merger explosion models. Jerkstrand et al. (2020), in turn, found that a good agreement between 3D models and the gamma-ray decay lines and the UVOIR bolometric light curve of SN 1987A could be achieved with a lower ejecta mass of about 14 . In the light of these results we computed a set of artificial models M15-7b-3-m2, M15-7b-3-m4, and M15-7b-3-m6 with ejecta masses of 17.46 , 15.46 , and 13.46 , respectively (Table 4). To realize the reduction of the ejecta mass, we decreased the density by the corresponding factor in each mass zone. This simple approach preserves both the shape of the profiles of density and all species in velocity space (i.e. the extent of hydrogen and nickel mixing), and the ratio of explosion energy and ejecta mass. Thereby the structure of the helium core becomes incompatible with that of the evolutionary model, but this is the price to pay for the simplicity of the approach. The total 56Ni mass for the auxiliary hydrodynamic models is fitted to the luminosity in the radioactive tail in the same way as in the case of the 3D explosion models.
| Model | ||||
|---|---|---|---|---|
| (B) | ||||
| M15-7b-3 | 19.46 | 1.432 | 7.28 | 3.10 |
| M15-7b-3-m2 | 17.46 | 1.289 | 7.28 | 2.76 |
| M15-7b-3-m4 | 15.46 | 1.146 | 7.28 | 2.41 |
| M15-7b-3-m6 | 13.46 | 1.001 | 7.28 | 2.07 |
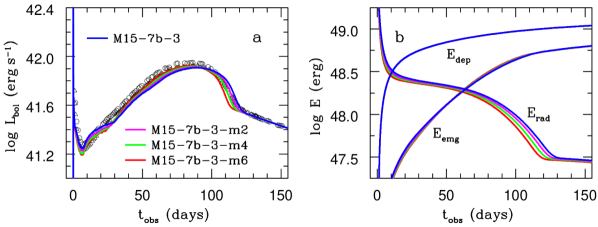
The corresponding light curves are depicted in Figure 12(a). The original model M15-7b-3 shows a good overall agreement with the observed light curve even though the dome of the calculated light curve should be slightly shifted as a whole to earlier times. The latter effect is easily realized by decreasing the mass of the ejected envelope (Utrobin, 2005), which is in perfect agreement with the analysis of X-ray and gamma-ray observations, and Fe IR line properties of SN 1987A by Jerkstrand et al. (2020). Decreasing the ejecta mass and, as a consequence, the mass of slow-moving hydrogen confined to the inner layers (Table 4) shifts both the rising part of the dome-like maximum of the light curve and the branch declining from the maximum to the radioactive tail to earlier times. The former is due to a shortening of the diffusion time, which is linked to the reduction of the total optical depth of the envelope. The latter effect is due to a decrease of the total radiation energy of the ejecta, which is clearly demonstrated in Figure 12(b). We ignore the total internal gas energy of the ejecta because it is negligible compared to that of radiation (Utrobin, 2007). Note that the time-integrated energy deposition by radioactive decays does not change with varied ejecta mass because the envelope remains optically thick for gamma rays. Also the time-integrated emergent energy is almost independent of the ejecta mass (Figure 12(b)).
Varying the ejecta mass of models M15-7b-3, M15-7b-3-m2, M15-7b-3-m4, and M15-7b-3-m6 from 19.46 to 13.46 reveals that the light curves of models M15-7b-3-m2 and M15-7b-3-m4 agree better with the dome-like maximum of the observed light curve than the original model M15-7b-3, whereas model M15-7b-3-m6 shows a noticeable deficit in the luminosity during the transition from the maximum to the radioactive tail (Figure 12(a)). This luminosity deficit in model M15-7b-3-m6 is connected to a deficit in the radiated energy, which, in turn, is related to the lower total radiation energy of the ejecta compared to that of other models under consideration (Figure 12(b)). The seemingly small deficit of the total radiation energy in model M15-7b-3-m6 during the transition from the maximum to the radioactive tail turns out to be fairly significant because of a lack of other sources of energy except for a little remaining energy deposition by radioactive decays. This fact is of great importance and allows us to discard model M15-7b-3-m6 from our consideration because it is less consistent with the observations of SN 1987A and has a severe deficiency in the energy budget during the transition from the broad maximum to the radioactive tail.
The experiment undertaken here demonstrates convincingly that a hydrodynamic model based on model M15-7b-3 with a lower ejecta mass in the range of 17.46 to 15.46 allows for a better agreement with the observations, confirming the conclusions of Jerkstrand et al. (2020). Of course, an open question arises, whether a lower explosion energy (Table 4) would allow for sufficiently strong mixing and a sufficiently high maximum velocity of the bulk mass of 56Ni consistent with observations of SN 1987A.
5 Comparison between single-star and binary-merger models
| Model | Remark | |||||||||||
|---|---|---|---|---|---|---|---|---|---|---|---|---|
| (B) | (km s-1) | |||||||||||
| B15-2 | 1.25 | 1.64 | 4.05 | 14.20 | 56.1 | 1.40 | 7.25 | 3370 | 28 | 0.922 | 0.16 | single-star |
| W18x-2 | 1.52 | 2.12 | 5.13 | 16.03 | 30.4 | 1.45 | 7.55 | 2460 | 147 | 0.847 | 0.36 | single-star |
| M15-7b-3 | 1.58 | 2.48 | 2.90 | 19.46 | 37.0 | 1.43 | 7.28 | 2980 | 29 | 3.10 | 0.83 | binary-merger |
| M15-8b-1 | 1.32 | 2.50 | 2.95 | 20.73 | 31.8 | 1.57 | 7.40 | 1829 | 27 | 3.14 | 0.96 | binary-merger |
| Constraint | 28.7–57.5 | 7.22 | 3000 | 700 | 2.2 | 0.7–2.0 | ||||||
The study undertaken in this paper in the framework of the neutrino-driven explosion mechanism provides a unique opportunity to compare single-star and binary-merger progenitor models in reproducing the observed properties of the BSG Sanduleak star and the SN 1987A explosion. To carry out a comparative analysis of the single-star and binary-merger models, we briefly summarize the key observational constraints for SN 1987A:
-
1.
The pre-SN star, Sanduleak , was a blue B3 Ia supergiant (Rousseau et al., 1978; Gilmozzi et al., 1987; Walborn et al., 1987; Sonneborn et al., 1987) whose location in the HRD is determined by an effective temperature of 14 000 K to 17 000 K (Humphreys & McElroy, 1984; Trundle et al., 2004; Crowther et al., 2006; Searle et al., 2008) and a luminosity of erg s-1 (Arnett et al., 1989).
-
2.
The directly observed mass of radioactive 56Ni deduced from a formal fit to the actual bolometric luminosity in the radioactive tail is equal to 0.0722 (Utrobin et al., 2015), which is consistent within the errors with other empirical estimates of () (Bouchet et al., 1991; McCray, 1993) and () (Seitenzahl et al., 2014).
-
3.
The analysis of the infrared emission lines of [Ni II] and [Fe II] in the nebular phase shows that the bulk of the radioactive 56Ni was moving with a maximum velocity of 3000 km s-1 (Colgan et al., 1994).
-
4.
The line profiles of the hydrogen emission in the nebular phase (Chugai, 1991; Kozma & Fransson, 1998; Maguire et al., 2012), and the 3D geometry of the H emission (Larsson et al., 2016) and of molecular hydrogen (Larsson et al., 2019) showed that hydrogen-rich matter is mixed deeply down to velocities 700 km s-1.
-
5.
Kozma & Fransson (1998) constrained quantitatively the mass of hydrogen-rich matter that expanded with velocities lower than 2000 km s-1 to about 2.2 .
- 6.
-
7.
The overall shape of the bolometric light curve, which is characterized by a narrow initial luminosity peak during the first 7 days and the broad dome-like maximum with a characteristic width of 100 days (Catchpole et al., 1987, 1988; Hamuy et al., 1988), is a specific feature of the peculiar Type IIP SN 1987A in contrast to ordinary Type IIP SNe.
-
8.
The kinematics of the ejected envelope is well deduced from the evolution of the photospheric velocity, which was estimated by Phillips et al. (1988) using the absorption minimum of the Fe II 5169 Å line.
- 9.
-
10.
Kjær et al. (2010) and Larsson et al. (2013) studied spectra and images in the emission lines of [Si I]+[Fe II] and He I and in the emission lines of H and [Si I]+[Fe II], respectively, and reconstructed the 3D shape of the inner regions of the ejecta. Kjær et al. approximated the actual 3D shape by an elongated triaxial ellipsoid.
-
11.
The hard X-ray and gamma-ray emission is very sensitive to macroscopic mixing in the SN ejecta, the ejecta structure, and the ejecta mass. Alp et al. (2019) analyzed the early hard X-ray and gamma-ray observations of SN 1987A to test 3D hydrodynamic simulations of neutrino-driven explosions.
-
12.
Using 3D hydrodynamic simulations of neutrino-driven explosions, Jerkstrand et al. (2020) studied the gamma-ray decay lines and the UVOIR bolometric light curve of SN 1987A to deduce constraints on the asymmetry of radioactive ejecta and the ejected envelope mass.
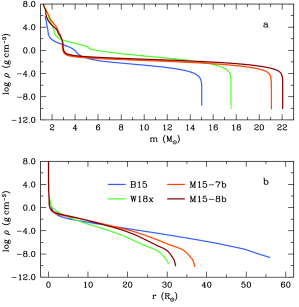
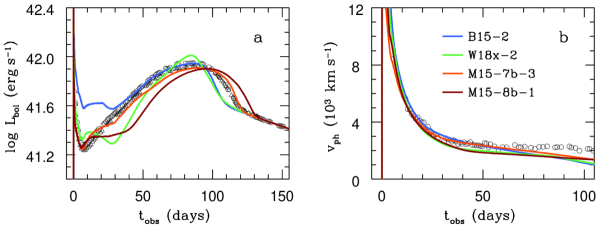
To quantify the quality of single-star and binary-merger explosion models, we compare the best and second-best model based on the agreement between simulations and observations using wide range of criteria. Hydrodynamic simulations of single stars resulted in the best and second-best model being models B15-2 and W18x-2 (Utrobin et al., 2019), while our simulations of binary mergers yield M15-7b-3 and M15-8b-1 as the best and second-best model, respectively. These models constitute the subset of our best single-star and binary-merger explosion models, whose basic properties are listed in Table 5. The structure of their progenitor models are depicted in Figure 13, the bolometric light curves in Figure 14(a), and the evolution of the photospheric velocity in Figure 14(b). This subset of models allows us not only to estimate how well the selected models match the observations, but also to demonstrate differences between the best and second-best model.
| Observational constraint | Single-star | Binary-merger |
|---|---|---|
| B15-2 / W18x-2 | M15-7b-3 / M15-8b-1 | |
| 1. location of Sanduleak in the HRD | / | / |
| 2. production of 56Ni in 3D simulations | / | / |
| 3. maximum velocity of the bulk of 56Ni | / | / |
| 4. minimum velocity of hydrogen matter | / | / |
| 5. mass of hydrogen with km s-1 | / | / |
| 6. dome of the light curve | / | / |
| 7. the entire light curve | / | / |
| 8. evolution of the photospheric velocity | / | / |
| 9. oxygen mass in the SN ejecta | / | / |
| 10. 3D shape of the 56Ni ejecta | / | / |
| 11. X-ray and gamma-ray emission | / | / |
| 12. gamma-ray decay lines | / | / |
| Total score | / | / |
Comparing the models in the subset, in the framework of neutrino-driven explosions, we obtain the following results:
-
1.
Sukhbold et al. (2016) clearly demonstrated that the single-star progenitor model B15 (W15 in the nomenclature of Sukhbold et al.) has a helium-core mass and a luminosity that are both too small compared to the observational constraints imposed by the location of the Sanduleak star in the HRD, whereas model W18x agrees well with these constraints. All of the binary-merger progenitor models provided by Menon & Heger (2017) for this study are located in or close to the region of the observed properties of Sanduleak in the HRD.
-
2.
The 3D neutrino-driven explosion simulations of both the single-star models B15-2 and W18x-2 and the binary-merger models M15-7b-3 and M15-8b-1 are capable of producing the initial (at the onset of light-curve modeling) 56Ni masses required to match the observations of the radioactive tail of SN 1987A (Table 5).
-
3.
Both of the two best models, B15-2 and M15-7b-3, yield a maximum velocity of the bulk of 56Ni consistent with the observed value of about 3000 km s-1 in contrast to the second-best models, W18x-2 and M15-8b-1, which do not fulfill this constraint of SN 1987A (Table 5).
-
4.
In the single-star and binary-merger models considered here the inward mixing of hydrogen, occurring during the 3D neutrino-driven simulations, results in minimum velocities of hydrogen-rich matter of less than 150 km s-1 (Table 5), which is in good agreement with the spectral observations of SN 1987A.
-
5.
Table 5 shows that the single-star models B15-2 and W18x-2 contain masses of hydrogen-rich matter expanding with velocities lower than 2000 km s-1 that are a factor of two lower than the observational constraint of about 2.2 , whereas the binary-merger models M15-7b-3 and M15-8b-1 even exceed it.
-
6.
For the binary-merger models M15-7b-3 and M15-8b-1 the broad domes of the calculated light curves are very similar in shape to the observed one, but they are slightly less luminous and shifted to a slightly later epoch (Figure 14(a)). In contrast, the dome of the single-star model B15-2 satisfactorily fits the observed one, while the dome of model W18x-2 displays a peaked shape and disagrees with the observations. The quality of the dome-shape fits partially correlates with the mass of hydrogen-rich matter mixed inward to a velocity of 2000 km s-1 and the mass of the ejecta (Table 5).
-
7.
The binary-merger model M15-7b-3 matches the overall observed bolometric light curve much better than any of the other models (Figure 14(a)). The narrow initial luminosity peak during the first 7 days results from a relatively small radius of the corresponding pre-SN model of 37.0 (Table 5) and a suitable structure of its outer layers (Figure 13). A combination of the maximum velocity of the bulk mass of 56Ni around 3000 km s-1 and the mass of hydrogen-rich matter of 3.10 mixed inward to a velocity of 2000 km s-1 (Table 5) produces the smooth and monotonic rising part of the light curve and its broad dome-like maximum with a characteristic width of 100 days.
-
8.
The evolution of the photospheric velocity of both best models B15-2 and M15-7b-3 is in good agreement with that observed during the first 60 days when the position of the photosphere is more or less correctly determined in the light-curve simulations, whereas the agreement is worse for the other two models (Figure 14(b)). After the photospheric velocity has decreased below 3000 km s-1, which is the maximum speed of the bulk mass of the 56Ni-rich matter, around day 30, the asymmetry in the 3D morphology of the inner regions of the ejecta studied by Kjær et al. (2010) and Larsson et al. (2013) can gradually affect the shape of the photosphere. The disparity between the calculated and observed photospheric velocities after about 60 days most likely stems from assuming a spherical 56Ni distribution in our 1D simulations.
-
9.
The mass of oxygen in the ejecta of the binary-merger models M15-7b-3 and M15-8b-1 falls in the observed range of 0.7 to 2.0 , but the single-star models B15-2 and W18x-2 have oxygen masses significantly below this range (Table 5).
-
10.
The 3D morphology of the 56Ni-rich ejecta in the binary-merger model M15-7b-3 long after shock breakout has a pronounced dipole component (Figure 5, upper row, second column), which resembles well the elongated-ellipsoid shape that was extracted from spectra and images of SN 1987A in the emission lines in the nebular phase. Except for a single prominent clump moving with a velocity of about 3000 km s-1, the 3D explosion morphology of the single-star model W18x-2 is of approximately elongated ellipsoidal shape (Utrobin et al. 2019, Figure 4, lower row, last column). The two other models of M15-8b-1 (Figure 5, upper row, last column) and B15-2 (Utrobin et al. 2019, Figure 4, lower row, first column) have a morphology that is closer to a spherical shape than to an elongated ellipsoid.
-
11.
Alp et al. (2019) computed the early hard X-ray and gamma-ray emission produced by 3D neutrino-driven explosion models of single-star and binary-merger progenitors, and compared the emergent emission with the corresponding spectra, continuum light curves, and line fluxes of SN 1987A. They showed that the single-star model B15-2 and the binary-merger model M15-7b-3 are basically consistent with the X-ray and gamma-ray observations, whereas model M15-8b-1 fails to match them. Model W18x-2 is not investigated in that study.
-
12.
Analyzing the gamma-ray decay lines and the UVOIR bolometric light curve of SN 1987A up to 600 days, Jerkstrand et al. (2020) found that the 3D explosion models show good agreement with the observations only for an ejecta mass of about 14 and a kinetic energy of around erg. It is important that our auxiliary hydrodynamic models based on model M15-7b-3 and having an ejecta mass in the range of 17.46 to 15.46 , i.e., lower than in the reference model M15-7b-3, result in a better agreement with the photometric observations of SN 1987A (see Section 4).
For a concise presentation of the results of the above comparative analysis and their adequate assessment, we list all twelve observational constraints in Table 6, where plus signs stand for matching the constraint, minus signs for not matching, and a blank space for a lack of the relevant data. Assuming equal weights for all constraints of the analysis, we conclude that our favorite binary-merger explosion model M15-7b-3 matches all of the constraints except for point No. 12, demonstrating an overwhelming superiority over the other models. Only point 12 still poses a problem, because the ejecta mass of the explosion model M15-7b-3 is too large. This points to a shortcoming of the binary-merger progenitor model M15-7b, whose pre-collapse mass is too high to avoid this problem. Among the single-star explosions, model B15-2 has some important favorable properties – namely the maximum velocity of the bulk of 56Ni, the dome of the light curve, and the X-ray and gamma-ray emission – that agree with observations.
Note that Ono et al. (2020) compared 3D single-star and binary-merger explosions by their ability to reproduce the observed infrared emission lines of [Fe II] (Haas et al., 1990) and to satisfy the constraint imposed by the fast 56Ni clump (Utrobin et al., 1995). Their 3D explosion modeling was not self-consistent (because they imposed the explosion asymmetry by hand), but in line with our conclusions, they independently found that the explosion of the binary-merger progenitor model, which was initiated by an asymmetric bipolar-like SN shock, reproduces the observations better than the single-star explosion.
6 Conclusions
In this work we compare the results of 3D neutrino-driven explosion simulations and light curve modeling, based on progenitor models of Sanduleak evolved in a binary-merger scenario with the observations of the peculiar Type IIP SN 1987A. We draw the following conclusions:
-
•
The radii of the compact blue binary-merger progenitor models are in between 31.8 and 37.3 (Table 1) and agree well with the photometric radius of the BSG Sanduleak star of 28.7 to 57.5 (Arnett et al., 1989). In addition, these pre-SN radii are in agreement with those of 30 to 40 allowed by hydrodynamic explosion modeling and a time-dependent atmosphere model that explain the photometric and spectroscopic observations of SN 1987A (Utrobin, 2005). Such pre-SN radii and the structure of the outer layers are suitable to reproduce the observed initial luminosity peak during the first 7 days (Figure 11) with explosions of all of our binary-merger models M15-7b-3, M15-8b-1, M16-4a-1, M16-7b-2, M17-7a-2, and M17-8a-4, which have comparable and SN 1987A-like explosion energies (Table 2).
-
•
After the first 20 days, we see some non-monotonic behavior (and partly short-timescale variability) in the light curves of all of the explosion models instead of the smooth and monotonic behavior of the observed light curve (Figure 11). The rising part of the light curve depends both on the structure of the pre-SN model (Utrobin, 2004) and on the extent of outward mixing of radioactive 56Ni (Utrobin 2004; Utrobin et al. 2019, Figure 8). Strong outward mixing of 56Ni in models M15-7b-1, M15-7b-2, M15-7b-3, and M16-4a-1 (Table 2) – which exceeds the observational constraint on the maximum velocity for the bulk mass of 56Ni of about 3000 km s-1 – produces an almost smooth and monotonic rising part of the calculated light curves. In contrast, weaker mixing of 56Ni in some of the explosion models results in non-smooth and non-monotonic behavior.
-
•
The domes of all calculated light curves are very similar in shape to the observed behavior, but they are less luminous up to about 0.1 dex and shifted to a later epoch up to nearly 30 days (Figure 11). However, for the 3D explosion models based on progenitor M15-7b both of these shortcomings are smaller and are about 0.02 dex and 10 days, respectively. This effect is explained by a larger optical depth of the inner layers than in the single-star explosion model B15-2, whose dome of the light curve agrees with the observations of SN 1987A much better than that of all other single-star explosion models (Utrobin et al. 2015, Figure 11). The higher optical depth in the binary-merger explosion models is caused by a much higher abundance of hydrogen in the inner layers. The last fact is evident from the mass of hydrogen mixed into the helium shell, which is about 0.5 in the explosion models of our binary-merger progenitors (Table 2) compared to 0.15 in model B15-2 (Utrobin et al. 2019, Table 2).
-
•
The initial 56Ni mass (at the time of shock breakout) required to match the observations of SN 1987A in the radioactive tail (Figure 11) is below the maximum production of 56Ni estimated for all of our 3D explosion models (Table 2). Thus, the 3D neutrino-driven explosion simulations considered in this study are able to synthesize the ejected amount of radioactive 56Ni.
-
•
The sequence of the binary-merger explosion models M15-7b-3, M15-8b-1, M16-4a-1, M16-7b-2, M17-7a-2, and M17-8a-4, all of which have nearly the same and SN 1987A-like explosion energies, showed, similar to the single-star models, that the extent of outward radioactive 56Ni mixing in the framework of the 3D neutrino-driven simulations depends mainly on the following three explosion-related properties, which depend on the structure of the progenitor models: high growth factors of RT instabilities at the (C+O)/He and He/H composition interfaces, and a weak interaction of fast RT plumes with the reverse shock occurring below the He/H composition interface. An optimal combination of these three factors turned out to be a sufficient condition for efficient outward mixing of 56Ni into the hydrogen envelope.
-
•
Kozma & Fransson (1998) quantitatively constrained the mass of hydrogen-rich gas mixed to velocities of 2000 km s-1 to about 2.2 . Models M15-7b-4 and M16-4a-1 agree well with this observational constraint, whereas other models yield significantly higher masses of hydrogen matter in the range of 3.07 to 6.41 mixed below 2000 km s-1 (Table 2).
- •
-
•
Analyzing the gamma-ray decay lines and the UVOIR bolometric light curve of SN 1987A, Jerkstrand et al. (2020) find that 3D neutrino-driven explosion simulations show good agreement with the observations only for an ejecta mass of about 14 and a kinetic energy of around erg. Being aware of this result, we computed auxiliary explosion models based on model M15-7b-3, which had an ejecta mass in the range of 17.46 to 15.46 , which is lower than in the reference model M15-7b-3. These models show a better agreement with the photometric observations than the reference model (Section 4).
-
•
A comparative analysis of 3D neutrino-driven explosion simulations and light curve modeling of SN 1987A (Section 5) based on progenitors evolved in both single-star and binary-merger scenarios shows that only binary-merger model M15-7b-3 matches eleven of twelve crucial observational constraints, including the observational properties of the BSG Sanduleak star, demonstrating a remarkable superiority compared to other single-star and binary-merger models (Table 6). Among the single-star models, model B15-2 has some favorable properties – namely the maximum velocity of the bulk of 56Ni, the dome of the light curve, and the X-ray and gamma-ray emission – that agree with observations.
As in Utrobin et al. (2015, 2019), we did not fine-tune the modeling approach for SN 1987A, except for choosing a suitable explosion energy, to achieve good agreement of the 3D neutrino-driven explosion models and the corresponding light-curve results with observations of SN 1987A.
Our results are a promising step forward towards fully self-consistent models that can explain the observed properties of SN 1987A. They provide strong support to the binary-merger scenario for the BSG progenitor star of this supernova. Moreover, they permit the expectation that further progress will be achieved by improved binary-merger progenitor models, having a smaller pre-collapse mass, higher resolution 3D explosion simulations to later evolution stages beyond the decay time of 56Ni and 56Co (Gabler et al., 2021), and a treatment of radiative transfer including 3D effects (e.g., Dessart & Audit, 2019).
References
- Alp et al. (2019) Alp, D., Larsson, J., Maeda, K., et al. 2019, ApJ, 882, 22, doi: 10.3847/1538-4357/ab3395
- Arcones et al. (2007) Arcones, A., Janka, H.-T., & Scheck, L. 2007, A&A, 467, 1227, doi: 10.1051/0004-6361:20066983
- Arnett (1987) Arnett, W. D. 1987, ApJ, 319, 136, doi: 10.1086/165439
- Arnett et al. (1989) Arnett, W. D., Bahcall, J. N., Kirshner, R. P., & Woosley, S. E. 1989, ARA&A, 27, 629, doi: 10.1146/annurev.aa.27.090189.003213
- Asplund et al. (2009) Asplund, M., Grevesse, N., Sauval, A. J., & Scott, P. 2009, ARA&A, 47, 481, doi: 10.1146/annurev.astro.46.060407.145222
- Bouchet et al. (1991) Bouchet, P., Phillips, M. M., Suntzeff, N. B., et al. 1991, A&A, 245, 490
- Castor et al. (1975) Castor, J. I., Abbott, D. C., & Klein, R. I. 1975, ApJ, 195, 157, doi: 10.1086/153315
- Catchpole et al. (1987) Catchpole, R. M., Menzies, J. W., Monk, A. S., et al. 1987, MNRAS, 229, 15P
- Catchpole et al. (1988) Catchpole, R. M., Whitelock, P. A., Feast, M. W., et al. 1988, MNRAS, 231, 75P
- Catchpole et al. (1989) Catchpole, R. M., Whitelock, P. A., Menzies, J. W., et al. 1989, MNRAS, 237, 55P, doi: 10.1093/mnras/237.1.55P
- Chevalier (1976) Chevalier, R. A. 1976, ApJ, 207, 872, doi: 10.1086/154557
- Chevalier & Soker (1989) Chevalier, R. A., & Soker, N. 1989, ApJ, 341, 867, doi: 10.1086/167545
- Chugai (1991) Chugai, N. N. 1991, Soviet Ast., 35, 171
- Chugai (1994) —. 1994, ApJ, 428, L17, doi: 10.1086/187382
- Chugai et al. (1997) Chugai, N. N., Chevalier, R. A., Kirshner, R. P., & Challis, P. M. 1997, ApJ, 483, 925, doi: 10.1086/304253
- Colella & Glaz (1985) Colella, P., & Glaz, H. M. 1985, Journal of Computational Physics, 59, 264, doi: 10.1016/0021-9991(85)90146-9
- Colella & Woodward (1984) Colella, P., & Woodward, P. R. 1984, Journal of Computational Physics, 54, 174, doi: 10.1016/0021-9991(84)90143-8
- Colgan et al. (1994) Colgan, S. W. J., Haas, M. R., Erickson, E. F., Lord, S. D., & Hollenbach, D. J. 1994, ApJ, 427, 874, doi: 10.1086/174193
- Crowther et al. (2006) Crowther, P. A., Lennon, D. J., & Walborn, N. R. 2006, A&A, 446, 279, doi: 10.1051/0004-6361:20053685
- Dessart & Audit (2019) Dessart, L., & Audit, E. 2019, A&A, 629, A17, doi: 10.1051/0004-6361/201935794
- Dessart & Hillier (2008) Dessart, L., & Hillier, D. J. 2008, MNRAS, 383, 57, doi: 10.1111/j.1365-2966.2007.12538.x
- Dopita et al. (1988) Dopita, M. A., Dawe, J. A., Achilleos, N., et al. 1988, AJ, 95, 1717, doi: 10.1086/114768
- Ertl et al. (2020) Ertl, T., Woosley, S. E., Sukhbold, T., & Janka, H. T. 2020, ApJ, 890, 51, doi: 10.3847/1538-4357/ab6458
- France et al. (2011) France, K., McCray, R., Penton, S. V., et al. 2011, ApJ, 743, 186, doi: 10.1088/0004-637X/743/2/186
- Fransson et al. (1989) Fransson, C., Cassatella, A., Gilmozzi, R., et al. 1989, ApJ, 336, 429, doi: 10.1086/167022
- Fryxell et al. (1991) Fryxell, B., Arnett, D., & Müller, E. 1991, ApJ, 367, 619, doi: 10.1086/169657
- Gabler et al. (2021) Gabler, M., Wongwathanarat, A., & Janka, H.-T. 2021, MNRAS, doi: 10.1093/mnras/stab116
- Gear (1971) Gear, C. W. 1971, Numerical initial value problems in ordinary differential equations
- Gilmozzi et al. (1987) Gilmozzi, R., Cassatella, A., Clavel, J., et al. 1987, Nature, 328, 318, doi: 10.1038/328318a0
- Haas et al. (1990) Haas, M. R., Erickson, E. F., Lord, S. D., et al. 1990, ApJ, 360, 257, doi: 10.1086/169115
- Hairer et al. (1993) Hairer, E., Norsett, S. P., & Wanner, G. 1993, Solving Ordinary Differential Equations I, Nonstiff Problems, second revised edn. (Springer-Verlag Berlin Heidelberg), doi: 10.1007/978-3-540-78862-1
- Hairer & Wanner (1996) Hairer, E., & Wanner, G. 1996, Solving Ordinary Differential Equations II, Stiff and Differential-Algebraic Problems, second revised edn. (Springer-Verlag Berlin Heidelberg), doi: 10.1007/978-3-642-05221-7
- Hamuy et al. (1988) Hamuy, M., Suntzeff, N. B., Gonzalez, R., & Martin, G. 1988, AJ, 95, 63, doi: 10.1086/114613
- Hillebrandt et al. (1987) Hillebrandt, W., Höflich, P., Weiss, A., & Truran, J. W. 1987, Nature, 327, 597, doi: 10.1038/327597a0
- Hillebrandt & Meyer (1989) Hillebrandt, W., & Meyer, F. 1989, A&A, 219, L3
- Humphreys & McElroy (1984) Humphreys, R. M., & McElroy, D. B. 1984, ApJ, 284, 565, doi: 10.1086/162439
- Jakobsen et al. (1991) Jakobsen, P., Albrecht, R., Barbieri, C., et al. 1991, ApJ, 369, L63, doi: 10.1086/185959
- Jerkstrand et al. (2015) Jerkstrand, A., Smartt, S. J., Sollerman, J., et al. 2015, MNRAS, 448, 2482, doi: 10.1093/mnras/stv087
- Jerkstrand et al. (2020) Jerkstrand, A., Wongwathanarat, A., Janka, H. T., et al. 2020, MNRAS, 494, 2471, doi: 10.1093/mnras/staa736
- Kageyama & Sato (2004) Kageyama, A., & Sato, T. 2004, Geochemistry, Geophysics, Geosystems, 5, Q09005, doi: 10.1029/2004GC000734
- Kifonidis et al. (2003) Kifonidis, K., Plewa, T., Janka, H.-T., & Müller, E. 2003, A&A, 408, 621, doi: 10.1051/0004-6361:20030863
- Kjær et al. (2010) Kjær, K., Leibundgut, B., Fransson, C., Jerkstrand , A., & Spyromilio, J. 2010, A&A, 517, A51, doi: 10.1051/0004-6361/201014538
- Kozma & Fransson (1998) Kozma, C., & Fransson, C. 1998, ApJ, 497, 431, doi: 10.1086/305452
- Kunkel et al. (1987) Kunkel, W., Madore, B., Shelton, I., et al. 1987, IAU Circ., 4316
- Langer (1991) Langer, N. 1991, A&A, 243, 155
- Larsson et al. (2013) Larsson, J., Fransson, C., Kjaer, K., et al. 2013, ApJ, 768, 89, doi: 10.1088/0004-637X/768/1/89
- Larsson et al. (2016) Larsson, J., Fransson, C., Spyromilio, J., et al. 2016, ApJ, 833, 147, doi: 10.3847/1538-4357/833/2/147
- Larsson et al. (2019) Larsson, J., Spyromilio, J., Fransson, C., et al. 2019, ApJ, 873, 15, doi: 10.3847/1538-4357/ab03d1
- Li & McCray (1992) Li, H., & McCray, R. 1992, ApJ, 387, 309, doi: 10.1086/171082
- Liou (1996) Liou, M.-S. 1996, Journal of Computational Physics, 129, 364, doi: 10.1006/jcph.1996.0256
- Lundqvist & Fransson (1996) Lundqvist, P., & Fransson, C. 1996, ApJ, 464, 924, doi: 10.1086/177380
- Maguire et al. (2012) Maguire, K., Jerkstrand, A., Smartt, S. J., et al. 2012, MNRAS, 420, 3451, doi: 10.1111/j.1365-2966.2011.20276.x
- Mazzali et al. (1992) Mazzali, P. A., Lucy, L. B., & Butler, K. 1992, A&A, 258, 399
- McCray (1993) McCray, R. 1993, ARA&A, 31, 175, doi: 10.1146/annurev.aa.31.090193.001135
- Menon & Heger (2017) Menon, A., & Heger, A. 2017, MNRAS, 469, 4649. https://arxiv.org/abs/1703.04918
- Menon et al. (2019) Menon, A., Utrobin, V., & Heger, A. 2019, MNRAS, 482, 438, doi: 10.1093/mnras/sty2647
- Mihalas & Mihalas (1984) Mihalas, D., & Mihalas, B. W. 1984, Foundations of radiation hydrodynamics
- Morris & Podsiadlowski (2009) Morris, T., & Podsiadlowski, P. 2009, MNRAS, 399, 515, doi: 10.1111/j.1365-2966.2009.15114.x
- Müller et al. (1991a) Müller, E., Fryxell, B., & Arnett, D. 1991a, in European Southern Observatory Conference and Workshop Proceedings, Vol. 37, European Southern Observatory Conference and Workshop Proceedings, ed. I. J. Danziger & K. Kjaer, 99
- Müller et al. (1991b) Müller, E., Fryxell, B., & Arnett, D. 1991b, A&A, 251, 505
- Müller & Steinmetz (1995) Müller, E., & Steinmetz, M. 1995, Computer Physics Communications, 89, 45, doi: 10.1016/0010-4655(94)00185-5
- Nomoto & Hashimoto (1988) Nomoto, K., & Hashimoto, M. 1988, Phys. Rep., 163, 13, doi: 10.1016/0370-1573(88)90032-4
- Ono et al. (2020) Ono, M., Nagataki, S., Ferrand, G., et al. 2020, ApJ, 888, 111, doi: 10.3847/1538-4357/ab5dba
- Phillips et al. (1988) Phillips, M. M., Heathcote, S. R., Hamuy, M., & Navarrete, M. 1988, AJ, 95, 1087, doi: 10.1086/114705
- Podsiadlowski (1992) Podsiadlowski, P. 1992, PASP, 104, 717, doi: 10.1086/133043
- Podsiadlowski & Joss (1989) Podsiadlowski, P., & Joss, P. C. 1989, Nature, 338, 401, doi: 10.1038/338401a0
- Podsiadlowski et al. (1992) Podsiadlowski, P., Joss, P. C., & Hsu, J. J. L. 1992, ApJ, 391, 246, doi: 10.1086/171341
- Podsiadlowski et al. (1990) Podsiadlowski, P., Joss, P. C., & Rappaport, S. 1990, A&A, 227, L9
- Podsiadlowski et al. (2007) Podsiadlowski, P., Morris, T. S., & Ivanova, N. 2007, in American Institute of Physics Conference Series, Vol. 937, Supernova 1987A: 20 Years After: Supernovae and Gamma-Ray Bursters, ed. S. Immler, K. Weiler, & R. McCray, 125–133, doi: 10.1063/1.3682893
- Quirk (1994) Quirk, J. J. 1994, International Journal for Numerical Methods in Fluids, 18, 555, doi: 10.1002/fld.1650180603
- Rousseau et al. (1978) Rousseau, J., Martin, N., Prévot, L., et al. 1978, A&AS, 31, 243
- Saio et al. (1988) Saio, H., Nomoto, K., & Kato, M. 1988, Nature, 334, 508, doi: 10.1038/334508a0
- Scheck et al. (2006) Scheck, L., Kifonidis, K., Janka, H.-T., & Müller, E. 2006, A&A, 457, 963, doi: 10.1051/0004-6361:20064855
- Searle et al. (2008) Searle, S. C., Prinja, R. K., Massa, D., & Ryans, R. 2008, A&A, 481, 777, doi: 10.1051/0004-6361:20077125
- Sedov (1959) Sedov, L. I. 1959, Similarity and Dimensional Methods in Mechanics
- Seitenzahl et al. (2014) Seitenzahl, I. R., Timmes, F. X., & Magkotsios, G. 2014, ApJ, 792, 10, doi: 10.1088/0004-637X/792/1/10
- Shigeyama & Nomoto (1990) Shigeyama, T., & Nomoto, K. 1990, ApJ, 360, 242, doi: 10.1086/169114
- Sonneborn et al. (1987) Sonneborn, G., Altner, B., & Kirshner, R. P. 1987, ApJ, 323, L35, doi: 10.1086/185052
- Sukhbold et al. (2016) Sukhbold, T., Ertl, T., Woosley, S. E., Brown, J. M., & Janka, H.-T. 2016, ApJ, 821, 38, doi: 10.3847/0004-637X/821/1/38
- Suntzeff & Bouchet (1990) Suntzeff, N. B., & Bouchet, P. 1990, AJ, 99, 650, doi: 10.1086/115358
- Suntzeff et al. (1988) Suntzeff, N. B., Hamuy, M., Martin, G., Gomez, A., & Gonzalez, R. 1988, AJ, 96, 1864, doi: 10.1086/114933
- Trundle et al. (2004) Trundle, C., Lennon, D. J., Puls, J., & Dufton, P. L. 2004, A&A, 417, 217, doi: 10.1051/0004-6361:20034325
- Truran & Weiss (1987) Truran, J. W., & Weiss, A. 1987, in Lecture Notes in Physics, Berlin Springer Verlag, Vol. 287, Nuclear Astrophysics, ed. W. Hillebrandt, R. Kuhfuss, E. Mueller, & J. W. Truran, 293–304, doi: 10.1007/BFb0016590
- Urushibata et al. (2018) Urushibata, T., Takahashi, K., Umeda, H., & Yoshida, T. 2018, MNRAS, 473, L101, doi: 10.1093/mnrasl/slx166
- Utrobin (2004) Utrobin, V. P. 2004, Astronomy Letters, 30, 293, doi: 10.1134/1.1738152
- Utrobin (2005) —. 2005, Astronomy Letters, 31, 806, doi: 10.1134/1.2138767
- Utrobin (2007) —. 2007, A&A, 461, 233, doi: 10.1051/0004-6361:20066078
- Utrobin & Chugai (2005) Utrobin, V. P., & Chugai, N. N. 2005, A&A, 441, 271, doi: 10.1051/0004-6361:20042599
- Utrobin et al. (1995) Utrobin, V. P., Chugai, N. N., & Andronova, A. A. 1995, A&A, 295, 129
- Utrobin et al. (2015) Utrobin, V. P., Wongwathanarat, A., Janka, H.-T., & Müller, E. 2015, A&A, 581, A40, doi: 10.1051/0004-6361/201425513
- Utrobin et al. (2019) Utrobin, V. P., Wongwathanarat, A., Janka, H.-T., et al. 2019, A&A, 624, A116, doi: 10.1051/0004-6361/201834976
- Walborn et al. (1987) Walborn, N. R., Lasker, B. M., Laidler, V. G., & Chu, Y.-H. 1987, ApJ, 321, L41, doi: 10.1086/185002
- Wampler et al. (1990) Wampler, E. J., Wang, L., Baade, D., et al. 1990, ApJ, 362, L13, doi: 10.1086/185836
- Weiss (1989) Weiss, A. 1989, ApJ, 339, 365, doi: 10.1086/167302
- Weiss et al. (1988) Weiss, A., Hillebrandt, W., & Truran, J. W. 1988, A&A, 197, L11
- West et al. (1987) West, R. M., Lauberts, A., Jorgensen, H. E., & Schuster, H. E. 1987, A&A, 177, L1
- Wongwathanarat et al. (2010) Wongwathanarat, A., Hammer, N. J., & Müller, E. 2010, A&A, 514, A48, doi: 10.1051/0004-6361/200913435
- Wongwathanarat et al. (2013) Wongwathanarat, A., Janka, H.-T., & Müller, E. 2013, A&A, 552, A126, doi: 10.1051/0004-6361/201220636
- Wongwathanarat et al. (2017) Wongwathanarat, A., Janka, H.-T., Müller, E., Pllumbi, E., & Wanajo, S. 2017, ApJ, 842, 13, doi: 10.3847/1538-4357/aa72de
- Wongwathanarat et al. (2015) Wongwathanarat, A., Müller, E., & Janka, H.-T. 2015, A&A, 577, A48, doi: 10.1051/0004-6361/201425025
- Woosley et al. (1997) Woosley, S. E., Heger, A., Weaver, T. A., & Langer, N. 1997
- Woosley et al. (1988) Woosley, S. E., Pinto, P. A., & Ensman, L. 1988, ApJ, 324, 466, doi: 10.1086/165908