Magneto-structural coupling in ilmenite-type NiTiO3: a combined diffraction and dilatometry study
Abstract
We report the ground state magnetic structure and in-field magnetostrictive effects of NiTiO3 studied by means of zero field and in-field single crystal neutron diffraction, magnetization and high-resolution dilatometry experiments. Zero-field neutron diffraction on NiTiO3 single crystals reveal an easy-plane antiferromagnet with a multidomain ground state. Upon application of external magnetic fields, neutron diffraction shows the evolution of domains with spins perpendicular to the applied field. The rotation of spins in the multidomain state exhibits pronounced lattice changes in the magnetostriction measurements. We see magnetization and magnetostriction measurements sale with each other in the multidomain state revealing the strong coupling of spins to the lattice.
I Introduction
Layered honeycomb magnets have been a great avenue for exciting and rich physics since time immemorial. The recent theoretical and experimental studies into Kitaev quantum spin-liquid in Co-based honeycomb materialsZhong et al. (2020); Liu and Khaliullin (2018), Dirac magnonsPershoguba et al. (2018) and topological spin excitationsChen et al. (2018) in honeycomb ferromagnets, non-reciprocal magnons in honeycomb antiferromagnetsMatsumoto and Hayami (2020), zig-zag Kurbakov et al. (2017) and incommensurate Nakua and Greedan (1995); Koo et al. (2016) spin ground states or 2D magnetism in Van-der-Waals materialsBurch et al. (2018) have resulted in enormous interest in these class of materials. Moreover, the spin-lattice coupling in several honeycomb magnets such as Fe4Nb2O9Maignan and Martin (2018), Na3Ni2SbO6 Werner et al. (2017), and Co4Nb2O9Khanh et al. (2019) have resulted in significant magnetoelectric coupling and hence motivating possible technological applications.
Ilmenite titantes with chemical formula TiO3 ( = Mn, Fe, Co, Ni) form an isostructural series of antiferromagnetic (AFM) compounds where magnetic ions in the basal -plane exhibit a buckled honeycomb-like structure. The ions are interconnected via oxygen ions (O2-) leading to -O- as the dominant superexchange pathway Goodenough and Stickler (1967). Along axis the crystal structure exhibits alternating layers of corner sharing TiO6 and O6 octahedra resulting in relatively weaker -O-Ti-O- superexchange pathways. Depending on the single ion-anisotropies of the respective metal ions, various magnetic ground states are realised in ilmenites, for example uniaxial AFM ground state with spins pointing along -axis in MnTiO3Shirane et al. (1959) whereas an easy-plane type AFM with spins lying in the -plane for NiTiO3 and CoTiO3Newnham et al. (1964) respectively.
Although, these compounds have been rigorously investigated since 1950s Shirane et al. (1959); Stickler et al. (1967); Heller et al. (1963); Goodenough and Stickler (1967); Akimitsu et al. (1970), recent studies evidencing linear magnetoelectric coupling in MnTiO3Mufti et al. (2011), large spontaneous magnetostriction in FeTiO3Charilaou et al. (2012), magnetodielectric and magnetoelastic coupling in NiTiO3Harada et al. (2016); Dey et al. (2020) and CoTiO3Dubrovin et al. (2020), respectively, as well as the observance of Dirac magnons in CoTiO3Yuan et al. (2020); Elliot et al. (2020) have peaked enormous interest in these class of materials.
The least investigated compound among the ilmenites family, i.e., NiTiO3, develops long-range AFM order at = 22.5 K Stickler et al. (1967); Watanabe et al. (1980); Harada et al. (2016); Dey et al. (2020). Recent studies of the dielectric permittivity and the thermal expansion show a pronounced magnetodielectric effect Harada et al. (2016) as well as distinct significant magnetoelastic coupling Dey et al. (2020). Notably, at , there is single energy scale dominantly driving the observed structural, magnetic and dielectric anomalies Dey et al. (2020). In this report, we study in detail the magneto-structural coupling of NiTiO3 by means of single crystal X-ray and neutron diffraction and high-resolution dilatometry. We observe by means of single-crystal neutron diffraction that the macroscopic structural symmetry(-3) is retained down to the lowest measured temperature of 2 K within the experimental resolution. In addition, the magnetic ground state of NiTiO3 is solved. At , in addition to long-range AFM order, a significant lattice distortion evolves revealing large spontaneous magnetostriction in NiTiO3. In applied magnetic fields, the multi-domain ground state evolves to a spin-reoriented single domain state characterized by spins aligned perpendicular to the applied magnetic field. Magnetostriction measurements in the low-field region show pronounced effects due to magnetoelastic domains and remarkably scales with magnetization measurements confirming both significant magneto-structural coupling and the magneto-structural domain model in NiTiO3.
II Experimental methods
Macroscopic single crystals of NiTiO3 have been grown by means of the optical floating-zone technique in a four mirror optical floating-zone furnace (CSC, Japan) equipped with 4150 W halogen lamps. Details of the growth process and characterization the single crystals have been published previously Dey et al. (2020). Single crystal X-ray intensity data were obtained at 100 K with an Agilent Technologies Supernova-E CCD 4-circle diffractometer (Mo-K radiation =0.71073 Å, micro-focus X-ray tube, multilayer mirror optics). Static magnetisation was studied in magnetic fields up to 5 T in a Quantum Design MPMS-XL5 SQUID magnetometer. The relative length changes were studied on a cuboid-shaped single crystal of dimensions mm3 by means of a three-terminal high-resolution capacitance dilatometer Küchler et al. (2012); Werner et al. (2017). Magnetostriction, i.e., field-induced length changes , was measured at several fixed temperatures in magnetic fields up to 15 T and the longitudinal magnetostriction coefficient was derived. The magnetic field was applied along the direction of the measured length changes.
Single crystal neutron diffraction experiments were performed up to 6 T magnetic fields on the D10 beamline of the Institut Laue-Langevin (ILL) at Grenoble, France. To determine the magnetic ground state at T, the four-circle configuration was used with a 9696 mm2 two-dimensional microstrip detector. An incident wavelength of 2.36 Å using a vertically focusing pyrolytic graphite (PG)(002) monochromator was employed. A pyrolytic graphite filter was used in order to suppress higher-order contamination to 10-4 times that of the primary beam intensity. Measurements were made in the temperature range 2-50 K. The magnetic field-driven evolution of the magnetic structure at K was studied by mounting the sample in a 6 T vertical cryomagnet and aligned to within 1∘ of magnetic field. The magnetic field was applied along the -axis limiting the scattering to the plane.
III Experimental results
III.1 Single-crystal X-ray Diffraction
To the best of our knowledge, the earlier studies of the ilmenite-type NiTiO3 crystal structure have been limited to powder diffraction experiments only Barth and Posnjak (1934); Shirane et al. (1959); Dey et al. (2020). We have re-investigated the crystal structure by means of single-crystal high resolution XRD at 100 K, using Mo K radiation ( = 0.71073 Å). A single crystal splinter of size 0.160.140.01 mm3 was broken of from larger specimen and used for data collection. A full shell of intensity data was collected up to 0.4 Å resolution (24180 reflections, 1028 independent [] of which 1024 were observed []). Detector frames (typically , occasionally -scans, scan width 0.5∘) were integrated by profile fittingKabsch (2001). Data were corrected for air and detector absorption, Lorentz and polarization effectscry (2011) and scaled essentially by application of appropriate spherical harmonic functions cry (2011); Blessing (1995); sca (2011). Absorption by the crystal was treated numerically (Gaussian grid) sca (2011); Busing and Levy (1957). An illumination correction was performed as part of the numerical absorption correctionsca (2011). Space group was assigned based on systematic absences and intensity statistics (refined obverse centered unit cell on hexagonal axes, Hall group , , ). This choice was confirmed by analysis of the symmetry of the phases obtained ab initio in P1. The structure was solved by intrinsic phasing She (2012-2018a); ruf (2014); sheldrick (2015a) and refined by full-matrix least-squares methods based on against all unique reflectionsShe (2012-2018b); Robinson and Sheldrick (1988); sheldrick (2008, 2015b). Three somewhat different models were employed for the atomic structure factors within the ISA approximation: conventional calculated with neutral atomsBrown et al. (2004) for Ni, Ti and O (model A) and two “ionic” modelsBrown et al. (2004) ( for Ni2+, Ti4+ taken from ref.Brown et al., 2004 and O2- from ref.Azavant and Lichanot, 1993 (model B) or ref.Morelhão, 2016, respectively (model C)). An empirical secondary extinction correction Robinson and Sheldrick (1988); Larson (1970) was applied in each case but proved insignificant. The different models refined to essentially the same structure, with only insignificant differences in key parameters like atom coordinates, factors, for all atoms and residual electron density. Ni-O and Ti-O bond lengths agreed within one standard deviation. There was no evidence of cation mixing and fully occupied sites were employed for all atoms. The results confirm the assignment of the space group and improve on the accuracy of the crystallographic parameters previously obtained from powder XRD and neutron data Barth and Posnjak (1934); Dey et al. (2020); Shirane et al. (1959). Fractional atomic coordinates, Wyckoff positions, site occupation and equivalent isotropic displacement parameters for model A are listed in table I ICS .
| Atom | Site | x | y | z | sof | Ueqa |
|---|---|---|---|---|---|---|
| Ni | 6c | 0 | 0 | 0.35051(2) | 1 | 0.00308(2) |
| Ti | 6c | 0 | 0 | 0.14422(2) | 1 | 0.00297(3) |
| O | 18f | 0.35198(8) | 0.03455(8) | 0.08662(2) | 1 | 0.00421(4) |
III.2 Single-crystal neutron diffraction
The crystal structure at lower temperatures and the magnetic ground state of NiTiO3 were determined by means of single-crystal neutron diffraction. At 50 K, 110 nuclear Bragg reflections were collected. Appropriate correction for extinction, absorption, and Lorentz factor was applied to all the nuclear Bragg peaks. All the nuclear peaks at 50 K were successfully indexed in the -3 space group with lattice parameters = 5.03 Å and = 13.789 Å.
In order to clarify the magnetic structure, preliminary reciprocal-space scans (not shown here) were performed at 2 K along the , and directions. The scans reveal a peak of significant intensity emerging at (0,0,1.5), indicative of the propagation vector k = (0,0,1.5). In order to determine the detailed magnetic structure, integrated intensities of 187 nuclear reflections allowed within the space group -3 and 292 satellite magnetic reflections were collected at 2 K. The nuclear structure was firstly refined using FULLPROF program within the -3 space group. The results of refinement are listed in table 2 and the observed and calculated intensities from the Rietveld fits are shown in Fig. 2(a). No peak splitting or significant broadening was observed within the experimental resolution in respective 2 K nuclear reflections as compared to 50 K, indicating that the macroscopic -3 symmetry is maintained until the lowest measured temperatures. The nuclear Bragg peaks show no temperature dependence between 2 K and 50 K excluding k = (0,0,0).
| Atom | Site | x | y | z | (Å2) |
|---|---|---|---|---|---|
| Ni1 | 6c | 0 | 0 | 0.3537(2) | 0.00748 |
| Ti1 | 6c | 0 | 0 | 0.1338(5) | 0.06643 |
| O1 | 18f | 0.3344(6) | 0.0052(1) | 0.2466(2) | 0.09830 |
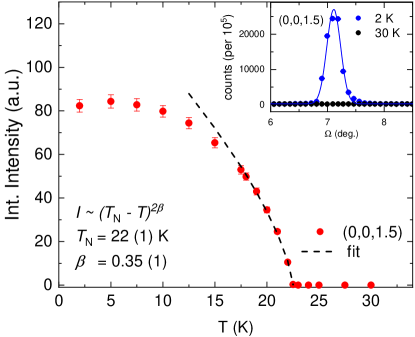
All the finite intensity magnetic peaks are observed at the general position + (0,0,1.5) with satisfying the reflection conditions of the -3 space group and hence confirming k = (0,0,1.5). A few of the observed high-intensity magnetic peaks are listed in Table 3. The largest diffraction intensity occurs for the magnetic Bragg peak (0,0,1.5) indicating that the Ni2+-moments lie in the plane which had been suggested by previous magnetization measurements Dey et al. (2020). The temperature dependence of the integrated intensity of the commensurate reflection (0,0,1.5) in Fig. 1 shows finite intensity below the magnetic ordering temperature. A power law fit in the critical region using where is the order parameter and results in = 22(1) K and . The obtained value from the power law fit agrees to the one from previous macroscopic studies Stickler et al. (1967); Watanabe et al. (1980); Harada et al. (2016); Dey et al. (2020). The obtained critical parameter indicates that Ni2+-spins in NiTiO3 are of 3D Heisenberg nature.
| Q | Iobs | Ical |
|---|---|---|
| (0,2,2.5) | 975(17) | 917 |
| (0,2,5.5) | 1410(27) | 1307 |
| (0,-1,5.5) | 2481(36) | 2685 |
| (0,0,4.5) | 2809(22) | 3348 |
| (1,-2,-1.5) | 1923(20) | 2045 |
| (1,-2,4.5) | 1755(22) | 1521 |
| (0,-1,2.5) | 1787(17) | 1965 |
| (-1,2,4.5) | 1812(48) | 1521 |
| (0,-1,8.5) | 1729(109) | 1679 |
| (0,0,1.5) | 4366(21) | 3942 |
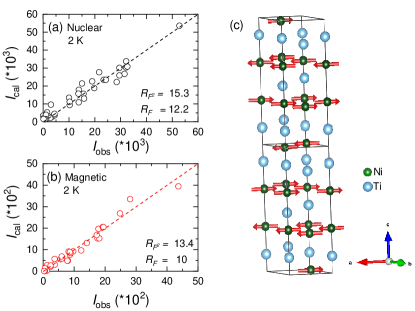
The knowledge of the propagation vector k = (0,0,1.5) with the Ni2+-moments lying in the hexagonal -plane points towards two possible magnetic models for NiTiO3: (a) FM layers stacked antiferromagnetically along the -axis or (b) AFM layers with the spins aligned ferromagnetically along the -axis. Previous static magnetic susceptibility vs. measurements reveal the decrease of below whereas stays nearly constant Watanabe et al. (1980); Dey et al. (2020). Moreover, the magnetic model (b) implies a zero magnetic structure factor at the position contrary to our observation. Hence model (a) is most suitable to describe the magnetic structure of NiTiO3. Hence, the obtained magnetic peaks at 2 K were refined against model (a) and a very good fit was obtained as shown in Fig. 4(b). The obtained magnetic structure of NiTiO3 re-confirms the structure proposed by Shirane et al. based on powder neutron data as early as 1959 Shirane et al. (1959). The calculated intensities of several high-intensity peaks are listed in Table 3 and the complete magnetic structure of NiTiO3 is schematically represented in Fig. 2(c). At K, the ordered moment amounts to 1.46(1) .
The crystal symmetry of the basal hexagonal planes is marked by the presence of two sets of three two-fold axes. Hence, the rotated by 120∘ in-plane spin-configurations are exactly equivalent leading to the presence of spin domains (i.e., three domains). Since the refinements are usually performed using the average of the integrated intensities of the equivalent reflections, the directions of the spins cannot be uniquely determined using single-crystal neutron diffraction alone, similar to the problem existing in the powder diffraction experiments Shirane et al. (1959). However, excellent agreement of the integrated intensities between the equivalent reflections ( indicates that there are likely three spin-domains of equal population with spins rotated by 120∘ in between the neighbouring domains.
III.3 Magneto-structural-dielectric coupling
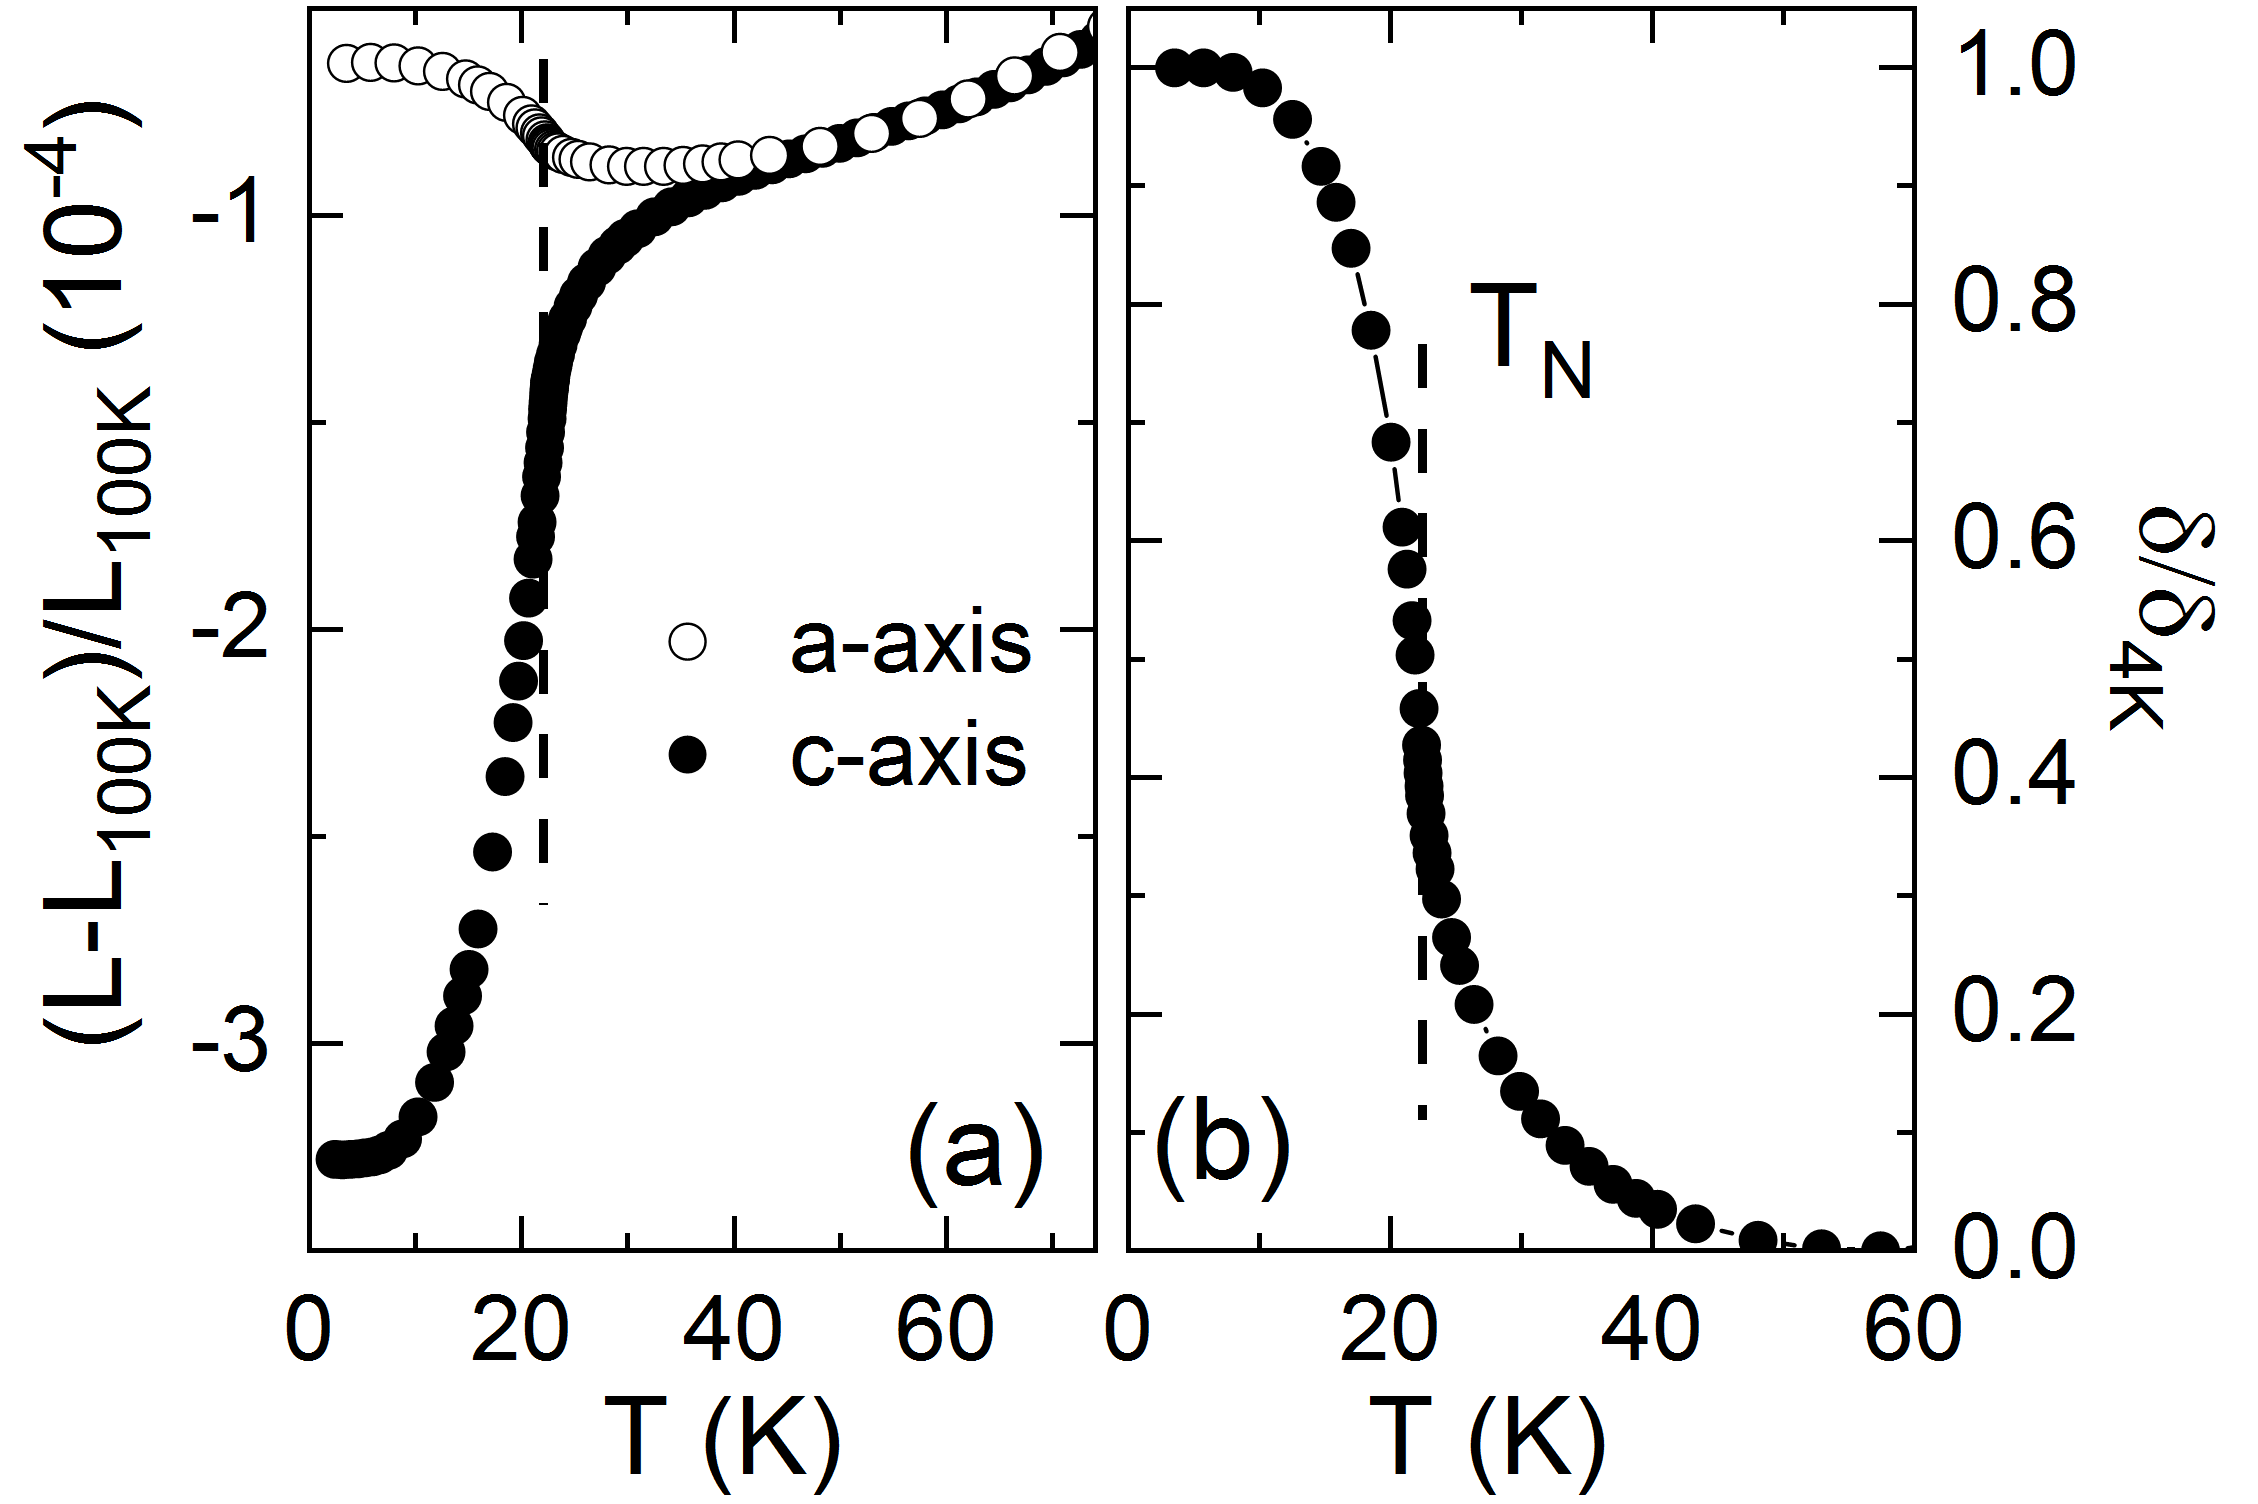
The magneto-structural coupling in NiTiO3 has been studied by means of high-resolution capacitance dilatometry. The uniaxial relative length changes () (Fig. 3(a)) versus temperature show abrupt changes at , i.e., shrinking of the -axis and expansion along the -axis, which demonstrates significant magnetoelastic coupling in NiTiO3. At higher temperatures K, isotropic thermal expansion coefficients results in similar rate of increase of along the - and the -axis, respectively. To further elucidate lattice changes at , the normalized distortion parameter , with , is shown in Fig. 3(b).
As evidenced by the distortion parameter, different behaviour of the - and -axis starts to evolve gradually below 50 K while sharply jumps at (Fig. 3(a)). Evidently, onset of long-range AFM order is associated with a large spontaneous magnetostricton effect and it implies strong magneto-structural coupling. Large spontaneous magnetostriction has also been observed in other ilmenites such as FeTiO3, The latter, however, shows a reversed magnetostrictive effect, i.e., there is an expansion of the -axis and shrinking of the -axis Charilaou et al. (2012). We attribute this difference to the differing magnetic ground states in FeTiO3 and NiTiO3 and corresponding variation in magneto-crystalline anisotropy. Finite distortion up to 50 K evidences a precursor phase with short-range order well above . Due to the observed strong magnetoelastic coupling we conclude the presence of short-ranged spin correlations persisting up to twice the transition temperature. This is corroborated by previous specific heat measurements Dey et al. (2020) on NiTiO3 which reveal that nearly 20% of magnetic entropy is consumed between and 50 K. In addition, it has been shown that q-dependent spin-spin correlations couple to the dielectric response via the coupling of magnetic fluctuations to optical phonons, thereby causing a significant magnetocapacitive effect Lawes et al. (2003). Accordingly, we conclude the significant magnetocapacitance of 0.01% and finite magnetostriction recently observed in NiTiO3 well above is due to persisting spin-spin correlations Harada et al. (2016); Dey et al. (2020).
III.4 Spin-reorientation
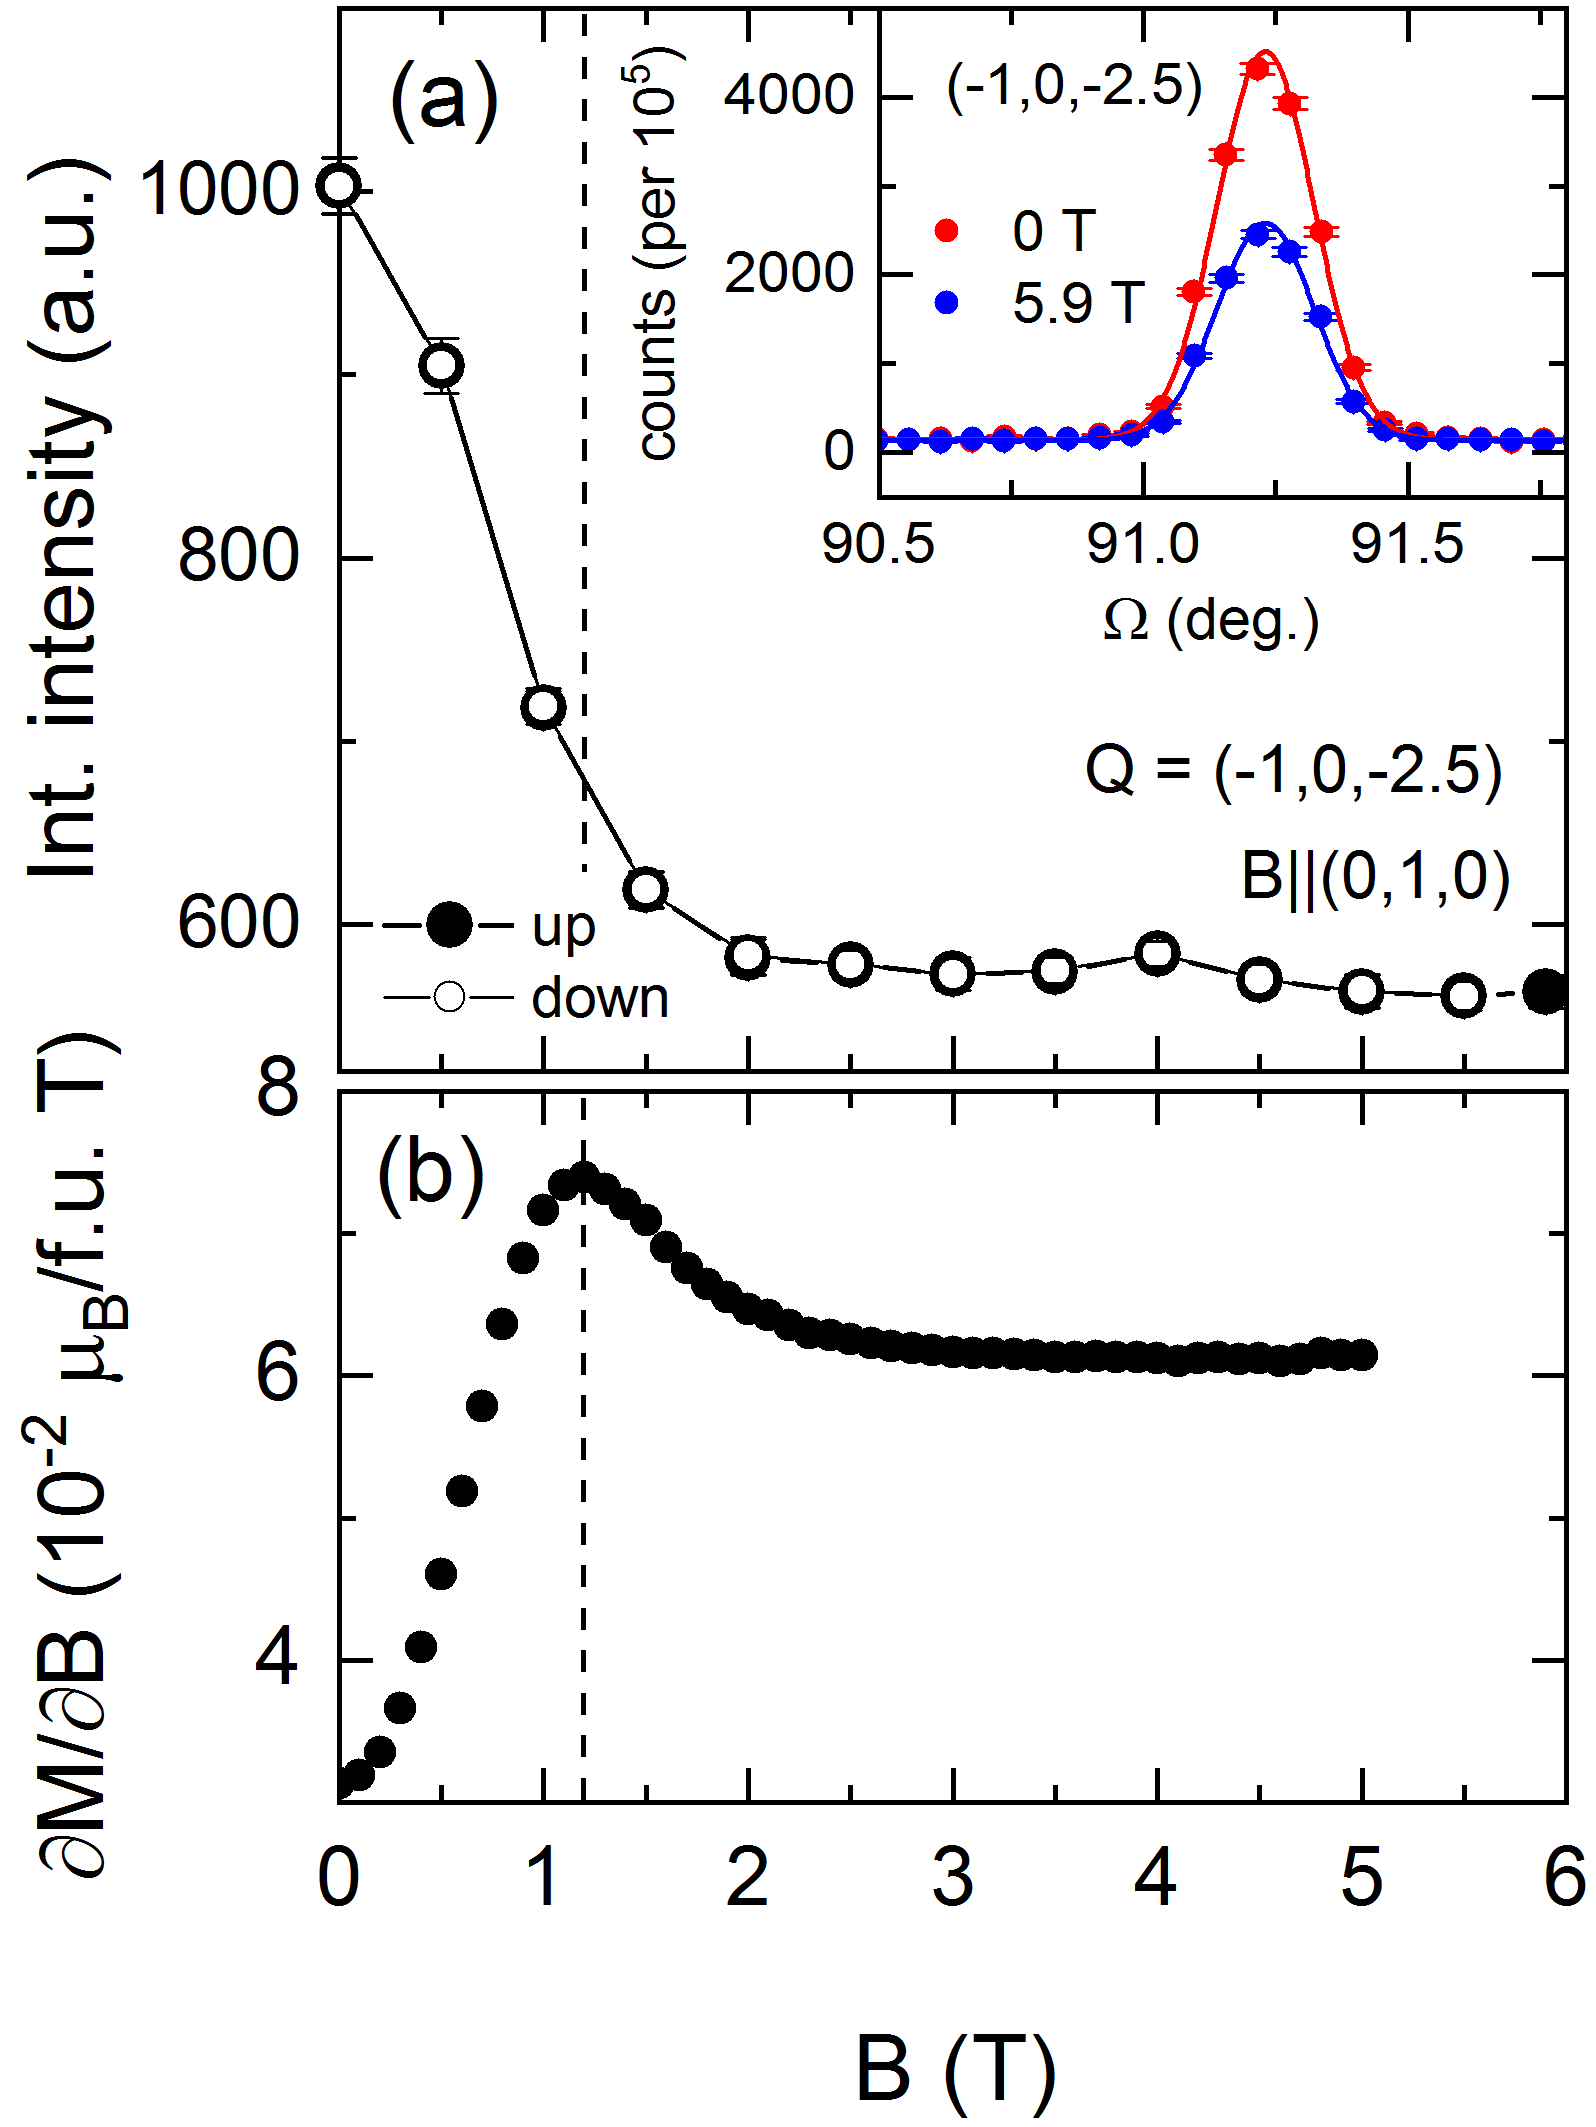
The effect of magnetic fields applied within the -plane on the crystal and magnetic structure of NiTiO3 is studied by means of in-field neutron diffraction at 2 K. Specifically, the magnetic field is applied vertically along -axis and the scattering vector lies in the plane. Several nuclear and magnetic reflections were measured with rocking curve scans in magnetic-fields up to 6 T. As will be discussed below, there is a considerable decrease in intensity upon application of the magnetic field for all magnetic peaks while in contrast there is no magnetic field effect on the nuclear peak intensities. A representative scan through the magnetic peak = (-1,0,-2.5) is shown in the inset to Fig. 4.
The magnetization curve displays a non-linear dependence on magnetic fields applied along the -plane as evidenced by the magnetic susceptibility in Fig. 4(b). The maximum in at T is indicative of a spin-reorientation transition. Correspondingly, the integrated magnetic intensity (Fig. 4(a)) shows a continuous decrease in magnetic fields up to 2 T above which it stays nearly constant at a finite value. Since the magnetic neutron diffraction intensity is proportional to the component of the magnetic moments perpendicular to the scattering vector, this observation indicates that in magnetic field the spins are rotated smoothly from three magnetic domains to a single domain state with spins are aligned perpendicular to fields above 2 T. Between 2 and 6 T, negligible field dependence indicates a very small canting of spins towards magnetic field. The FWHM calculated using Gaussian fits to nuclear peaks show negligible broadening up to 6 T indicating that the magnetostriction effects on lattice parameters corresponding to the spin-reorientation is below the experimental resolution.
III.5 Magnetostriction
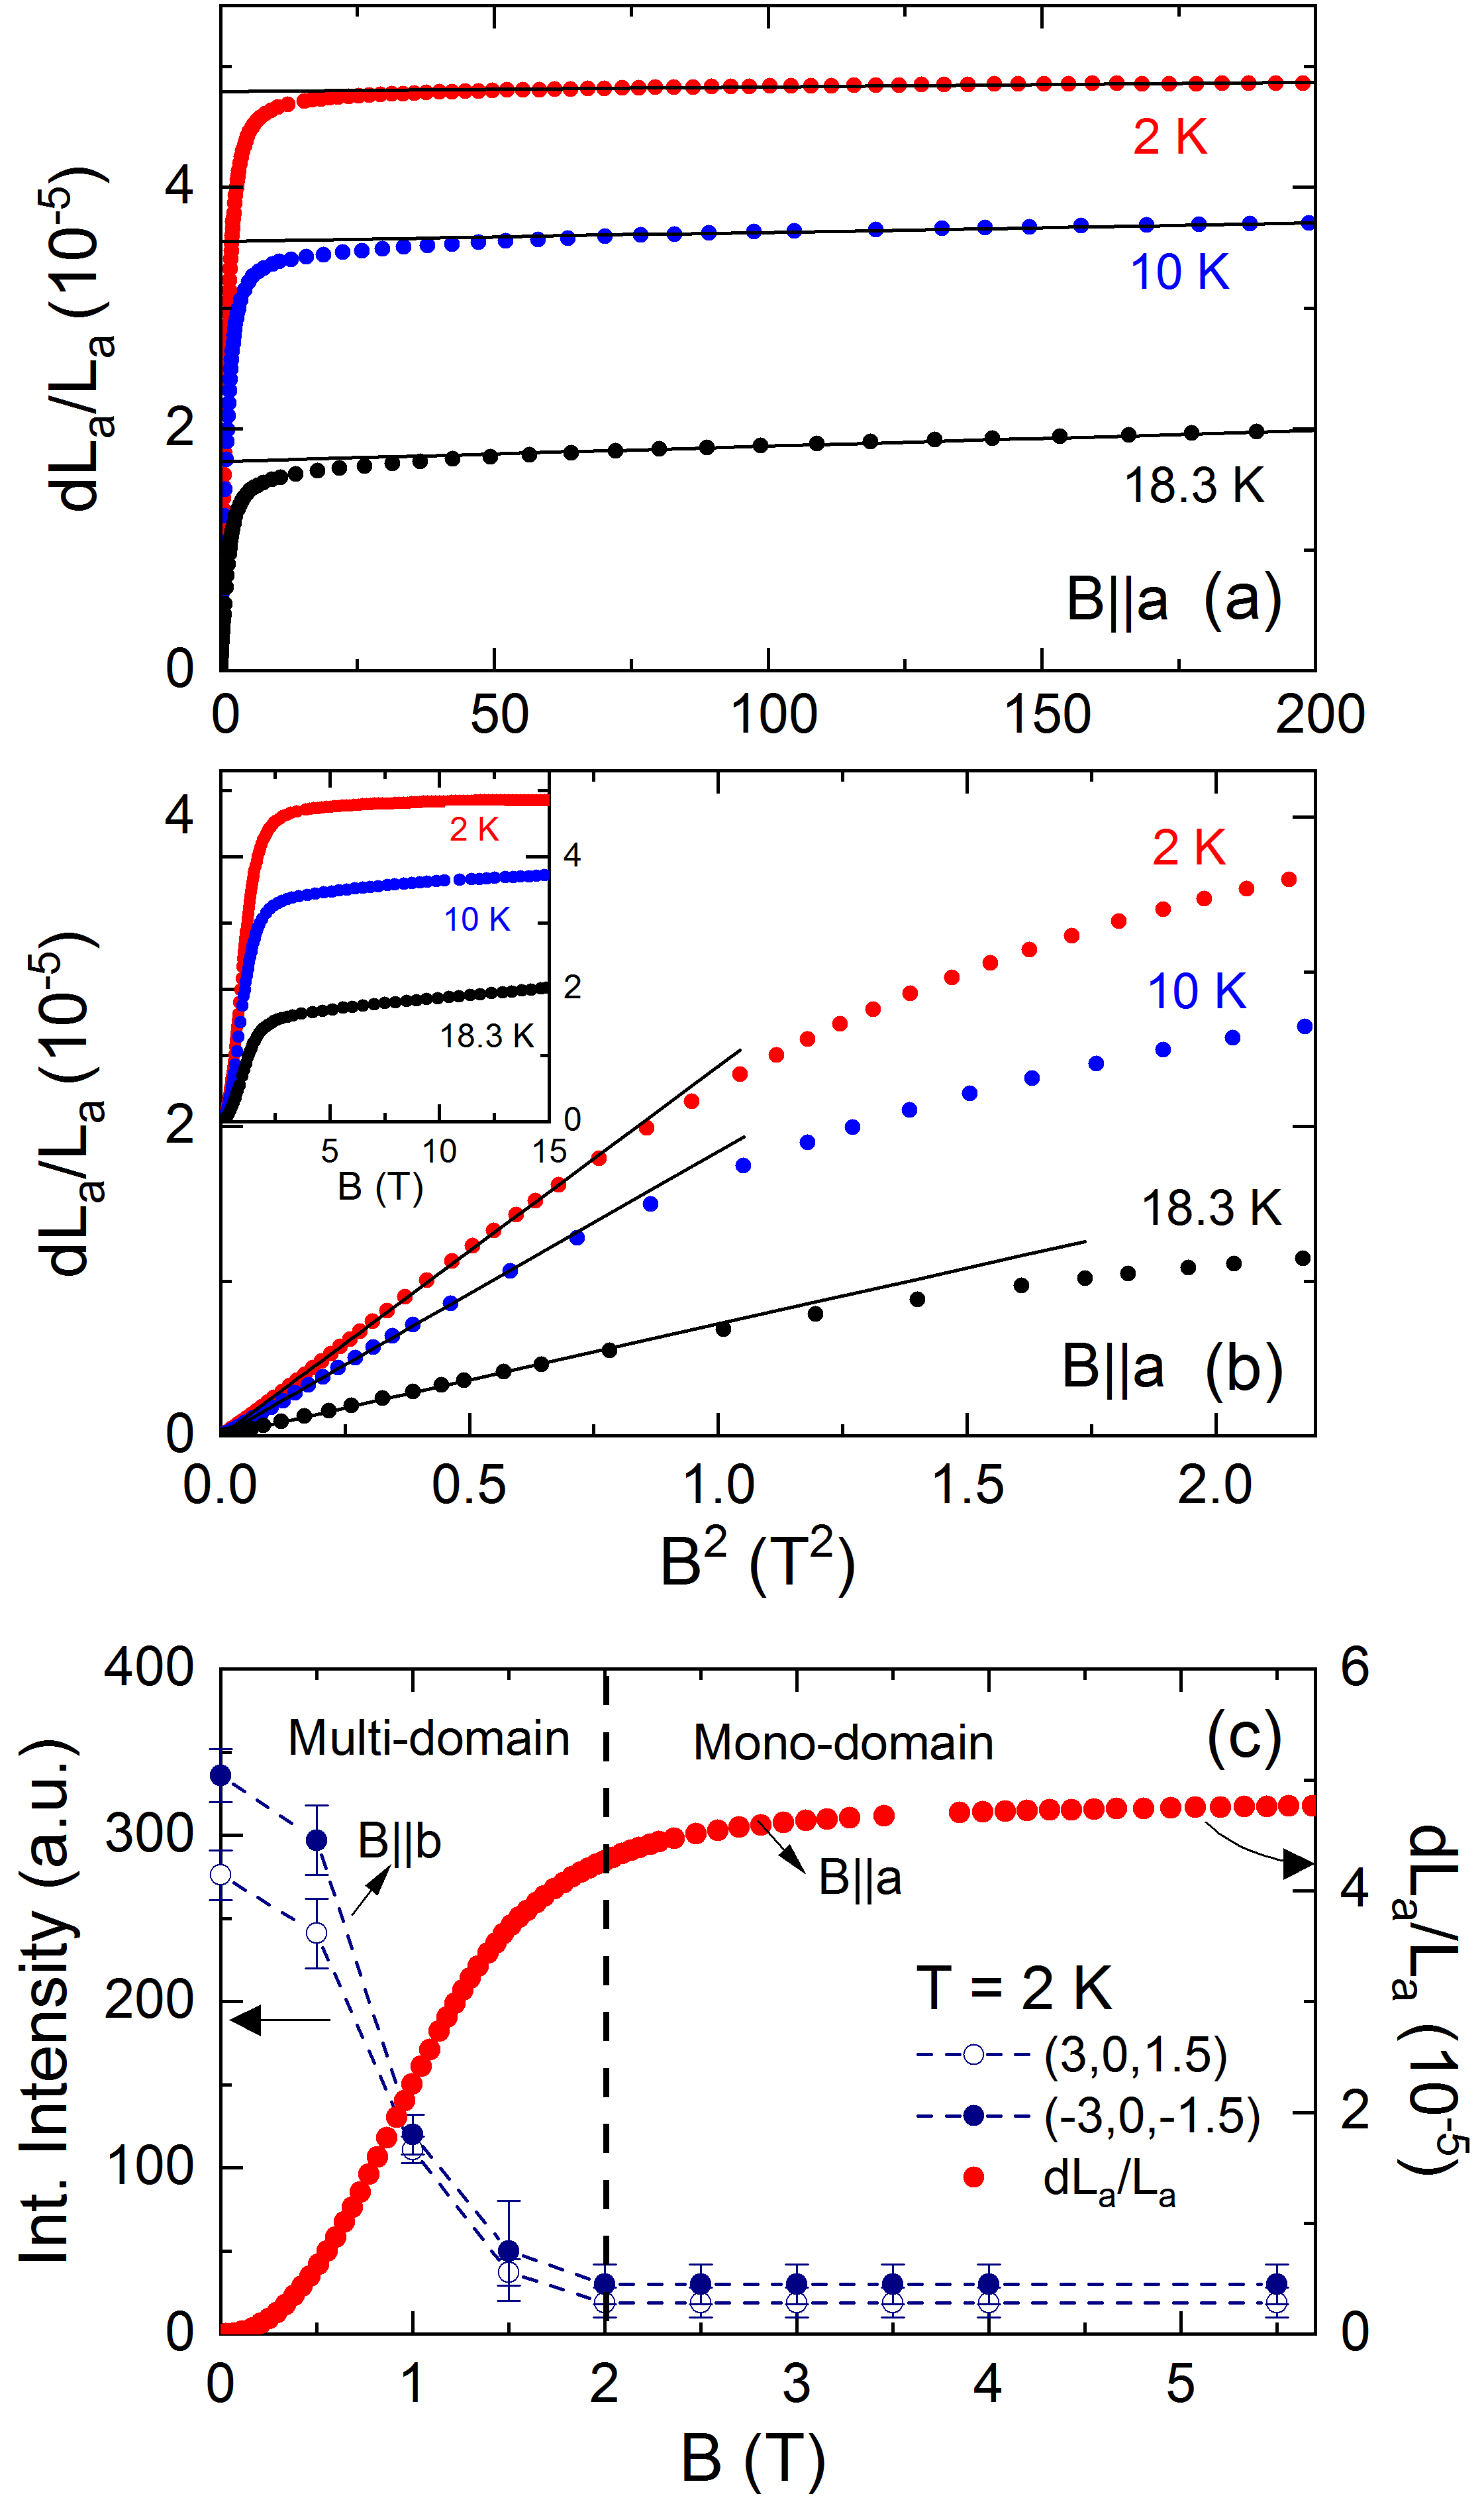
Applying magnetic fields along the -plane yields a pronounced increase of the associated lattice parameter in the low-field region ( T) while there is only small magnetostriction at higher fields (see Fig. 5). Magnetostriction is also reportedly small for fields applied along -axisDey et al. (2020). We conclude that this behaviour is associated with the field-driven collective rotation of spins as discussed above and evidenced by Fig. 4. However, as will be discussed below, the magnetisation changes do not scale with magnetostriction and the maxima in and do not match each other (see Fig. 8(a)). The magnetostriction data hence do not correspond to what is expected for a thermodynamic spin-reorientation transition. Instead, the presence of domains has to be involved and in the following we will present clear evidence that the data represents the change from a low-field multi-domain state to a high-field uniform mono-domain one.
In order to further investigate the effect of in-plane magnetic fields, the intensity evolution of two equivalent magnetic Bragg peaks (3,0,1.5) and (-3,0,-1.5) belonging to two different magnetic domains is displayed in Fig. 5(c). In the multidomain state, the antiferromagnetic vector is uniform within a single domain and has different directions in different domains. The observed isotropic decrease in intensity of both magnetic peaks upon application of the magnetic field implies that the spins of both domains rotate perpendicularly to the external field direction. The spin-rotation process is completed at which hence signals the formation of a spin-reoriented monodomain state. Accordingly, no significant changes in the peak intensities are observed above up to 6 T.
IV Discussion
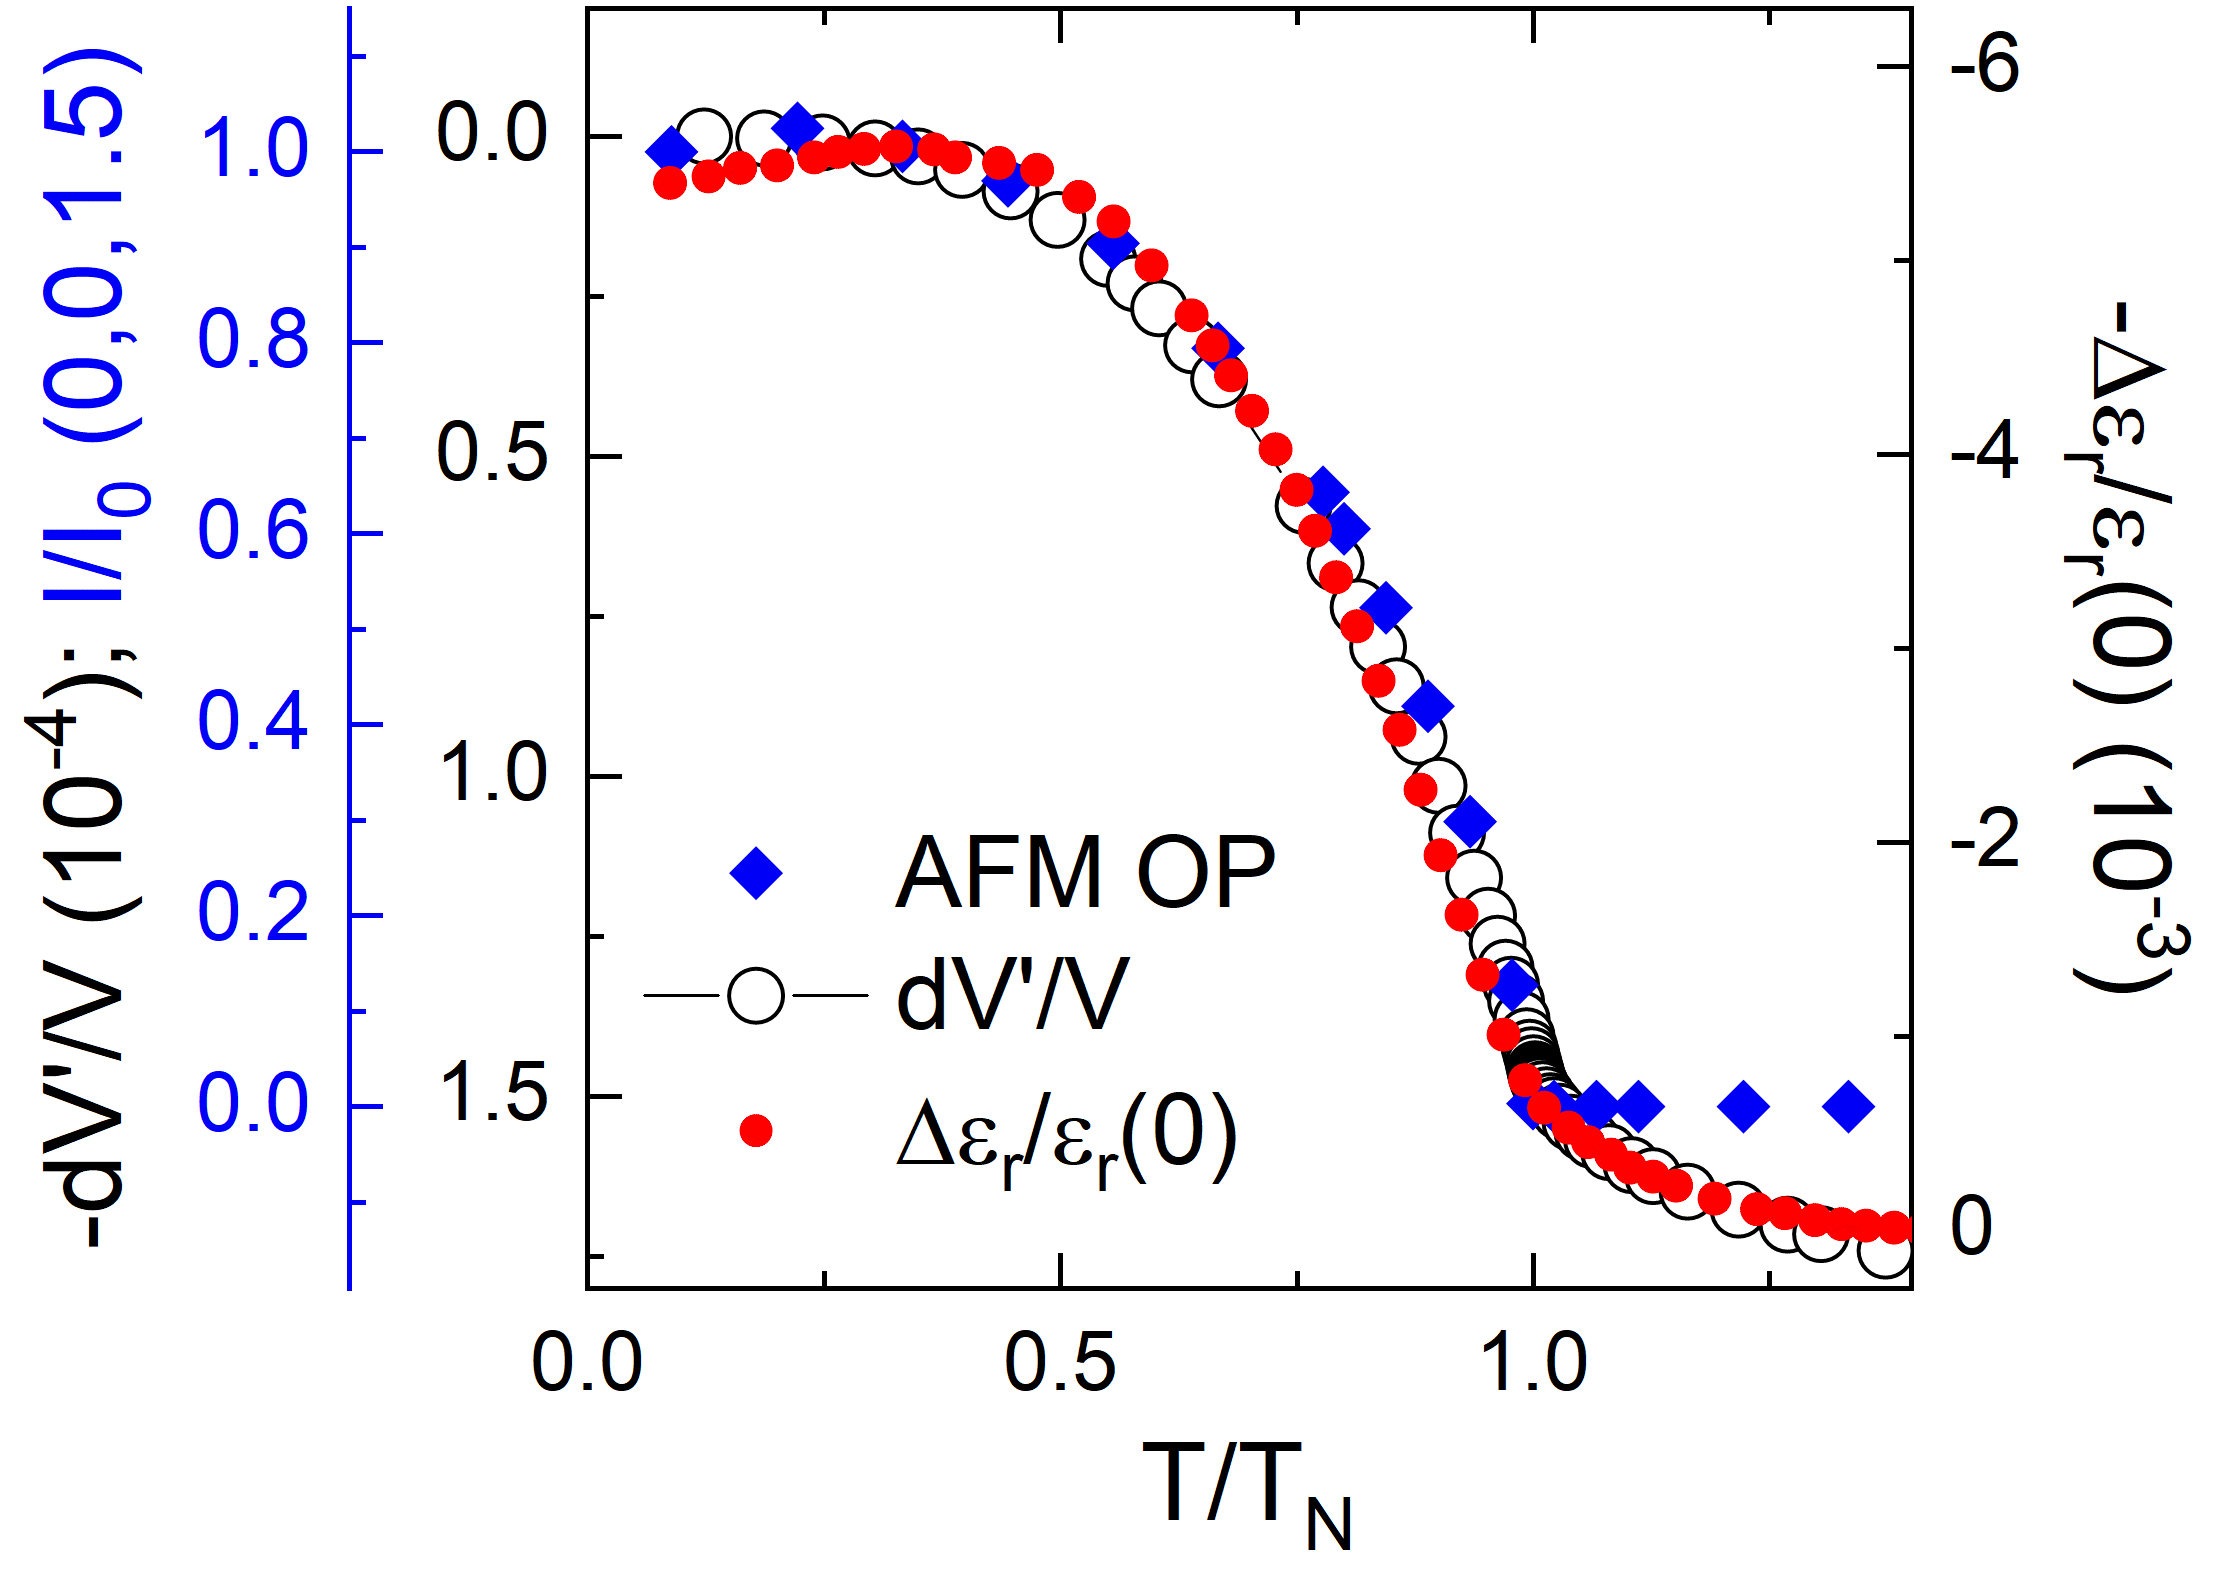
Comparison of the magnetic order parameter and the relative volume changes with the reported data of the dielectric function by Harada et al. Harada et al. (2016) elucidates the coupling mechanism between the lattice and the dielectric degrees of freedom in NiTiO3. As displayed in Fig. 6(a), the non-phononic relative volume changes which are obtained by subtracting the phononic contribution from (cf. Ref. Dey et al., 2020) show a very similar temperature dependence, below , as the normalized dielectric permitivitty. Note, that the polycrystalline sample studied in Ref. Harada et al., 2016 displays a slightly lower than the single crystals studied at hand. Note, that in general length changes can directly affect the experimentally measured permitivitty via the relation , where and are sample capacitance, vacuum permittivity, sample thickness and area, respectively. However, the changes in sample dimensions at are on the order of 10-4, while the relative change in permitivitty an order higher, implying that spontaneous magnetostriction is not the driving mechanism for the observed dielectric changes at . Interestingly, the normalized dielectric permitivitty varies as square of the antiferromagnetic order parameter ’’ represented by the normalized integrated intensity of the magnetic (0,0,1.5) Bragg peak in Fig. 6(a). In order to discuss this, we recall the Landau expansion of the free energy , in terms of polarization , and the sub-lattice magnetization at zero magnetic-field Sparks et al. (2014):
| (1) |
The dielectric function is obtained as . Hence Fig. 6(a) qualitatively evidences the presence of magnetodielectric coupling in NiTiO3. On top of the spin and dielectric changes, the structural changes exhibits similar behaviour below . Previously reported magnetic Grüneisen analysisDey et al. (2020) evidences that the entropic changes at to be of purely magnetic nature. In our opinion the spin-phonon coupling is responsible for observed dielectric changes at . In the presence of spin-phonon coupling the phonon frequency can be affected by spin-correlation as resulting in modification of permitivitty via the Lyddane-Sachs-Teller equation , where and are the permitivitty at zero frequency and optical frequency, respectively and and are the long-wavelength longitudinal and transverse optical phonon modes respectively.
It is noteworthy that apart from spontaneous magnetostriction, an exchange-striction (ES) mechanism may in principle also lead to spontaneous lattice deformation at and be a potential source for dielectric anomaly at . Magnetodielectricity fueled by ES mechanism have been observed in several systems for example Y2Cu2O5Adem et al. (2009) and TeCuO3Lawes et al. (2003). In FeTiO3 a combination of ES and magnetostriction mechanisms have been suggested for the spontaneous lattice deformation at Charilaou et al. (2012). In particular for NiTiO3 an ES mechanism would imply a change in Ni-O-Ni bond angle in the plane closer to 90∘ favouring ferromagnetic super-exchange. However, diffraction experiments reveal that the bond angle increases from 90.34∘ at 100 K to 90.36∘ at 2 K (supplementary Fig. 2), contrary to predictions of ES. Hence, ES mechanism is excluded as the origin of lattice distortion at in NiTiO3.
The crystallographic symmetry of the easy hexagonal plane in NiTiO3 suggests the presence of three domains with spins rotated by 120° in different domains. Such a spin structure with three domains is often observed in easy-plane-type hexagonal antiferromagnets such as CoCl2, NiCl2, and BaNi2V2O8 Wilkinson et al. (1959); Knafo et al. (2007). In NiTiO3, the magnetostriction data imply that the field-driven changes of the domain structure is associated with structural changes. Indeed, orientational AFM domains are magnetoelastic in nature Gomonaj and Loktev (1999); Gomonay and Loktev (2002) and have previously been observed in various systems, for example in cubic antiferromagnets RbMnF3 Shapira and Oliveira (1978), KNiF3 and KCoF3 Safa and Tanner (1978); Tanner (1979), NiO Yamada et al. (1966), iron-group dihalides CoCl2 Kalita et al. (2000) and NiCl2 Kalita et al. (2002), the quasi-two-dimensional AFM BaNi2V2O8 Knafo et al. (2007), YBa2Cu3O6.3 Gomonay and Loktev (2002) etc. In particular, Kalita and co-workers have developed phenomenological theories describing the effect of domain re-distribution on the magnetostriction for CoCl2 and NiCl2Kalita et al. (2000); Kalita and Lozenko (2001); Kalita et al. (2002, 2004, 2005). Note, that both NiCl2 and CoCl2 are easy-plane-type antiferromagnets with similar crystalline symmetry, i.e., trigonally distorted octahedral environment surrounding metal ions, similar to NiTiO3 and CoTiO3 Wilkinson et al. (1959); Lines (1963). In the following, we will describe the field-dependency of the lengths changes in NiTiO3 based on the phenomenological theories developed by Kalita and co-workers.
Both at low magnetic fields T and at high fields the field-induced striction varies as the square of the applied magnetic field as shown in Fig. 5(a,b). In the latter, i.e., the mono-domain state, this is predicted by calculating the equilibrium elastic strain by energy minimization of the magnetoelastic and the elastic contributions to the free energy Kalita et al. (2000, 2002). The magnetostriction in the mono-domain state is described by
| (2) |
where is the temperature dependent slope and is the spontaneous magnetostriction of the mono-domain state obtained by extrapolating the linear fit to T. Eq. 2 fits well with at different temperatures as shown by the solid black lines in Fig. 5(a). The obtained fit parameters are listed in Table 4. corresponds to a hypothetical spontaneous striction that would be observed if the magnetoelastic domains did not appear at low fields, i.e., if the total spontaneous magnetostriction was not compensated on the whole by summation of strains in different directions in each of the domains.
The magnetostrictive response upon application of magnetic fields in the multi-domain state is governed by domain-wall motion. Specifically, magnetostriction is large due to the associated facilitated rotation of spins. The motion of magnetoelastic domain-walls is predominantly reversible in nature Safa and Tanner (1978); Gomonaj and Loktev (1999) and the associated lengths changes again exhibit a square-dependence on the magnetic field which is expressed by
| (3) |
Here, is an empirical parameter obtained from the fits (see Table 4). As shown in Fig. 5(b), the experimental data are well described by Eq. 3 which is in-line with the predictions of phenomenological models Safa and Tanner (1978); Kalita et al. (2002). Although the magnetoelastic domains are predominately reversible in nature, a small irreversibility may arise due to pinning of domain walls by crystal defects and imperfections in the crystals. A small remanent striction amounting to , at K, is indeed observed in our data (see the Supplement Fig. 1) which indicates the presence of predominately mobile domain walls Gomonaj and Loktev (1999) in NiTiO3.
| (T) | ( (T2) | ||
|---|---|---|---|
| 2 K | 4.79 | 1.41 | 3.8 |
| 10 K | 3.55 | 1.38 | 7.6 |
| 18.3 K | 1.73 | 1.55 | 12.8 |

Unlike uniaxial antiferromagnets which show an abrupt magnetization jump at the spin-flop transition as, e.g., observed in MnTiO3 Yamaguchi et al. (1983), the magnetization in NiTiO3 follows a sickle-shaped field dependence in the non-flopped phase and the reorientation transition is associated with smooth right bending in vs. (see Fig. 7). Such characteristic smooth non-linear variation of magnetization in low-fields is a manifestation of the multi-domain state where spin-reorientation takes place gradually by displacement of domain walls Tanner (1979). This is described Kalita et al. (2005) by
| (4) |
where is the high-field magnetic susceptibility. A linear fit to the vs. curve Dey et al. (2020) at T yields /f.u.T which is represented by the solid blue line in Fig. 7. Using from the analysis of the magnetostriction data (see Table 4) enables to deduce the field dependence of . The simulation using Eq. 4 is shown by the dashed line in Fig. 7. It yields a good description of the field-driven evolution of the magnetization in the multi-domain state, thereby further confirming the applied phenomenological model. The blue line in Fig. 7 represents the expected magnetization in a single-domain easy-plane AFM with no in-plane anisotropy.
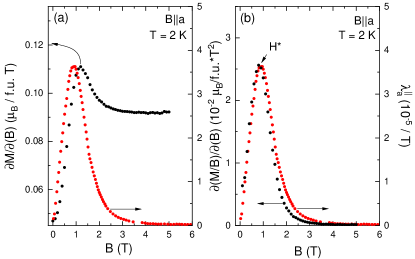
The field-driven disappearance of the multi-domain state yields different behaviour of the magnetic susceptibility and the magnetostriction . This is demonstrated in Fig. 8(a) where the derivative of the magnetization and the longitudinal magnetostriction coefficient are shown at K as a function of . The data are scaled to match the corresponding peak values. According to the Ehrenfest relation
| (5) |
Using molar volume 42.01 cm3/mol and 0.8 T (Fig. 8(b)), we obtain the normalized pressure dependency kbar-1. Positive magnetostriction in the mono-domain phase reveals that (see also Fig. 5 (a)) for each domain the in-plane distortion in magnetic field is such that the lattice expands perpendicular to the spin-direction. Hence, applying a uniaxial pressure will induce an anisotropy in plane favouring domains with spins nearly parallel to in the multi-domain phase.
The scaling of and at 2 K in Fig. 8(b) shows that the quantities vary proportional to each other in the multi-domain state peaking at . The proportional variation is consistent with equation 3 and is manifestation of magnetoelastic nature of the domains. The behaviour is expected from phenomenological theories of magnetoelastic domains which describe the variation of magnetization and length changes by means of a single domain co-alignment parameter and it’s variation with magnetic field Kalita et al. (2004).
Apart for large magneto-crystalline anisotropy which dictates the easy-plane spin structure in NiTiO3, an additional small in-plane anisotropy may arise due to frozen strains in the domain wallsLozenko and Ryabchenko (1974); Weber et al. (2003). Small in-plane anisotropy has been previously observed in other easy-plane type antiferromagnets like the dihalides NiCl2 ( 0.3 T) and CoCl2 ( 0.8 T) by means of low-frequency resonance experimentsLozenko and Ryabchenko (1974) and in CoTiO3( 1 meV) by means of INS experiments Elliot et al. (2020) respectively. Although bond anisotropic exchange interaction pinning the order parameters to the crystal axes Yuan et al. (2020) was suggested as the responsible mechanism for small in-plane gap in CoTiO3 we believe that a small in-plane anisotropy to be present in NiTiO3 corresponding to magnetoelastic domain walls.
V Summary
In summary, we have studied in detail the magneto-structural coupling in magnetodielectric NiTiO3 by means of single crystal neutron-diffraction and high-resolution dilatometry. Zero-field neutron diffraction reveals multidomain A-type spin antiferromagnetic ordering with preservation of crystallographic -3 symmetry down to 2 K. Zero-field thermal expansion measurements reveals spontaneous lattice deformation at . The dielectric permitivitty scales with the square of magnetic order parameter in line with predictions of Landau theory and hence indicating finite magnetodielectric coupling in NiTiO3. Our analysis suggests the presence of spin-phonon coupling as a responsible mechanism for dielectric anomaly at in NiTiO3. In-field neutron diffraction shows the evolution of magnetic domains with spins perpendicular to the applied field. The effect of magnetic domains on magnetostriction have been discussed in light of phenomenological multi-domain theories. We see magnetization and magnetostriction scale with each other in the multidomain state revealing strong coupling of spins to the lattice.
Acknowledgements.
This work has been performed in the frame of the International Max-Planck School IMPRS-QD. We acknowledge support by BMBF via the project SpinFun (13XP5088) and by Deutsche Forschungsgemeinschaft (DFG) under Germany’s Excellence Strategy EXC2181/1-390900948 (the Heidelberg STRUCTURES Excellence Cluster) and through project KL 1824/13-1.References
- Zhong et al. (2020) R. Zhong, T. Gao, N. P. Ong, and R. J. Cava, Sci. Adv. 6 (2020).
- Liu and Khaliullin (2018) H. Liu and G. Khaliullin, Phys. Rev. B 97, 014407 (2018).
- Pershoguba et al. (2018) S. S. Pershoguba, S. Banerjee, J. C. Lashley, J. Park, H. Ågren, G. Aeppli, and A. V. Balatsky, Phys. Rev. X 8, 011010 (2018).
- Chen et al. (2018) L. Chen, J.-H. Chung, B. Gao, T. Chen, M. B. Stone, A. I. Kolesnikov, Q. Huang, and P. Dai, Phys. Rev. X 8, 041028 (2018).
- Matsumoto and Hayami (2020) T. Matsumoto and S. Hayami, Phys. Rev. B 101, 224419 (2020).
- Kurbakov et al. (2017) A. I. Kurbakov, A. N. Korshunov, S. Y. Podchezertsev, A. L. Malyshev, M. A. Evstigneeva, F. Damay, J. Park, C. Koo, R. Klingeler, E. A. Zvereva, et al., Phys. Rev. B 96, 024417 (2017).
- Nakua and Greedan (1995) A. Nakua and J. Greedan, J. Solid State Chem. 118, 402 (1995).
- Koo et al. (2016) C. Koo, E. A. Zvereva, I. L. Shukaev, M. Richter, M. I. Stratan, A. N. Vasiliev, V. B. Nalbandyan, and R. Klingeler, J. Phys. Soc. Japan 85, 084702 (2016).
- Burch et al. (2018) K. S. Burch, D. Mandrus, and J.-G. Park, Nature 563, 47 (2018).
- Maignan and Martin (2018) A. Maignan and C. Martin, Phys. Rev. Materials 2, 091401(R) (2018).
- Werner et al. (2017) J. Werner, W. Hergett, M. Gertig, J. Park, C. Koo, and R. Klingeler, Phys. Rev. B 95, 214414 (2017).
- Khanh et al. (2019) N. D. Khanh, N. Abe, K. Matsuura, H. Sagayama, Y. Tokunaga, and T. Arima, Appl. Phys. L 114, 102905 (2019).
- Goodenough and Stickler (1967) J. B. Goodenough and J. J. Stickler, Phys. Rev. 164, 768 (1967).
- Shirane et al. (1959) G. Shirane, S. Pickart, and Y. Ishikawa, J. Phys. Soc. Japan 14, 1352 (1959).
- Newnham et al. (1964) R. E. Newnham, J. H. Fang, and R. P. Santoro, Acta Crystallographica 17, 240 (1964).
- Stickler et al. (1967) J. J. Stickler, S. Kern, A. Wold, and G. S. Heller, Phys. Rev. 164, 765 (1967).
- Heller et al. (1963) G. S. Heller, J. J. Stickler, S. Kern, and A. Wold, J. Applied Phys. 34, 1033 (1963).
- Akimitsu et al. (1970) J. Akimitsu, Y. Ishikawa, and Y. Endoh, Solid State Comm. 8, 87 (1970).
- Mufti et al. (2011) N. Mufti, G. R. Blake, M. Mostovoy, S. Riyadi, A. A. Nugroho, and T. T. M. Palstra, Phys. Rev. B 83, 104416 (2011).
- Charilaou et al. (2012) M. Charilaou, D. Sheptyakov, J. F. Löffler, and A. U. Gehring, Phys. Rev. B 86, 024439 (2012).
- Harada et al. (2016) J. K. Harada, L. Balhorn, J. Hazi, M. C. Kemei, and R. Seshadri, Phys. Rev. B 93, 104404 (2016).
- Dey et al. (2020) K. Dey, S. Sauerland, J. Werner, Y. Skourski, M. Abdel-Hafiez, R. Bag, S. Singh, and R. Klingeler, Phys. Rev. B 101, 195122 (2020).
- Dubrovin et al. (2020) R. M. Dubrovin, N. V. Siverin, M. A. Prosnikov, V. A. Chernyshev, N. N. Novikova, P. C. M. Christianen, A. M. Balbashov, and R. Pisarev, J. Alloys and Compounds p. 157633 (2020).
- Yuan et al. (2020) B. Yuan, I. Khait, G.-J. Shu, F. C. Chou, M. B. Stone, J. P. Clancy, A. Paramekanti, and Y.-J. Kim, Phys. Rev. X 10, 011062 (2020).
- Elliot et al. (2020) M. Elliot, P. A. McClarty, D. Prabhakaran, R. D. Johnson, H. C. Walker, P. Manuel, and R. Coldea (2020), eprint arXiv:2007.04199.
- Watanabe et al. (1980) H. Watanabe, H. Yamauchi, and H. Takei, J.Magn. Magnetic Mat. 15-18, 549 (1980).
- Küchler et al. (2012) R. Küchler, T. Bauer, M. Brando, and F. Steglich, Rev. of Sci. Instruments 83, 095102 (2012).
- Barth and Posnjak (1934) T. Barth and E. Posnjak, Zeit für Krist. p. 271 (1934).
- Kabsch (2001) K. Kabsch, International Tables for Crystallography, vol. F (Kluwer Acic Publishers, Dordrecht, 2001).
- cry (2011) CrysAlisPro, Agilent Technologies UK Ltd., Oxford (2011).
- Blessing (1995) R. H. Blessing, Acta Cryst. A51 (1995).
- sca (2011) SCALE3 ABSPACK, CrysAlisPro, Agilent Technologies UK Ltd., Oxford (2011).
- Busing and Levy (1957) W. R. Busing and A. Levy, Acta Cryst. 10 (1957).
- She (2012-2018a) SHELXT, University of Göttingen and Bruker AXS Gmbh, Karlshruhe, Germany (2012-2018a).
- ruf (2014) M. Ruf, B. C. Noll, Application note SC-XRD 503, Bruker AXS Gmbh, Karlshruhe, Germany (2014).
- sheldrick (2015a) G. sheldrick, Acta Cryst. A71 (2015a).
- She (2012-2018b) SHELXL-20xx, University of Göttingen and Bruker AXS Gmbh, Karlshruhe, Germany (2012-2018b).
- Robinson and Sheldrick (1988) W. Robinson and G. M. Sheldrick, Crystallographic Computing 4 (IUCr and Oxford University Press, Oxford, UK, 1988).
- sheldrick (2008) G. sheldrick, Acta Cryst. A64 (2008).
- sheldrick (2015b) G. sheldrick, Acta Cryst. C71 (2015b).
- Brown et al. (2004) P. J. Brown, A. G. Fox, H. H.-C., J. I. Langford, H. Lipson, E. N. Maslen, M. A. O’Keefe, T. M. Sabine, and B. T. M. Willis, International Tables for Crystallography, vol. C (Kluwer Academic Publishers, Dordrecht, The Netherlands,, 2004), 3rd ed.
- Azavant and Lichanot (1993) P. Azavant and A. Lichanot, Acta Cryst. A49 (1993).
- Morelhão (2016) Morelhão, Computer simulation tools for X-ray analysis (Springer International Publishing Cham, Switzerland, 2016), 3rd ed., URL http://http://xraybook.if.usp.br.
- Larson (1970) A. C. Larson, Crystallographic computing (Munksgaard, Copenhagen, Denmark, 1970).
- (45) CSD 2062660 (model A), 2062661 (model B) and 2062662 (model C) contains the supplementary crystallographic data for this paper. These data can be obtained from the Cambridge Crystallographic Data Centre’s and FIZ Karlsruhe’s joint Access Service via https://www.ccdc.cam.ac.uk/structures/?
- Lawes et al. (2003) G. Lawes, A. P. Ramirez, C. M. Varma, and M. A. Subramanian, Phys. Rev. Lett. 91, 257208 (2003).
- Sparks et al. (2014) T. D. Sparks, M. C. Kemei, P. T. Barton, R. Seshadri, E.-D. Mun, and V. S. Zapf, Phys. Rev. B 89, 024405 (2014).
- Adem et al. (2009) U. Adem, G. Nénert, Arramel, N. Mufti, G. R. Blake, and T. T. M. Palstra, Eur. Phys. J. B 71, 393 (2009).
- Wilkinson et al. (1959) M. K. Wilkinson, J. W. Cable, E. O. Wollan, and W. C. Koehler, Phys. Rev. 113, 497 (1959).
- Knafo et al. (2007) W. Knafo, C. Meingast, K. Grube, S. Drobnik, P. Popovich, P. Schweiss, P. Adelmann, T. Wolf, and H. v. Löhneysen, Phys. Rev. Lett. 99, 137206 (2007).
- Gomonaj and Loktev (1999) E. V. Gomonaj and V. M. Loktev, Low Temp. Phys. 25, 520 (1999).
- Gomonay and Loktev (2002) H. Gomonay and V. M. Loktev, J. Phys.: Cond. Matter 14, 3959 (2002).
- Shapira and Oliveira (1978) Y. Shapira and N. F. Oliveira, Phys. Rev. B 18, 1425 (1978).
- Safa and Tanner (1978) M. Safa and B. Tanner, Phil. Mag. B 37, 739 (1978).
- Tanner (1979) B. Tanner, Contemporary Phys. 20, 187 (1979).
- Yamada et al. (1966) T. Yamada, S. Saito, and Y. Shimomura, J. Phys. Soc. of Japan 21, 672 (1966).
- Kalita et al. (2000) V. M. Kalita, A. F. Lozenko, and S. M. Ryabchenko, Low Temp. Phys. 26, 489 (2000).
- Kalita et al. (2002) V. M. Kalita, A. F. Lozenko, and P. A. Trotsenko, Low Temp. Phys. 28, 263 (2002).
- Kalita and Lozenko (2001) V. M. Kalita and A. F. Lozenko, Low Temp. Phys. 27, 645 (2001).
- Kalita et al. (2004) V. M. Kalita, A. F. Lozenko, P. A. Trotsenko, and T. M. Yatkevich, Low Temp. Phys. 30, 27 (2004).
- Kalita et al. (2005) V. M. Kalita, A. F. Lozenko, S. . M. Ryabchenko, and P. A. Trotsenko, Low Temp. Phys. 31, 794 (2005).
- Lines (1963) M. E. Lines, Phys. Rev. 131, 546 (1963).
- Yamaguchi et al. (1983) H. Yamaguchi, H. Hiroyoshi, M. Yamada, H. Watanabe, and H. Takei, J. Mag. Magnetic Mat. 31-34, 1071 (1983).
- Lozenko and Ryabchenko (1974) A. F. Lozenko and S. M. Ryabchenko, Soviet J. Exp. Theo. Phys. 38, 538 (1974).
- Weber et al. (2003) N. B. Weber, H. Ohldag, H. Gomonaj, and F. U. Hillebrecht, Phys. Rev. Lett. 91, 237205 (2003).