footnote
FIXME: Enhance Software Reliability with Hybrid Approaches in Cloud
Abstract
With the promise of reliability in cloud, more enterprises are migrating to cloud. The process of continuous integration/deployment (CICD) in cloud connects developers who need to deliver value faster and more transparently with site reliability engineers (SREs) who need to manage applications reliably. SREs feed back development issues to developers, and developers commit fixes and trigger CICD to redeploy. The release cycle is more continuous than ever, thus the code to production is faster and more automated. To provide this higher level agility, the cloud platforms become more complex in the face of flexibility with deeper layers of virtualization. However, reliability does not come for free with all these complexities. Software engineers and SREs need to deal with wider information spectrum from virtualized layers. Therefore, providing correlated information with true positive evidences is critical to identify the root cause of issues quickly in order to reduce mean time to recover (MTTR), performance metrics for SREs. Similarity, knowledge, or statistics driven approaches have been effective, but with increasing data volume and types, an individual approach is limited to correlate semantic relations of different data sources. In this paper, we introduce FIXME to enhance software reliability with hybrid diagnosis approaches for enterprises. Our evaluation results show using hybrid diagnosis approach is about 17% better in precision. The results are helpful for both practitioners and researchers to develop hybrid diagnosis in the highly dynamic cloud environment.
Index Terms:
event management, hybrid system, event correlation, localization, cloudI Introduction
With the promise of reliability, cloud has become more flexible and dynamic to provide continuous software development and deployment. While the contemporary microservices architecture has simplified the scope of software developers through well defined representational state transfer application programming interfaces (REST APIs), roles of site reliability engineers (SREs) towards availability, latency, performance, efficiency, change management, monitoring, emergency response, and capacity planning have become even more complex. Container deployments are more dynamic than ever, with lifespans of 10 seconds or less becoming increasingly prevalent, emphasizing the need for real-time visibility that delivers detailed audit and forensics records [1]. The ephemeral and immutable nature of containers is advantageous for development and operations (DevOps), but simultaneously can be challenging for software developers and SREs to correctly diagnose incidents and resolve them timely. Based on 2020 SRE report, 80% of SREs work on post-mortem analysis of incidents due to lack of provided information and 16% of toil come from investigating false positives/negatives [2, 3].
As shown in Figure 1, cloud has adopted more virtualization technologies, in turn virtualized layers stack up to run applications and the number of applications running in one node increases. This also means that any virtualized layer below applications can have direct impact on running applications. This increased scope of application impact is not only derived from server virtualization, but also from network virtualization. A microservices architecture has driven this as the number of containers is more than the same type of a monolithic application. That is, more information such as logs, alerts, metrics are generated, thus consolidating these information in a meaningful way becomes intractable. As noted in [2]41% of SREs have answered half or more of their work is toil, when dealing with the high amounts of toil in an organization, the underlying reasons are lack of intelligence and automation. To cope with this hardship, artificial intelligence for IT operations (AIOps) has emerged to help SREs to recognize serious issues faster and with greater accuracy than humans. The ultimate objective of AIOps is to minimize mean time to recover (MTTR) by providing software engineers and SREs with localized and correlated information. MTTR spans different stages including mean-time-to-detect (MTTD), -identify (MTTI), -know (MTTK), -repair (MTTRepair), and -resolve (MTTResolve). From the large amount of data, the problem determination and information correlation are the keys to start with the right problem and correct information. Not to mention that this reduces the number of false positives/negatives.

From various data sources such as logs, alerts, metrics, anomaly events, and the like, the premise of information consolidation is that information have some common elements to each other, appear within a time window, and occur in a proximity of location. The two main bodies of research include event correlation [4] and problem localization [5, 6]. In large, similarity-based, knowledge-based, and statistical approaches have been used to identify patterns and groups, filter and prioritize the events [4, 5] for both pre-mortem and post-mortem analysis. However, in AIOps, not one approach can always perform better than others because it is extremely hard to identify underlying patterns of different data sources of all levels and also generalize knowledge obtained from one application to another. In practice, a hybrid or ensemble approach would usually result in better correlation results [7, 8, 9].
In this paper, we introduce hybrid methodologies for AIOps used in production, and evaluate how they improve problem determination and information correlation. Our contributions include the following:
-
•
Explore various data sources in cloud native environment and their normalization,
-
•
Find patterns defined by complex predicates in large, constantly changing datasets,
-
•
Introduce hybrid diagnosis approaches for entity resolution and event correlation,
-
•
Incorporate continuous learning with feedback, and
-
•
Evaluate the hybrid diagnosis approaches and the impact of the continuous learning.
II Background and Challenges
Monitoring system is an automated system that provides an effective and reliable means of ensuring that anomalous behavior or degradation of the vital signs of hybrid application is flagged as a problem candidate (monitoring event) and sent for diagnosis and resolution. Events from hybrid environment are consolidated in an enterprise event management system (EM). EM often incorporates rules that define whether to create an incident record (ticket) for IT problem reporting. In some cases, SREs analyze incoming events or symptoms before deciding on creating a ticket. Tickets are collected by Incident, Problem, and Change (IPC) system. Independently, the information is also collected by myriad of tools that ingest data from various sources and provide events of their own.
Operations or SREs perform problem determination, diagnosis, and resolution based on the symptoms information in the ticket. In the interviews conducted with SREs, they have identified diagnosis as the most difficult task. The majority of SREs have pointed out that given right diagnosis, they would be able quickly to derive actions required to resolve the issue. Being able to troubleshoot a problem and to arrive to a diagnosis is often considered to be an innate skill [10]. Problem determination is a labor-intensive process, and Operations/SREs use any help they could get from analytics. There has been a great deal of effort spent on developing methodologies for specifying and reasoning about symptoms/signals provided through monitoring of systems, be they hardware or software.
While there is large body of techniques in existence, each technique is usually focused on a single type of data (events or log anomalies or metric analysis). Lately, a number of service providers have embarked on extending their existing analytics to other data types. The benefit of this approach is shortening time to market through adaptation of well-researched capabilities; one obvious drawback is that performance of any methodology is optimized for specific data, and it does not perform as well on different data types. In this paper we present in-depth review of the operational data types and combinations of algorithms for working with each data type to achieve a goal of identifying a group of symptoms with a common root cause and localizing the problem.
Although the methodology we describe is successfully used for identification and linkage of symptoms from variety of data sources, we are not able to adjust for some changes in the architecture and monitoring strategy. It is imperative to continue improving the models through continuous learning and feedback. We point out that in our experience, SREs do not tend to provide an extensive feedback and more often than not their feedback is limited to thumbs-up/thumbs-down response. Learning from this feedback is a challenge if the insight that they assess is complex. For example, a negative feedback received for a grouping of symptoms is missing critical information about which signals do not belong to the group. In this paper we describe an approach to using their minimal feedback efficiently.
It is a widely accepted fact today that operational data poses additional challenges in comparison to social data for example. In this paper we describe various data types used in operations and challenges associated with it. To name a few, some IT data is often created using templates by different developers, so the content of data of the same type could vary drastically; data that represents a symptom of a problem only makes sense in the context of system/application configuration or resource, however this critical information is often embedded in the text and not provided as first class item.
III Related Work
The main body of related researches is information (events or alerts) correlation. Prior arts for information correlation are categorized into similarity based, knowledge based and statistical approaches. The similarity-based event correlation works on the premise that two events that have similar root causes should be grouped together. The base logic is to compute similarity between the feature spaces of data and measure the score [11, 12, 13]. For example, a weighted sum of feature similarity of two data points is used to measure the score [14]. One of the most popular similarity based methods is clustering. The clustering divides data into a number of groups such that data in the same group are more similar than other data in other groups. Klaus [15] proposes an alert clustering approach for identification of root causes that trigger the alert. Vaarandi [16] clusters for log event data which helps one to detect frequent patterns from logs, to build log profiles, and to identify anomalous logs.
Experience based knowledge often becomes the source of intelligence or automation, which can be turned into rules, templates, or scenarios. Kabiri et. al. [17] propose a rule-based temporal alert correlation system that uses an inference engine to aggregate redundant alerts and derive correlation between alerts using a scenario-based knowledge base. Klaus [18] mines rules by learning from previous events, and use these rules to cluster the new incoming events as they occur. Dain et. al. [19] map each incoming event to one of the manually prepared predefined scenarios or patterns, where each scenario represents a sequence of actions. Another type of the knowledge based approach is expert systems. The expert systems aim at reproducing the performance of a human expert. The approaches under expert systems constitute building a simulator that generates alerts [20] or learns alert scenarios [21, 22, 23, 24, 25] on software applications to simulate the various faults, further models are proposed for an event correlator [26, 27] that correlates related events.
Statistical traits find latent characteristics of data and join them in meaningful ways towards the objective. Many prior arts use machine learning algorithms to find patterns of data points and the repetition patterns [28]. Among them, Dain et. al. [29] mine scenarios from historical events, and classify each incoming event into one of the candidate scenarios using probabilistic methods. Smith et. al. [30] use a hierarchical unsupervised machine learning structure to identify the first and second levels of groups that bubble up. They also use an auto-encoder to learn the event distribution, and to correlate events together. Pietraszek et. al. [28] propose an ensemble approach to use various machine learning algorithms such as support vector machines, decision trees and naïve bayes to suppress false positives. Peter et. al. [31] define activation patterns that store information in an associative network graph and perform a graph analysis to find common patterns based on nominal and distance based features.
To the best of our knowledge, we are the first to investigate the hybrid diagnosis system that spans all of similarity based, knowledge based, and statistical approaches for entity resolution and event correlation.
IV Data
As a rule of thumb to build AI systems, results can only be as good as quality of data. Understanding types of data and guaranteeing data quality are the first steps towards a better AI system. This section defines terminologies and discusses details about input data.
IV-A Terminology
An event indicates that something of note has happened and is associated with one or more applications, services, or other managed resources. For instance, a container has moved to new node, column added to a DB table, a new version of an application is deployed, or memory or CPU exhausted. One or more events can turn into any form of alerts or anomalies based on the deviation from what is defined as standard, normal or expected. Anomaly detection (a.k.a. outlier analysis) is a step in data mining that identifies events and/or observations that deviate from a dataset’s normal behavior. Anomalous data can indicate critical incidents, such as a technical glitch, or potential opportunities, for instance a change in consumer behavior.
An alert is a record (type) of an event indicating a (fault) condition in the managed environment. It requires or will require in the future, human or automatic attention and actions toward remediation. For instance, disk drive failure or network link down could be alerts. An incident represents a reduction in the quality of a business application or service. It is driven by one or more alerts. Incidents require prompt attention. For instance, application unresponsive or storage array inaccessible could be serious outages. A ticket is an actionable or incident embodied in a service desk tool, where the client has decided to use one. A change record is a description of a change that should be deployed, including configuration changes, code changes, security updates, and so on.
IV-B Logs / Metrics
Logs and metrics are two fundamental data sources generated from every level of components as shown in Figure 1. A log is an event happened and a metric is a measurement of the health of a system. In general, logs include informational, debug, warning, error, and critical depending on the severity. In production systems, only warning, error and critical logs may be collected. In each log line, details about the event such as a resource that was accessed, who accessed it, and the time are included. Each log is meant to have different sets of data so that the problem localization can be obvious.
While logs are about a specific event, metrics are a measurement at a point in time. Each metric data point can have value, timestamp, and identifier of what that value applies to (like a source or a tag). While logs may be collected any time an event takes place, metrics are typically collected at fixed-time intervals, thus called a time-series metric. A sudden rise and spike of CPU or memory utilization render alerts. However, without logs, it is hard to understand what causes such spikes. Therefore, bringing together both logs and metrics can provide much more clarity. During spikes, there may be some unusual log entries indicating the specific event that caused the spike.
From logs and metrics, SREs look for important signals that can lead to the problem diagnosis and potentially resolution. Broadly, four golden signals111https://landing.google.com/sre/sre-book/chapters/monitoring-distributed-systems are known as the most helpful signals (events):
Latency: Latency is the time it takes to service a request. While latency can be captured for both successful requests and failed requests, it is important to differentiate between them. The failed requests may increase the overall latency, but this may not necessarily be the latency of the system. At the same time, a slow error is even worse than a fast error, so it is important to track error latency, as opposed to just filtering out errors.
Traffic: Traffic is a measure of demand for the system, measured in a high-level system-specific metric. For instance, too many HTTP requests to a web server or API may result in additional stress on the system, triggering downstream effects. The traffic signal helps differentiate capacity problems from improper system configurations that can cause problems even during low traffic.
Errors: This is the rate of requests that fail, either explicitly (e.g., HTTP 500s), implicitly (e.g., an HTTP 200 success response, but coupled with the wrong content), or by policy (e.g., service level objective (SLO)). It is useful to diagnose misconfigurations in your infrastructure, bugs in your application code, or broken dependencies.
Saturation: Saturation is the load on the system resources (e.g., CPU utilization, memory usage, disk capacity, and operations per second). Note that many systems degrade in performance before they achieve 100% utilization, so having a utilization target is essential. While parts of the system become saturated first, often, these metrics are leading indicators, so capacity can be adjusted before performance degrades.
IV-C Events / Alerts
While the main sources of operational data are metrics and logs (§IV-B), based on the rules or algorithms, they become events. Other artifacts such as configuration, security, code changes, and the like can be sources of events. Anomalous—also, based on rules or algorithms—events become alerts. As shown in Figure 1, every component in virtualized layers can produce events and parts of them can become alerts (i.e., important error signals). In often cases, not a single alert can tell what went wrong exactly, so correlating information with patterns would likely lead to better diagnosis. For example, a spike in error rate could indicate the failure of a database or network outage. Also, following a code deployment, it could indicate bugs in the code that somehow survived testing or only surfaced in the production environment.

As an example, Figure 2 shows 1 year worth of alerts (only escalated events) generated from one production application that is composed of 26 microservices running on Kubernetes clusters. The alerts include 10,399 (75.79%) critical, 367 (2.68%) error, 3 (0.02%) warning, and 2,951 (21.51%) info. alerts.
IV-D Incidents / Change Records
A manually or automatically created incident serves as a formal record to log all the information relevant to an issue and resolution. An incident record typically captures the information like: id, title, description, opened date, severity, impacted configuration item(s), outage start time, outage end time, state (resolved, open), resolution description, change ID to represent the incident has been “caused by change”. A change record captures key attributes for a change like: id, title, description, purpose, environment, request date, start date, end date, team, state (open, closed), closure code (successful, failed, induced issues), backout plan, close notes, configuration items for resources or images associated with the change ticket. Incidents and change records are often used to predictively measure the potential risk of the submitted change (not yet deployed) or reactively find which images have been problematic.
Any changes—for instance, performed to add new features, address vulnerabilities or improve the performance of the system—can also induce alerts/incidents. Any changes to the software are generally made by modifying the source code, rebuilding the images and redeploying the newer version of the images to containers (§IV-E). So, when an alert or group of alerts is produced on any component of the virtualized layer, checking for recent changes deployed on the component can help in the root cause analysis.
Observer tools to monitor the CICD pipeline can help link changes directly to the DevOps workflow, but in absence of such a mechanism, we will have to extract references to image names from the change tickets. While in some cases, information about the image(s) deployed by change can be mentioned in structured fields of the change ticket, in most cases the reference to images is hidden in the unstructured text fields. We map change tickets to topology objects by mining the references to image names from the change text. We first look for direct mentions of image names in the change tickets. If direct mentions are not identified then we search for reference to image tags as it is unlikely for two images to have the same tag. If both of these return no matches, then we search for similar changes to the current change ticket and add the image reference if the similar changes have any images mapped to them.
Based on the above image mapping, we identify the virtual topology objects associated with each change ticket and add change ticket references to the alert(s) mapped to the same topology object through entity resolution (§V-A) if the change was recently deployed before the alert was generated.
| Type | Category | Relationships |
|---|---|---|
| Node | Type | application, backplane, bridge, card, chassis, command, component, container, cpu, database, directory, disk, emailaddress, event, fan, file, firewall, fqdn, group, host, hsrp, hub, ipaddress, loadbalancer, location, networkaddress, networkinterface, operatingsystem, organization, path, person, process, product, psu, router, rsm, sector, server, service, serviceaccesspoint, slackchannel, snmpsystem, status, storage, subnet, switch, tcpudpport, variable, vlan, volume, vpn, vfr |
| Edge | Aggregation | contains, federates, members |
| Edge | Association | aliasOf, assignedTo, attachedTo, classifies, configures, deployedTo, exposes, has, implements, locatedAt, manages, monitors, movedTo, origin, owns, rates, resolvesTo, realizes, segregates, uses |
| Edge | Data flow | accessedVia, bindsTo, communicatesWith, connectedTo, downlinkTo, reachableVia, receives, routes, routesVia, loadBalances, resolved, resolves, sends, traverses, uplinkTo |
| Edge | Dependency | dependsOn, runsOn |
| Edge | metaData | metadataFor |
IV-E Virtual Topology
In legacy systems, a (physical) node is often equivalent to an application (or multiple processes running in the same node) or one database and physical interfaces thereof represent connectivities with other nodes (applications). In today’s cloud systems, a physical node is virtualized to run multiple virtual machines (VMs), even further each VM is virtualized to run multiple containers. Also, the virtualized network provides virtual interfaces that support overlay or hybrid protocols. Figure 1 illustrates evolution from legacy systems (left) to contemporary cloud systems (right).
To correctly diagnose a problem, identifying where alerts are generated is the key to understand the problem correctly. The systems are often represented as topological graphs that have nodes (i.e., any box in Figure 1), and edges (i.e., vertical connectivity or horizontal connectivity). Table I shows types of nodes and edges representing cloud systems: 52 node types and 41 edge types. The semantic relationships among nodes and edges are quite complex as shown in Figure 3. Therefore, identifying ‘correct’ topological entities (§V-A) and correlating alerts derived from them (§V-C) are the main stepping stones for SREs to tackle the problem.
IV-F Enrichment
Artifacts like alerts or change tickets generally make reference to topological entities to which they relate. Knowing which topological entities are involved is necessary for problem localization, and is a general assistance to any correlation effort. These entities are not always explicitly listed in a well-formatted way, although they sometimes are. They may be included in a JSON object that has been converted to a string in an embedded field that is standard in a particular deployment, referenced by name in a field provided by a performance monitor template, or identified by IP address in the free text of the description.

Logs and metrics are two key sources of information that an application generates, irrespective of whether it is in healthy state or unhealthy state. Moreover, the logs generated by an application are in a finite space such that they can be mined and mapped to a set of template-ids. In order to use logs for event correlations, each log line is processed and templatized using a pipeline called as log-template pipeline. The log-template pipeline consists of two components, error classification of log line followed by templatization of log line. When any event is generated, its corresponding log lines that are within a fixed duration of the start of the event are fetched. Each log line from the set of log lines is input to a pre-trained classifier, the output of the classifier is a 0 (error) or 1 (non-erroneous). The error classifier allows us to separate log lines pertaining to healthy state of the system and the corresponding microservice from the non-erroneous log lines. The outcome of the error classifier is a subset of total log lines which are then input to the next step of the pipeline, template miner. A template miner is pre-trained on millions of log lines that can map a log line to a template id. For each erroneous log line, we obtain its corresponding template-id from the template miner, thus yielding a set of template-ids for all log lines. Each event is enriched with its entities and a set of template-ids. The entities and template-ids contained in the enriched event are used at a later stage for event correlation.
IV-G Normalization
Various data sources (events) flowing into FIXME are normalized or standardized with the same format in order to increase the cohesion of data types and reduce the redundancy. Having looked through many data sources, we have found that the following information is enough to run all the algorithms: title, description, created_at, resolved_at, severity, source, and features. Note that features are expandable to accommodate any unique information from any data source as an object such as name, URL, alert_id, team, and application.
V Methodology
V-A Hybrid Entity Resolution
FIXME uses multiple sources for operational events. Some are more easily associated with a specific topological entity than others. For example, if our log anomaly detection subsystem creates an event to alert operations of unusual behavior, then it can label that event with the exact container that generated the log being observed. If, on the other hand, we import an alert from an external alert management system, which in turn created it in response to a level-crossing observed by a monitoring tool, matching it with the topology is harder.
The first challenge is that these alerts are often created manually, and how they identify the resource depends on local standards. To allow the embedded information to be used for locating the resources, we have defined a “matcher” language (template) for describing how these locations may be embedded in the raw alert object. Alert management systems have some standard fields, so our starting point is a standard extraction file that checks these known places. Customers who follow local practices, such as a standard name-value pair in the title of the alert, can add this to the template rules file.
In addition to this template-based approach, we also use a dictionary-based approach to scan for things that “look like” entity references. Specifically, we know the domain name server (DNS) in use in the subject environment. We also know a number of names used by docker images and Kubernetes objects in this environment. These are all partial names, not knowing every host name or every image tag, but by combining the names that we do know with regular expressions for how they generally appear allows us to search for likely references. To adapt to the changing environment, we use an internal query system that allows us to compile a rapid regular expression matcher for fast application, while still allowing the specific list of names (dictionary) to be updated dynamically.
The second challenge is that resources may be identified using different methods, and no single method will work for all resources. In our case, we use resource IDs (e.g., UUID), assigned by a topology service when the topological object is added to its database, but an external monitoring tool will not know these IDs. Kubernetes has unique object IDs, but they are also generally invisible to an external monitor. IP addresses and DNS names identify an endpoint, but that is often just a front end, such as a Kubernetes ingress or a load balancer.
Once we have used the rules file to get a value that should identify an object in the topology, we then use a search to resolve that reference to an object ID. Topology searches need to identify the time at which to search, so we use the creation timestamp on the alert. If the alert was actually a result of the object being deleted, then it did not exist at the creation time of the alert, so we will not resolve that object. In practice, this does not appear to be a significant problem.
V-B Learning Patterns
The same types of problems tend to happen repeatedly and capturing them as patterns help the problem determination. In this section, we introduce various ways to capture patterns for the given datasets.
Association rule mining: one of the most important data mining algorithms, aims to discover interesting relationships latent in large datasets [32]. A typical and widely known example of association rules application is market basket analysis by learning from sales transactions. The strategy of association rule mining is composed of two phases [33]:
-
•
Frequent Itemset Generation: The objective of this phrase is to find all the itemsets, also called frequent itemsets, if items occurred together greater than a minimum support threshold () in transactions.
-
•
Rule Generation: This phrase is to extract all the high-confidence rules (i.e., strong rules) based on the minimum confidence threshold ()) the frequent itemsets generated from the first phrase.
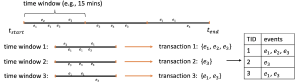
A fixed time window (e.g., 10 mins) is applied to generate events transactions from the sequential events monitored from to (seen in Figure 4). Each row in the table corresponds to a transaction containing a unique identifier labeled TID and a set of events in a time window. In this example, let be the set of all event types and be the set of all transactions. Supposing and , we could get the frequent itemsets and strong rule through the calculations shown as follows:
where , and
The uncovered correlations (i.e., frequent itemsets and strong rules) can perform basis for decision making and prediction to support hybrid cloud management such as event correlation, anomaly detection, fault localization, and the like.
Log templates: Two events may or may not have a similar description, however, if the underlying logs are similar then they are most likely related to each other—this is the key hypothesis of using logs for event correlation.
Each application consists of several microservices, some of these services are related to other services forming a graph. If one service fails then any other service which is upstream or downstream of the failed service could throw error log lines. It is important to identify error log lines for each failed microservice during an execution of an application, collate them together to form log signature for a particular event.
In order to use logs for event correlations, each log line is processed and templatized, then they are collated to form a log-signature for each event. To recall, from §IV-F the log-template pipeline consists of two components, error classification of log line and templatization of log line. As a result, for a given event, there is a set of templates-ids and corresponding application-ids. We propose a log-signature representation for each event from its template-ids and corresponding application-ids, and use that for event correlation. The example below shows a log signature for an event; there are three log template ids—template_id_a, template_id_b, template_id_c; two log template ids (template_id_a and template_id_b) belong to application_id_a, and one log template id (template_id_c) belongs to application_id_b. This representation is called as log signature of an event.
[] ”templates”: [ ”application_id”: ”application_id_a”, ”template”: ”template_id_a” , ”application_id”: ”application_id_b”, ”template”: ”template_id_b” ]
Once we have a log signature for each event, the similarity is calculated between two events by computing the overlap between their application ids; for each application id that overlaps, it computes the overlap between their respective templates ids to calculate a score called as log template similarity score. For event grouping using template clustering, the algorithm starts with a list of groups, each group could contain one or more events. Next, it computes the similarity between each pair of groups using the log template similarity, as explained above. This produces pairs of groups with similarity score between them, the pair with the highest similarity score which is above a threshold is taken and the groups in the pair are merged into one single group. Then the process is repeated until there is only one group left or the highest similarity score between groups is below the threshold.

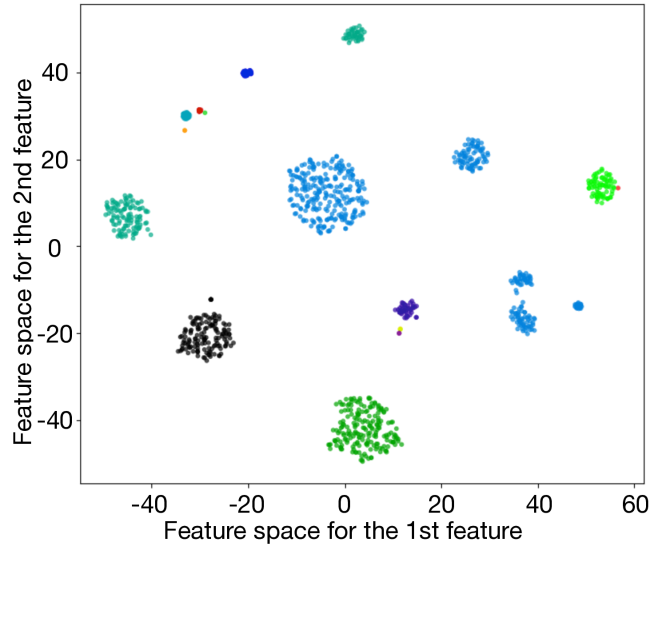
Word embeddings: Application events, different from network events, are not often structured in that the data descriptions or log messages are written in natural language. So, the natural language processing would help understand the patterns of the events. Because learning word embeddings is effective to capture the same or similar representation for words that have the same meaning [34], the fastText (https://fasttext.cc) word embedding (vector size = 300) has been applied to the alert descriptions to train the embedding model. Later, this model turns alert descriptions into learned representations. In order to identify how the embedding is clustered, a balanced iterative reducing and clustering using hierarchies (BIRCH) is applied to the embeddings [35].
The silhouette coefficient is a measure of how close each point in one cluster to points in the neighboring clusters and thus provides a way to assess goodness of clusters. Figure 6 shows the silhouette coefficients. The average silhouette coefficient is the maximum when the number of clusters is 15. This means the quality of clustering is the best when 15 clusters are formed. This will be further evaluated in the evaluation (§VI-D). Also, for the same number of clusters, Figure 6 shows the clustering space in 2 dimensions with t-SNE that is a technique of non-linear dimensionality reduction and visualization of multi-dimensional data.
| - | Similarity | Knowledge | Statistical |
|---|---|---|---|
| Group alerts from diff. sources | O | O | X |
| Require prior knowledge | O | O | X |
| Detect false alerts | O | O | Guess |
| Detect multi-stage incidents | X | O | Guess |
| Find new incidents | O | X | O |
| Error rate | Mid | Low | High |
V-C Hybrid Correlation
As briefly discussed in §I and §III, generally similarity (e.g., rules, patterns), knowledge (e.g., scenario, knowledge base), and statistical (e.g., statistical estimation, causal relation estimation, reliability degree combination) approaches are used for the information correlation [4, 5]. Table II compares the three approaches qualitatively. Not one approach is perfect, but an hybrid approach would complement deficiencies.
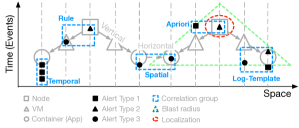
FIXME uses a mix of different methods to make a correct verdict on the correlated information. For similarity, rules (time, spatio, prior information), patterns/templates (§V-B), and for knowledge, knowledge base (capture causal inference from SREs or root cause analysis), feedback (§V-E), and lastly for statistical, machine learning algorithms (e.g., association rule mining), clustering (§V-B) are used. Figure 7 illustrates some of methods in time (y-axis) and spatial (x-axis) dimensions. □, △, and ○ represent spatial information (§IV-E), respectively, physical nodes, VMs and containers that have vertical relationship with “runsOn”, and horizontal relationship with “dependsOn” (Table I). ◼, ▲, and ● represent different types of alerts.
dotted-□ describes correlated alert groups that are made by different methods. The temporal group is based on the time given that alerts are generated from the same topological entity. Similarly, the spatial considers both time and space where entities have a special semantic relationship (in this case “dependsOn”). The rule group is derived from SREs’ input, apriori group is based on the patterns learned from the association rule mining, and the similarity of log-template group is measured by templates of alerts (logs). We demonstrate the effectiveness of this ensemble approach in §VI-C.
V-D Localization
The correlated alert group itself explains about the problem, but often case, it is not enough for software developers and SREs to understand the root cause immediately, especially when the group includes multiple alerts from different locations. Additional explainability would help localize the problem and understand the impact of it. Treating alerts in the group as error signals and knowing the topological entities and their relationships render reasoning to find the root entity of the problem and its impact for the related entities. In Figure 7, dotted-○ shows the localized entity given the correlated group based on the apriori. dotted-△ is a blast radius (impact) of the problem. While SREs know well about the architecture of their application, the localization and blast radius help SREs to visualize the problem together with the description of the alerts. FIXME uses a Souffle222https://github.com/souffle-lang/souffle reasoner to traverse topological entities with error signals and outputs topological entities for localization and blast radius.
V-E Continuous Improvement (Feedback)
The feedback is an essential part of continuous learning for AIOps systems, but collecting feedbacks is challenging with the following reasons: first, collecting a large number of feecbacks is hard as SREs are not committed or incentivized; second, correctness or consistency is not guaranteed due to ambiguity from different experiences or skillsets; third, details are often missing as the most effective way is yes/no or thumbs up/down or at best drop-down with a short list of selections. Especially, since the ChatOps interface (main interface for FIXME) flows based on timeline rather than dashboard, it is harder to wait SREs to finish the work and come back to provide feedbacks. Therefore, learning from minimal feedbacks (i.e., active learning) is important. The feedback is expected to improve the correctness of correlation and suppress false positives. FIXME uses a content-based approach that leverages clustering split and merge operations based on the word embedding [36] (§V-B). Applying feedbacks improves correctness of rules, patterns, and knowledge base.
VI Evaluation
FIXME enables hybrid diagnosis approaches on various data types to correctly identify entities and group information for software engineers and SREs to diagnose problem without spending too much time for post-mortem analysis. In this section, we evaluate FIXME with the following goals:
VI-A Setup
A total of 12,696 alerts (1 year) have been obtained from the product team that manages a software as a service (SaaS) application in IBM Cloud333The application name and data are considered IBM confidential, so it is not included in this paper. Our algorithms have been applied to 1,134 alerts for a worth of 1 month and identified 382 issues (groups)—141 issues have more than 1 alert and the rest 241 includes only single alert. This dataset has been shared with developers and SREs to get feedbacks for each alert whether it belongs to the correct group or not. The rest of 11,565 alerts have been used for training to learn patterns. In addition, the snapshot of the virtual topology running on Kubernetes has been shared. It includes 516 nodes, 755 deployments, 1,532 pods and 801 services.
VI-B Hybrid Entity Resolution
Our two main extraction techniques, described in §V-A, are template-based and dictionary-based approaches. As the labeled dataset does not include the ground-truth of the topological entities, we use the sampling and manual labeling. When deciding on which to incorporate into the final system, we start with a random sample of 10 events from the dataset, and have manually identified 16 useful topological references that they contain (true positives). The template-based approach finds 9, and the dictionary-based approach finds 10, so the combined approach returns 15 correct (93% accuracy). However, only 4 are found by both. Although it is a small set, the results gave us a clear indication that neither technique alone would likely be sufficient.
VI-C Hybrid Correlation
As described in §V-C, the hybrid correlation would benefit toward correctness. In this section, we show how applying various methods help improve performance.
Temporal and spatial: Without learned models that help identify similarity, knowledge, statistical patterns, the time and space are base attributes towards the correlation. Out of 1,134 alerts (forming 382 groups), based on time and space, 825 alerts labeled as correct (TP), 68 as incorrect (FP), 241 (single alert in group) as not applicable (FP). Since the data is not necessarily associated problems, feedbacks about what additional data should be included (FN) have not been collected444True Positive (TP), False Positive (FP), False Negative (FN). Therefore,
Given the labeled data without knowing true/false negatives, precision is important to understand correctness. This is our baseline performance.
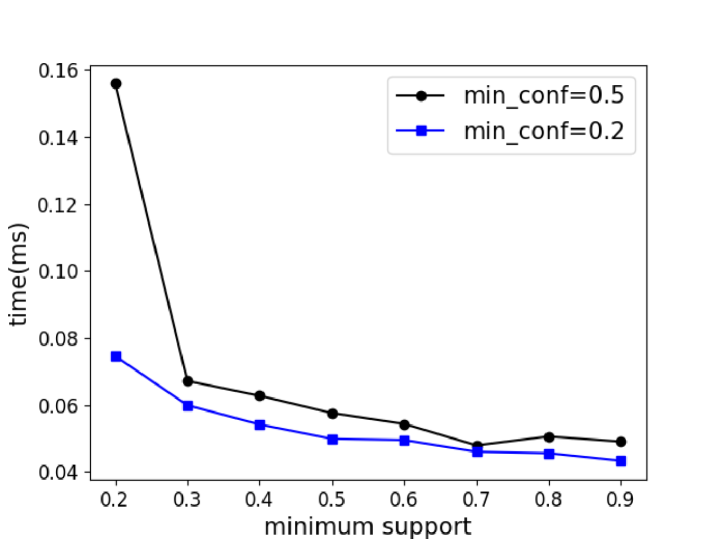
Association rule mining: In this section, we explain how we apply apriori, one of the most popluar association rule mining algorithms, to find frequent co-occurrence alerts (i.e., events) from our dataset, which are generated from 73 sources (i.e., pods, containers, nodes). Our goal is to find associations among these alerts from each source. As detailed in §V-B, we first get alert transactions from sequence alerts and use apriori to generate frequent itemsets and rules for each source. Since each source is not large enough, 5 mins is used as the fixed time window and finally we get 852 transactions in total. The maximum number of transactions in sources is 52 and the average numer is 12. The performance curve of running time for generating frequent itemsets with minimum supports from 0.2 to 0.9 is shown in Figure 9. Figure 9 indicates that the number of frequent itemsets and the number of association rules increases as the minimum support is reduced on this data. In order to reveal how apriori can improve the correlation performance, we select a minimum support threshold to generate frequent itemsets. When , there are 4 and 2 frequent itemsets, where indicats the length of itemsets is , among all generated 52 frequent itemsets. Based on the feedback from SREs, all the learned frequent itemsets are the correct groups. Using these frequent itemsets (i.e., clusters), we split a group into multiple smaller groups or merge multiple clusters into a larger one in order to improve the accuracy of groups. As expected, 31 alerts, out of 68 incorrect labeled alerts from temporal and spacial group results, are split and merged into another groups or become a new correct group. the precision of correlation improves to , while F1 improves by .

Log-template grouping: In this section, we want to verify the hypothesis that the two similar alerts may or may not have a lexically matching incident descriptions, but their logs should have high overlap and that they are discriminative. In order to validate the hypothesis, a total of 10 similar pairs and 19 dissimilar pairs are sampled from the dataset with their description, log-templates and entities. For each pair of alerts, we compute the similarity score between them based on: alert-description, entity, log-templates. To compute the alert-description based similarity between two alerts, we obtain the distributed representation using universal sentence encoder for each alert in the pair, and then compute cosine similarity between them. For entity based similarity, we first extract entities from each alert, represent them as a vector of entities. Then, we compute the tf-idf similarity between them. §V-B outlines our method for calculating log-template based similarity between two alerts.
| Log-template | Entity | Event-desc | ||||
|---|---|---|---|---|---|---|
| Similar | Dissim. | Similar | Dissim. | Similar | Dissim. | |
| AVERAGE | 0.72 | 0.55 | 0.66 | 0.53 | 0.84 | 0.75 |
| STDEV | 0.049 | 0.09 | 0.10 | 0.07 | 0.10 | 0.06 |
| MEDIAN | 0.71 | 0.54 | 0.63 | 0.54 | 0.82 | 0.75 |
The results of the experiments are presented in Table III (w/o each data point). The average similarity scores of both similar and dissimilar alert pairs are computed using alert-description are 0.84 and 0.75, respectively. This shows that one cannot rely only on the alert-description based similarity score, as it might result in a lot of false positives. Although, precision will be high, but accuracy will be low; these results indicate that the alert-description based similarity score is not discriminative enough to discriminate similar pairs from dissimilar pairs. On the other hand, the average similarity scores of both similar and dissimilar alert pairs calculated using log-template are 0.72 and 0.55, respectively. It clearly indicates the discriminative power of log-template based similarity scores, where it can clearly discriminate the similar pairs from the dissimilar pairs. The entity based similarity scores show similar results. That is, the average similarity score for similar and dissimilar pairs are 0.66 and 0.53, respectively.
In order to establish the threshold value for alert grouping, i.e., when the similarity between groups is less than a threshold then the grouping should stop, we calculate the accuracy of log-template based alert grouping, entity based alert grouping, and alert-description based alert grouping for different threshold values. Table IV shows that the precision of alert-description based alert grouping is the lowest, and the precision of log-template based alert grouping is the highest. The maximum precision of log-template alert grouping is 0.89 when the threshold is set to 0.65—thus, this is used in FIXME.
| Threshold=0.6 | 0.65 | 0.7 | |
|---|---|---|---|
| Alert-description | 0.34 | 0.38 | 0.48 |
| Time & Spatial | 0.72 | 0.75 | 0.79 |
| Log-template | 0.82 | 0.89 | 0.89 |
VI-D Feedback
From the labeled data, we take the incorrect labels (6% response rate) as feedbacks. As detailed in §V-E, FIXME collects a simple feedback, yes/no from SREs, and uses them to perform clustering split and merge operations to divide a cluster (group) into multiple clusters or combine multiple clusters into one cluster. Both cases help improve the correctness. 11,565 alerts have been used for training word embeddings (size = 300) (§V-B) and the word embedding vectors are used as input to the clustering. Figure 10 illustrates the quality of clusters (i.e., consistency) using silhouette score and accuracy against the labeled data (§VI-A). 15 clusters show the best consistency and accuracy. From the labeled data (§VI-C), out of 68 incorrect labeled alerts, 46 alerts have been split and merged into another groups, then become correct. Also, 149 alerts (241 from single alert groups) have been merged into other groups, then they become correct. Therefore, the precision improves to and F1 score becomes .
VII Conclusion
We have introduced hybrid approaches used in the AIOps production systems, and demonstrated that hybrid entity resolution and hybrid event correlation provide better results than any single method. Our experimental results clearly show that combining template-based and dictionary-based approaches to entity resolution achieves 93% accuracy, while neither technique alone provides sufficiently good results. We also show that consecutive application of temporal and spacial methods together with association rule mining and log-template grouping, help to improve performance. We conclude the paper with description of methods used for feedback processing for improved accuracy. We have focused our initial work on data enrichment, correlation of variety of data and fault localization methods as these two steps were identified by SREs as most difficult in their troubleshooting process, we plan to focus on root cause identification next.
References
- [1] Sysdig. Sysdig 2019 container usage report. https://sysdig.com/blog/sysdig-2019-container-usage-report/, 2019. [online].
- [2] Catchpoint. Sre report 2020. https://blog.catchpoint.com/2020/06/24/catchpoint-sre-report-2020/, 2020. [online].
- [3] Junjie Chen, Xiaoting He, Qingwei Lin, Yong Xu, Hongyu Zhang, Dan Hao, Feng Gao, Zhangwei Xu, Yingnong Dang, and Dongmei Zhang. An empirical investigation of incident triage for online service systems. In International Conference on Software Engineering: Software Engineering in Practice, 2019.
- [4] Seyed Ali Mirheidari, Sajjad Arshad, and Rasool Jalili. Alert correlation algorithms: A survey and taxonomy. Lecture Notes in Computer Science, page 183–197, 2013.
- [5] Ayush Dusia and Adarshpal S. Sethi. Recent advances in fault localization in computer networks. Commun. Surveys Tuts., 18(4), 2016.
- [6] Malgorzata Steinder and Adarshpal Sethi. A survey of fault localization techniques in computer networks. Science of Computer Programming, 53:165–194, 11 2004.
- [7] Abhishek Verma, Luis Pedrosa, Madhukar R. Korupolu, David Oppenheimer, Eric Tune, and John Wilkes. Large-scale cluster management at Google with Borg. In Proceedings of the European Conference on Computer Systems (EuroSys), Bordeaux, France, 2015.
- [8] Ouissem Ben Fredj. A realistic graph-based alert correlation system. Security and Communication Networks, 8(15):2477–2493, 2015.
- [9] Seyed Hossein Ahmadinejad, Saeed Jalili, and Mahdi Abadi. A hybrid model for correlating alerts of known and unknown attack scenarios and updating attack graphs. Comput. Netw., 55(9):2221–2240, June 2011.
- [10] Google. Sre book. https://landing.google.com/sre/sre-book/chapters/effective-troubleshooting/, 2020. [online].
- [11] F. Cuppens. Managing alerts in a multi-intrusion detection environment. In Annual Computer Security Applications Conference, USA, 2001.
- [12] Fredrik Valeur, Giovanni Vigna, Christopher Kruegel, and Richard A. Kemmerer. A comprehensive approach to intrusion detection alert correlation. IEEE Trans. Dependable Secur. Comput., 1(3), July 2004.
- [13] Huwaida Tagelsir Elshoush and Izzeldin Mohamed Osman. Intrusion Alert Correlation Framework: An Innovative Approach, pages 405–420. Springer Netherlands, Dordrecht, 2013.
- [14] Alfonso Valdes and Keith Skinner. Probabilistic alert correlation. In Proceedings of the 4th International Symposium on Recent Advances in Intrusion Detection, RAID ’00. Springer-Verlag, 2001.
- [15] K. Julisch. Mining alarm clusters to improve alarm handling efficiency. In Annual Computer Security Applications Conference, 2001.
- [16] R. Vaarandi. A data clustering algorithm for mining patterns from event logs. In Proceedings of the 3rd IEEE Workshop on IP Operations Management, pages 119–126, 2003.
- [17] Peyman Kabiri and Ali Ghorbani. A rule-based temporal alert correlation system. International Journal of Network Security, 5:66–72, 07 2007.
- [18] Klaus Julisch. Clustering intrusion detection alarms to support root cause analysis. ACM Trans. Inf. Syst. Secur., 6(4):443–471, November 2003.
- [19] Oliver M Dain and Robert K Cunningham. Building scenarios from a heterogeneous alert stream. In Proceedings of the 2001 IEEE workshop on Information Assurance and Security, volume 6. United States Military Academy, West Point, NY, 2001.
- [20] Peng Ning and Yun Cui. An intrusion alert correlator based on prerequisites of intrusions. Technical report, North Carolina State University at Raleigh, USA, 2002.
- [21] S. Cheung, U. Lindqvist, and M.W. Fong. Modeling multistep cyber attacks for scenario recognition. In DARPA Information Survivability Conference and Exposition, pages 284– 292 vol.1, 05 2003.
- [22] Steven T. Eckmann, Giovanni Vigna, and Richard A. Kemmerer. Statl: An attack language for state-based intrusion detection. J. Comput. Secur., 10(1–2):71–103, July 2002.
- [23] Benjamin Morin, Ludovic Mé, Hervé Debar, and Mireille Ducassé. M2d2: A formal data model for ids alert correlation. In Andreas Wespi, Giovanni Vigna, and Luca Deri, editors, Recent Advances in Intrusion Detection, Berlin, Heidelberg, 2002. Springer Berlin Heidelberg.
- [24] Benjamin Morin, Ludovic Mé, Hervé Debar, and Mireille Ducassé. A logic-based model to support alert correlation in intrusion detection. Inf. Fusion, 10(4):285–299, October 2009.
- [25] Safaa O. Al-Mamory and Hongli Zhang. Intrusion detection alarms reduction using root cause analysis and clustering. Comput. Commun., 32(2):419–430, February 2009.
- [26] Peng Ning, Yun Cui, and Douglas S. Reeves. Constructing attack scenarios through correlation of intrusion alerts. In Proceedings of the 9th ACM Conference on Computer and Communications Security, CCS ’02, page 245–254, New York, NY, USA, 2002. Association for Computing Machinery.
- [27] Peng Ning, Yun Cui, Douglas S. Reeves, and Dingbang Xu. Techniques and tools for analyzing intrusion alerts. ACM Trans. Inf. Syst. Secur., 7(2):274–318, May 2004.
- [28] Tadeusz Pietraszek and Axel Tanner. Data mining and machine learning-towards reducing false positives in intrusion detection. Inf. Secur. Tech. Rep., 10(3):169–183, January 2005.
- [29] Oliver Dain and Robert K. Cunningham. Fusing A Heterogeneous Alert Stream Into Scenarios, pages 103–122. Springer US, Boston, MA, 2002.
- [30] Reuben L Smith, Nathalie Japkowicz, and Maxwell G. Dondo. Clustering using an autoassociator: A case study in network event correlation. In IASTED PDCS, 2005.
- [31] Peter Teufl, Udo Payer, and Reinhard Fellner. Event correlation on the basis of activation patterns. In Proceedings of the 2010 18th Euromicro Conference on Parallel, Distributed and Network-Based Processing, PDP ’10, page 631–640, USA, 2010. IEEE Computer Society.
- [32] Jiawei Han, Jian Pei, and Micheline Kamber. Data mining: concepts and techniques. Elsevier, 2011.
- [33] Pang-Ning Tan, Michael Steinbach, and Vipin Kumar. Introduction to data mining. Pearson Education India, 2016.
- [34] Tomas Mikolov, Kai Chen, Greg Corrado, and Jeffrey Dean. Efficient estimation of word representations in vector space, 2013.
- [35] Tian Zhang, Raghu Ramakrishnan, and Miron Livny. Birch: An efficient data clustering method for very large databases. SIGMOD Rec., 25(2):103–114, June 1996.
- [36] Maria-Florina Balcan and Avrim Blum. Clustering with interactive feedback, Jan 2008.