The Impact of a Stealth CME on the Martian Topside Ionosphere
Abstract
Solar cycle 24 is one of the weakest solar cycles recorded, but surprisingly the declining phase of it had a slow CME which evolved without any low coronal signature and is classified as a stealth CME which was responsible for an intense geomagnetic storm at Earth (Dst = -176 nT). The impact of this space weather event on the terrestrial ionosphere has been reported. However, the propagation of this CME beyond 1 au and the impact of this CME on other planetary environments have not been studied so far. In this paper, we analyse the data from Sun-Earth L1 point as well as from the Martian orbit (near 1.5 au) to understand the characteristics of the stealth CME as observed beyond 1 au. The observations near Earth are using data from the Solar Dynamics Observatory (SDO) and the Advanced Composition Explorer (ACE) satellite located at L1 point whereas those near Mars are from the instruments for plasma and magnetic field measurements on board Mars Atmosphere and Volatile EvolutioN (MAVEN) mission. The observations show that the stealth CME has reached 1.5 au after 7 days of its initial observations at the Sun and caused depletion in the nightside topside ionosphere of Mars, as observed during the inbound phase measurements of the Langmuir Probe and Waves (LPW) instrument on board MAVEN. These observations have implications on the ion escape rates from the Martian upper atmosphere.
Key words: Sun: coronal mass ejections (CMEs), Sun: heliosphere, planets and satellites: terrestrial planets, planets and satellites: atmospheres, planet–star interactions, Earth
1 Introduction
Coronal Mass Ejections (CMEs) are eruptions on the Sun, by which solar plasma and magnetic field are expelled into the heliosphere. CME eruption processes involve an energy storage phase, which may be the product of flux emergence or photospheric flows followed by an energy release phase. There are different physical mechanisms proposed for the eruption of CMEs, which include tether cutting or flux cancellation mechanism (Moore et al., 2001; Amari et al., 2003), shear motion (Aly, 1990), kink instability (Török & Kliem, 2004), torus instability (Kliem & Török, 2006) and magnetic Rayleigh–Taylor instability (Mishra et al., 2018). There are different models to explain the solar eruptions like flux emergence model (Feynman & Martin, 1995), Catastrophe model (Forbes & Isenberg, 1991), magnetic breakout model (Antiochos et al., 1999), reconnection model (Wyper et al., 2017) and forced reconnection (Srivastava et al., 2019). Based on the morphological evolution, the CMEs are classified as halo CMEs, partial halo CMEs, narrow CMEs, and CMEs with low coronal signatures. The CMEs from the Sun, which have virtually no identifiable surface or low corona signatures are often referred to as stealth CMEs (Robbrecht et al., 2009). These are typically slow CMEs with a speed less than 500 km s-1. Studies have shown that they can originate either from the quiet Sun region (Ma et al., 2010) or from an active region (O’Kane et al., 2019). They can also be originated near the open field lines or coronal holes or from faint flux rope eruptions (Adams et al., 2014; Lynch et al., 2016; Nitta & Mulligan, 2017). Pevtsov et al. (2012) observed that a plasma channel without a clear filament structure could also become the source region of stealth CMEs. A recent study on the magnetic field configuration in which the stealth CME occur, show distinct episodes of flare ribbon formation in the stealth CME source active region (O’Kane et al., 2020). In stealth CMEs, the energy storage and release sequence do happen, but the energy release is weak, which is probably associated with the magnetic reconnection during the eruption or due to an instability process (O’Kane et al., 2019). The stealth CMEs have no usual solar eruption warning signs in the lower corona, making it difficult for space weather predictions and therefore these may lead to unpredictable geomagnetic activity and ionospheric storms. Ma et al. (2010) have done a statistical analysis of the source location of the CMEs during solar minima and reported that almost one third of the CMEs occurring during the solar minimum period are of stealth type. Zhang et al. (2007) have studied the connection between the solar eruptions and intense magnetic storms on Earth (Dst<-100 nT) during Solar Cycle (SC) 23. They found that 12% of the total CMEs were launched without low coronal signatures. When we consider the geoeffectiveness of CMEs, several studies have shown that the geoeffectiveness is higher for slow CMEs (Ma et al., 2010; Lynch et al., 2016; Nitta & Mulligan, 2017). Since the stealth CMEs are typically of slow velocities, understanding their geoeffectiveness is considered to be very important. Typically being slow, they spend a long time in the interplanetary space and near–space environments of planets, and have high interaction time with other solar wind structures and planetary magnetospheres, some of these interactions probably help to enhance their geoeffectiveness (Liu et al., 2016). For instance, Tsurutani et al. (2004) found that some slow ICMEs surprisingly caused intense geomagnetic storms. However, it is still unclear how slow CMEs lead to enhanced geoeffectiveness by interacting with other solar wind structures. Similarly, the impacts of such stealth CMEs on environments of planets like Mars are not reported. Since the observations and models both show an enhancement in escape rates on unmagnetized planets like Mars and Venus during space weather events like CMEs (Jakosky et al., 2015; Brain et al., 2016), understanding the statistics of the stealth CMEs and their impacts are important for quantifying the planetary atmospheric escape processes.
The declining phase of the SC–24 had a stealth CME (Mishra & Srivastava, 2019), which caused an intense geomagnetic storm at Earth (Dst = -176 nT), which is the third most intense storm of the SC–24 (Abunin et al., 2020; Piersanti et al., 2020). Astafyeva et al. (2020) mentioned it as a ‘surprise geomagnetic storm’ and studied its impact on Earth’s thermosphere and ionosphere using both space–based (the Swarm constellation, GUVI/TIMED) and ground–based (GPS receivers, magnetometers, SuperDARN) instruments. However, the arrival and impact of this event on other planetary bodies have not been reported yet. In this study, we report the solar wind and magnetic field observations from a vantage point near Mars to understand the arrival of this slow stealth CME and show the response of Martian topside ionosphere to this event.
2 Data
The solar observations are taken from Solar Dynamics Observatory (SDO)/Atmospheric Imaging Assembly (AIA; Lemen et al. (2012)) (https://sdo.gsfc.nasa.gov/) and the Solar and Heliospheric Observatory (SOHO) Large Angle and Spectrometric Coronagraph (LASCO)-C2 (https://cdaw.gsfc.nasa.gov/CME_list/). We have also used the Wang-Sheeley-Arge (WSA)–ENLIL+Cone model (Odstrcil, 2003; Mays et al., 2015) from ENLIL Solar Wind Prediction (http://helioweather.net/) for understanding the relative planetary positions and the global heliospheric context. The Interplanetary Magnetic Field (IMF) and solar wind speed near 1 au, as well as the Sym-H (representing the ring current) variations at Earth are obtained from the NASA Space Physics Data Facility (SPDF) OMNIWeb data center (https://omniweb.gsfc.nasa.gov/).
The datasets from the Mars Atmosphere and Volatile EvolutioN (MAVEN) instruments are from the Planetary Data System (https://pds.nasa.gov/). The solar wind speed and IMF values near Mars are obtained from the Solar Wind Ion Analyzer (SWIA; Halekas et al. (2015)) and Magnetometer (MAG; Connerney et al. (2015)) instruments aboard MAVEN spacecraft. SWIA is an energy and angular ion spectrometer that measures the energy and angular distributions of solar wind ions of energy between 25 eV and 25 keV with 48 logarithmically spaced energy steps. MAG is a fluxgate magnetometer that measures the intensity and direction of the IMF. The method to determine the upstream solar wind and IMF conditions from MAVEN is described by Halekas et al. (2017), and is used in several studies (e.g. Lee et al. (2017); Krishnaprasad et al. (2020)). The Langmuir Probe and Waves (LPW; Andersson et al. (2015)) instrument on board MAVEN is used for the in situ electron density and electron temperature measurements [Level 2, version 3, revision 01 (V03R01)]. The Neutral Gas and Ion Mass Spectrometer (NGIMS; Mahaffy et al. (2014)) observations of MAVEN are used to understand the variations of O and O+ ion densities in the Martian ionosphere. NGIMS is a quadrupole mass spectrometer which measures the composition of neutrals and thermal ions, in the mass range 2-150 amu with unit mass resolution. The NGIMS Level 2 ion data version 08, revision 01 (V08R01) are used.
3 Observations
3.1 CME event
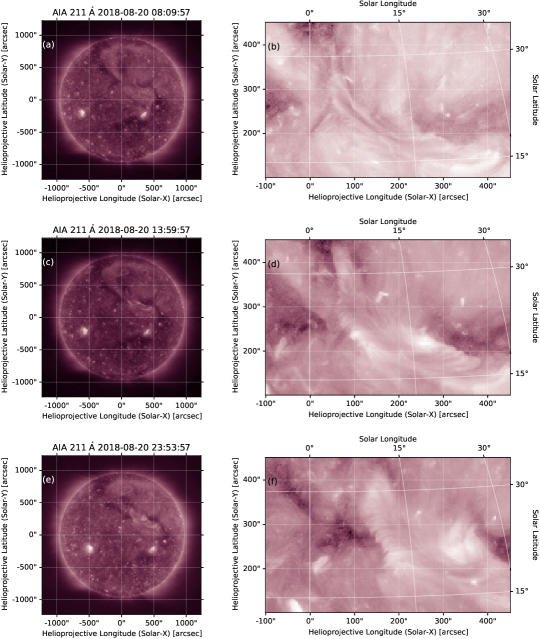
Figures 1(a), 1(c), and 1(e) show the images of the solar disk as seen in the 211 Å images from the AIA on board SDO on 20 August 2018. These images show the signatures of a filament structure and two coronal holes which produces fast solar wind. The quiescent filament structure passed over the coronal hole and partially erupted to a Coronal Plasma Channel (CPC). Figure 1(b), 1(d) and 1(f) show the region of the coronal plasma channel, at different stages of development. Several other instances of the development of this plasma channel leading to the filament eruption are given in Mishra & Srivastava (2019). It is suggested that the spreading coronal plasma channel might have interacted with an open field line of the coronal hole (Mishra & Srivastava, 2019), leading to a jet–like eruption. The hot coronal plasma channel is visible in other EUV filters of AIA as well (Mishra & Srivastava, 2019). Following this, a flux rope has also evolved and erupted above the coronal plasma channel. So, there are three ejections with very faint evidence in the lower corona, which merged with each other to form a complex stealth CME, which traveled through the interplanetary space which was observed in the STEREO-A HI-2 (Heliospheric Imager-2) field of view on 24 August 2018, 08:09 UTC (Mishra & Srivastava, 2019). The lower part of the CME interacted with the terrestrial magnetosphere on 25 August 2018. The features of the eruptions, their interplanetary propagation and the arrival at Earth are described in detail by Mishra & Srivastava (2019); Abunin et al. (2020); Chen et al. (2019); Piersanti et al. (2020). The HI images (Figure 11, Mishra & Srivastava (2019)) further show that the CME arrived near the Mars on 27 August 2018.
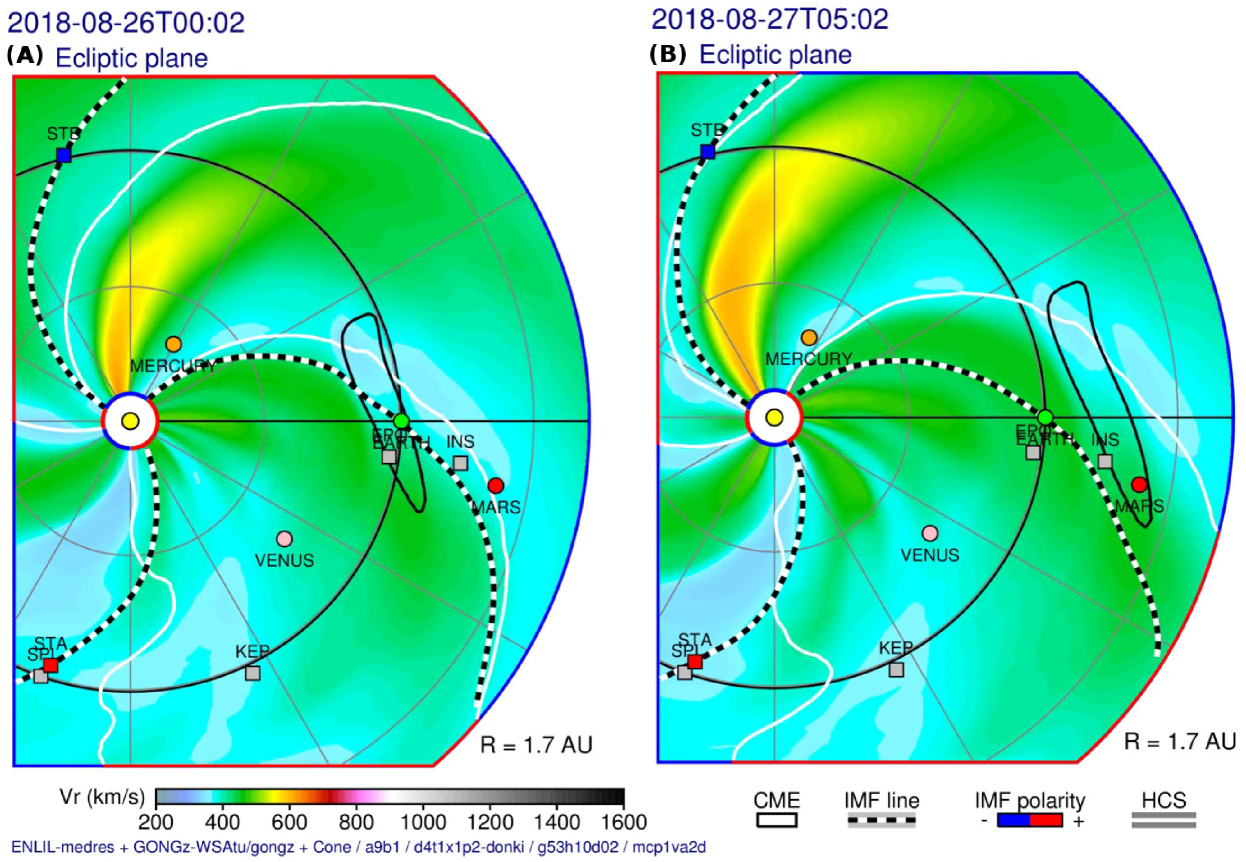
Figure 2 shows the WSA-ENLIL+Cone simulation snapshots during the passage of the stealth CME at Earth as well as during its arrival at Mars. The color shows the solar wind radial velocity. During the CME arrivals at Earth and Mars, the velocity is low. However, there is a high speed stream possibly originated from the coronal hole. Chen et al. (2019) reported that after the filament eruption, the coronal hole merged with a dimming region on 21 August 2018. This could be the source of the fast solar wind stream, which followed the ICME and arrived at the planets.
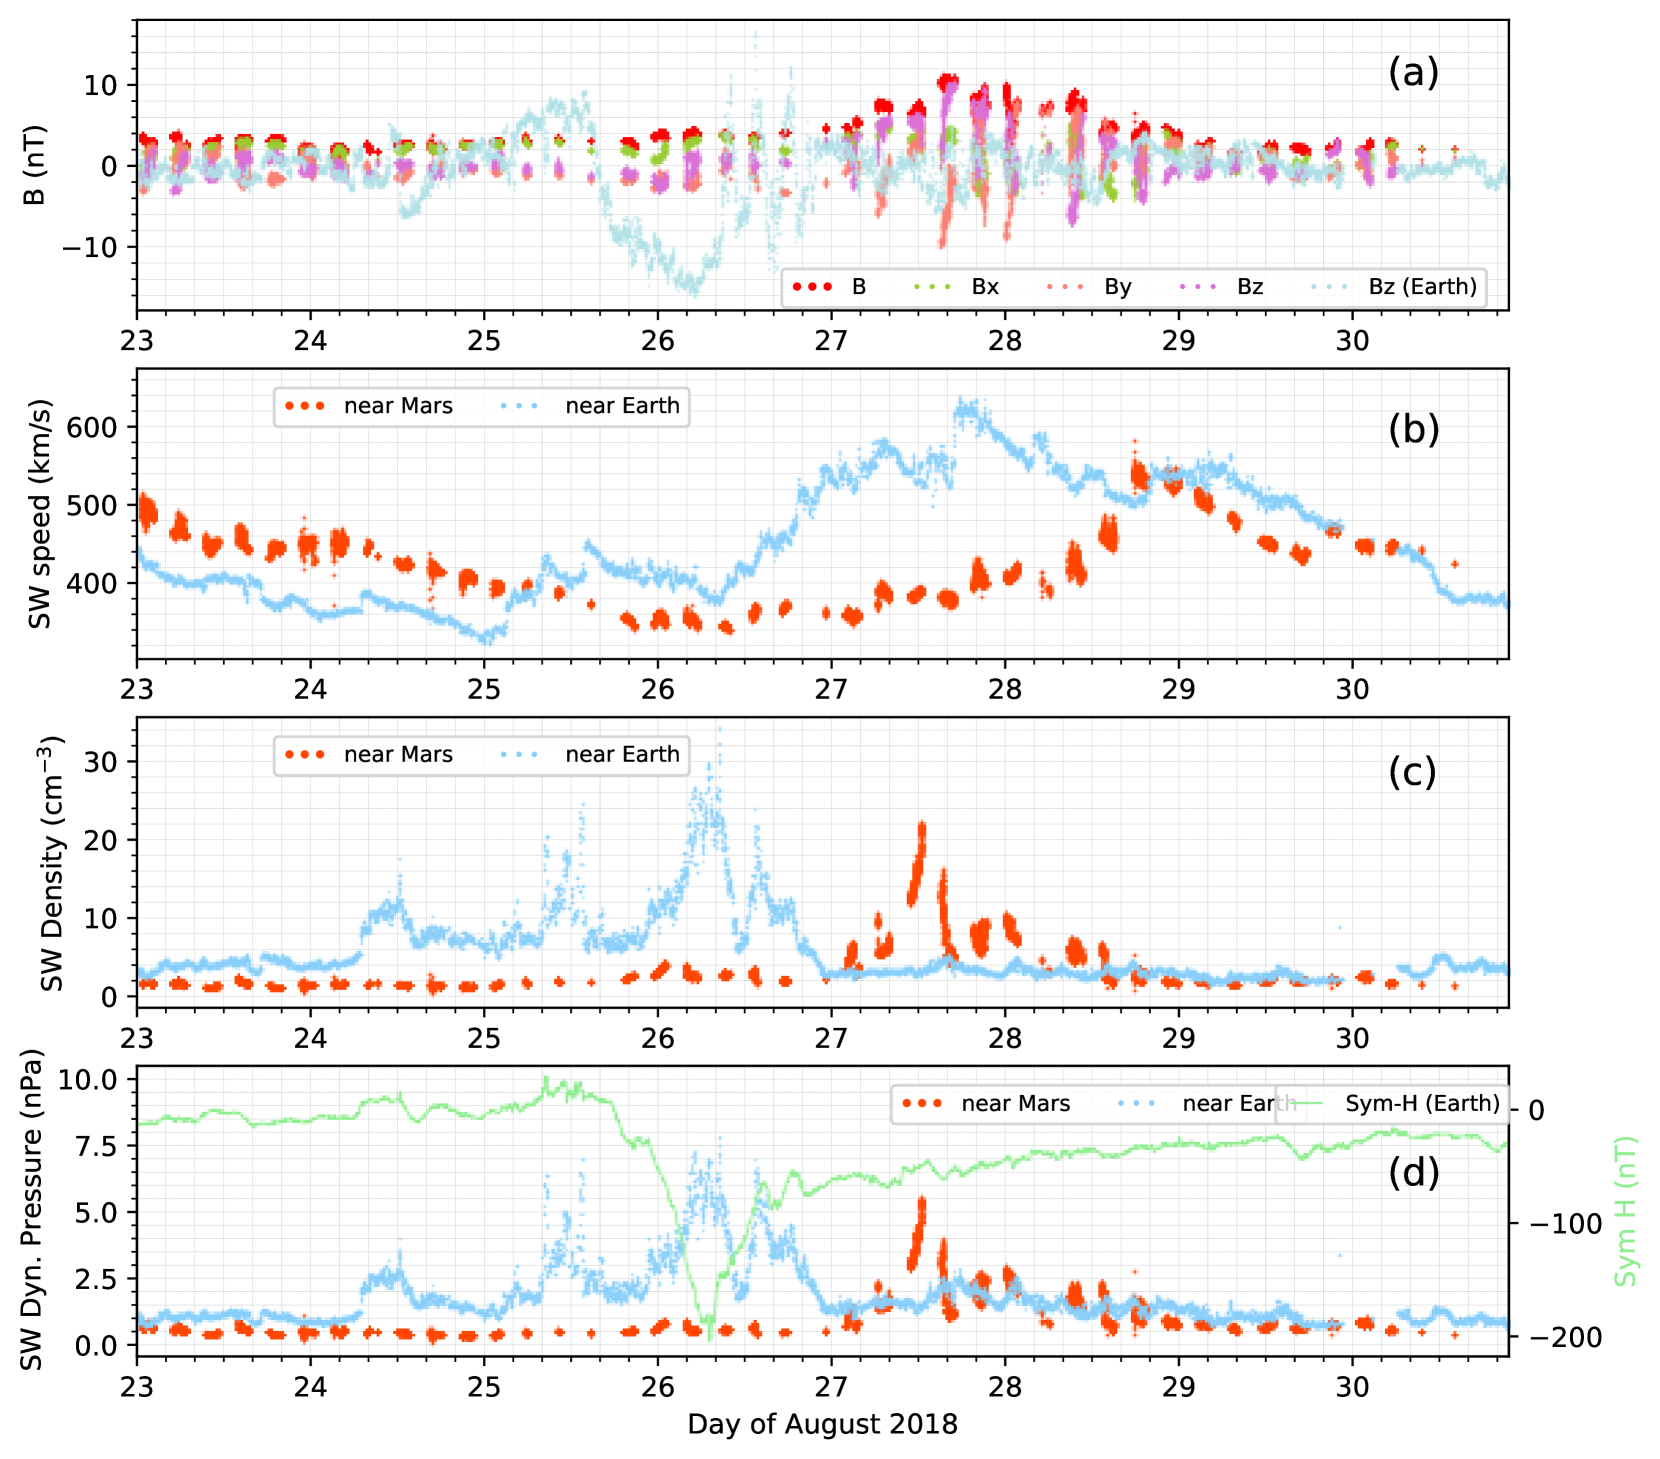
Figure 3 shows the variation of IMF, solar wind velocity, proton density as well as dynamic pressure observed near Mars by MAVEN. The total B as well as the components are shown in Figure 3a. For comparison, the Bz values observed at L1 are also shown in the figure. Along with the other solar wind parameters observed by MAVEN shown in Figures 3(b-d), the near Earth values are also shown for comparison. Apart from this, the Sym-H observed at Earth is also shown to depict the occurrence of the intense geomagnetic storm at Earth. It can be seen that, at Earth on 25-26 August the IMF Bz shows the signature of a magnetic cloud arriving at Earth. The IMF enhancement at Mars starts on 27 August and continues even on 28 August. The peak southward component at Earth is 16 nT, and the total B is as high as 19 nT (Mishra & Srivastava, 2019). At Mars, the peak B field strength is 10 nT. When the CME arrived, solar wind velocity near Earth was 350 km s-1 which indicated that this was a slowly propagating CME. The solar wind velocity near Earth further showed an increase because of the high speed stream, and the peak velocity was observed on 28 August. Near Mars, the solar wind velocity was 400 km s-1, on the arrival of the ICME. The arrival of the high speed stream followed, with peak velocity observed on 28 August. On both these planets, by the time the stream arrived, the magnetic field enhancements and fluctuations (due to CME) diminished, indicating that the CME already passed. Both at 1 au and 1.5 au, the CME structure was therefore bracketed between the ambient slow wind and the high speed stream, thus enhancing the effectiveness of interaction. Since MAVEN is in an elliptical orbit, it observes the upstream solar wind conditions only intermittently (Halekas et al., 2017), making it difficult to infer the exact event arrival time at Mars.
3.2 Impact on Martian ionosphere
During August 2018, the inbound legs of the MAVEN spacecraft were observing the nightside region from the near–dusk region to near–midnight sector, and the outbound legs were observing the post midnight sector. We make use of MAVEN in-situ observations from the inbound phase to understand the response to the ICME. The data from the outbound phase are not used because of the low signal levels (characteristic of deep nightside data, due to low plasma concentrations). Observations during 24-26 August represent the typical quiet time variation, and the observations on 27 and 28 August 2018 represent the ‘event orbits’.
Table-1 shows the details of the MAVEN orbits used in this study, such as variation in altitude, solar zenith angle (SZA), local solar time (LST), latitude, and longitude during inbound legs. These observations pertain to the northern hemisphere of Mars where the influences of the crustal magnetic field are a minimum (Acuña et al., 1999). It has been observed that during nightime, the largest peak ion densities are found near vertical crustal fields, which form cusps that allow energetic electron precipitation, whereas smaller peak densities are found near horizontal crustal fields, which hinder energetic electron precipitation into the atmosphere (Girazian et al., 2017). However, these effects are observed over the southern hemisphere, where there are strong crustal fields. The variability of electron density for the present event are mostly free from these effects, since the observations shown here are for the inbound leg, which cover northern hemisphere.
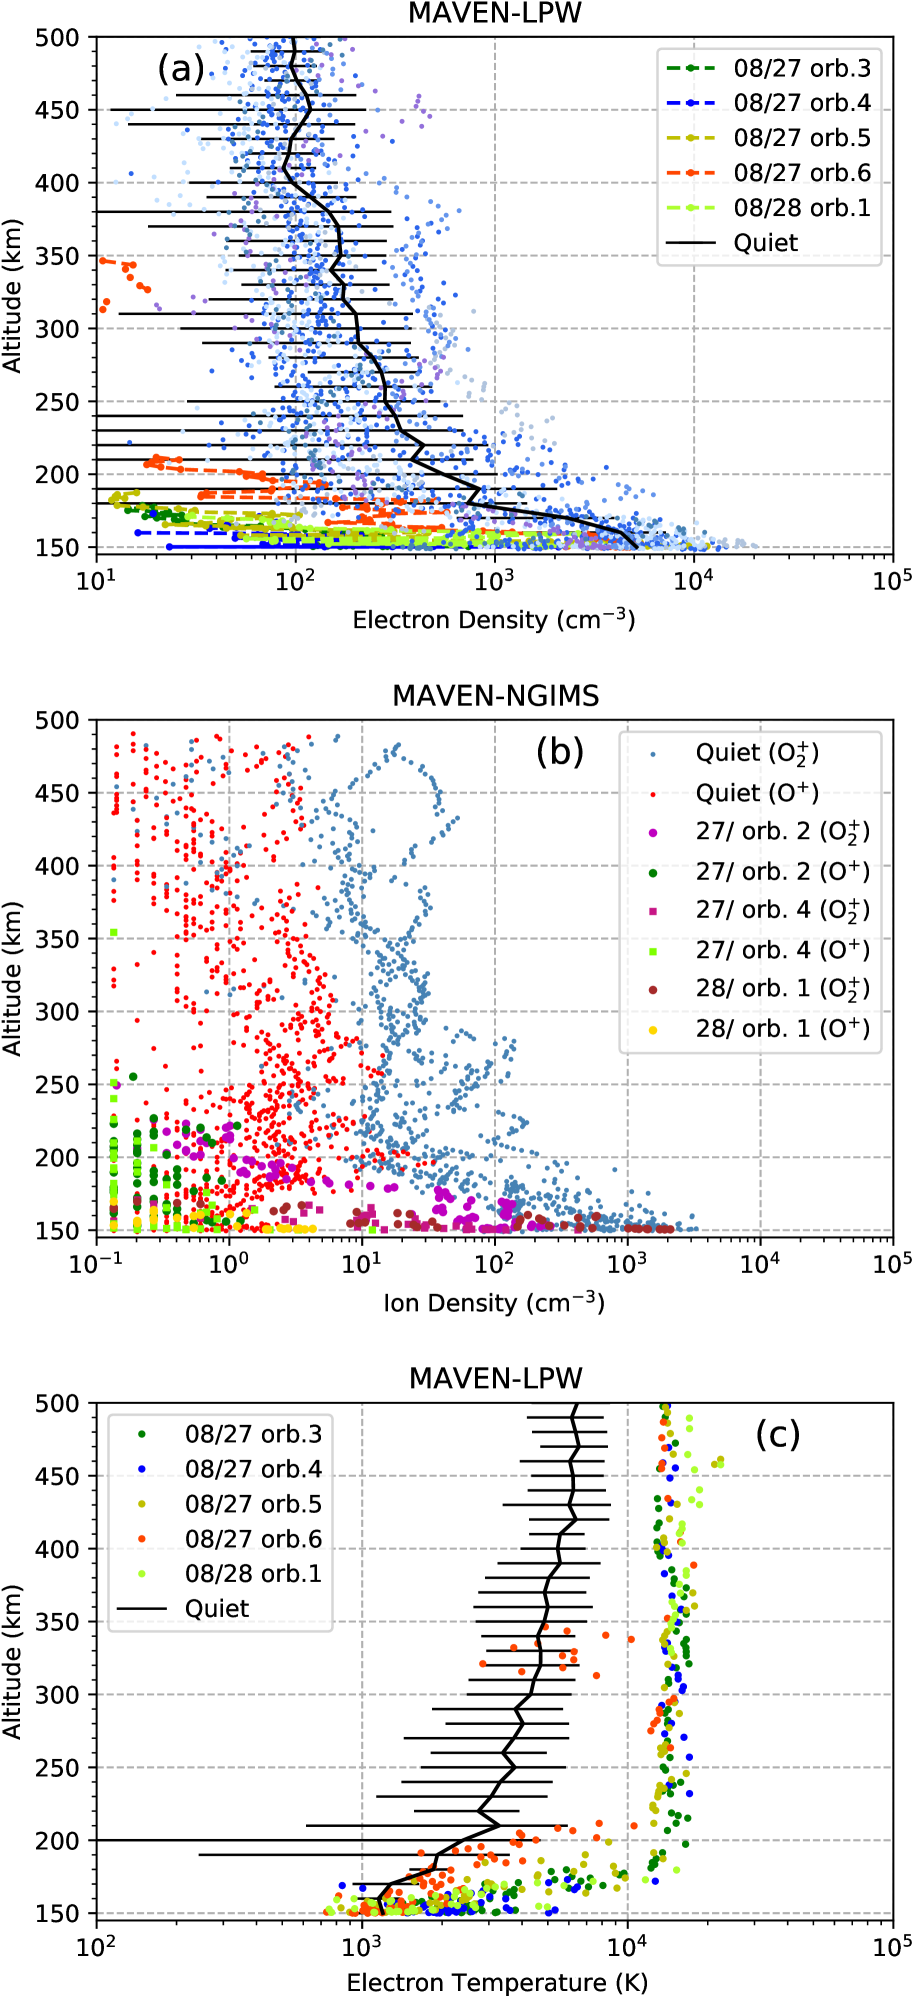
Figure 4a shows several LPW orbits during the event, compared to the quiet time orbits. The quiet time orbit data are shown along with the mean and standard deviation (error bars). The third, fourth, fifth and sixth orbits on 27 August 2018, and the first orbit on 28 August 2018 show significant difference from the quiet time behavior. Above 200 km, the topside electron densities are completely depleted during these orbits. There are a few data points in the electron density profile around 300-350 km altitude region in the profile corresponding to orbit 6 on 27 August 2018. However, these are points with very low density values. It is reported that the signal-to-noise ratios are reduced below electron densities of 200 cm-3 (Fowler et al., 2015). Therefore, we do not infer any information from these isolated structures. At 150-200 km, we only show that the topside electron densities are completely depleted, compared to ‘quiet orbits’ during the space weather event. These gradients are similar to the ionopause-like density gradient reported earlier (Vogt et al., 2015). Figure 4b shows the NGIMS observations of O and O+ ion concentrations for the same period. It must be noted that NGIMS alternates between ion and neutral modes, whereas LPW measures the electron density in all orbits, and hence the signature is seen only in fewer orbits in NGIMS data. Similarly, the number of ‘quiet’ time profiles are also fewer for the NGIMS observations, and hence the mean and the standard deviations are not given. However, the feature that the topside ion densities are highly depleted during the ICME period is unmistakably seen in the NGIMS observations as well. Figure 4c shows the electron temperature observations from the LPW measurement during the event period, along with the quiet time profiles. The topside electron temperatures are enhanced during all the orbits where electron density showed depletion. However, it may be noted that reduced signal-to-noise ratios at regions where electron densities are below densities of 200 cm-3 also result in LP temperature measurement errors increasing to 100% or more (Fowler et al., 2015), and therefore we cannot infer these as the accurate profiles of Te during these days. Despite this, it is evident that the profiles during the ‘event orbits’ show trends which are significantly different (with enhanced values) compared to ‘quiet orbits’.
4 Discussion
The CME event observed near the Sun on 20 August 2018 was a CME without a preceding shock, and is classified as a stealth CME (Mishra & Srivastava, 2019). The observations show that while reaching Mars, the maximum IMF was 10 nT, which may be considered as an intense space weather condition at Mars. The solar wind velocity observed near Mars was 400 km s-1, and this was a slow CME inside a compression region between slow and fast solar winds, even when it reached Mars.
The slow, stealth CME impacted Martian topside ionosphere, and the nightside plasma measurements show that the topside thermal ionosphere is significantly depleted. The electron temperature measurements showed enhancements during this event period. Similar observations were reported by Cravens et al. (1982) for the Venusian nightside ionosphere. On days when disappearing ionospheres were observed by the OETP (Orbiter Electron Temperature Probe) aboard Pioneer Venus mission, the solar wind dynamic pressure were considerably larger than average. It was shown that depleted and variable plasma densities throughout all or a major part of the nightside Venusian ionosphere occurred during periods of large, coherent and horizontal magnetic field events and associated with large solar wind dynamic pressures. It was suggested that because dayside ionopause is at low altitudes when the solar wind dynamic pressure is large and the IMF is strong, the nightside ionosphere supplied by the day-to-night transport of plasma disappears. If the dayside ionosphere is severely reduced then it is expected that the supply of ions to the nightside will be curtailed, and the large horizontal magnetic field will inhibit the downward diffusion. As a result of these, the night side ionosphere will be disappeared. The present observations show that the same is true for Martian ionosphere also. It may also be noted that since this was a slow CME with bulk solar wind velocity near Mars 400 km s-1, the outward flow could be weaker compared to the CMEs with larger velocities. Even though the peak dynamic pressure was only 5 nPa, which is smaller compared to the strong CMEs like the March 2015 event (Jakosky et al., 2015; Thampi et al., 2018), the slow velocities might have allowed more interaction time, and therefore the effectiveness might have increased. This is also due to the fact that the CME was actually within the compression region between the fast and slow solar wind.
5 Summary
The declining phase of solar cycle 24 had a slow stealth CME which was responsible for an intense geomagnetic storm at Earth with Dstmin of -176 nT. The propagation of this CME beyond 1 au and the impact of this CME on Martian plasma environments are studied. The observations show that the stealth CME has reached 1.5 au after 7 days of its initial observations at the Sun, with a peak magnetic field of 10 nT . This CME caused depletion in the nightside topside ionosphere of Mars. The topside ionosphere also had higher electron temperatures compared to the ‘quiet’ values. Even with a peak dynamic pressure as low as 5 nPa, the CME had efficiently impacted the Martian ionosphere, because the CME was slow, and was bracketed between the fast and slow solar winds. This is an unique example to show how slow CMEs can affect the Martian ionosphere. As almost one third of the CMEs occurring during the solar minimum period are of slow, stealth type (Ma et al., 2010), characterizing their impact on Martian ionosphere is important for constraining the ion escape rates.
Acknowledgements
The work is supported by the Indian Space Research Organisation (ISRO). We thank the staff of the ACE Science Center for providing the ACE data and OMNIWeb team for providing the IMF and solar wind data. We gratefully acknowledge the MAVEN team for the data. We also acknowledge using solar observations from SDO/AIA. The WSA-ENLIL+Cone model simulations are used from ENLIL Solar Wind Prediction. C. Krishnaprasad acknowledges the financial assistance provided by ISRO through a research fellowship. This research has made use of SunPy v2.0, an open-source and free community-developed solar data analysis Python package (https://sunpy.org/).
Data Availability
The solar wind velocity and IMF at L1 point are obtained from the SPDF OMNIWeb data center (https://omniweb.gsfc.nasa.gov/).The MAVEN data used in this work are taken from the NASA Planetary Data System (https://pds.nasa.gov/). The solar observations are available at SDO/AIA (https://sdo.gsfc.nasa.gov/). The WSA-ENLIL+Cone model simulations are used from ENLIL Solar Wind Prediction (https://helioweather.net/).
References
- Abunin et al. (2020) Abunin A. A., Abunina M. A., Belov A. V., Chertok I. M., 2020, Solar Physics, 295
- Acuña et al. (1999) Acuña M. H., et al., 1999, Science, 284, 790
- Adams et al. (2014) Adams M., Sterling A. C., Moore R. L., Gary G. A., 2014, The Astrophysical Journal, 783, 11
- Aly (1990) Aly J., 1990, Computer Physics Communications, 59, 13
- Amari et al. (2003) Amari T., Luciani J. F., Aly J. J., Mikic Z., Linker J., 2003, The Astrophysical Journal, 585, 1073
- Andersson et al. (2015) Andersson L., et al., 2015, Space Science Reviews, 195, 173
- Antiochos et al. (1999) Antiochos S. K., DeVore C. R., Klimchuk J. A., 1999, The Astrophysical Journal, 510, 485
- Astafyeva et al. (2020) Astafyeva E., Bagiya M. S., Förster M., Nishitani N., 2020, Journal of Geophysical Research: Space Physics, 125, e2019JA027261
- Brain et al. (2016) Brain D. A., Bagenal F., Ma Y.-J., Nilsson H., Stenberg Wieser G., 2016, Journal of Geophysical Research: Planets, 121, 2364
- Chen et al. (2019) Chen C., Liu Y. D., Wang R., Zhao X., Hu H., Zhu B., 2019, The Astrophysical Journal, 884, 90
- Connerney et al. (2015) Connerney J. E. P., Espley J., Lawton P., Murphy S., Odom J., Oliversen R., Sheppard D., 2015, Space Science Reviews, 195, 257
- Cravens et al. (1982) Cravens T., et al., 1982, Icarus, 51, 271
- Feynman & Martin (1995) Feynman J., Martin S. F., 1995, Journal of Geophysical Research: Space Physics, 100, 3355
- Forbes & Isenberg (1991) Forbes T. G., Isenberg P. A., 1991, ApJ, 373, 294
- Fowler et al. (2015) Fowler C. M., et al., 2015, Geophysical Research Letters, 42, 8854
- Girazian et al. (2017) Girazian Z., Mahaffy P. R., Lillis R. J., Benna M., Elrod M., Jakosky B. M., 2017, Journal of Geophysical Research: Space Physics, 122, 4712
- Halekas et al. (2015) Halekas J. S., et al., 2015, Space Science Reviews, 195, 125
- Halekas et al. (2017) Halekas J. S., et al., 2017, Journal of Geophysical Research: Space Physics, 122, 547
- Jakosky et al. (2015) Jakosky B. M., et al., 2015, Science, 350
- Kliem & Török (2006) Kliem B., Török T., 2006, Phys. Rev. Lett., 96, 255002
- Krishnaprasad et al. (2020) Krishnaprasad C., Thampi S. V., Bhardwaj A., Lee C. O., Kumar K. K., Pant T. K., 2020, The Astrophysical Journal, 902, 13
- Lee et al. (2017) Lee C. O., et al., 2017, Journal of Geophysical Research: Space Physics, 122, 2768
- Lemen et al. (2012) Lemen J. R., et al., 2012, Solar Physics, 275, 17
- Liu et al. (2016) Liu Y. D., Hu H., Wang C., Luhmann J. G., Richardson J. D., Yang Z., Wang R., 2016, The Astrophysical Journal Supplement Series, 222, 23
- Lynch et al. (2016) Lynch B. J., Masson S., Li Y., DeVore C. R., Luhmann J. G., Antiochos S. K., Fisher G. H., 2016, Journal of Geophysical Research: Space Physics, 121, 10,677
- Ma et al. (2010) Ma S., Attrill G. D. R., Golub L., Lin J., 2010, The Astrophysical Journal, 722, 289
- Mahaffy et al. (2014) Mahaffy P. R., Benna M., et al 2014, Space Sci. Rev, 185
- Mays et al. (2015) Mays M. L., et al., 2015, Solar Physics, 290, 1775
- Mishra & Srivastava (2019) Mishra S. K., Srivastava A. K., 2019, Solar Physics, 294
- Mishra et al. (2018) Mishra S. K., Singh T., Kayshap P., Srivastava A. K., 2018, The Astrophysical Journal, 856, 86
- Moore et al. (2001) Moore R. L., Sterling A. C., Hudson H. S., Lemen J. R., 2001, The Astrophysical Journal, 552, 833
- Nitta & Mulligan (2017) Nitta N. V., Mulligan T., 2017, Solar Physics, 292
- O’Kane et al. (2019) O’Kane J., Green L., Long D. M., Reid H., 2019, The Astrophysical Journal, 882, 85
- O’Kane et al. (2020) O’Kane J., Cormack C. M., Mandrini C. H., Démoulin P., Green L. M., Long D. M., Valori G., 2020, The Magnetic Environment of a Stealth Coronal Mass Ejection (arXiv:2012.03757)
- Odstrcil (2003) Odstrcil D., 2003, Advances in Space Research, 32, 497
- Pevtsov et al. (2012) Pevtsov A. A., Panasenco O., Martin S. F., 2012, Solar Physics, 277, 185
- Piersanti et al. (2020) Piersanti M., et al., 2020, Annales Geophysicae, 38, 703
- Robbrecht et al. (2009) Robbrecht E., Patsourakos S., Vourlidas A., 2009, The Astrophysical Journal, 701, 283
- Srivastava et al. (2019) Srivastava A. K., et al., 2019, The Astrophysical Journal, 887, 137
- Thampi et al. (2018) Thampi S. V., Krishnaprasad C., Bhardwaj A., Lee Y., Choudhary R. K., Pant T. K., 2018, Journal of Geophysical Research: Space Physics, 123, 6917
- Török & Kliem (2004) Török T., Kliem B., 2004, in Walsh R. W., Ireland J., Danesy D., Fleck B., eds, ESA Special Publication Vol. 575, SOHO 15 Coronal Heating. p. 56
- Tsurutani et al. (2004) Tsurutani B., Gonzalez W., Zhou X.-Y., Lepping R., Bothmer V., 2004, Journal of Atmospheric and Solar-Terrestrial Physics, 66, 147
- Vogt et al. (2015) Vogt M. F., et al., 2015, Geophysical Research Letters, 42, 8885
- Wyper et al. (2017) Wyper P. F., Antiochos S. K., DeVore C. R., 2017, Nature, 544, 452
- Zhang et al. (2007) Zhang J., et al., 2007, Journal of Geophysical Research: Space Physics, 112
| Day/ | UTC | UTC | Alt | Alt | Lon | Lon | Lat | Lat | SZA | SZA | LST | LST |
| Orbit | (hr) | (hr) | (km) | (km) | (deg) | (deg) | (deg) | (deg) | (deg) | (deg) | (hr) | (hr) |
| INBOUND | From | To | From | To | From | To | From | To | From | To | From | To |
| 27/Orbit 1 | 0.25 | 0.45 | 499.10 | 149.45 | 19.68 | 316.06 | 74.85 | 41.15 | 116.61 | 160.37 | 19.58 | 0.02 |
| 27/Orbit 2 | 4.67 | 4.87 | 496.45 | 150.69 | 84.17 | 20.91 | 74.82 | 41.31 | 116.66 | 160.24 | 19.59 | 23.99 |
| 27/Orbit 3 | 9.10 | 9.29 | 497.58 | 150.37 | 149.94 | 85.68 | 74.87 | 41.31 | 116.36 | 160.26 | 19.50 | 23.98 |
| 27/Orbit 4 | 13.52 | 13.71 | 498.14 | 150.14 | 215.40 | 150.50 | 74.92 | 41.51 | 116.13 | 160.09 | 19.44 | 23.96 |
| 27/Orbit 5 | 17.94 | 18.13 | 497.02 | 150.64 | 280.43 | 215.33 | 74.89 | 41.55 | 116.04 | 160.07 | 19.41 | 23.94 |
| 27/Orbit 6 | 22.36 | 22.55 | 497.73 | 149.97 | 346.11 | 280.18 | 74.95 | 41.79 | 115.75 | 159.85 | 19.33 | 23.91 |
| 28/Orbit 1 | 2.78 | 2.97 | 496.78 | 150.48 | 51.06 | 344.97 | 74.94 | 41.83 | 115.67 | 159.82 | 19.30 | 23.90 |
| 28/Orbit 2 | 7.20 | 7.39 | 499.24 | 151.24 | 116.86 | 49.87 | 74.97 | 42.12 | 115.36 | 159.53 | 19.22 | 23.87 |
| 28/Orbit 3 | 11.62 | 11.82 | 498.03 | 150.43 | 182.27 | 114.69 | 75.00 | 42.26 | 115.15 | 159.40 | 19.16 | 23.85 |
| 24/Orbit 1 | 1.51 | 1.71 | 498.63 | 148.72 | 54.51 | 358.80 | 74.24 | 38.79 | 119.58 | 161.72 | 20.44 | 0.35 |
| 24/Orbit 3 | 10.35 | 10.55 | 499.85 | 148.37 | 185.58 | 128.40 | 74.39 | 38.97 | 119.07 | 161.71 | 20.31 | 0.31 |
| 24/Orbit 4 | 14.78 | 14.97 | 499.64 | 149.36 | 250.48 | 193.31 | 74.37 | 39.25 | 119.02 | 161.53 | 20.28 | 0.28 |
| 24/Orbit 5 | 19.20 | 19.39 | 496.73 | 148.92 | 315.40 | 258.08 | 74.40 | 39.26 | 118.94 | 161.60 | 20.26 | 0.27 |
| 25/Orbit 1 | 4.04 | 4.24 | 497.45 | 149.76 | 85.92 | 27.73 | 74.47 | 39.54 | 118.61 | 161.47 | 20.16 | 0.23 |
| 25/Orbit 2 | 8.46 | 8.66 | 498.66 | 149.28 | 151.70 | 92.61 | 74.54 | 39.82 | 118.30 | 161.27 | 20.07 | 0.20 |
| 25/Orbit 3 | 12.88 | 13.08 | 496.55 | 149.33 | 216.44 | 157.34 | 74.56 | 39.80 | 118.26 | 161.34 | 20.06 | 0.19 |
| 25/Orbit 4 | 17.30 | 17.50 | 498.70 | 149.54 | 282.32 | 222.28 | 74.60 | 40.10 | 117.94 | 161.11 | 19.97 | 0.16 |
| 25/Orbit 5 | 21.73 | 21.92 | 498.35 | 148.81 | 347.69 | 287.08 | 74.67 | 40.26 | 117.73 | 161.01 | 19.91 | 0.14 |
| 26/Orbit 2 | 6.57 | 6.76 | 496.86 | 150.10 | 117.76 | 56.79 | 74.68 | 40.64 | 117.53 | 160.73 | 19.84 | 0.10 |
| 26/Orbit 4 | 15.41 | 15.60 | 496.48 | 150.32 | 248.17 | 186.42 | 74.73 | 40.87 | 117.22 | 160.59 | 19.75 | 0.06 |
| 26/Orbit 5 | 19.83 | 20.03 | 497.04 | 149.98 | 313.89 | 251.19 | 74.79 | 40.86 | 116.93 | 160.63 | 19.67 | 0.04 |