Dense and warm neutral gas in BR1202-0725 at z = 4.7 as traced by the [O I] 145 m line
Abstract
We report the detection of [O I] 145.5m in the BR 1202-0725 system, a compact group at consisting of a quasar (QSO), a submillimeter-bright galaxy (SMG), and three faint Ly emitters. By taking into account the previous detections and upper limits, the [O I] /[C II] line ratios of the now five known high- galaxies are higher than or on the high-end of the observed values in local galaxies ([O I] /[C II] ). The high [O I] /[C II] ratios and the joint analysis with previous detection of [N II] lines for both of the QSO and the SMG suggest the presence of warm and dense neutral gas in these highly star-forming galaxies. This is further supported by new CO (12–11) line detections and a comparison with cosmological simulations. There is a possible positive correlation between the [N II] 122/205 line ratio and the [O I] /[C II] ratio when all local and high-z sources are taken into account, indicating that the denser the ionized gas, the denser and warmer the neutral gas (or vice versa). The detection of the [O I] line in the BR1202-0725 system with a relatively short amount of integration with ALMA demonstrates the great potential of this line as a dense gas tracer for high- galaxies.
1 Introduction
One of the key questions in modern astrophysics is to understand the physical processes that govern the star formation and galaxy assembly in the early universe. Compared to typical star-forming galaxies on the main-sequence (e.g., Noeske et al. 2007; Elbaz et al. 2007; Speagle et al. 2014), QSOs and dusty star-forming galaxies – we will call the latter population as submillimeter-bright galaxies, hereafter SMGs111A recently used term is dusty star-forming galaxies (DSFGs) but we decided to use the conventional term SMG, here, because the name has been used for BR1202-0725 for a long time., in the generally accepted view – release enormous amount of energies coming from active black-hole accretion and/or star formation. In this paper, we refer to main-sequence (MS) galaxies as those within dex from the definition of Speagle et al. (2014), and starburst galaxies as galaxies at least 3 above the main-sequence (i.e., ). While QSOs and SMGs were discovered by different methods, both populations often represent star-bursting galaxies. Of particular interest is understanding how their star formation activities are regulated, their comparison with normal populations (i.e., main-sequence galaxies), and how they impact surroundings.
Oxygen is the third most abundant element in the universe. The neutral oxygen has a ionization potential of 13.62 eV, which is close to that of hydrogen (13.59 eV), so the [O I] emission line arises mostly from neutral regions. Fine structure lines of oxygen serve as one of the main coolants of the interstellar medium (ISM) at far-infrared (FIR) (e.g, Rosenberg et al. 2015). With a critical density of cm-3, [O I] line traces much denser ISM than the [C II] emission line. By constraining the physical properties (mainly the strength of the radiation field and density), one can infer the dense gas distributions where star-forming activity would take in place (e.g., Malhotra et al. 2001). This will essentially lead us to understand galaxy formation and evolution.
The first detection of [O I] () at 145.5 m (hereafter, [O I] 145) was reported in 1983 by Stacey et al. (1983), but the number of galaxies detected in this lower level transition was limited largely due to its fainter nature relative to the higher transition of [O I] () at 63.2 m (hereafter, [O I] 63). The situation was greatly improved with the advent of the Herschel space telescope which allowed studies of detailed ISM conditions of galaxies ranging from ultra-luminous infra-red galaxies (ULIRGs) to low metallicity dwarf galaxies together with other fine-structure lines (e.g., Farrah et al. 2013; Spinoglio et al. 2015; Cormier et al. 2015; Fernández-Ontiveros et al. 2016; Herrera-Camus et al. 2018). For high redshift galaxies (), the line falls into transmission windows that are observable from ground-based telescopes. However, less than a handful of galaxies have been observed and detected in [O I] 145 with help of galaxy lensing (Yang et al. 2019; De Breuck et al. 2019) or for luminous QSO-host galaxies (Novak et al. 2019: non-detection ; Li et al. 2020).
The BR1202-0725 system is a compact group at redshift consisting of a QSO, a SMG and (at least) three Lyman alpha emitters (LAEs; LAE 1, LAE 2, and LAE 3) (Hu et al. 1996; Williams et al. 2014; Drake et al. 2020)222Recent MUSE/VLT observations suggested that Ly emission from the companion dubbed LAE 2 may be part of the QSO’s extended halo, though the presence of a QSO companion, close to the LAE 2, is confirmed by the detection of dust continuum, [C II] and [N II] 205 (the [N II] line is marginal detection with S/N3) line emissions (Wagg et al. 2012; Carilli et al. 2013; Decarli et al. 2014).. The BR1202-QSO and BR1202-SMG are highly star-bursting galaxies with of (corresponding to SFR of 1000 yr-1; e.g., Omont et al. 1996; Yun et al. 2000; Iono et al. 2006). In our previous paper (Lee et al. 2019), we reported the first detection of [N II] 122 m and discussed the ionized gas density for the first time at this redshift, based on the [N II] 122m/[N II] 205m line ratio (hereafter, [N II] 122/205). In this following paper, we report [O I] 145 line detections from both the QSO and the SMG. By adding these two detections, the total number of the [O I] 145 detection at has now reached five.
This work is organized as follows. In Section 2, we explain the observations including ancillary data sets and data analyses. In Section 3, we describe the line detection and discuss the [O I] /[C II] line ratio in comparison with other galaxies. In Section 4, we discuss the ISM conditions inferred from the line ratio gathering other available information and summarize our findings. We adopt a standard CDM cosmology with km s-1 Mpc-1 and and Chabrier initial mass function (IMF; Chabrier 2003).
2 Observations and data analysis
2.1 Band 7 : [O I] 145.5 m observations
The [O I] 145 line observations were part of our ALMA Cycle 2 program (ID : #2013.1.00745.S, PI : T. Nagao). The ALMA observations used 37 antennas with the baseline length ( between 15–558 m (C34-2/1, C34-3/(4)) on 2014 December 13 and 2015 May 14 (total on-source time of Tinteg = 39 minutes).
The set-up for the correlator was four spectral windows (SPW), two of which were set to each sideband, each of the SPWs with a 1.875 GHz bandwidth. The spectral resolution for the upper sideband was set to 3.906 MHz ( 3.2 km s-1) to detect the [O I] line and 7.812 MHz for the lower sideband ( 6.7 km s-1). A strong quasar J1058+0133 and J1256-0547 were chosen for bandpass calibration. J1256-0547 was also the phase calibrator for the Band 7 observations. Ganymede and Titan were chosen for the flux calibrator in Band 7.
We used Common Astronomy Software Applications () (McMullin et al. 2007) version 4.2.2 for calibration using the pipeline script provided by the ALMA Regional Center staffs. We then used CASA 5.6.1 version for imaging and analyzing. Images were produced by task, , and deconvolved down to 1 noise level. The synthesized beam size with natural weighting is . Tapered images were also created with uvtaper paramters of (the corresponding synthesized beams are , , and , respectively) to check the existence of any extended emissions, especially for QSO, that could resemble the Ly halo (Drake et al. 2020). We first CLEANed images from visibilities without continuum subtraction where the CLEAN masks were made based on the position of each source (i.e., QSO, SMG, LAE 1 and LAE 2) with a spectral binning of 100 km s-1. Continuum subtraction was applied using after the full field-of-view (FoV) image was created. It was intended to obtain improved results of continuum subtraction for galaxies off from the phase center. The continuum was subtracted with a linear fit by choosing line-free channels. The 1 noise level after continuum subtraction at 100 km s-1 is 0.40 mJy beam-1 for natural weighting. For tapered images, the noise levels are 0.46, 0.51 and 0.57 mJy beam-1 for uvtaper parameters of , and , respectively, at 100 km s-1. Primary beam correction was also applied to get final images.
Line intensity maps were created by choosing a channel range which gives the highest peak signal-to-noise ratio (S/N). We measured line flux using the integrated map for each source and investigated the curve of growth as a function of aperture sizes using . Typically, the peak S/Ns were the highest when the aperture size was set to a double the beam size. We measured the underlying Gaussian area in the 1D spectrum as well, which gives consistent values within the errors compared to the fitted values in the 2D images. The line widths are measured using the same aperture size () and fitted the spectrum with a single Gaussian component. We further investigated the reliability image-based continuum subtraction by performing continuum subtraction in a 1D spectrum (for each source) adopting the same aperture size, which also gave consistent values of fluxes (i.e., 1D Gaussian area) and line widths within the fitting errors. As for the final measurements for fluxes and line widths, we used the -tapered image cube and took the aperture of .
2.2 Ancillary data sets of CO (12–11), HCN (6–5), and HCO+(6–5) line observations
To demonstrate a supportive argument for the [O I] detections, we take two more data sets that our team were awarded using ALMA as PI programs. One is from the same ALMA Cycle 2 program (ID: #2013.1.00745.S, PI : T. Nagao) where the CO (12–11) (Band 6) line was also targeted. This ALMA program was designed to detect multiple fine-structure lines from the BR1202-0725 system, including the [O I] 145 line, as described above, and two [N II] fine-structure lines at 122 m and 205 m. The Band 6 observations targeted the [N II] 205m and CO (12–11) line at the same time at the upper and lower side band each. See the details of the observational summary presented in Lee et al. (2019). The CO (12–11) line is detected (see Section 4.2) from the SMG and the QSO and we present the line profiles and maps in Appendix A.
The other one is the Band 3 observations (ID: #2013.1.00259.S, PI : M. Lee) which was only partially executed (20%, mins) out of 8.4 hrs requested. In this program, we aimed at detecting two dense gas tracers of HCN (6–5) and HCO+(6–5) to constrain the dense gas fraction and the lines are not detected for this partial execution (see Appendix B). The critical densities of the high- HCN and HCO+ transitions are two orders of magnitude higher that of [O I] . Still, the non-detection of the lines alternatively demonstrate the strength of the [O I] line as a dense gas ( cm-3) tracer that was detected with less than a half of the time executed for the Band 3 observations.
3 Results
3.1 Detection of [O I] 145 and line properties
| [O I] 145 | QSO | SMG | LAE1 | LAE2[a | LAE3 |
|---|---|---|---|---|---|
| [Jy km s-1] | [b | [b | [b | ||
| FWHM [km s-1] | 56[c | 338[c | … | ||
| [] | … | … | … | ||
| CO (12–11) | QSO | SMG | LAE1 | LAE2[a | LAE3 |
| [Jy km s-1] | [d | [d | [d | ||
| FWHM [km s-1] | 56[c | 338[c | … | ||
| [] | … | … | … |
-
•
aDrake et al. (2020) concluded that “LAE2” is not the powering source of the Ly emission seen the HST 775W map. Instead, the HST emission is a stellar component passing through the QSO halo and is outshone by the halo. However, a QSO companion close to LAE 2 is confirmed by dust, [C II] , and (marginally) [N II] emissions (Wagg et al. 2012; Carilli et al. 2013; Decarli et al. 2014), so we use the name “LAE2” to indicate this companion.
-
•
b 3 upper limit for an aperture of 1”.4 in the tapered image with uvtaper=. The 3 limit is corresponding to a Gaussian area assuming the FWHM of the lines and using the average channel noise. We adopt the FWHM values to be the same as the [C II] from Carilli et al. (2013) for LAE 1 and LAE 2. For LAE 3, we assumed FWHM = 200 km s-1, considering the reported FWHM in other literature for low-mass galaxies (e.g., Pavesi et al. 2018; Béthermin et al. 2020). All assumed FWHM values for LAEs are narrower than those of the Ly emissions reported in Drake et al. (2020). The noise is calculated based on the tapered cube (uvtaper = ) with a spectral resolution of 100 km s-1.
-
•
c From [C II] observations in Carilli et al. (2013).
-
•
d 3 upper limit for an aperture of 2”.0. We assumed the same FWHM values that were assumed in the [O I] line esimates. The noise is calculated based on a cube with a spectral resolution of 50 km s-1.
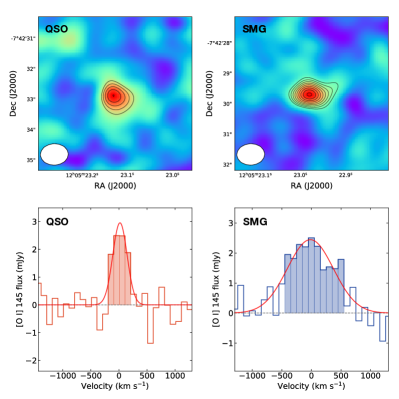
The bottom panels of Figure 1 show the line flux versus the velocity of the QSO (left) and SMG (right). We detect the [O I] line in the QSO and SMG with a signal to noise ratio of 7 and 10, respectively. The [O I] 145 line from the SMG is detected at a higher significance level than the QSO. The [O I] 145 is not detected in LAE 1 and LAE 2 at the redshifts and the positions reported in Carilli et al. (2013). The positions in Carilli et al. (2013) are from the submillimeter continuum (SMG, QSO, and LAE 2) and [C II] (LAE 1) emissions. The line search for every target was based on checking the peak S/N in a fixed aperture by varying the integrating range within the full velocity coverage of the upper sideband. The searching area is fixed to the beam size for all but LAE 1. As the optical position (of the redshifted Ly emission) for LAE 1 is offset from the [C II] position by (Drake et al. 2020), we search for a line detection around a -radius circular region from the [CII] peak to check if there is any emission associated to the Ly emission instead of the [C II] . There is no significant detection signature for the LAE 1 above 3. We summarize the line properties in Table 1 for the [O I] line.
The line widths (full-width half-maximum, FWHM) are and km s-1 for the SMG and the QSO, respectively. They are consistent with those of [C II] (700 km s-1 (SMG), 300 km s-1 (QSO); Wagg et al. 2012; Carilli et al. 2013; Carniani et al. 2013) within uncertainties, but there is a hint of a broader [O I] 145 line width than the [C II] 158 for the SMG. The [N II] fine-structure lines in our previous work (Lee et al. 2019) also showed such a signature (i.e., a broader line width) for the SMG with FWHM km s-1. As for the QSO, the [O I] 145 line widths are consistent with those of CO, [C II] 158 and [N II] 205, but [N II] 122 reported in the literature (Salomé et al. 2012; Wagg et al. 2012; Lee et al. 2019). Recent study of star-forming galaxies at have shown that different emission lines trace different components of galaxies (e.g., Carniani et al. 2017, 2020). However, the spatial resolution of current observations is not sufficient to spatially resolve the emission of the FIR lines in our galaxies. Future high-resolution observations will be able to reveal the origin of the discrepancy in line width and whether the FIR lines are tracing distinct regions of the galaxies. Having the resolution limit, we regard the lines as originating from the same regions, at least globally. The derived [O I] 145 line luminosities are and for the SMG and the QSO, respectively.
3.2 [O I]/[C II] Line ratio
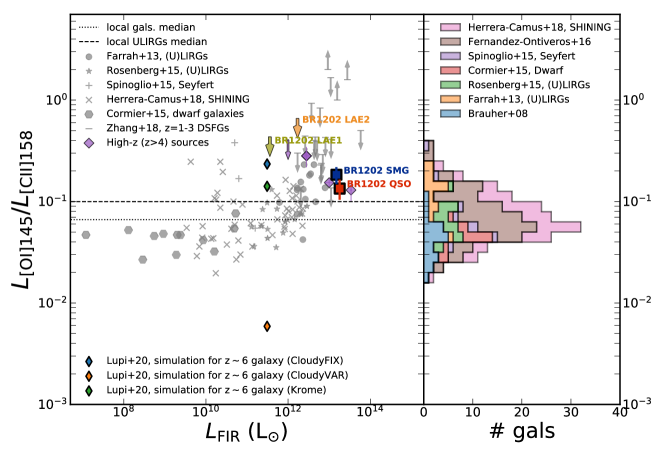
The derived line luminosity ratios are / = and for the SMG and the QSO, respectively. The upper limits on the line ratio for LAE 1 and LAE 2 are and , respectively, using the linewidth constraints in the literature (see Table 1 footnote). In the right panel of Figure 2, we plot a stacked histogram of the [O I] 145/[C II] 158 line ratios of local galaxies. It includes various types of galaxies from dwarf galaxies to ULIRGs and Seyfert. They are obtained from Brauher et al. (2008), Farrah et al. (2013), Rosenberg et al. (2015), Cormier et al. (2015), Spinoglio et al. (2015), Fernández-Ontiveros et al. (2016), and Herrera-Camus et al. (2018). When there are different flux measurements on the same galaxies from the literature we plot the most recent ones. Out of 187 local galaxies considered, the median (mean) value of / is 0.07 (0.08) with a standard deviation of 0.06: of galaxies have the [O I] -to-[C II] luminosity ratio below 0.13, which is the lowest value observed in the galaxies. Among the local galaxies, ULIRGs (30 galaxies from Farrah et al. 2013; Rosenberg et al. 2015; Herrera-Camus et al. 2018) exhibit a slightly higher median (mean) value of 0.10 (0.11) with a standard deviation 0.05, which is comparable (at 1) to high-z galaxies. We plot these median values on the left panel of Figure 2. Considering these, we conclude that high- SMGs and QSOs have higher [O I] -to-[C II] ratios compared to typical local galaxies at that are consistent with the high-end values observed in local ULIRGs.
In the left panel of Figure 2, we show the [O I] /[C II] line ratio as a function of FIR luminosity for galaxies with FIR values reported. We used the 340 GHz flux (Iono et al. 2006; Wagg et al. 2012; Carilli et al. 2013) to convert it into . For LAE 1 and LAE 2, we adopted the value reported in Carilli et al. (2013) and the FIR luminosities are and for LAE 1 and LAE 2, respectively.
There is a hint of the [O I] /[C II] ratio increase as a function of FIR luminosity () for in log scale. High- sources detected in both lines align well with this trend that for galaxies with higher tend to exhibit higher [O I] /[C II] values within the observed scatter. If we only consider the local galaxy studies, which will be complete and not limited by sensitivity in most cases, the positive correlation is observed for with several exceptional data points from the SHINING survey (Herrera-Camus et al. 2018). For a lower , e.g., in dwarf galaxies, the [O I] /[C II] ratio seems to saturate into a roughly constant value of 0.02-0.05, which is also observed in the histogram on the right panel of Figure 2. The non-detection of [O I] 145 and uncertain in the LAEs do not put stricter constraints on the correlation between the [O I] -to-[C II] line ratio and .
The higher [O I] -to-[C II] line ratios observed in the high- galaxies may be due to their LFIR compared to local samples. Meanwhile, the fact that high- galaxies exhibit a higher value than the average of ULIRG might suggest that ISM properties at fixed evolves as a function of redshift. Future observations with larger number of galaxies will verify this and it will allow us to understand whether high- starburst galaxies are different from local populations.
4 Discussion
[O I] 145 line originates solely from neutral regions with a critical density of cm-3, while the [C II] line can come both from ionized and neutral regions. Local galaxy studies have shown that the [O I] 63/[C II] 158 ratio is a good tracer of the photo-dissociation region (PDR, or neutral gas) density, once the [C II] emission from ionized regions is subtracted, while the [O I] 63/[O I] 145 is a tracer of the neutral gas temperature for a range between 100 and 400 K (e.g., Malhotra et al. 2001; Fernández-Ontiveros et al. 2016) with the caveats of optical depth effect and self-absorption in [O I] 63. The line ratio between [O I] 145 and [C II] ([O I] /[C II] ) can be therefore, used as a tracer of the gas pressure in the neutral region. In the following, we first constrain the neutral gas fraction of the [C II] emissions and then discuss the physical meanings of the observed [O I] -to-[C II] line ratio based on the dust temperature constraint, the detection of CO (12–11), and comparison with a cosmological model.
4.1 Neutral fraction of the [CII] line
In order to infer a neutral gas fraction of the [C II] emission first, we calculate the fraction following local galaxy studies (e.g., Croxall et al. 2017; Díaz-Santos et al. 2017; Herrera-Camus et al. 2018) using the [N II] 205/[C II] 158 line ratio:
| (1) |
where is the [C II] 158/[N II] 205 luminosity ratio if the [C II] 158 line is originated only from ionized regions. Croxall et al. (2017) showed that is almost constant ranging between 2.5 and 3 for an electron density range of cm-3 using the collision rates of Tayal (2008, 2011) and Galactic gas phase abundances of nitrogen (Meyer et al. 1997) and carbon (Sofia et al. 2004) (see also Malhotra et al. 2001; Oberst et al. 2006). The values constrained in Lee et al. (2019) are = and cm-3 for the SMG and QSO, respectively. Therefore, it is reasonable to assume a value between 2.5 and 3 as . We use the [C II] and [N II] flux values reported in Wagg et al. (2012) and Lee et al. (2019), respectively. We note that Carniani et al. (2013) reported lower values for the [C II] flux due to a smaller beam size from their differently -weighted images. Decarli et al. (2014) reported the [N II] 205 observations of this system from IRAM Plateau de Bure Interferometer (PdBI) observations. But the published flux values (or upper limits) are higher than what we obtained from our ALMA observations. This discrepancy can be attributed to their low S/Ns and different ways of flux measurements. As discussed in Lee et al. (2019), our [N II] 205 flux is consistent with the measurement by Pavesi et al. (2016), which is based on our data set, and further checked with other independent (ALMA) data reported in Lu et al. (2017). The systematic errors from the flux measurement method could change the flux value by a factor of 3, however. As it is difficult to pin down the origin of the difference in different observations, we stick to our best measurement listed in Lee et al. (2019), where the flux measurements are done similarly to the work presented here.
The inferred neutral fraction, , is 79-83% (SMG) and 83-86% (QSO) for the observed [N II] 205/[C II] 158 luminosity ratios of (SMG) and (QSO). For comparison, local studies have found that the contribution of the [C II] emission originated from H II regions to the total [C II] is not dominant (less than 50%) across a wide range of SFR density and metallicity (Croxall et al. 2017; Díaz-Santos et al. 2017; Herrera-Camus et al. 2018). Similarly, for the QSO and the SMG at , the [C II] emission is mostly coming from neutral regions rather than the ionized. With the constraints, we use the [O I] 145/[C II] 158 ratio as a tracer for the neutral gas density and gas temperature (thus the gas pressure), without imposing any assumptions of interstellar medium (ISM) structure.
4.2 Dust temperature and CO (12–11) detection
We infer from an empirical fitting that connects the [O I] /[C II] neutral line ratio to through the FIR color () (Díaz-Santos et al. 2017, using Equation 6 and 2 in the paper). It gives 43 K and 54 K for the SMG and the QSO, respectively and they are well-matched with the fitted SED dust temperature in Salomé et al. (2012). For this calculation we have assumed [O I] 63/[O I] 145 = 10, and the neutral fraction of the [C II] 158 emission based on the [N II] 205/[C II] 158 line ratio as explained above. We also note that the high neutral gas fraction of the [C II] emission is also coupled with the warm dust temperature. The [O I] 63/[O I] 145 ratio below 10 would imply an optically thick emission (Tielens & Hollenbach 1985) and many local galaxies (except for a few extraordinary galaxies, e.g., Arp220, IRAS17208-0014 with self-absorption of [O I] 63) have [O I] 63/[O I] 145 ratios higher than that. For the optically thin case, the inferred dust temperature would be higher. The detection of [O I] 63 will be very challenging from ground-based telescopes for the BR1202-0725 system; the line would fall into an ALMA Band 10 coverage, where the transmission is below 0.2 at a best precipitable water vapor condition and the line [O I] 63 may also suffer from self-absorption for these dusty population. Nevertheless, the remarkable agreement between the dust temperature from different approaches strengthens the view that for both the SMG and the QSO, the observed high [O I] 145/[C II] 158 ratios are closely connected to their warm dust temperatures and hence high kinetic gas temperatures.
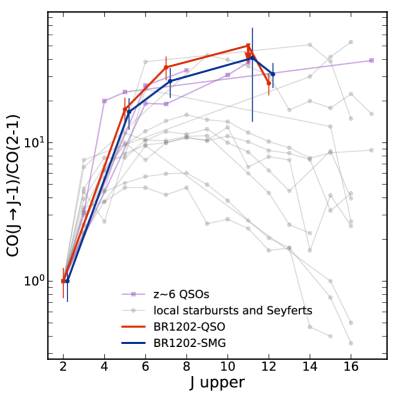
As another, supportive evidence, we report the first detection of CO (12–11) line in the SMG and the QSO (see Appendix A for images and the spectra). In Figure 3, we show the CO spectral energy distribution (CO SLED) for various targets from local and high- galaxy studies (Mashian et al. 2015; Carniani et al. 2019). For the CO SLEDs of the BR1202-0725 pair, we took values from Salomé et al. (2012) for , and ( values were originally from Carilli et al. (2002) but corrected for the VLA bandwidth). While we defer a modeling of the CO SLED, the CO SLEDs of the SMG and the QSO are similar to those of QSOs, local Seyferts (NGC 1068, NGC 4945) or warm ULIRGs (NGC 4418). These similarities provide additional supporting evidence that the QSO and the SMG have similar gas properties of warm and dense gas.
4.3 Comparison with a cosmological simulation
Finally, we compare with a cosmological simulation (Lupi et al. 2020) which allows us to infer the physical properties from the line ratio. They performed a cosmological zoom-in simulation targeting halo at and investigated the far-infrared fine-structure lines. While the target redshift and galaxies ( and SFR yr-1 at ) are different from the star-bursting pair (SFR yr-1) at , it provides an insight regarding the [O I] /[C II] line ratio. They ran three different models, two (CloudyVAR and CloudyFIX) using CLOUDY (Ferland et al. 1998) and one (Krome) KROME (Grassi et al. 2014) to test how photoinoization equilibrium and thermal state assumptions affect the FIR emission properties. The thermodynamics and chemistry are fully coupled in the Krome model, whereas in the two Cloudy models they are not. CloudyFIX assume a constant temperature to take into account any dynamical effects while for CloudyVAR the temperature is variable according to the radiation attenuation. Krome does not take into account the chemical network e.g., CO, while CloudyVAR and CloudyFIX do.
In the left panel of Figure 2, we plot the data points from three different models presented in Lupi et al. (2020). We converted the simulated SFR into using the Kennicutt (1998) recipe to overplot in Figure 2. This conversion may contain large uncertainties, depending on the assumptions e.g., IMF, star-formation history, contribution of the old stars. As noted in Kennicutt (1998), the conversion can have uncertainties of 30% (starburst galaxies) and the inferred can result in up to a factor of two to three lower value for normal spiral galaxies. While the converted is different by two orders of magnitude compared to the QSO and the SMG, the observed [O I] -to-[C II] line ratios are consistent with those predicted by the CloudyFIX and Krome models.
Lupi et al. (2020) discussed the origin of the differences between different models. As the [O I] line is strongly dependent on the gas temperature, they claimed that the lower [O I] -to-[C II] line ratio in CloudyVAR can be explained by the lower temperature predicted in the model compared to the others.
Both Krome and CloudyFIX simulations show both the higher temperature and gas density distribution in the (luminosity-weighted) density-temperature phase diagram than CloudyVAR.
Meanwhile, the difference between Krome and CluodyFIX could be coming from the nature (or a caveat) of the Krome model where the chemical network (e.g., CO formation, highly ionized species) is not fully taken into account.
In the Cloudy models, the calculation is post-processed that all input values are already attenuated than the intrinsic flux that would affect the chemistry.
Further, in both Cloudy models, gas shocks are not taken into account and a temperature may not be fully consistent with the hydrodynamics in the simulation.
We should note again that the simulated galaxy is different from our galaxies in that they have different galaxy properties (e.g., , SFR) and redshift.
As the simulation does not give any information on how dusty galaxy they are, another uncertainty comes in for the conversion between SFR and .
Despite the different caveats in the models and different galaxy properties between the observed and simulated galaxies, the comparison between the observations and simulations suggest the existence of dense and warm neutral gas in the BR1202-0725 system.
Taking all together, the high [O I] /[C II] ratios in the SMG and the QSO reasonably indicate the existence of dense and warm neutral gas. The SMG shares ISM properties with the QSO, where the black hole accretion is actively happening. While, at this moment, it is difficult to conclude whether our observational fact challenges the starburst-QSO evolutionary scenario (e.g., Hopkins et al. 2008), it is tempting to say that the highly obscured starburst (the SMG) and the QSO have similar ISM properties and the SMG might have a hidden AGN, even though both galaxies have not encountered a final coalescence.

4.4 Multi-phase properties
Figure 4 shows the [N II] 122/[N II] 205 versus [O I] 145/[C II] 158 ratios of the QSO and the SMG. We gathered all data in the literature from local and high- galaxy studies when they are available (Cormier et al. 2015; Spinoglio et al. 2015; Fernández-Ontiveros et al. 2016; De Breuck et al. 2019; Novak et al. 2019; Yang et al. 2019; Li et al. 2020). The figure compares the ionized gas density on the vertical axis versus the neutral gas density and temperature on the horizontal axis.
Two dust-obscured star-forming galaxies (BR1202-SMG and SPT0418-47) have relatively low [N II] 122/[N II] 205 ratios compared to its high [O I] /[C II] ratios, which are similar to the other high- samples. As shortly discussed in Lee et al. (2019), the optical depth can affect the line fluxes at high frequencies and, in particular, it may lead to a fainter [N II] 122 flux, thus lowering the [N II] ratio. The [O I] and [C II] lines are closer in frequency and both of them at lower frequency thus may be less affected than the [N II] line ratio. We also discussed in the previous paper that [N II] may not trace very dense ionized gas because a combination of the [N II] lines can trace gas density up to 500 cm-3. In this regard, it may be worth noting on one exceptional data point of NGC 4151, which exhibits a low [N II] ratio at the given [O I] -to-[C II] ratio in the local samples (i.e., an x-cross just below SPT0418-47). It is a Seyfert galaxy where its electron density is found to be high ( cm-3) if it is derived based on the [Ne V]. Considering this, the low values in the [N II] ratios in these two dust-obscured star-forming galaxies may also indicate the existence of even denser gas that cannot be traced by [N II] .
For galaxies detected in all four lines (a total number of 43 including the lower limit constraints from dwarf galaxies), there is a possible positive correlation, but statistically not significant, between the ionized gas density (traced by the [N II] ratio) and neutral gas density and temperature (traced by [O I] /[C II] ; Spearman’s correlation coefficient = 0.24 with -value 0.13).
However, if we exclude three ‘outliers’ of BR1202 SMG, SPT0418-47 and NGC 4151 whose [N II] ratios are low compared to their high [O I] -to-[C II] ratio, we get a more significant correlation signature (i.e., Spearman’s coefficient of 0.37 with a -value of 0.02).
Of the zeroth order, the positive correlation is naively expected if the [N II] 122/205 and [O I] 145/[C II] 158 ratios trace density of the H II region and PDR which are physically connected with each other.
By taking into account the correlation between and [O I] /[C II] and the one between [N II] and [O I] /[C II] , extreme SFRs for high- galaxies can be attributed to the existence of dense gas in both phases, ionized and neutral.
We defer more sophisticated models to explain the observed line ratios and ISM structures and conditions to a future article.
To conclude, we reported the detection of [O I] 145 from a compact group of BR1202-0725 system at . This adds two more galaxies in addition to three in the currently available detection for galaxies at . We find high [O I] /[C II] ratios compared to local galaxies for all high- galaxies which exhibit high FIR luminosities. The high [O I] /[C II] ratios and the joint analysis with previous detection of [N II] lines for both of the QSO and the SMG suggest the presence of warm and dense neutral gas in these highly star-forming galaxies. The detection of the [O I] line in both systems with a relatively short amount of integration with ALMA demonstrates the great potential of this line as a dense gas tracer for high-z galaxies. Yet, we are still probing highly star-forming exemplars, the [O I] line detections of ‘normal’ galaxies are also foreseen in future observations.
Appendix A Detection of CO(12-11)
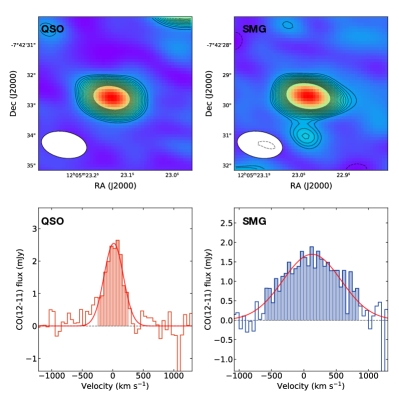
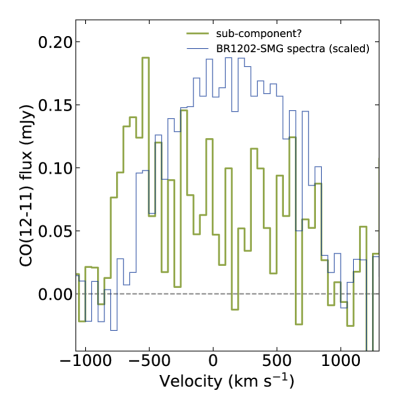
We detect CO (12–11) line emissions both from the SMG and the QSO. Figure 5 shows the integrated line maps and the spectrum. Three LAEs are not detected in CO (12–11). The line fluxes, FWHM and luminosities are summarized in Table 1. For the SMG, it seems that there is a sub-component associated to it in the southern area which is peaked at km s-1 with a long tail redward (Figure 6). We could not identify a similar signature in the [C II] map, though if it is real, it may be relevant to the [C II] bridge component connected with the QSO (Carilli et al. 2013). LAE 1 is known to have an offset between the Ly and the [CII] emissions, which is . Accordingly, we have checked whether the CO (12–11) subcomponent is associated with the Ly emission instead of the [C II] emission. The CO (12–11) subcomponent is offset from the [C II] emission by , which is larger than the Ly–[C II] separation. Therefore, if the emission is real, this might not be directly associated with the Ly emission from LAE 1, but with a halo or outflowing component from the SMG, if any. The extended Ly emissions (Drake et al. 2020) reach out to a region where the subcomponent is detected. Future, deeper observations would need to verify this.
Appendix B HCN (6–5) and HCO+(6–5) observations
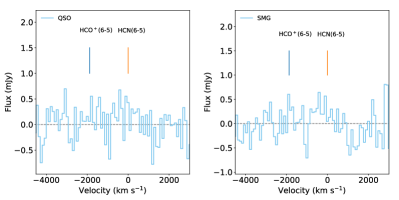
At a resolution of , there is no clear detection feature around the expected velocity range (Figure 7). The spectrum is after the continuum subtraction using (fitorder = 1333Changing to fitorder = 0 does not change the result.). For a circular aperture of , the 3 upper limit placed by this ALMA observations are Jy km s-1and Jy km s-1, for the QSO and the SMG, respectively, assuming the same line widths measured from the CO (12-11) emission (Table 1) and using the noise level measured at 100 km s-1 resolution.
References
- Astropy Collaboration et al. (2013) Astropy Collaboration, Robitaille, T. P., Tollerud, E. J., et al. 2013, A&A, 558, A33
- Béthermin et al. (2020) Béthermin, M., Fudamoto, Y., Ginolfi, M., et al. 2020, A&A, 643, A2
- Brauher et al. (2008) Brauher, J. R., Dale, D. A., & Helou, G. 2008, ApJS, 178, 280
- Carilli et al. (2013) Carilli, C. L., Riechers, D., Walter, F., et al. 2013, ApJ, 763, 120
- Carilli et al. (2002) Carilli, C. L., Kohno, K., Kawabe, R., et al. 2002, AJ, 123, 1838
- Carniani et al. (2013) Carniani, S., Marconi, A., Biggs, A., et al. 2013, A&A, 559, A29
- Carniani et al. (2017) Carniani, S., Marconi, A., Maiolino, R., et al. 2017, A&A, 605, A105
- Carniani et al. (2019) Carniani, S., Gallerani, S., Vallini, L., et al. 2019, MNRAS, 489, 3939
- Carniani et al. (2020) Carniani, S., Ferrara, A., Maiolino, R., et al. 2020, MNRAS, 499, 5136
- Chabrier (2003) Chabrier, G. 2003, PASP, 115, 763
- Cormier et al. (2015) Cormier, D., Madden, S. C., Lebouteiller, V., et al. 2015, A&A, 578, A53
- Croxall et al. (2017) Croxall, K., Smith, J. D. T., Pellegrini, E., et al. 2017, ArXiv e-prints, arXiv:1707.04435
- De Breuck et al. (2019) De Breuck, C., Weiß, A., Béthermin, M., et al. 2019, A&A, 631, A167
- Decarli et al. (2014) Decarli, R., Walter, F., Carilli, C., et al. 2014, ApJ, 782, L17
- Díaz-Santos et al. (2017) Díaz-Santos, T., Armus, L., Charmandaris, V., et al. 2017, ApJ, 846, 32
- Drake et al. (2020) Drake, A. B., Walter, F., Novak, M., et al. 2020, arXiv e-prints, arXiv:2007.14221
- Elbaz et al. (2007) Elbaz, D., Daddi, E., Le Borgne, D., et al. 2007, A&A, 468, 33
- Farrah et al. (2013) Farrah, D., Lebouteiller, V., Spoon, H. W. W., et al. 2013, ApJ, 776, 38
- Ferland et al. (1998) Ferland, G. J., Korista, K., Verner, D. A., et al. 1998, PASP, 110, 761
- Fernández-Ontiveros et al. (2016) Fernández-Ontiveros, J. A., Spinoglio, L., Pereira-Santaella, M., et al. 2016, ApJS, 226, 19
- Grassi et al. (2014) Grassi, T., Bovino, S., Schleicher, D. R. G., et al. 2014, MNRAS, 439, 2386
- Herrera-Camus et al. (2018) Herrera-Camus, R., Sturm, E., Graciá-Carpio, J., et al. 2018, ApJ, 861, 94
- Hopkins et al. (2008) Hopkins, P. F., Hernquist, L., Cox, T. J., & Kereš, D. 2008, ApJS, 175, 356
- Hu et al. (1996) Hu, E. M., McMahon, R. G., & Egami, E. 1996, ApJ, 459, L53
- Iono et al. (2006) Iono, D., Yun, M. S., Elvis, M., et al. 2006, ApJ, 645, L97
- Kennicutt (1998) Kennicutt, Jr., R. C. 1998, ARA&A, 36, 189
- Lee et al. (2019) Lee, M. M., Nagao, T., De Breuck, C., et al. 2019, ApJ, 883, L29
- Li et al. (2020) Li, J., Wang, R., Cox, P., et al. 2020, arXiv e-prints, arXiv:2007.12339
- Lu et al. (2017) Lu, N., Zhao, Y., Díaz-Santos, T., et al. 2017, ApJ, 842, L16
- Lupi et al. (2020) Lupi, A., Pallottini, A., Ferrara, A., et al. 2020, MNRAS, 496, 5160
- Malhotra et al. (2001) Malhotra, S., Kaufman, M. J., Hollenbach, D., et al. 2001, ApJ, 561, 766
- Mashian et al. (2015) Mashian, N., Sturm, E., Sternberg, A., et al. 2015, ApJ, 802, 81
- McMullin et al. (2007) McMullin, J. P., Waters, B., Schiebel, D., Young, W., & Golap, K. 2007, in Astronomical Society of the Pacific Conference Series, Vol. 376, Astronomical Data Analysis Software and Systems XVI, ed. R. A. Shaw, F. Hill, & D. J. Bell, 127
- Meyer et al. (1997) Meyer, D. M., Cardelli, J. A., & Sofia, U. J. 1997, ApJ, 490, L103
- Noeske et al. (2007) Noeske, K. G., Weiner, B. J., Faber, S. M., et al. 2007, ApJ, 660, L43
- Novak et al. (2019) Novak, M., Banados, E., Decarli, R., et al. 2019, arXiv e-prints, arXiv:1906.08569
- Oberst et al. (2006) Oberst, T. E., Parshley, S. C., Stacey, G. J., et al. 2006, ApJ, 652, L125
- Omont et al. (1996) Omont, A., Petitjean, P., Guilloteau, S., et al. 1996, Nature, 382, 428
- Pavesi et al. (2016) Pavesi, R., Riechers, D. A., Capak, P. L., et al. 2016, ApJ, 832, 151
- Pavesi et al. (2018) Pavesi, R., Sharon, C. E., Riechers, D. A., et al. 2018, ApJ, 864, 49
- Rosenberg et al. (2015) Rosenberg, M. J. F., van der Werf, P. P., Aalto, S., et al. 2015, ApJ, 801, 72
- Salomé et al. (2012) Salomé, P., Guélin, M., Downes, D., et al. 2012, A&A, 545, A57
- Sofia et al. (2004) Sofia, U. J., Lauroesch, J. T., Meyer, D. M., & Cartledge, S. I. B. 2004, ApJ, 605, 272
- Speagle et al. (2014) Speagle, J. S., Steinhardt, C. L., Capak, P. L., & Silverman, J. D. 2014, ApJS, 214, 15
- Spinoglio et al. (2015) Spinoglio, L., Pereira-Santaella, M., Dasyra, K. M., et al. 2015, ApJ, 799, 21
- Stacey et al. (1983) Stacey, G. J., Smyers, S. D., Kurtz, N. T., & Harwit, M. 1983, ApJ, 265, L7
- Tayal (2008) Tayal, S. S. 2008, A&A, 486, 629
- Tayal (2011) —. 2011, ApJS, 195, 12
- Tielens & Hollenbach (1985) Tielens, A. G. G. M., & Hollenbach, D. 1985, ApJ, 291, 722
- Wagg et al. (2012) Wagg, J., Wiklind, T., Carilli, C. L., et al. 2012, ApJ, 752, L30
- Williams et al. (2014) Williams, R. J., Wagg, J., Maiolino, R., et al. 2014, MNRAS, 439, 2096
- Yang et al. (2019) Yang, J., Venemans, B., Wang, F., et al. 2019, ApJ, 880, 153
- Yun et al. (2000) Yun, M. S., Carilli, C. L., Kawabe, R., et al. 2000, ApJ, 528, 171
- Zhang et al. (2018) Zhang, Z.-Y., Ivison, R. J., George, R. D., et al. 2018, MNRAS, 481, 59