The Case for Thermalization as a Contributor to the [CII] Deficit
Abstract
The [CII] deficit, which describes the observed decrease in the ratio of [CII] 158 m emission to continuum infrared emission in galaxies with high star formation surface densities, places a significant challenge to the interpretation of [CII] detections from across the observable universe. In an attempt to further decode the cause of the [CII] deficit, the [CII] and dust continuum emission from 18 Local Volume galaxies has been split based on conditions within the interstellar medium where it originated. This is completed using the Key Insights in Nearby Galaxies: a Far–Infrared Survey with Herschel (KINGFISH) and Beyond the Peak (BtP) surveys and the wide–range of wavelength information, from UV to far–infrared emission lines, available for a selection of star–forming regions within these samples. By comparing these subdivided [CII] emissions to isolated infrared emission and other properties, we find that the thermalization (collisional de-excitation) of the [CII] line in HII regions plays a significant role in the deficit observed in our sample.
keywords:
galaxies: ISM – ISM: HII Regions – ISM: Photodissociation Regions1 Introduction
The [CII] 158 m line is an increasingly alluring tool for understanding how galaxies evolve over time. As one of the major cooling channels for the interstellar medium (ISM, Wolfire et al., 2003), [CII] 158 m emission can represent up to a few percent of the total infrared output of a star–forming galaxy (Malhotra et al., 2001; Smith et al., 2017). The far–infrared wavelength of the [CII] line make it a frequent target of high–redshift surveys, as it falls within the observable bands of millimeter arrays across a wide range of redshifts () (e.g. Rybak et al., 2019; Ginolfi et al., 2020). Except in extreme cases, the long wavelength of the [CII] line also allows it to pass through gas and dust with little to no attenuation, which, along with [CII] line’s role as a major ISM coolant, frequently make it the brightest observed emission line in star–forming galaxies (Luhman et al., 2003).
In order to interpret the multitude of new high– [CII] detections from millimeter observatories like The Atacama Large Millimeter Array (ALMA) (e.g Schaerer et al., 2020), it is important that we have a thorough understanding of the production of the [CII] line in well–studied, Local Volume galaxies. Previous works have suggested that [CII] could trace star formation rate (SFR) (De Looze et al., 2011; De Looze et al., 2014; Herrera-Camus et al., 2015), shock–heated gas (Appleton et al., 2017), or diagnose properties of the atomic interstellar medium (Contursi et al., 2002; Herrera-Camus et al., 2017). Before these potential uses of the [CII] line can be applied to high–z [CII] measurements, the limitations of the [CII] line must be understood.
A complication discovered in this pursuit is the [CII] deficit. The [CII] deficit describes the decreasing trend in the ratio of [CII] 158 m luminosity to the total infrared luminosity (TIR) from 5–1100 m with increasing star–formation rates or hotter dust (Malhotra et al., 2001; Smith et al., 2007; Sargsyan et al., 2012; Sutter et al., 2019). This effect has been measured in a wide variety of galaxies, including Ultra–Luminous Infrared Galaxies (ULIRGs) (Díaz-Santos et al., 2017; Herrera-Camus et al., 2018) and high– galaxies (Capak et al., 2015; Decarli et al., 2018). The [CII] deficit is especially detrimental when using the [CII] line as a measure of star formation rate (SFR), since the TIR luminosity, which indicates absorbed UV/optical emission from young stars re-radiated by dust, is expected to be an accurate SFR tracer as well (De Looze et al., 2014; Herrera-Camus et al., 2015).
Multiple processes have been proposed to explain the cause of the [CII] deficit. These include: (1) [CII] self–absorption or [CII] becoming optically thick in high density environments (Abel et al., 2007; Neri et al., 2014), (2) changes in photoelectric heating efficiency caused by the charging of polycyclic aromatic hydrocarbons (PAHs) (Malhotra et al., 2001; Croxall et al., 2012), (3) the conversion of singly ionized carbon to doubly–ionized carbon in AGN–host galaxies (Langer & Pineda, 2015), (4) thermalization of the [CII] line in high–density HII regions (Díaz-Santos et al., 2017), (5) [OI] and other far–infrared fine structure lines overcoming [CII] as the dominant cooling sources (Brauher et al., 2008), (6) an increased ionization parameter in dense galaxies leading to a greater fraction of FUV radiation being absorbed by dust and therefore less availability of carbon–ionizing radiation (De Looze et al., 2014; Herrera-Camus et al., 2018), (7) increasing G0/n values within a single PDR are expected to decrease [CII]/TIR values through grain charging and [OI] becoming the dominant cooling line (Kaufman et al., 1999), or some combination of these effects. Determining the precise cause of the [CII] deficit will help establish the utility of measurements of this line in the high–redshift universe.
To study the behavior of the [CII] deficit, it is important to consider the different environments in which C+ can be found. As carbon has a relatively low ionization potential of 11.3 eV (110 nm), lower than the 13.6 eV necessary to ionize hydrogen, C+ is present in many ISM phases, complicating the determination of the cause of the deficit.
This paper builds on the results of Sutter et al. (2019), which measured the [CII] deficit in a sample of nearby, star–forming galaxies and found the deficit has a more significant effect in the ionized phases of the ISM (i.e. phases where hydrogen is ionized) than in neutral phases. This was found by measuring the clear differences in the trends observed in the [CII]/TIR values from the isolated ionized and neutral phases as a function of dust temperature (see Figure 5, Sutter et al. (2019)). In order to elucidate the cause of this difference, we present the results from a novel analysis of the [CII] deficit. Employing the wide range of available photometric observations and spectral emission line detections for this sample, we are able to separate many of the observed fluxes of these galaxies into the phases from which they arose. By isolating emission from separated phases of the ISM, we are able to isolate the effects of potential causes of the [CII] deficit. Preliminary results from this analysis suggest that the thermalization of the [CII] line in HII regions may play a significant role in the [CII] deficit across our sample.
Thermalization occurs when the critical density of a collisional interaction is surpassed. Below the critical density, line intensities increase with increasing density, line, as higher densities lead to a higher frequency of collisional excitations. Above the critical density, or the density at which collisional de-excitations and spontaneous radiative decays are equal, line intensities will linearly increase with increasing density (line) as local thermodynamic equilibrium conditions are approached. It is important to consider thermalization when studying the [CII] deficit as when SFR and thus TIR luminosity increase, the thermal pressure increases leading to an increased density (Ostriker et al., 2010; Herrera-Camus et al., 2017), while the [CII] line would increase comparatively more slowly. By comparing the density in isolated ISM phases to the [CII] / TIR ratio for these phases, this theoretical cause of the [CII] deficit can be observationally tested.
This paper is organized as follows. Section 2 describes the sample and observations used to complete this analysis. Section 3 explains the methods applied to determine different properties and measurements separated by ISM phase. Finally, Section 5 lays out the initial conclusions obtained in this work.
2 Data and Sample
This work uses the subset of the Key Insights in Nearby Galaxies: a Far Infrared Survey with Herschel, or KINGFISH, sample with [CII] 158 m, [NII] 122 m and 205 m, and [OI] 63 m line detections. The KINGFISH survey includes 61 Local Volume galaxies with imaging and spectroscopy across the infrared spectrum (Kennicutt et al., 2011). Of the 61 total galaxies, star–forming regions in 18 local galaxies ( Mpc) have the full suite of line observations required for this work. All line measurements were performed using the Photoconductor Array Camera and Spectrometer (PACS) on the Herschel Space Telescope (Poglitsch et al., 2010). 12 of these galaxies were also included in the Beyond the Peak (BtP) survey. This survey used the Spectral and Photometric Imaging Receiver (SPIRE Griffin et al., 2010) to obtain maps of the [NII] 205 m over a wider field of view than the KINGFISH observations, extending the coverage of these galaxies to the more quiescent areas surrounding the star–forming regions targeted at 205 m by the PACS instrument. The combination of the KINGFISH and BtP surveys cover a total of 120 individual regions in these 18 galaxies. All line maps were smoothed to the 145 point spread function (PSF) of the [NII] 205 m maps using a Gaussian profile. For the regions in this sample, the 145 radius translates to a physical length of 200–2100 pc. The regions in these two samples have SFR 0.082–3.92 yr-1, stellar masses of log10(M⊙) 8.97–10.84 and cover log10(O/H) 8.1-8.7, making them all normal, star-forming galaxies (Hunt et al., 2019; Kennicutt et al., 2011). Further information about the data processing and this sample can be found in Sutter et al. (2019).
In addition to the far–infrared line maps, the KINGFISH survey imaged each galaxy at 70, 100, and 160 m using the PACS instrument and at 250 m using the SPIRE instrument on board Herschel (the KINGFISH 350 m and 500 m data are not utilized in this work). All 18 galaxies in this study were also included in the Spitzer Infrared Nearby Galaxies Survey, or SINGS (Kennicutt et al., 2003). As part of this survey, each galaxy was imaged at 3.6, 4.5, 5.6, 8.0, and 24 m using the Infrared Array Camera (IRAC) and the Multi-band Imagine Photometer (MIPS) on the Spitzer Space Telescope (Rieke et al., 2004). These infrared bands primarily measure the warm dust and light from old stars in these galaxies. Additionally, data were obtained from the Sloan Digital Sky Survey (SDSS) for each galaxy in this sample. Foreground stars and background galaxies are removed from the SDSS maps. Further descriptions of the data processing can be found in Cook et al. (2014). To expand the range of photometric data, GALEX FUV (1350–1750 Å) and NUV (1750–2800 Å) images were also obtained. All galaxies were imaged with GALEX as part of either the Nearby Galaxy Survey (NGS) or the All-Sky Imaging Survey (AIS) (Gil de Paz et al., 2005). In order to perform consistent analysis across this wide–range of wavelengths, all imaging data were smoothed to the 250 m PSF of 18″ using a Gaussian profile.
3 Separation of Ionized and Neutral ISM
In order to perform this analysis, the ISM within each galaxy was split into two phases. The first phase is the ionized phase, characterized by environments where hydrogen is predominately ionized, and includes HII regions and the diffuse ionized ISM. The second phase is the neutral phase, where hydrogen is predominately neutral, and includes photodissociation regions (PDRs) as well as molecular clouds. This work proposes a novel method to examine the [CII] deficit by separating not only the [CII] emission but also the TIR luminosity and gas properties by ISM phase in unresolved star–forming regions. By isolating the two phases, the precise causes of the deficit can be tested with fewer complicating factors.
3.1 Isolating the Ionized vs. Neutral [CII] Emission
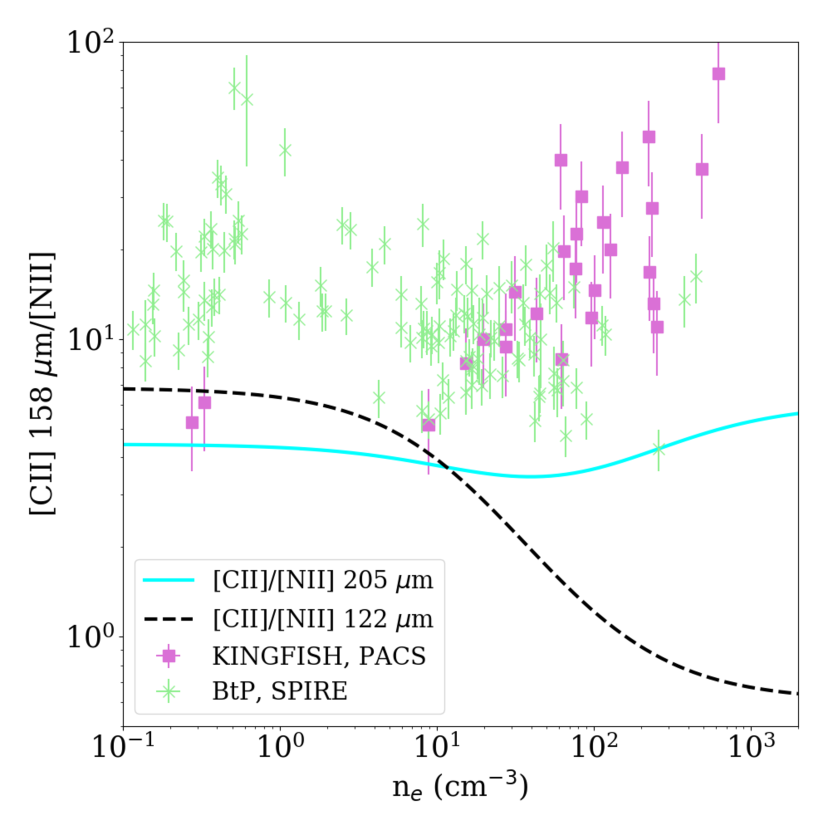
The [CII] emission was divided by ionized and neutral ISM phases using the theoretical relationship between the [CII] 158 m line and the [NII] 205 m line in ionized gas. Figure 1 shows the predicted ratio of the [CII] 158 m line to [NII] emission from the ionized ISM ([CII]/122 m as the black dashed line, [CII]/205 m as the solid cyan line) as function of electron number density (). While the solid cyan line stays at an approximately constant value of 4, the black dashed line varies by nearly an order of magnitude across typical ISM density conditions. The measured ratios of [CII] 158 m to the [NII] 205 m emission for the KINGFISH and BtP sample are shown as magenta squares and green crosses, respectively. As nitrogen has an ionization potential of 14.5 eV, well above the 13.6 eV necessary to ionize hydrogen, N+ should primarily exist in the ionized phases of the ISM, so the theoretical ratio of the [CII] / [NII] lines can therefore be used to predict the amount of [CII] emission from ionized phases of the ISM. The 205 m line is preferred here over the 122 m line as the critical densities for collisions with electrons for the 205 m line and the [CII] 158 m line are fairly similar ( cm-3 for the [NII] 205 m line and cm-3 for the [CII] 158 m line Oberst et al., 2006; Croxall et al., 2017). This consistency makes the predicted ratio of the 158 m and 205 m lines from ionized gas nearly independent of electron number density. In Figure 1, was determined based on the ratio of the [NII] 122 m and [NII] 205 m lines, as described in Section 3.3.
As all points lie either above or on the predicted ratio for these two emission lines in ionized gas, we know a large amount of the [CII] emission for our sample must be from the neutral phases of the ISM, where no ionized nitrogen is present. We calculate the fraction of the [CII] emission from the neutral ISM using the equation:
| (1) |
where is the model ratio of the [CII] 158 m to [NII] 205 m emission from the phases of the ISM where both C+ and N+ are present and was determined individually for each of the 120 regions using the measured (cf. Croxall et al., 2012). For this work, uses an assumption of a Galactic C/N ratio. It is possible that changes in the C/N ratio across our sample could have some effect on the measurements of , but as shown in Croxall et al. (2017), it is likely that these effects are small compared to variations across the regions in this sample. The method produces measurements of spanning a range from to with a median value of (see Figure 3, Sutter et al., 2019), similar to what has been found in other works (Croxall et al., 2012; Parkin et al., 2013; Hughes et al., 2015; Díaz-Santos et al., 2017).
3.2 Isolating the Ionized vs. Neutral L(TIR)
The TIR luminosity was determined using the results of Dale et al. (2014):
| (2) |
and represents the integrated luminosity from 5–1100 m. We then separate the TIR luminosity arising from the ionized versus neutral ISM phases using the results of the spectral energy distribution (SED) fitting of the 3.6–250 m thermal dust emission constraints. The SED fits were completed using the Code Investigating GALaxy Evolution, or CIGALE (Noll et al., 2009; Boquien et al., 2019) and the full range of photometric observations described in Section 2. All SED fits were determined using a Bruzual & Charlot (2003) stellar population, a modified starburst dust attenuation law, and a Draine et al. (2014) dust emission model. The outputs from the best–fit model along with the Draine et al. (2007) dust models were applied to estimate the fraction of the TIR luminosity from dust heated within the HII regions. These models include a method for predicting the fraction of dust luminosity heated by an interstellar radiation field (ISRF, modeled as ) above a set cutoff value, . By setting to the value of the ISRF expected at the Strömgren radius, or the radius of the HII region, we can predict the fraction of dust luminosity coming from the ionized HII region surrounding recent star formation. This fraction is determined using Equation 18 from Draine et al. (2007):
| (3) |
where is the fraction of the dust luminosity from dust heated by young stars and is a dimensionless scale factor that when multiplied by the specific energy density of Mathis et al. (1983) quantifies the specific energy density of starlight, i.e. the ISRF. is then the maximum value of this scale factor, which is set to for each region (as in Draine et al., 2007), is the minimum value of this scale factor, which is determined by the CIGALE SED fitting, and is the cutoff value for this scale–factor, which is calculated for each region individually using the definition of the Strömgren radius:
| (4) |
to determine the expected UV flux within each HII region. We use an 3.0 cm3 s-1 and estimate by integrating the unattenuated UV flux (i.e. the flux between 91.2–206.6 nm) predicted by the modelled SED. This allows us to estimate ISRF at the Strömgren radius, , in Habing units ( erg s-1 cm-2) by dividing the unattenuated UV flux by the surface area of a sphere with the radius determined by Equation 4. This gives us a range of from 2.0–1.7 with a mean value of 7.93. Using this in Equation 3, we can determine the fraction of the TIR luminosity from within the HII region, or .
For the regions included in this sample, ranges from 0.1%–19% with a median value of 2.6%. The TIR luminosity from the ionized ISM (TIRIonized) is (TIR) while the neutral TIR luminosity (TIRNeutral) is the difference between the measured TIR luminosity and TIRIonized.
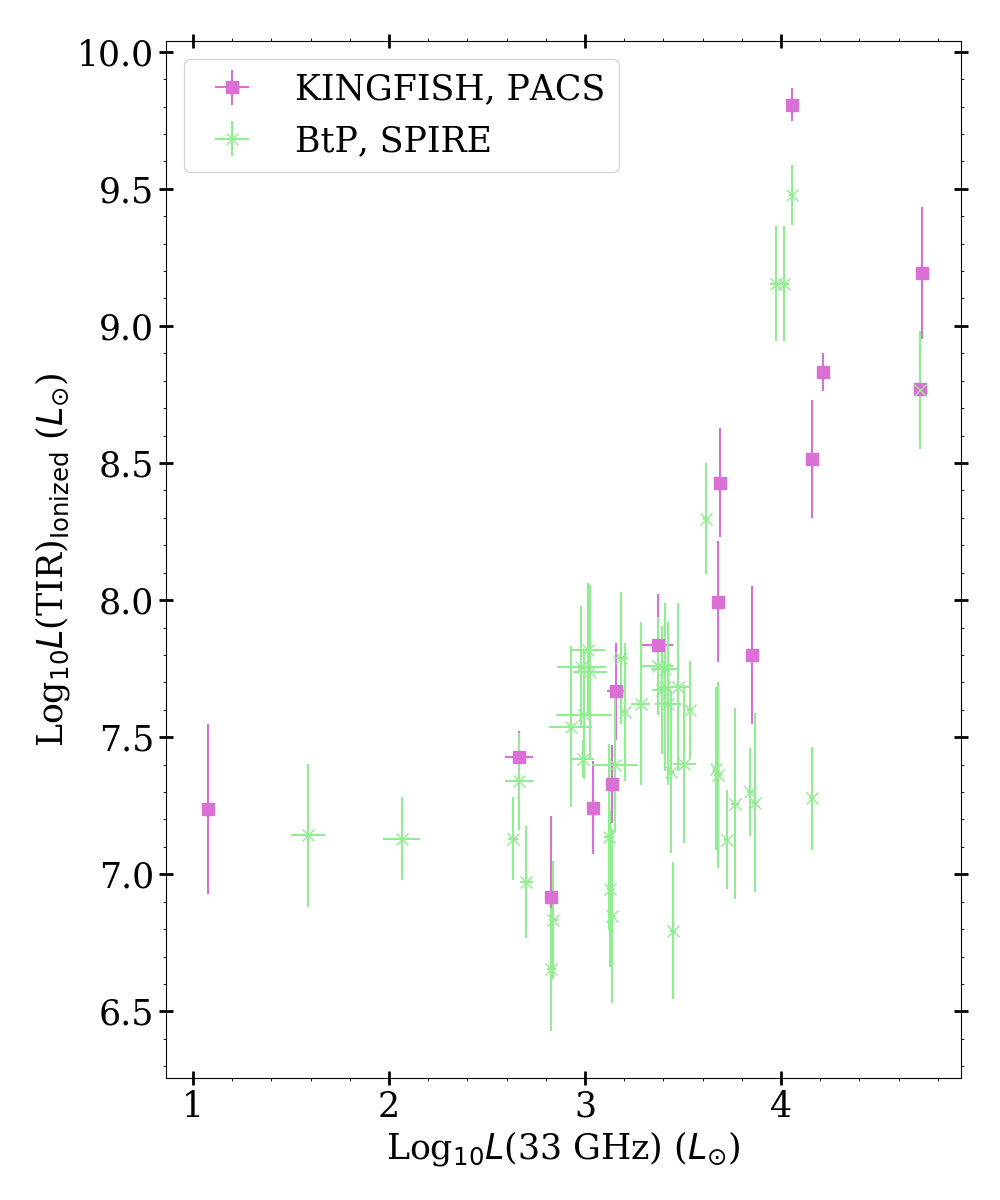
In order to test the viability of this method for isolating the TIR luminosity, measurements of TIRIonized for the subset of regions included in Murphy et al. (2018) are plotted against (33 GHz) in Figure 2. The 33 GHz luminosities were corrected to include only the thermal component using the results of Linden et al. (2020). As the thermal component of the 33 GHz luminosity traces free–free emission associated with HII regions (Condon & Yin, 1990; Murphy et al., 2011), it should be well correlated with the TIR emission from HII regions. As shown in Figure 2, there is a clear trend between these two properties, with scatter coming mainly from the BtP regions tracing the more quiescent areas surrounding HII regions. This suggests that our method for determining TIRIonized works well for star–forming regions, but there may be added uncertainty for the diffuse ISM.
3.3 Density measurements for the ionized and neutral ISM
The densities of the neutral and ionized ISM phases were determined separately for each region in this sample. First, to determine the electron number density within the ionized phases, the ratio of the [NII] 122 m and 205 m lines was used (Herrera-Camus et al., 2016). As nitrogen has an ionization potential above that of hydrogen, both [NII] lines should originate in the ionized phases of the ISM. This ratio has been found to be sensitive to spanning 10–1000 cm-3.
The density of the neutral phases were determined using PDR models. We approximate [CII]Neutral emission as originating predominantly from PDRs, where we define PDRs as regions where FUV light dominates the heating and photochemistry within the ISM. Working with this approximation, the PDR models of Kaufman et al. (2006); Pound & Wolfire (2008) are ideal tools to estimate the properties of the neutral ISM in the regions included in this sample. These models determine the density and FUV radiation intensity () by comparing the [CII] 158 m and [OI] 63 m line strengths, two of the predominant cooling channels in PDRs, as well as the sum of these two lines, to the total infrared emission, a measurement of the heating in PDRs. The models of hydrogen nucleus density () and are over–plotted on measurements of the [CII] 158 m / [OI] 63 m vs the ([CII]Neutral+[OI])/TIRNeutral in Figure 3. The [CII] emission and the TIR luminosity from only the neutral phases were included for this analysis. This method is limited by the effects of self–absorption and attenuation of the shorter wavelength [OI] 63 m line, adding some inherit uncertainty to the measurements of obtained for the neutral ISM.
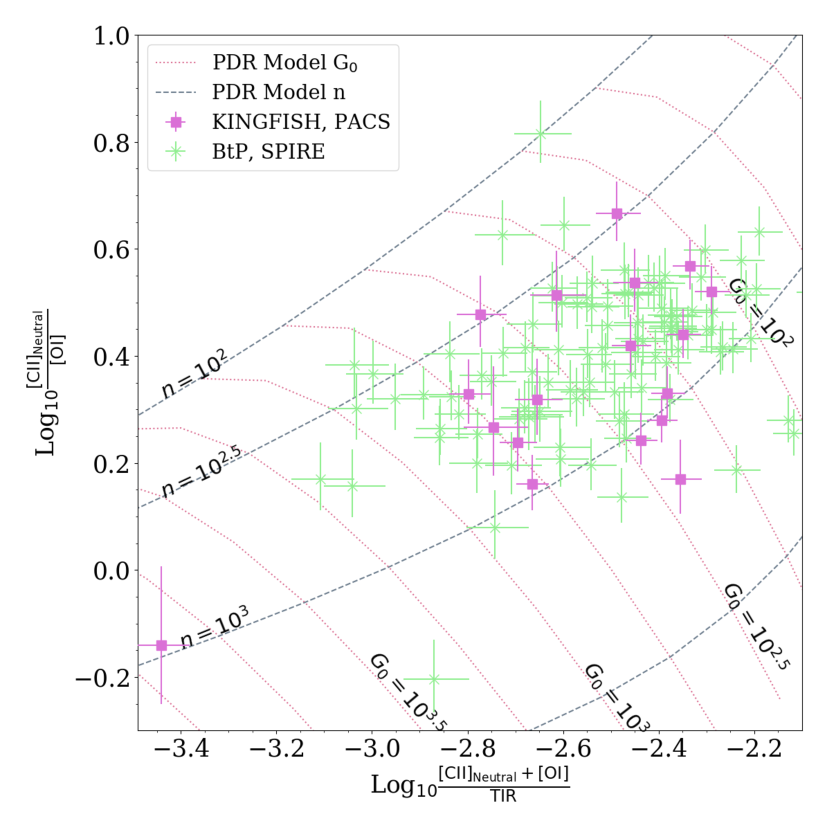
Using these PDR models, we find the regions in our sample cover a range of from 40–104, with a median value of and a range of from 20–103.5 cm-3 with a median value of . These results are what is expected for typical PDRs, and agree well with the work done in Malhotra et al. (2001); Croxall et al. (2012).
4 Thermalization and the [CII] Deficit
4.1 Observations of the [CII] Deficit
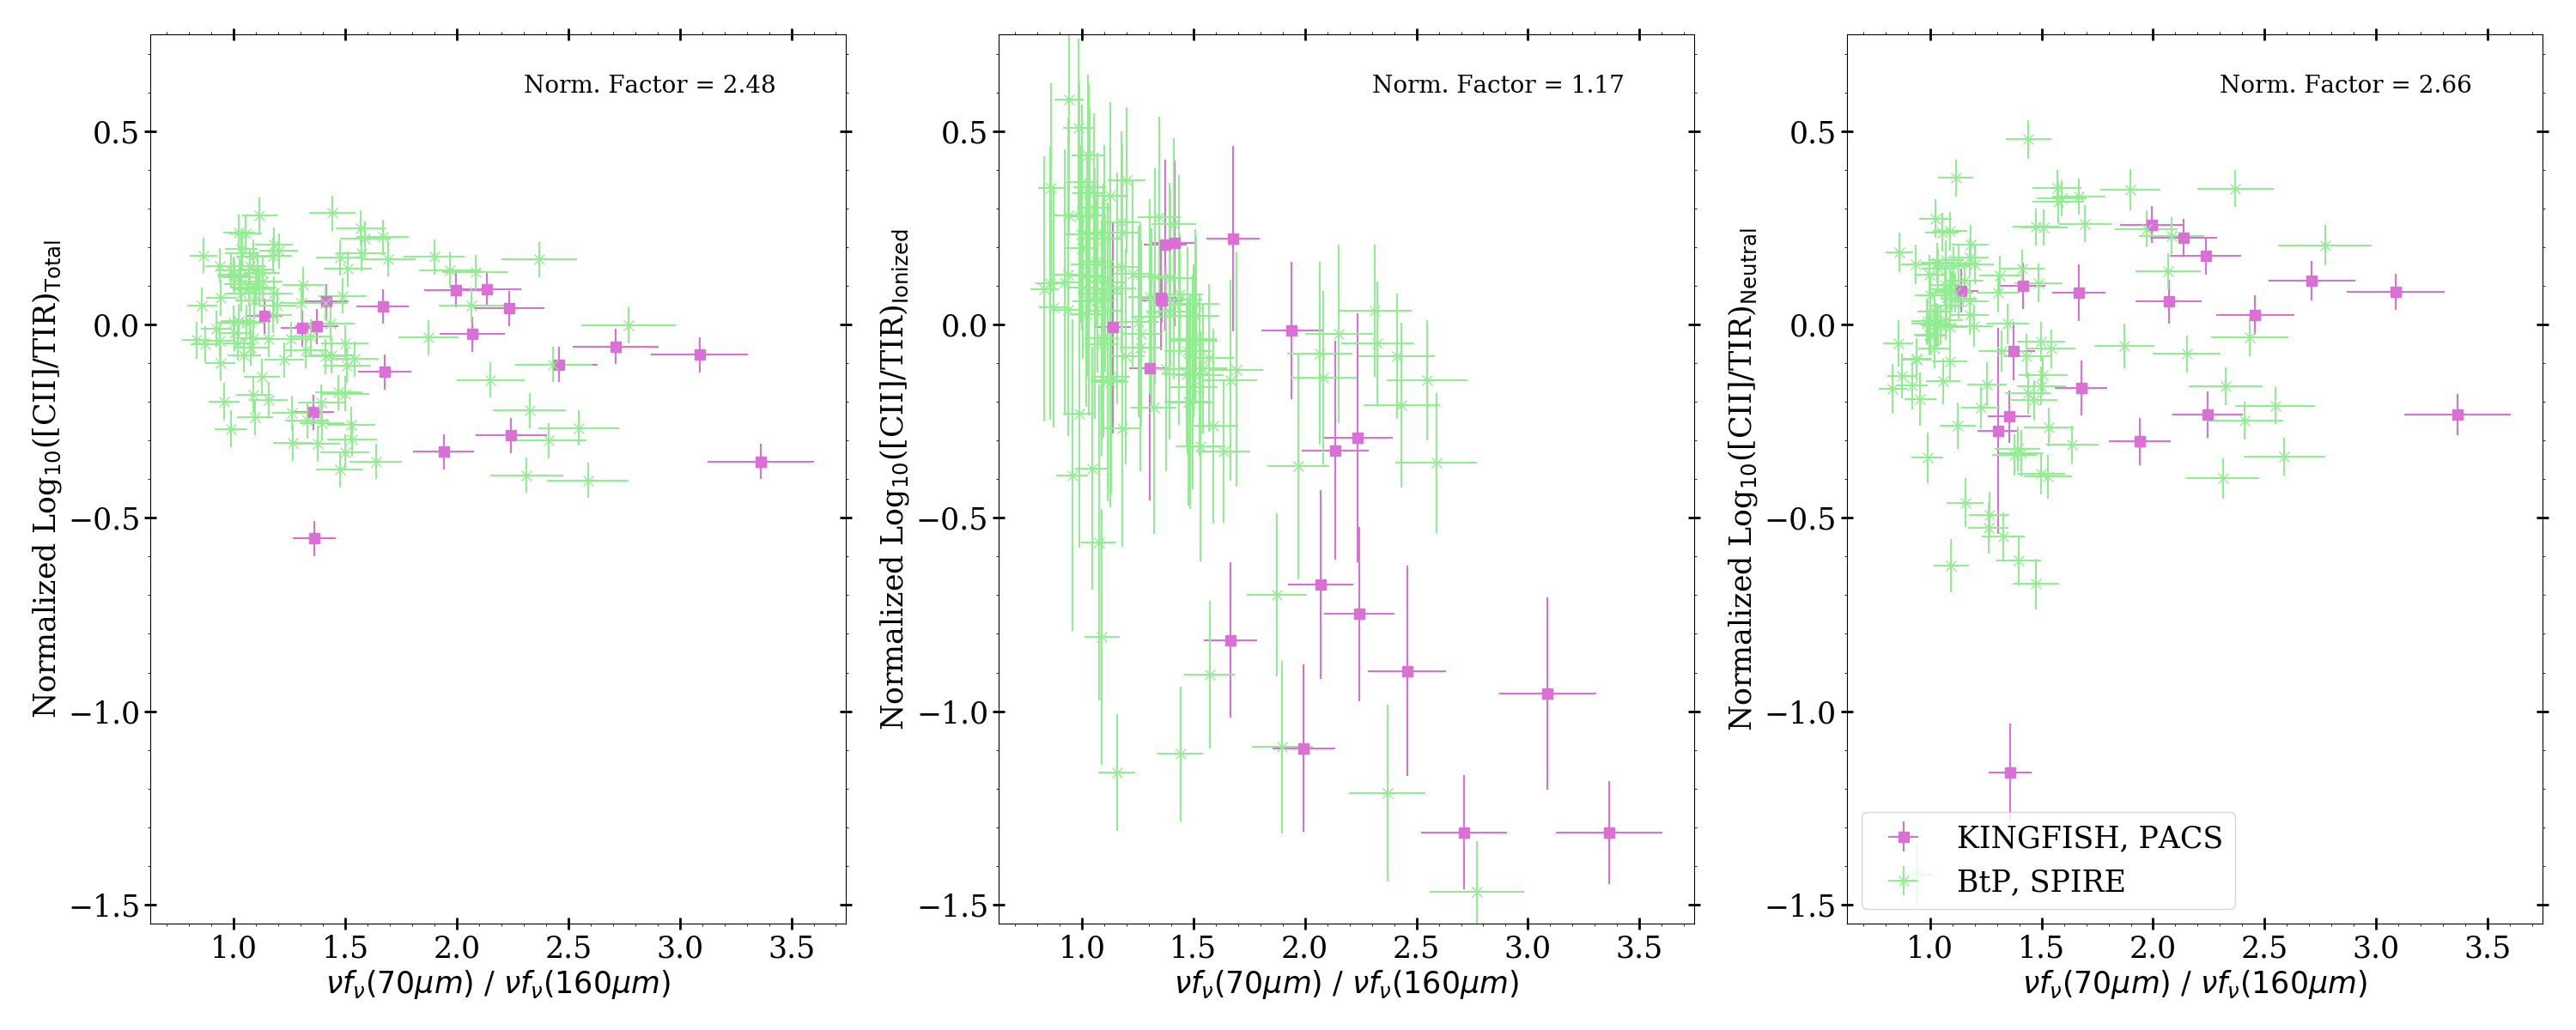
In order to characterize the [CII] deficit behavior observed in this sample, the [CII]/TIR measurements are plotted against the values in Figure 4. The flux ratio is an indicator of dust temperature, and therefore star formation activity, and is frequently used to show the effects of the [CII] deficit (e.g. Croxall et al., 2012; Díaz-Santos et al., 2013; Malhotra et al., 1997). The left panel of this Figure shows the [CII]/TIR ratio before any divisions by ISM phase are performed to either the [CII] or TIR luminosities. There is a slight decreasing trend with , indicating the regions in this sample experience moderate [CII] deficit behavior. The middle panel of Figure 4 displays the normalized isolated ionized phase [CII]/TIR measurements and the right panel shows the normalized isolated neutral phase [CII]/TIR measurements. All data has been normalized by dividing each point by the average value of [CII]/TIR for that phase. There is a clear decreasing trend between and ([CII]/TIR)Ionized. This observed decreasing trend in the ionized phases of the ISM, along with the lack of a trend measured in the neutral phases (as shown in the right panel of Figure 4) suggest that the cause of the slight decreasing trend for the star–forming regions included in this study is occurring in the ionized phases of the ISM. For this reason, we focus our search for causes of the [CII] deficit on trends we measure in the isolated ionized ISM phase [CII] and TIR luminosities.
4.2 Indications of Thermalization
One finding from this novel approach of tracking the [CII] deficit across the isolated ISM phases is the strong dependence of the observed deficit in the ionized phases of the ISM on the electron density relative to the critical density for the [CII] line. This is shown in Figure 5, where the [CII] / TIR ratios for the isolated ionized and neutral ISM components are plotted against the electron number density for the ionized ISM, where free electrons are the primary source of collisional excitation of the [CII] line, and the hydrogen nucleus number density for the neutral ISM. Hydrogen atoms are the primary source of collisional excitation of the [CII] line at low column densities and molecular hydrogen dominates at the higher column densities (e.g. Herrera-Camus et al., 2015). The vertical dashed and dotted lines represent the critical electron and hydrogen atom number densities of [CII], respectively (Goldsmith et al., 2012). These critical densities are determined assuming a temperature of 8000 K for the ionized phase and 100 K for the neutral phase. The critical density for collisions with molecular hydrogen is a factor 1.4 higher than for collisions with hydrogen atoms (Wiesenfeld & Goldsmith, 2014). We see that in the ionized phases of the ISM, the [CII] / TIR ratio plummets when the electron number density reaches the critical density. This suggests that the thermalization of the [CII] line is a factor in the observed [CII] deficit in the ionized phases of the ISM. In regions with densities above the critical density, increased heating of the dust and gas from young stars will increase the TIR luminosity, without increasing the [CII] emission strength.
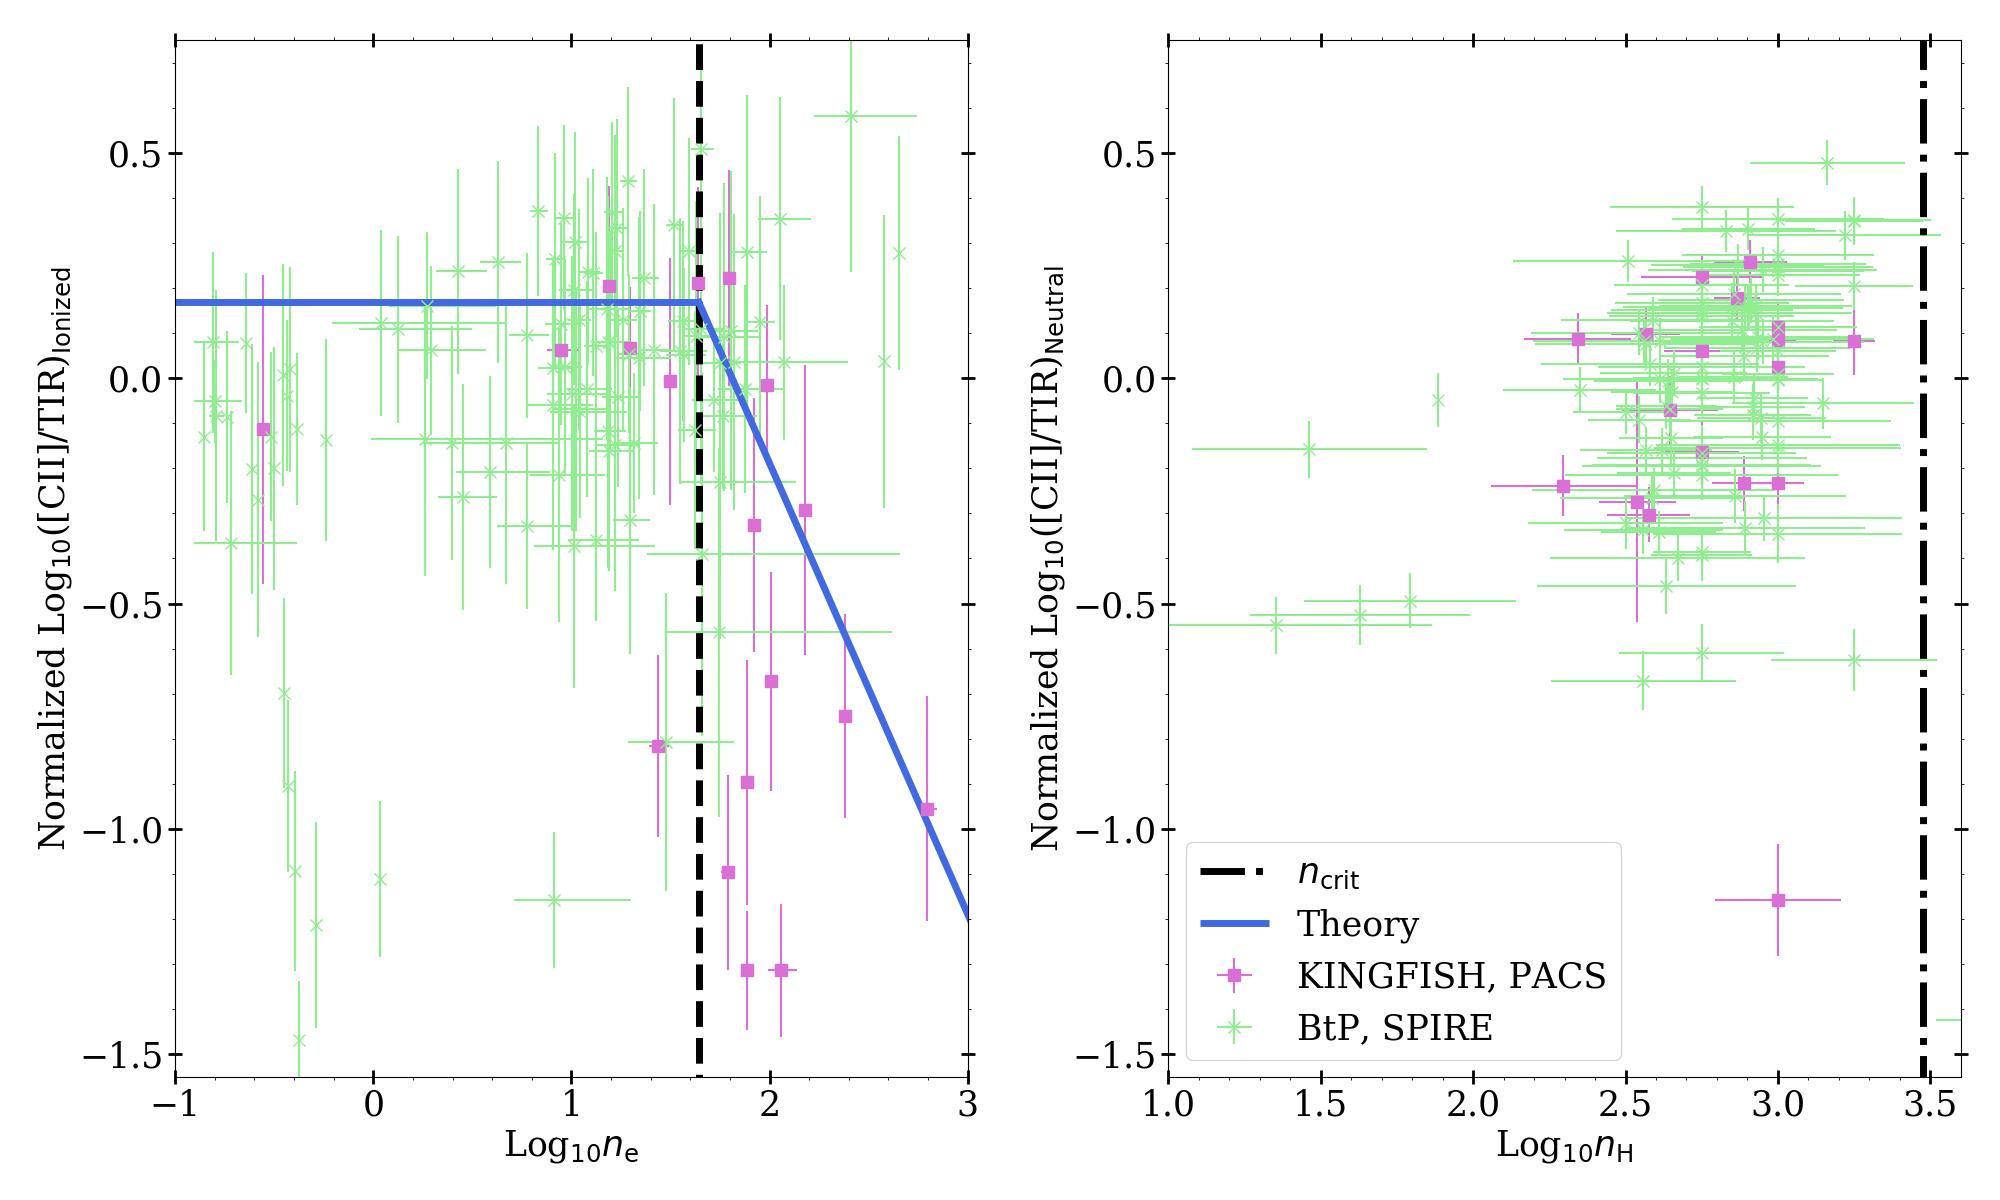
In the left panel of Figure 5, the sharp decrease along is primarily observed in the KINGFISH regions, represented by the pink squares. This is likely a reflection of the selection of bright infrared regions for the KINGFISH observations. Alternatively, the wider field of view maps obtained by the BtP survey cover the more quiescent areas within the ISM, where thermalization of the [CII] is not occurring. Although the KINGFISH regions cover areas of more intense star formation, none of the regions included in this sample probes the most extreme conditions where the largest deficits have been observed, as the BtP and KINGFISH sample cover a modest range of TIR of .
Despite an overall clear match between the theoretical values and observed data, there are a small subset of BtP regions below that have lower than predicted [CII]/TIR (see green crosses in the lower right on the left panel of Figure 5) as well as two BtP regions above that are higher than expected (see green crosses in the upper right on the left panel of Figure 5). As all the BtP regions that fall far below the theoretical predictions have larger than average values, errors in how is determined are likely driving this discrepancy for some of these more quiescent BtP regions. On the other hand, the points above the critical density and theoretical predictions have higher fractions of [CII] emission from the ionized phases, which drives the ([CII]/TIR)Ionized values higher. This could again be caused by a difference in the observed region and the assumptions made by modelling each region as an ionized HII region surrounded by a neutral PDR.
It is important to note that for these samples, the declining [CII] / TIR values as a function of density only occurs in the ionized ISM. However, it is possible that the measurements of ([CII]/TIR)Neutral could also be effected by thermalization, but our simplistic models of the neutral medium having a temperature of 100 K and therefore a critical density of 3000 cm-3 could be obscuring any effect thermalization has on the ([CII]/TIR)Neutral measurements.
4.3 Theoretical Predictions of Thermalization
The observations discussed in Section 4.2 suggest that thermalization of the [CII] 158 m line is playing a role in the [CII] deficit observed in the ionized ISM. This conclusion is supported by a theoretically derived model of the expected TIR and [CII] luminosities, as elucidated in the following discussion. Below the critical density, the [CII] 158 m luminosity from HII regions should be equal to the number of collisional excitations of C+ multiplied by the energy produced by each transition:
| (5) |
where is the rate coefficient for collisional excitations, is the radius of the HII region, is the energy of a single transition, and and are the electron and singly–ionized carbon densities, respectively. Above the critical density, the [CII] luminosity will no longer depend on , and can therefore be modelled as:
| (6) |
Regardless of density, the TIR luminosity from HII regions can be modelled as:
| (7) |
where is the number of Lyman continuum photons, is the average energy of the Lyman continuum photons, and is the fraction of energy from the Lyman continuum photons that is converted to dust heating. Using Strömgren conditions, is:
| (8) |
where is the recombination rate coefficient, and is approximately equal to cm3s-1. Using these predictions for the [CII] and TIR luminosity for the ionized phase of the ISM, we can estimate the [CII]/TIR ratio as a function of . Below the critical density, [CII]/TIR simplifies to:
| (9) |
If we assume based on the Galactic carbon abundances (1.6 carbon atoms per hydrogen atom, Sofia et al., 2004), we can further simplify Equation 9 to:
| (10) |
Using cm3s-1, (Tielens, 2005), of 15eV, and as suggested by Inoue (2001), we find:
| (11) |
for the ionized phases of the ISM, when . This value is displayed as a blue, horizontal line on the left panel of Figure 5, and is fairly consistent with the observed values. As is a lower limit for the fraction of UV light reprocessed by dust, it is likely that the slight difference in the theory line and measured values is due to differences in this fraction across our sample (Inoue, 2001).
Above the critical density, we expect the [CII] luminosity should no longer be proportional to . The predicted above is then:
| (12) |
The theoretical predictions described in this section are displayed as a solid blue line on the left-hand panel of Figure 5. It is likely that the theoretical predictions lie below the observed values due to the possibility that some of the [CII] emission from ionized phases originates in the diffuse ionized ISM, while these predictions only account for the [CII] emission from HII regions. Emission from the diffuse ionized ISM is also expected to play a greater role in the BtP data points, which cover the areas surrounding the star–forming regions included in the KINGFISH study. The discrepancy between the theoretical curve and the observed measurements could also be driven by underestimates in our prediction for . As Inoue (2001) focuses on star–forming regions in local galaxies and states as an upper limit, it is likely that differences in or other conditions in the star–forming regions targeted in this study could lead to variations in the amount of UV light absorbed by dust, increasing the value of .
5 Discussion and Conclusion
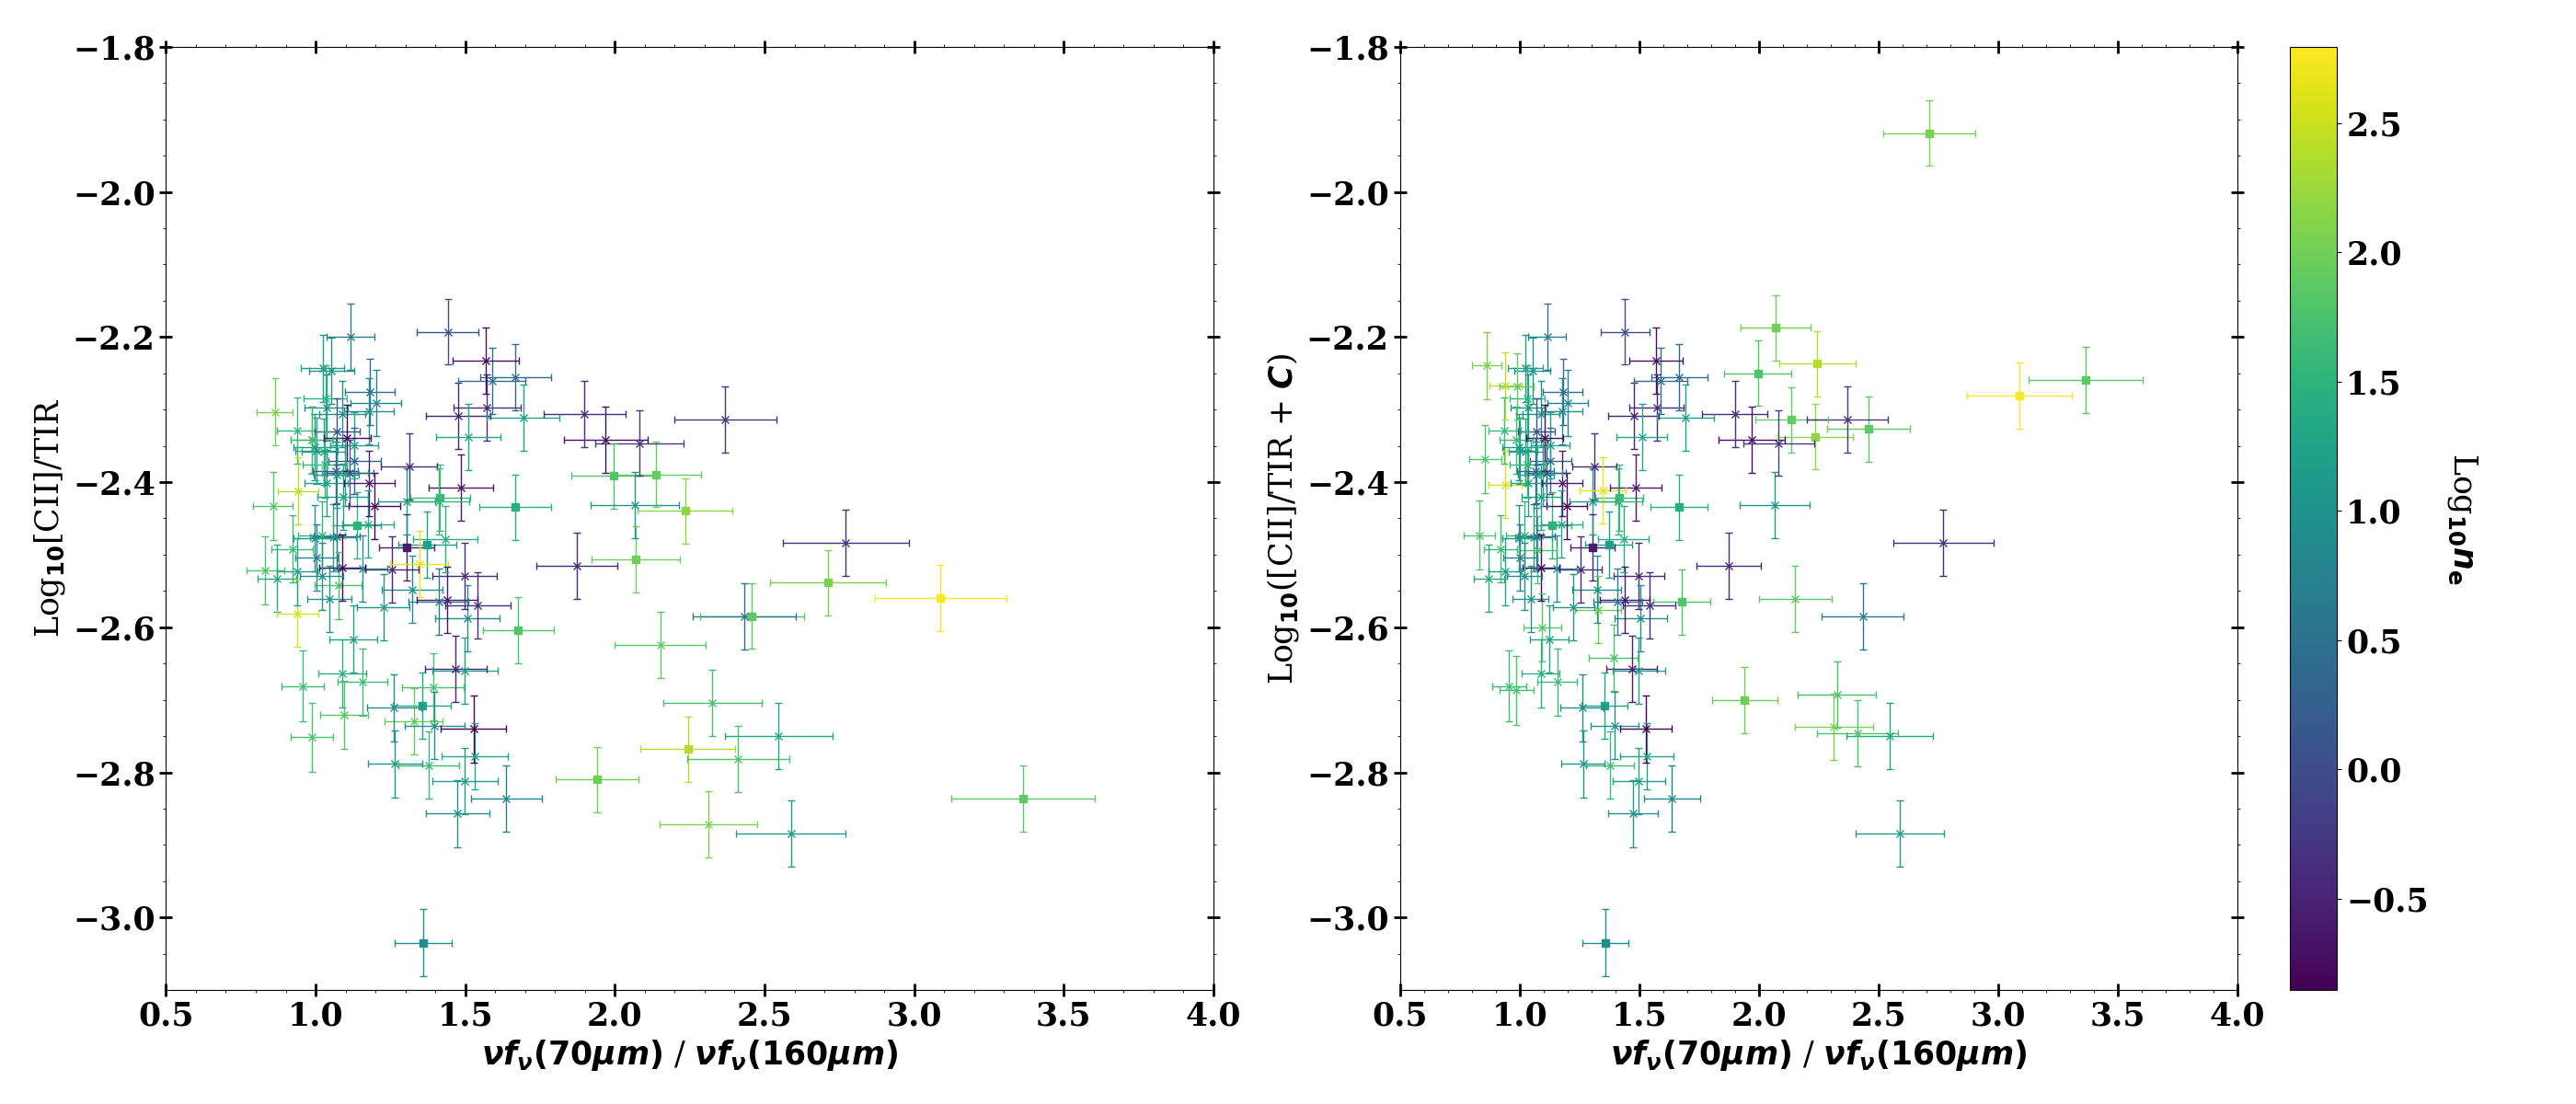
As previous studies have found that typically of [CII] emission originates in PDRs and other neutral phases of the ISM (Croxall et al., 2017; Rigopoulou et al., 2013), thermalization of [CII] in the ionized ISM can only account for moderate overall deficit behavior. For the normal star–forming galaxies in this work, the undivided [CII]/TIR measurements showed only moderate deficit behavior. Therefore, the [CII] deficit observed in this sample can be explained by thermalization of the [CII] line within the ionized phases of the ISM, despite the majority of [CII] emission originating in the neutral ISM (See Figure 4 or Sutter et al., 2019, for further discussion). Furthermore, by correcting for the effects of thermalization in the ionized phases of the ISM, the deficit effect can be greatly reduced. This is shown by the differences in the left and right panels of Figure 6. The left panel shows the unmodified [CII] / TIR measurements for the regions in this sample color coded by Log. The total [CII] / TIR measurements show a slight decline as a function of , a proxy for dust temperature. This decrease is removed in the right panel of Figure 6, where the [CII]/TIR measurements have been corrected for the effects of thermalization in the ionized ISM. This correction is made using the theoretical predictions described in Section 4.3. For regions above the critical density, the [CII]/TIR values are corrected by adding the correction factor:
| (13) |
Here, represents the difference between the theoretical expectation of non–thermalized [CII]/TIR (0.13) and thermalized [CII]/TIR () from the ionized phases of the ISM. The left-hand panel of Figure 6 plots Log10([CII]/TIR + C) against the measurements. This correction for the effects of thermalization removes the observed decrease seen in the undivided [CII]/TIR data, but still shows a large scatter, indicating that there are likely other physical processes effecting the [CII]/TIR ratio in these galaxies.
Thermalization may also be the cause for deficits observed in other ionized gas tracers, like [NII] and [OIII] lines (Herrera-Camus et al., 2016; Graciá-Carpio et al., 2011), and therefore should be accounted for in studies of ionized gas in galaxies. As the deficit is most prominent in the ionized gas, it is also possible that some of this behavior is due to increasing levels of doubly–ionized carbon. With our current data set, it is difficult to disentangle how thermalization of [CII] and a larger fraction of C++ both contribute to the observed deficit in the ionized ISM.
It should be noted that despite the evidence presented here, thermalization in the ionized phases of the ISM cannot be the only contributor to the [CII] deficit. This is especially true when considering the high–z galaxies with especially pronounced deficit behavior. For example, the z 2–6 galaxies observed in Rawle et al. (2014); Capak et al. (2015); De Breuck et al. (2014); Gallerani et al. (2012); Malhotra et al. (2017) show [CII]/TIR ratios 10 to 100 times lower than those observed in the local star–forming galaxies included in this work. As the majority of [CII] emission has been found to arise from the neutral phases of the ISM (Croxall et al., 2017; Pineda et al., 2013; Abdullah et al., 2017; Sutter et al., 2019; Cormier et al., 2019; Bigiel et al., 2020), the effects of thermalization solely within the ionized phases of the ISM can only contribute to moderate deficit behavior. This suggests that although thermalization of the [CII] line within the ionized phases of the ISM may play an important role in the [CII] deficit, especially over the kpc–scale star–forming regions included in this work, it cannot be the only factor consider to drive this behavior across a wide spectrum of spatial resolutions and galaxy conditions.
Although thermalization of [CII] in HII regions cannot completely explain the large deficits observed in some starbursting galaxies (Smith et al., 2017) or the [CII] 158 m emission behavior in low metallicity dwarfs where little [CII] emission originates in ionized phases (Cormier et al., 2015), the sharp decrease in ([CII] / TIR)Ionized along is an intriguing result that will help us decode the behavior of the [CII] deficit across the range of galaxies in which it has been observed. Further studies of these isolated ISM phases will help define what other process could affect the strength of the [CII] line, and will have important implications for the use of this line as a tracer of conditions in the high–redshift universe.
Acknowledgements
This work was supported by NASA Headquarters under the NASA Earth and Space Science Fellowship Program, Grant #80NSSC18K1107, as the Wyoming NASA Space Grant Consortium, NASA Grant #NNX15AI08H. Herschel is an ESA space observatory with science instruments provided by European-led Principal Investigator consortia and with important participation from NASA. IRAF, the Image Reduction and Analysis Facility, has been developed by the National Optical Astronomy Observatories and the Space Telescope Science Institute.
Data Availability
All data are available through IRSA with the exception of the SPIRE spectroscopy which is available upon request.
References
- Abdullah et al. (2017) Abdullah A., et al., 2017, ApJ, 842, 4
- Abel et al. (2007) Abel N. P., Sarma A. P., Troland T. H., Ferland G. J., 2007, ApJ, 662, 1024
- Appleton et al. (2017) Appleton P. N., et al., 2017, ApJ, 836, 76
- Bigiel et al. (2020) Bigiel F., et al., 2020, ApJ, 903, 30
- Boquien et al. (2019) Boquien M., Burgarella D., Roehlly Y., Buat V., Ciesla L., Corre D., Inoue A. K., Salas H., 2019, A&A, 622, A103
- Brauher et al. (2008) Brauher J. R., Dale D. A., Helou G., 2008, ApJS, 178, 280
- Bruzual & Charlot (2003) Bruzual G., Charlot S., 2003, MNRAS, 344, 1000
- Capak et al. (2015) Capak P. L., et al., 2015, Nature, 522, 455
- Condon & Yin (1990) Condon J. J., Yin Q. F., 1990, ApJ, 357, 97
- Contursi et al. (2002) Contursi A., et al., 2002, AJ, 124, 751
- Cook et al. (2014) Cook D. O., et al., 2014, MNRAS, 445, 881
- Cormier et al. (2015) Cormier D., et al., 2015, A&A, 578, A53
- Cormier et al. (2019) Cormier D., et al., 2019, A&A, 626, A23
- Croxall et al. (2012) Croxall K. V., et al., 2012, ApJ, 747, 81
- Croxall et al. (2017) Croxall K. V., et al., 2017, ApJ, 845, 96
- Dale et al. (2014) Dale D. A., Helou G., Magdis G. E., Armus L., Díaz-Santos T., Shi Y., 2014, ApJ, 784, 83
- De Breuck et al. (2014) De Breuck C., et al., 2014, A&A, 565, A59
- De Looze et al. (2011) De Looze I., Baes M., Bendo G. J., Cortese L., Fritz J., 2011, MNRAS, 416, 2712
- De Looze et al. (2014) De Looze I., et al., 2014, A&A, 568, A62
- Decarli et al. (2018) Decarli R., et al., 2018, ApJ, 854, 97
- Díaz-Santos et al. (2013) Díaz-Santos T., et al., 2013, ApJ, 774, 68
- Díaz-Santos et al. (2017) Díaz-Santos T., et al., 2017, ApJ, 846, 32
- Draine et al. (2007) Draine B. T., et al., 2007, ApJ, 663, 866
- Draine et al. (2014) Draine B. T., et al., 2014, ApJ, 780, 172
- Gallerani et al. (2012) Gallerani S., et al., 2012, A&A, 543, A114
- Gil de Paz et al. (2005) Gil de Paz A., et al., 2005, ApJ, 619, L115
- Ginolfi et al. (2020) Ginolfi M., et al., 2020, A&A, 633, A90
- Goldsmith et al. (2012) Goldsmith P. F., Langer W. D., Pineda J. L., Velusamy T., 2012, ApJS, 203, 13
- Graciá-Carpio et al. (2011) Graciá-Carpio J., et al., 2011, ApJ, 728, L7
- Griffin et al. (2010) Griffin M. J., et al., 2010, A&A, 518, L3
- Herrera-Camus et al. (2015) Herrera-Camus R., et al., 2015, ApJ, 800, 1
- Herrera-Camus et al. (2016) Herrera-Camus R., et al., 2016, ApJ, 826, 175
- Herrera-Camus et al. (2017) Herrera-Camus R., et al., 2017, ApJ, 835, 201
- Herrera-Camus et al. (2018) Herrera-Camus R., et al., 2018, ApJ, 861, 94
- Hughes et al. (2015) Hughes T. M., et al., 2015, A&A, 575, A17
- Hunt et al. (2019) Hunt L. K., et al., 2019, A&A, 621, A51
- Inoue (2001) Inoue A. K., 2001, AJ, 122, 1788
- Kaufman et al. (1999) Kaufman M. J., Wolfire M. G., Hollenbach D. J., Luhman M. L., 1999, ApJ, 527, 795
- Kaufman et al. (2006) Kaufman M. J., Wolfire M. G., Hollenbach D. J., 2006, ApJ, 644, 283
- Kennicutt et al. (2003) Kennicutt Robert C. J., et al., 2003, Publications of the Astronomical Society of the Pacific, 115, 928
- Kennicutt et al. (2011) Kennicutt R. C., et al., 2011, PASP, 123, 1347
- Langer & Pineda (2015) Langer W. D., Pineda J. L., 2015, A&A, 580, A5
- Linden et al. (2020) Linden S. T., Murphy E. J., Dong D., Momjian E., Kennicutt R. C. J., Meier D. S., Schinnerer E., Turner J. L., 2020, ApJS, 248, 25
- Luhman et al. (2003) Luhman M. L., Satyapal S., Fischer J., Wolfire M. G., Sturm E., Dudley C. C., Lutz D., Genzel R., 2003, ApJ, 594, 758
- Malhotra et al. (1997) Malhotra S., et al., 1997, ApJ, 491, L27
- Malhotra et al. (2001) Malhotra S., et al., 2001, ApJ, 561, 766
- Malhotra et al. (2017) Malhotra S., et al., 2017, ApJ, 835, 110
- Mathis et al. (1983) Mathis J. S., Mezger P. G., Panagia N., 1983, A&A, 500, 259
- Murphy et al. (2011) Murphy E. J., et al., 2011, ApJ, 737, 67
- Murphy et al. (2018) Murphy E. J., Dong D., Momjian E., Linden S., Kennicutt R. C. J., Meier D. S., Schinnerer E., Turner J. L., 2018, ApJS, 234, 24
- Neri et al. (2014) Neri R., Downes D., Cox P., Walter F., 2014, A&A, 562, A35
- Noll et al. (2009) Noll S., Burgarella D., Giovannoli E., Buat V., Marcillac D., Muñoz-Mateos J. C., 2009, A&A, 507, 1793
- Oberst et al. (2006) Oberst T. E., et al., 2006, ApJ, 652, L125
- Ostriker et al. (2010) Ostriker E. C., McKee C. F., Leroy A. K., 2010, ApJ, 721, 975
- Parkin et al. (2013) Parkin T. J., et al., 2013, ApJ, 776, 65
- Pineda et al. (2013) Pineda J. L., Langer W. D., Velusamy T., Goldsmith P. F., 2013, A&A, 554, A103
- Poglitsch et al. (2010) Poglitsch A., et al., 2010, A&A, 518, L2
- Pound & Wolfire (2008) Pound M. W., Wolfire M. G., 2008, The Photo Dissociation Region Toolbox. p. 654
- Rawle et al. (2014) Rawle T. D., et al., 2014, ApJ, 783, 59
- Rieke et al. (2004) Rieke G. H., et al., 2004, in Optical, Infrared, and Millimeter Space Telescopes. pp 50–61, doi:10.1117/12.551965
- Rigopoulou et al. (2013) Rigopoulou D., et al., 2013, MNRAS, 434, 2051
- Rybak et al. (2019) Rybak M., et al., 2019, ApJ, 876, 112
- Sargsyan et al. (2012) Sargsyan L., et al., 2012, ApJ, 755, 171
- Schaerer et al. (2020) Schaerer D., et al., 2020, arXiv e-prints, p. arXiv:2002.00979
- Smith et al. (2007) Smith J. D. T., et al., 2007, ApJ, 656, 770
- Smith et al. (2017) Smith J. D. T., et al., 2017, ApJ, 834, 5
- Sofia et al. (2004) Sofia U. J., Lauroesch J. T., Meyer D. M., Cartledge S. I. B., 2004, ApJ, 605, 272
- Sutter et al. (2019) Sutter J., et al., 2019, ApJ, 886, 60
- Tielens (2005) Tielens A. G. G. M., 2005, The Physics and Chemistry of the Interstellar Medium
- Wiesenfeld & Goldsmith (2014) Wiesenfeld L., Goldsmith P. F., 2014, ApJ, 780, 183
- Wolfire et al. (2003) Wolfire M. G., McKee C. F., Hollenbach D., Tielens A. G. G. M., 2003, ApJ, 587, 278