AppAppendix References
DESED-FL and URBAN-FL: Federated Learning Datasets for Sound Event Detection
Abstract
Research on sound event detection (SED) in environmental settings has seen increased attention in recent years. The large amounts of (private) domestic or urban audio data needed raise significant logistical and privacy concerns. The inherently distributed nature of these tasks, make federated learning (FL) a promising approach to take advantage of large-scale data while mitigating privacy issues. While FL has also seen increased attention recently, to the best of our knowledge there is no research towards FL for SED. To address this gap and foster further research in this field, we create and publish novel FL datasets for SED in domestic and urban environments. Furthermore, we conduct baseline results on the datasets in a FL context for three deep neural network architectures. The results indicate that FL is a promising approach for SED, but faces challenges with divergent data distributions inherent to distributed client edge devices.
Index Terms:
federated learning, sound event detection, deep learning, distributed learningI Introduction
The aim of SED is to automatically identify the occurrence of target sound events, such as glass breaking or dog barking, within an audio signal capturing an acoustic scene. Identifying these sound events within complex scenes is a challenging and open research problem that has attracted much attention in recent years, observed with the increase in the literature and particularly with the growing research interest in the DCASE Community111http://dcase.community. Two common SED uses-cases are acoustic monitoring in domestic [1] and urban [2] environments. In both scenarios, the use of audio to train detection models in a centralized training context raises considerable privacy concerns. In these environments, there are speech and other sounds that are confidential which should not be shared or stored insecurely.
State-of-the-art approaches to SED are most commonly based on deep learning [3] which requires large centralized datasets for model training, posing significant security and logistical challenges. \AcFL [4] offers an attractive approach to mitigate some of these concerns. Instead of sending private data to a centralized data store, FL performs model training directly on many client edge devices (from here on referred to as clients) using locally stored data. The clients then share only their updated parameters with a coordination server, which aggregates the shared parameters to update a global model. The new global model is then transferred back to the clients. This process continues until convergence, or indefinitely if new data is continuously acquired [5].
Current research in FL has focused on image or text-based tasks. To our knowledge, the only known research or practical applications of FL in the audio domain are related to keyword spotting [6, 7, 8]. Due to the limited research on FL for SED, there remain questions about the effectiveness of the approach due to varying acoustic conditions inherent to distributed clients. For example, data may be captured from clients in multiple locations with different background noise characteristics or in locations with only a subset of the sound event classes. This leads to differences in data distributions amongst the clients involved in the training process. For centralized training, data from multiple devices is combined into single training dataset that is typically assumed to be independent and identically distributed (IID), but with FL distributed data collection leads to models being trained using data from divergent distributions, i.e., data that is non-IID. Existing SED datasets do not capture the non-IID characteristics seen with FL. To address this gap and foster research on FL for SED, we contribute novel SED datasets specifically designed for FL training. Additionally, we provide baseline results for three neural network architectures to evaluate the effects of FL hyperparameters and non-IID data on SED performance.
| Dataset | Sound Event Classes | Background Noise Classes |
|---|---|---|
| DESED-FL | : Dishes; : Cat; : Frying; : Dog; : Blender; : Speech; : Vacuum cleaner; : Electric shaver/toothbrush; : Alarm bell; : Running water | apartment room, computer interior, computer lab, emergency staircase, and library |
| URBAN-FL | : Children playing; : Siren; : Drilling; : Street music; : Car horn; : Gun shot; : Jackhammer; : Dog bark; : Air conditioner; : Engine idling | birds, crowd, fountain, rain, and traffic |
II Related Work
II-A Federated Learning
McMahan et al. first proposed the idea of FL as a method to allow data to remain on distributed devices while training a shared model by aggregating locally trained updates [4]. For a comprehensive overview of FL, refer to the technical report by Kairouz et al. [5]. There are two main challenges for FL methods. First is the need for communicating over unreliable networks to transmit data. A second issue results from data captured in varying contexts, leading to datasets that are statistically dissimilar, non-IID, between clients.
To address these challenges, Sattler et al. [9] proposed a compression framework sparse ternary compression (STC). Similarly, Lin et al. [10] and Bernstein et al.[11] proposed methods to remove the redundancies of gradient information in node-distributed learning frameworks. Hsieh et al. evaluated the challenges of non-IID data in an FL scenario [12]. They identified problems with the batch normalization layer, a common layer in many deep neural network (DNN) architectures, and proposed to use group normalization [13] instead. Similarly, to address the problems of non-IID data, Sattler et al. [14] proposed a clustering operation to group clients whose data distributions have similar characteristics. While the previous research proposed methods to overcome challenges in FL, there are no known datasets to evaluate them for SED. We address this gap, by presenting new SED datasets specifically designed for FL with non-IID data.
II-B Sound Event Detection
State-of-the-art SED algorithms build upon deep neural networks, the most common being convolutional neural network (CNN) and convolutional recurrent neural network (CRNN) based architectures. Both architectures include convolutional front-ends, where multiple convolutional layers are trained to learn sound-specific features. As input to the network, either fixed two-dimensional signal transformations such as mel spectrograms [15] or raw one-dimensional audio samples are used (end-to-end learning) [16]. As a back-end, CNNs use fully-connected layers for classification whereas CRNNs employ recurrent layers such as gated recurrent unit (GRU) or long short-term memory (LSTM) layers to model the temporal progression of the extracted features. We focus our work on CNN architectures for a lightweight approach, to enable model training on low resource devices required by FL.
Training SED models requires strongly labeled datasets in which onset and offset times are labeled for each sound event. Because of the laborious effort required to annotate real-world samples, researchers often use synthetically generated datasets. This requires mixing events from a curated sound bank with a background signal to synthesize soundscapes with multiple, possibly overlapping, events. For example, URBAN-SED [17] is composed of sound events from the UrbanSound-8K (URBAN-8K) [2] dataset mixed with Brownian noise. A recent trend is to use a combination of synthetic and real recordings for training and evaluation as with Domestic Environment Sound Event Detection (DESED) [1]. For both datasets, however, events are distributed uniformly during soundscape generation. For FL, events should be distributed in a structured fashion to simulate real-world distributed learning conditions. To enable research in FL for SED, our proposed datasets distribute soundscapes to clients with different background characteristics and class distributions.
III Datasets
In this section we present DESED-FL and URBAN-FL, datasets for acoustic monitoring of domestic and urban environments with FL. Each use case contains two independent training sets: an IID dataset, in which sound event classes are distributed evenly to devices, and a non-IID dataset, in which only a subset of the total classes is assigned to each client. To imitate varying acoustic conditions, we mix sound events with one of five background noise classes. Each training dataset is partitioned into 100 clients with 20 clients per background noise class. It is possible to simulate more than 100 clients by partitioning further, or less than 100 by combining or removing clients. For reproducible evaluation, each use case also includes an evaluation dataset in which sound events are uniformly distributed to each background class.
To generate the soundscapes for DESED-FL, sound events and background noises are sourced from DESED [1]. URBAN-FL soundscapes are generated using sound events from URBAN-8K [2], and background noises from Isolated Urban Sound Database (IUSD) [18]. The sound event and noise classes for each dataset are listed in Table I.
III-A IID and Non-IID Training Datasets
To generate the IID and non-IID dataset variations, two sound event class distribution schemes are implemented for assigning events to clients. The IID scheme uniformly distributes event classes to all devices. This is the best possible case for training FL models since all clients have access to all classes. To simulate a more realistic scenario, in which clients only have knowledge of a subset of all classes, the non-IID scheme distributes events to clients using five class distributions, with each distribution containing a subset of five classes. To minimize the bias that could result from linking background sounds to certain subsets of event classes, each of the five distributions is assigned to four clients per background noise. This results in each set of 20 clients per background noise comprising five class distributions. A detailed view of each data distribution is presented in Appendix A. In the non-IID scheme, each of the five class distributions contains five event classes for a total of 25 event classes, which is not divisible by 10, the number of total classes. This means that five event classes were used three times and five event classes were used only twice.
One goal in designing the distributions is to have each set of classes be as different as possible from any other set, while ensuring that each class is used at least once. Hence, the algorithm to select class distributions minimizes the penalty value computed by
where equals the number of collections and represents the number of equal classes in collections and . We do not take into account whether classes are likely to occur together in real-world applications, since there are no obvious combinations that would never happen together.
The distributions that minimize the penalty consists of the sets , , , , and , where each event is assigned one of the available event classes. The mapping of the event classes to the positions (i.e. have been randomized, and can be found in Table I.
III-B Data Generation
The datasets consist of ten-second soundscapes synthetically generated using Scaper [17] by mixing between one and five possibly overlapping source events with one background noise type. Each event is mixed with an signal-to-noise ratio (SNR) chosen from with and . The sound events are selected by sampling from the class distributions as discussed in Section III-A. Additionally, source events are augmented by pitch shifting the audio by an amount uniformly sampled from the range , and by time stretching by a value uniformly sampled from the range . These augmentations are only applied to the training data.
Before generating the soundscapes, the source data is split into training and evaluation sets to ensure that there is no data leakage. For DESED-FL events, the data is partitioned into training and evaluation data according to split provided by DESED. For Urban-FL, we take the approach employed for URBAN-SED, by using the existing stratified folds from the URBAN-8K dataset for the split: folds 1-6 are used for training and 9-10 for evaluation. We omit folds 7-8, used by URBAN-SED for validation, since the DESED source data does not contain a validation split. The background noise for each dataset is split into training and evaluation by splitting each source file into separate training and evaluation segments.
The final training datasets each contain 100 ten-second soundscapes per edge device, totaling soundscapes. The evaluation datasets contain soundscapes per background class for a total of soundscapes. To enable reproducibility, the dataset creation scripts are available for download222https://www.idmt.fraunhofer.de/en/publications/idmt-fl.html
IV Experimental Setup
IV-A Architectures
We propose three baseline architectures to evaluate different model complexities and their effects on FL. One of the goals driving this research is developing small models that are able to be trained on low resource devices, such as neuromorphic hardware. Therefore, we evaluate two standard CNN architectures of different sizes, and a Residual Network (ResNet) architecture [19]. The baseline CNN, CNN-Base, is a medium-sized architecture based on the feature extraction front-end of the 2019 Detection and Classification of Acoustic Scenes and Events (DCASE) Challenge Task 3 baseline architecture. It is composed of seven convolutional blocks and a linear classification layer, for a total of parameters. The second CNN architecture is a small CNN, called CNN-Sm, and was designed using neural architecture search with Bayes optimization [20] to limit the model to nearly parameters while optimizing the F-score on the URBAN-SED dataset. The found model has four convolutional blocks, a single feed forward layer, and a classification layer, resulting in parameters. Lastly, we propose a medium-sized ResNet architecture, ResNet, with five independent component (IC) ResNet blocks [21] and a classification layer for a total of parameters. Detailed descriptions for each architecture may be found in Appendix B.
IV-B Preprocessing
IV-B1 Input Representation
The input for each model is a perceptually weighted mel spectrogram [19]: The input signal is first downsampled to . The short-time Fourier transform (STFT) is applied with a fast Fourier transform (FFT) of size and a hop size of , and is followed by perceptual weighting. A mel-filter bank of 256 mel bands is then applied. Finally, 43 windows are stacked together resulting in a feature representation (43x256x1) of one second.
IV-B2 Data Augmentation
Similar to Salamon and Bello [22], we apply pitch shifting to the audio data before extracting the mel spectrograms. However, instead of applying all shifts of and semitones for a total increase factor of 4, we randomly select one semitone value between for each input for a total augmentation factor of 1 (i.ẽ., doubling the size of the dataset). This helps significantly reduce the final size of the dataset and has only a minor impact on model performance.
IV-C Experimental Design
In our first experiment, the three proposed network architectures are evaluated in a centralized training scenario. First, we train the models using the original URBAN-SED dataset [2] to validate that the architectures work as expected on a well-known dataset. Then, we train each of the three models using the FL training sets. We evaluate the models, first, with batch normalization, and then, replace all batch normalization layers with group normalization to ensure that this substitution for mitigating non-IID issues in FL [12] does not significantly affect the baseline results. All models are trained for 50 epochs with early stopping using a patience of 25 epochs, which monitors the validation loss. We use the Adam optimizer [23] with a cosine learning rate schedule in the range .
The next experiments evaluate the influence of FL hyperparameters on SED performance, namely the total number of clients, , the percentage of total clients that participate in each training round (participation rate ), and number of local epochs performed during each round, . For we evaluate 1, 25, and 100 clients, with providing a FL baseline. For , values of are used in order to simulate the uncertainty of client participation during each communication round. At each round a fraction, , of the clients are uniformly sampled (with replacement at the end of each round) to participate in training. As the amount of network communication should be limited in FL, we evaluate the effects of to reduce the number of communication rounds by increasing amount of training steps performed on each client before sending weight updates. For all FL experiments, the local client models are optimized using Adam, with a learning rate , proposed by Leroy et al. [6]. The local weight updates are aggregated by the coordinator using the standard Federating Averaging algorithm using stochastic gradient descent (SGD) with a learning rate of [4].
Due to the number of experiments, the size of the datasets, and the training times required for each experiment, we limit the number of communication rounds during training to 60 rounds per experiment. Thus, reducing the time and resources required for evaluation333In real-world FL, this would not be an issue due to the inherent parallelization of FL, as opposed to simulating FL on a single server.. While in some cases the models may not have completely converged, the results provide valuable insights to improve our understanding of the different effects of FL hyperparameters to better focus future research.
V Results
V-A Centralized Training
Table II lists the segment-based F-Scores for each of the proposed datasets and architectures from centralized training. Additionally, we include the results of the architectures trained using the URBAN-SED [17] dataset as a baseline to validate the architectures’ performance on a well-established dataset.
In the case of URBAN-SED, the models perform comparable or better than the original baseline of from Salamon et al. [17]. In general, the ResNet architecture is typically the best performing model. Furthermore, replacing batch normalization with group normalization has only minor effects on the performance of all architectures, and in many of the cases it improves performance. The results also indicate that data distribution, either IID or non-IID, has minimal effect on model performance in a centralized context. This is expected since all data is used during each training epoch, and the model does not fit to a particular data distribution.
| Dataset | IID | Norm | CNN-Sm | CNN-Base | ResNet |
|---|---|---|---|---|---|
| URBAN-SED | - | batch | 0.566 | 0.567 | 0.601 |
| URBAN-SED | - | group | 0.532 | 0.587 | 0.589 |
| URBAN-FL | ✓ | batch | 0.600 | 0.625 | 0.647 |
| URBAN-FL | ✓ | group | 0.574 | 0.638 | 0.647 |
| URBAN-FL | ✗ | batch | 0.593 | 0.609 | 0.634 |
| URBAN-FL | ✗ | group | 0.564 | 0.618 | 0.642 |
| DESED-FL | ✓ | batch | 0.627 | 0.632 | 0.630 |
| DESED-FL | ✓ | group | 0.628 | 0.632 | 0.664 |
| DESED-FL | ✗ | batch | 0.618 | 0.625 | 0.625 |
| DESED-FL | ✗ | group | 0.621 | 0.634 | 0.647 |
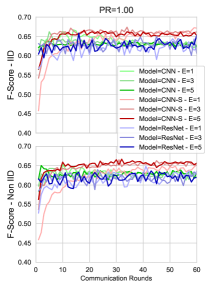
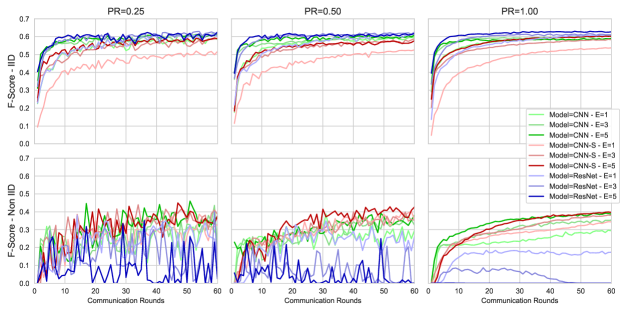
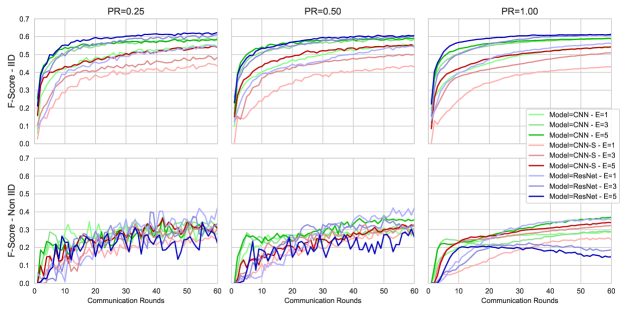
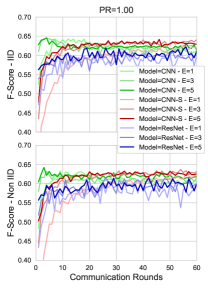
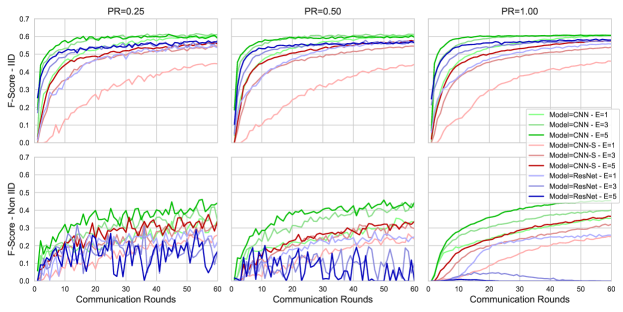
V-B Federated Learning
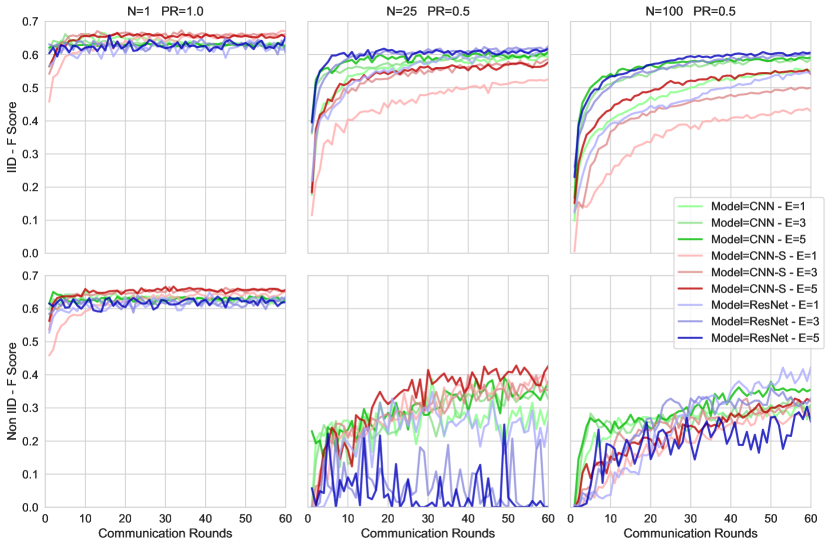
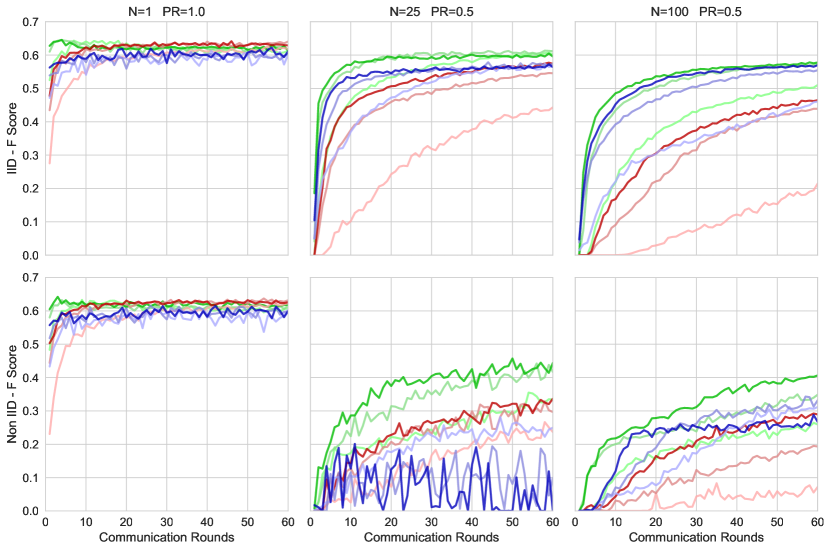
Figure 7 shows the segment-based F-scores on evaluation data for models trained with each training datasets. DESED-FL results are shown in Figure 1(a), and URBAN-FL in Figure 1(b). Each subfigure includes the the results from IID (top row) and non-IID (bottom row) datasets. The results are shown for hyperparameters , , and as a function of communication rounds. Here we present the results for with the remaining results found in Appendix C. The training curves for IID data look similar to what is expected in a centralized training scenario with the training times (i. e., number of communication rounds) being influenced by the architecture type, participation rate, and the number of local epochs. Typically in the IID setting, increasing model complexity and reduces the amount of communication needed between client and server by improving the training time; whereas, increasing slows down training. This could be attributed to the fact that each local client has less data resulting in smaller gradient deltas between the global and newly trained local model at each round. These observations, however, do not necessarily hold in a non-IID context, where performance degrades significantly for all models (except for the baseline ). In this case, the results indicate that larger models are prone to overfit to the data seen during an individual training round. This is especially true with a small number of clients, such as , since there is inherently less variation in the randomly selected client distributions. However, even in cases when all data is seen during each communication round, i. e., , the ResNet continues to overfit. Reducing helps to alleviate this issue by limiting the gradient values, but slowing down training. Training with a larger number of overall clients helps to mitigate this issue as well. In general, the models in a non-IID scenario tend to overfit to local distributions, and the federating averaging process does not correct for this on its own. Damping the gradients before performing aggregation, by lowering the server learning rate or by normalizing gradients for example, may help to reduce the effects of large local gradients.
VI Conclusion
In this work, we introduce DESED-FL and URBAN-FL, two novel datasets to foster research in FL for SED. To better understand the effects of previously identified challenges associated with non-IID data in FL, we include both IID and non-IID training sets for each use case. Additionally, we contribute the first known research on FL for SED through the evaluation of three baseline neural network architecture. The results show that while FL is a promising approach for SED it is prone to challenges with non-IID data similar to previous FL research [12, 9]. By contributing non-IID datasets, we hope enable further research to identify potential solutions to mitigate these issues.
Future research directions include addressing the issues of non-IID data through adaptive techniques such as the automatic adjustment of parameters [12], or clustering techniques to identify groups of distributions and train individual models accordingly [14]. Furthermore, an investigation on strategies for local data management is needed. Since clients may have limited storage capacities, an evaluation of how much data should be stored and for how long is needed. Additionally, it is important to be able to identify which data samples contain the most information and should be stored for later training. To that end, the selective sampling of data based on entropy [24] is an interesting research direction.
- SED
- sound event detection
- CNN
- convolutional neural network
- CNN-S
- small CNN
- CRNN
- convolutional recurrent neural network
- DCASE
- Detection and Classification of Acoustic Scenes and Events
- DESED
- Domestic Environment Sound Event Detection
- DNN
- deep neural network
- FFT
- fast Fourier transform
- FL
- federated learning
- GRU
- gated recurrent unit
- IC
- independent component
- IID
- independent and identically distributed
- LSTM
- long short-term memory
- ReLU
- rectified linear unit
- ResNet
- Residual Network
- RNN
- recurrent neural network
- SGD
- stochastic gradient descent
- STC
- sparse ternary compression
- STFT
- short-time Fourier transform
- SNR
- signal-to-noise ratio
- URBAN-8K
- UrbanSound-8K
- IUSD
- Isolated Urban Sound Database
References
- [1] R. Serizel, N. Turpault, A. Shah, and J. Salamon, “Sound event detection in synthetic domestic environments,” in Proceedings of ICASSP 2020, Barcelona, Spain, May 2020.
- [2] J. Salamon, C. Jacoby, and J. P. Bello, “A dataset and taxonomy for urban sound research,” in 22nd ACM International Conference on Multimedia (ACM-MM’14), Orlando, FL, USA, 11 2014, pp. 1041–1044.
- [3] A. Dang, T. H. Vu, and J. Wang, “A survey of deep learning for polyphonic sound event detection,” in 2017 International Conference on Orange Technologies (ICOT), 2017, pp. 75–78.
- [4] B. McMahan, E. Moore, D. Ramage, S. Hampson, and B. A. y Arcas, “Communication-Efficient Learning of Deep Networks from Decentralized Data,” in Proceedings of the 20th International Conference on Artificial Intelligence and Statistics, 2017.
- [5] P. Kairouz, H. B. McMahan, B. Avent, A. Bellet, M. Bennis, and et al., “Advances and Open Problems in Federated Learning,” 2019.
- [6] D. Leroy, A. Coucke, T. Lavril, T. Gisselbrecht, and J. Dureau, “Federated Learning for Keyword Spotting,” in Proceedings of ICASSP 2019, 2019.
- [7] Apple. (2019) Designing for privacy (video and slide deck). [Online]. Available: https://developer.apple.com/videos/play/wwdc2019/708
- [8] A. Bhowmick, J. Duchi, J. Freudiger, G. Kapoor, and R. Rogers, “Protection against reconstruction and its applications in private federated learning,” arXiv preprint arXiv:1812.00984, 2018.
- [9] F. Sattler, S. Wiedemann, K.-R. Muller, and W. Samek, “Robust and Communication-Efficient Federated Learning From Non-i.i.d. Data,” IEEE Transactions on Neural Networks and Learning Systems, 2019.
- [10] Y. Lin, S. Han, H. Mao, Y. Wang, and W. J. Dally, “Deep Gradient Compression: Reducing the Communication Bandwidth for Distributed Training,” 2017.
- [11] J. Bernstein, Y.-X. Wang, K. Azizzadenesheli, and A. Anandkumar, “signSGD: Compressed optimisation for non-convex problems,” 2018.
- [12] K. Hsieh, A. Phanishayee, O. Mutlu, and P. B. Gibbons, “The Non-IID Data Quagmire of Decentralized Machine Learning,” 2019. [Online]. Available: http://arxiv.org/abs/1910.00189
- [13] Y. Wu, “Group Normalization,” ECCV, 2018. [Online]. Available: https://research.fb.com/publications/group-normalization/
- [14] F. Sattler, K.-R. Müller, and W. Samek, “Clustered Federated Learning: Model-Agnostic Distributed Multi-Task Optimization under Privacy Constraints,” 2019.
- [15] Y. Hou, Q. Kong, S. Li, and M. D. Plumbley, “Sound Event Detection with Sequentially Labelled Data Based on Connectionist Temporal Classification and Unsupervised Clustering,” in Proceedings of ICASSP 2019, 2019.
- [16] E. Cakir and T. Virtanen, “End-to-End Polyphonic Sound Event Detection Using Convolutional Recurrent Neural Networks with Learned Time-Frequency Representation Input,” Proceedings of the International Joint Conference on Neural Networks, vol. 2018-July, 2018.
- [17] J. Salamon, D. MacConnell, M. Cartwright, P. Li, and J. P. Bello, “Scaper: A library for soundscape synthesis and augmentation,” in Proceedings of the IEEE Workshop on Applications of Signal Processing to Audio and Acoustics (WASPAA), 2017.
- [18] J.-R. Gloaguen, M. Lagrange, A. Can, and J.-F. Petiot, “Isolated urban sound database,” Apr. 2018. [Online]. Available: https://doi.org/10.5281/zenodo.1213793
- [19] K. Koutini, H. Eghbal-zadeh, M. Dorfer, and G. Widmer, “The Receptive Field as a Regularizer in Deep Convolutional Neural Networks for Acoustic Scene Classification,” in Proceedings of EUSIPCO 2019, 2019.
- [20] J. Snoek, H. Larochelle, and R. P. Adams, “Practical Bayesian Optimization of Machine Learning Algorithms,” in NeurIPS, Lake Tahoe, Nevada, 2012, pp. 2951–2959.
- [21] G. Chen, P. Chen, Y. Shi, C.-Y. Hsieh, B. Liao, and S. Zhang, “Rethinking the usage of batch normalization and dropout in the training of deep neural networks,” arXiv preprint arXiv:1905.05928, 2019.
- [22] J. Salamon and J. P. Bello, “Deep Convolutional Neural Networks and Data Augmentation for Environmental Sound Classification,” IEEE Signal Processing Letters, vol. 24, no. 3, pp. 279–283, 3 2017.
- [23] D. P. Kingma and J. Ba, “Adam: A method for stochastic optimization,” arXiv preprint arXiv:1412.6980, 2014.
- [24] F. Wiewel and B. Yang, “Entropy-based sample selection for online continual learning,” in Proceedings of the EUSIPCO 2020, 2020.
Appendix A Datasets
| Dataset | Version | Max Poly | Avg Poly | Avg Num Events | Avg Dur. (s) | Min Dur. (s) | Max Dur. (s) |
|---|---|---|---|---|---|---|---|
| URBAN-FL | IID | 5 | |||||
| URBAN-FL | Non-IID | 5 | |||||
| URBAN-FL | Eval | 5 | |||||
| DESED-FL | IID | 5 | |||||
| DESED-FL | Non-IID | 5 | |||||
| DESED-FL | Eval | 5 |
In this section, we present a detailed view of the device data and distributions for the proposed IID and non-IID datasets, DESED-FL and URBAN-FL. Table III lists detailed statistics regarding polyphony, i.e. the number of events occurring simultaneously, number and duration of events per sound soundscape. The statistics indicate that the datasets all exhibit similar characteristics, with the only significant different in the max durations between the DESED-FL and URBAN-FL datasets. This is due to the nature of the source datasets. The max duration of the sound events in the URBAN-8K datasets is four seconds, whereas in the DESED-FL source dataset, some events can be longer than four seconds so the max duration is limited to the length of the soundscapes.
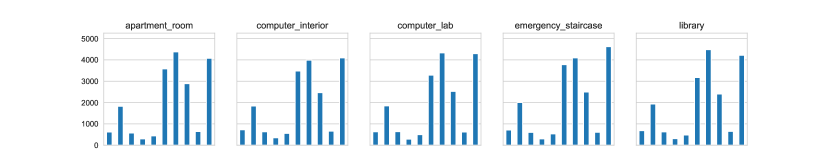
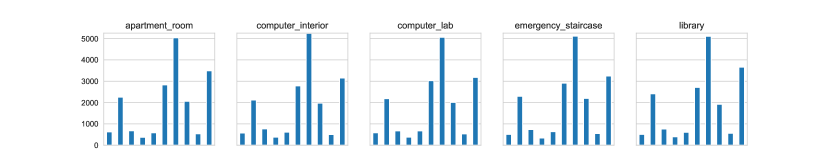
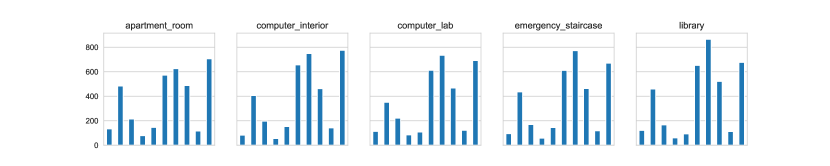
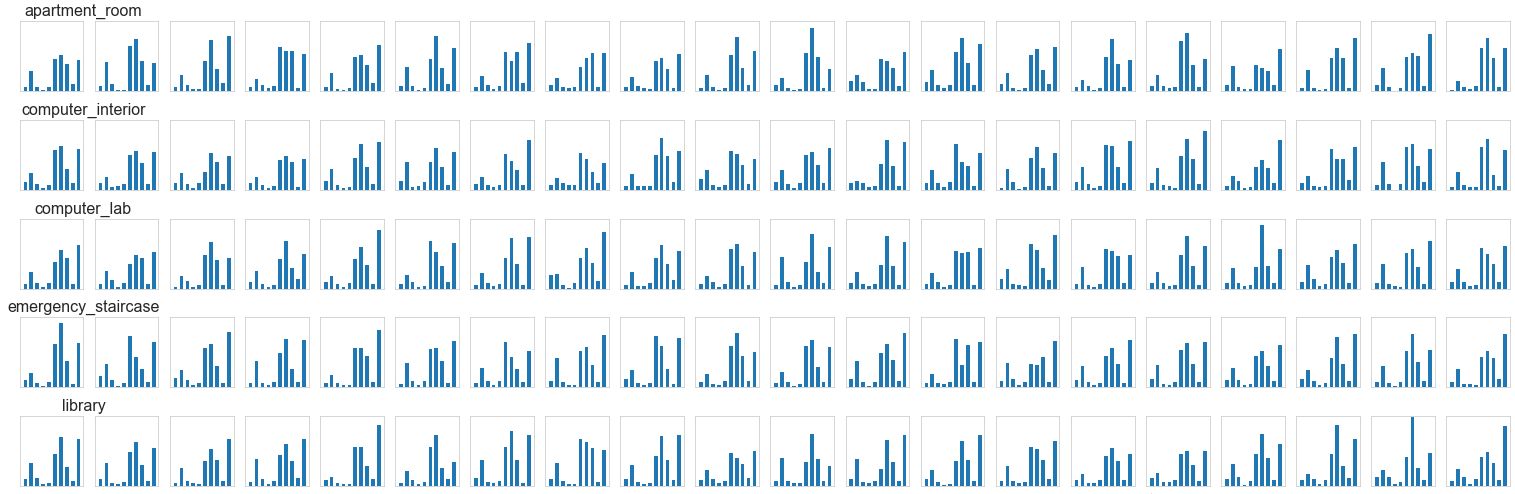
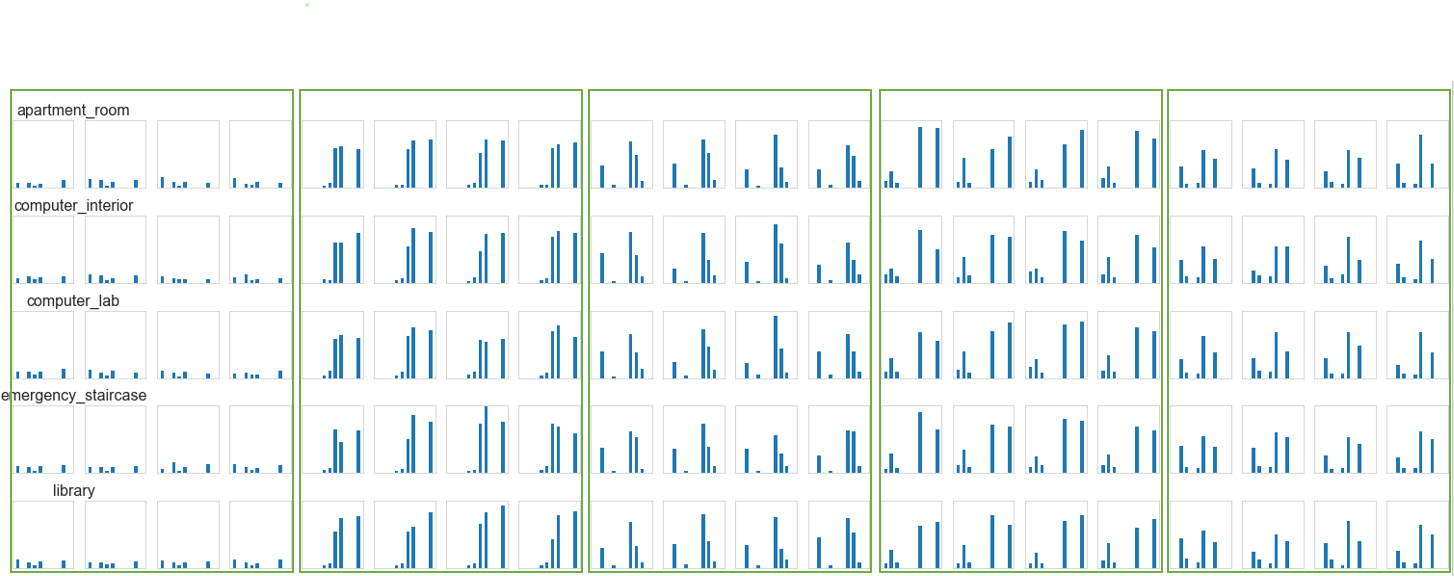
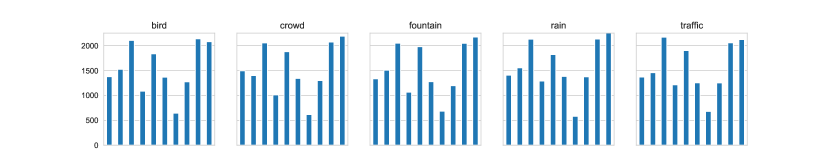
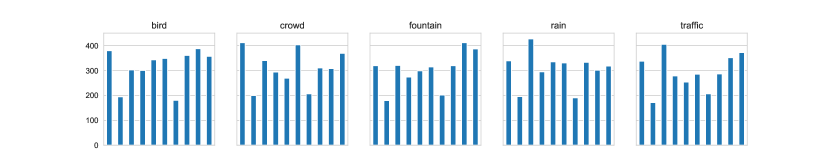
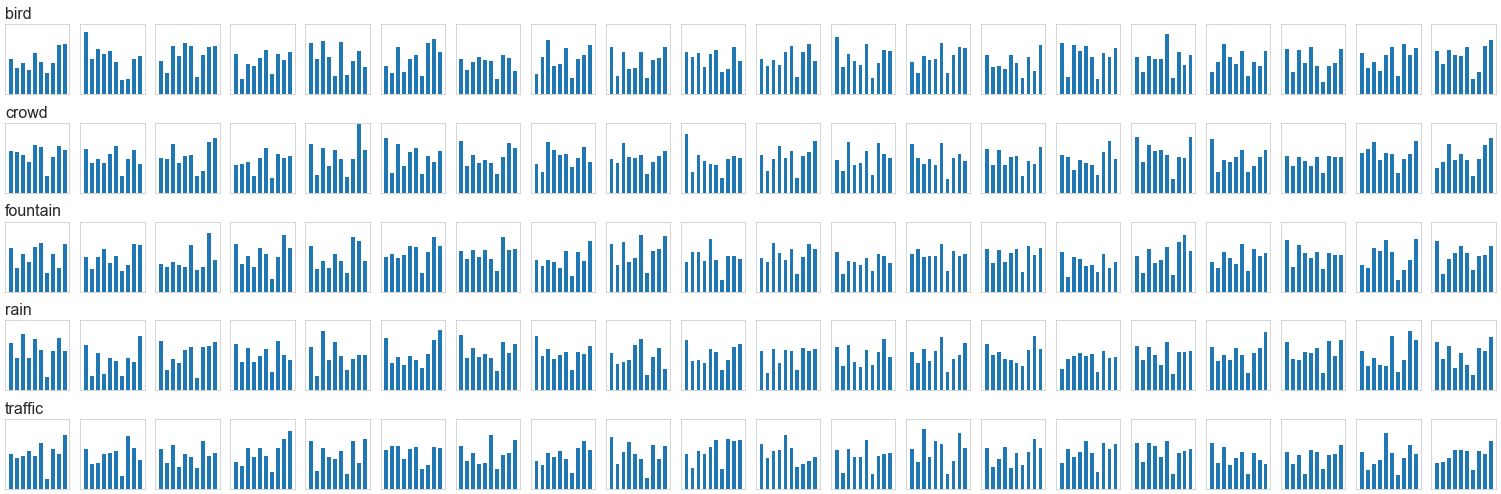
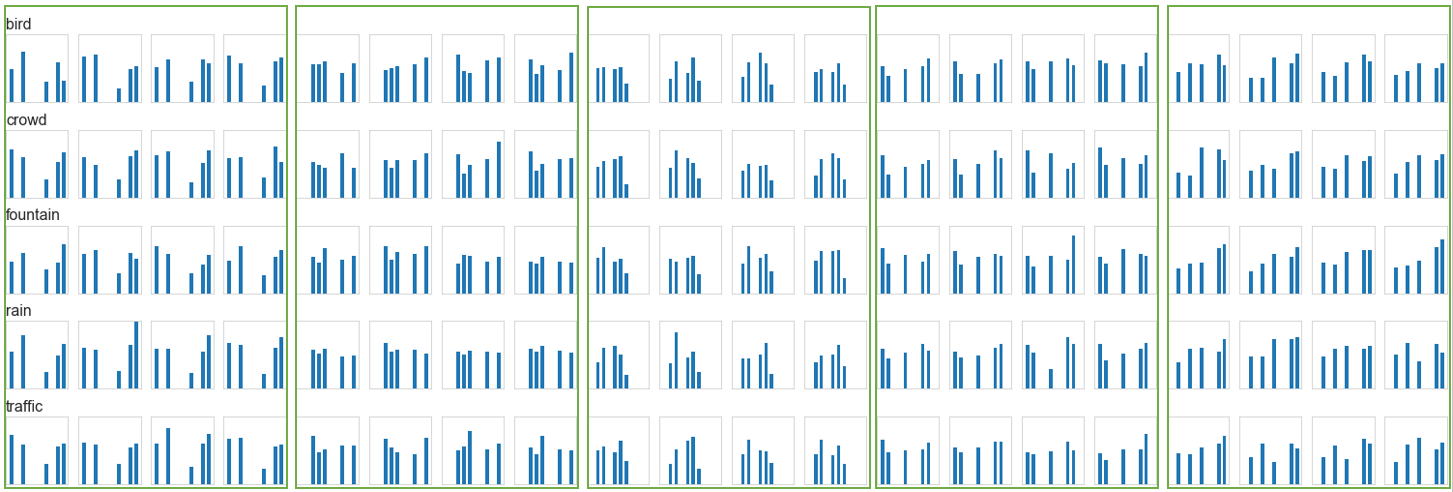
Figures 2 and 4 show the total duration of each of the sound events as distributed to the background noise classes for each of the training and evaluation datasets of DESED-FL and URBAN-FL respectively. As expected, the distributions of data between each background. The data was distributed evenly amongst background classes to mitigate any potential background biases in the final trained models. Figures 3 and 5, provide a detailed look at the individual client distributions. The event durations bar charts for the IID data, in Figures 3(a) and 5(a), show that the sound events are identically distributed for all devices. Whereas, in the non-IID data, shown in Figures 3(b) and 5(b), there are five different distributions for each background class, indicated by the surrounding green boxes. This distribution scheme reduces the potential for background bias by ensuring all sound events are distributed among each background type while ensuring non-IID client devices.

Appendix B Detailed Architectures
In this section, we provide details on the three architectures used in our experiments on SED with FL to foster reproducibility of baseline results on the proposed datasets. As baseline architectures we propose two standard CNN architectures, a small one with close to parameters and a medium-sized one. Additionally, we proprosed a medium-sized ResNet based architecture.
| Layer | Output | Kernel Size | Droput |
|---|---|---|---|
| Conv Block | 16 | (3, 3) | 0.20 |
| Avg Pooling | - | (2, 2) | - |
| Conv Block | 32 | (3, 3) | 0.20 |
| Avg Pooling | - | (2, 2) | - |
| Conv Block | 64 | (3, 3) | 0.20 |
| Avg Pooling | - | (1, 2) | - |
| Conv Block | 128 | (3, 3) | 0.20 |
| Avg Pooling | - | (1, 2) | - |
| Conv Block | 128 | (3, 3) | 0.20 |
| Avg Pooling | - | (1, 2) | - |
| Conv Block | 128 | (3, 3) | 0.20 |
| Avg Pooling | - | (1, 2) | - |
| Conv Block | 128 | (3, 3) | 0.20 |
| Global Avg Pooling | - | - | - |
| Dense | 10 | - | - |
| Sigmoid | - | - | - |
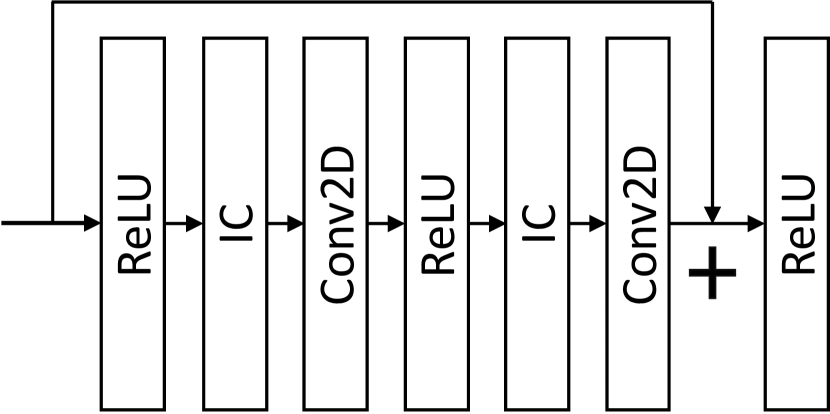
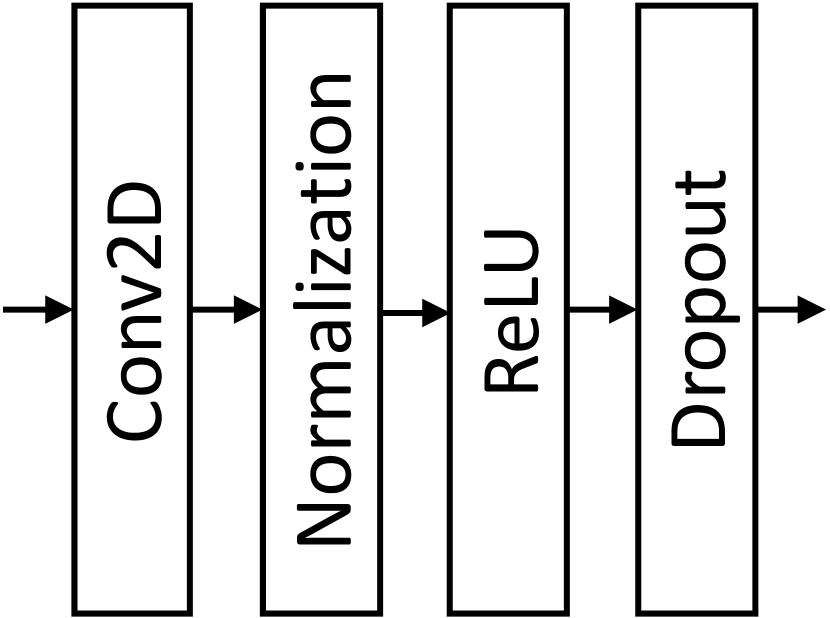
Both CNN-Base and CNN-Small are standard CNN architectures composed of convolution blocks each followed by a pooling layer. Each convolutional block, shown in Figure 6(b), contains a 2D convolution, a normalization layer, an activation layer, and 20% dropout. Global pooling is performed before the final output layer. CNN-Base is based on the baseline architecture from the DCASE 2019 challenge for SED \citeAppturpault:dcase2019baseline without the recurrent layers, and is composed of seven convolutional blocks. The recurrent layers were removed in order to maintain compatibility with neuromorphic hardware. The architecture and hyperparameters are listed in Table IV. The resulting architecture contains trainable parameters.
| Layer | Output | Kernel Size | Dropout |
|---|---|---|---|
| Conv Block | 16 | (3, 3) | 0.2 |
| Pooling 2D | - | (2, 2) | - |
| Conv Block | 32 | (3, 3) | 0.2 |
| Pooling 2D | - | (2, 2) | - |
| Conv Block | 64 | (3, 3) | 0.2 |
| Pooling 2D | - | (2, 2) | - |
| Conv Block | 128 | (3, 3) | 0.2 |
| Global Pooling | - | - | - |
| Dense | 128 | - | - |
| ReLu | - | - | - |
| Dense | 10 | - | - |
| Sigmoid | - | - | - |
CNN-Small is a CNN that was designed using Bayesian Optimization neural architecture search \citeAppSnoek2012:bayes_opt444Implemented with http://github.com/fmfn/BayesianOptimization to keep the model close to parameters. The final architecture is composed of four convolutional blocks, seen in 6(b) and a classification network with one hidden layer and one output layer, for a total of parameters. The architecture and hyperparameters are listed in Table IV.
| Layer | Output | Kernel Size 1 | Kernel Size 2 | Dropout |
|---|---|---|---|---|
| Conv 2D | 64 | (5, 5) | - | - |
| Relu | - | - | - | - |
| ResNet Block | 64 | (3, 3) | (1, 1) | 0.10 |
| Avg Pooling | - | (2, 2) | - | - |
| ResNet Block | 64 | (3, 3) | (3, 3) | 0.10 |
| Avg Pooling | - | (2, 2) | - | - |
| ResNet Block | 64 | (3, 3) | (3, 3) | 0.10 |
| Avg Pooling | - | (2, 2) | - | - |
| ResNet Block | 128 | (3, 3) | (1, 1) | 0.10 |
| Avg Pooling | - | (2, 2) | - | - |
| ResNet Block | 256 | (1, 1) | (1, 1) | 0.10 |
| Avg Global Pooling | - | - | - | - |
| Dense | 10 | - | - | - |
| Sigmoid | - | - | - | - |
The ResNet architecture is composed of ResNet blocks with IC layers as proposed by Chen et al. \citeAppchen2019.rethinking shown in Fig. 6(a) with hyperparameters inspired by Koutini et al. \citeAppKoutini2019 to minimize the receptive field of the model. The IC blocks contain a normalization layer followed by dropout. For additional regularization, l2 weight regularization is performed as well as disabling of centering and scaling during the normalization process \citeAppMcDonnell2020. The final architecture contains trainable parameters.
Appendix C Extended Results
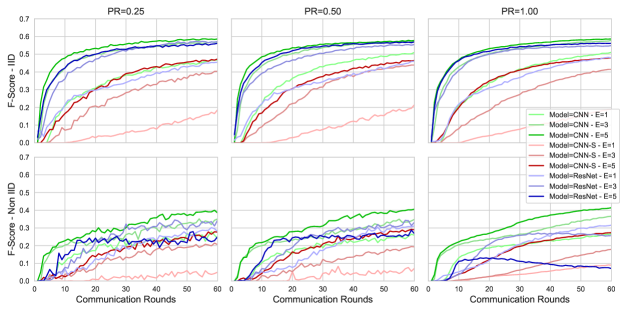
In this section, we present extended results from our FL experiments. In addition, to , presented in the main article, results for are shown in Figures 7 and 8. The percentage of clients involved in a training round has minimal effects on the training peformance for IID data, while in the case of non-IID training is more stabilized as the percentage increases. This is most likely a result of the central server receiving weight gradients from all possible distributions at each training round.
IEEEtran \bibliographyAppIEEEabrv,literature.bib