Aspects on Identification, Decay Properties and Nuclear Structure of the Heaviest Nuclei
Fritz Peter Heßberger1,2,***E-mail: f.p.hessberger@gsi.de
1GSI - Helmholtzzentrum für Schwerionenforschung GmbH, Planckstraße 1, 64291 Darmstadt, Germany
2Helmholtz Institut Mainz, Staudingerweg 18, 55128 Mainz, Germany
Version: April, 27, 2022
Abstract
Synthesis of new elements at the upper border of the charts of nuclei and investigation of their decay properties and nuclear structure
has been one of the main research topics in low energy nuclear physics since more than five decades. Main items are the quest for the
heaviest nuclei that can exist and the verification of the theoretical predicted spherical proton and neutron shells at Z = 114, 120 or 126
and N = 172 or 184.
The scope of the present paper is to illustrate some technical and physical aspects in investigation of the heaviest nuclei
(’superheavy nuclei’) and to critical
discuss some selected results, which from a strict scientific point of view are not completely clear so far, making partly also suggestions
for alternative interpretations.
A complete review of the whole field of superheavy element research, however, is out of the scope of this paper.
1 1. Introduction
First extensions of the nuclear shell model [1, 2] into regions far beyond the heaviest known doubly magic nucleus,
208Pb (Z = 82, N = 126), performed more than fifty years ago lead to the prediction of spherical proton and neutron
shells at Z = 114 and N = 184 [3, 4]. Nuclei in the vicinity of the crossing of both shells were
expected to be extremely stabilized against spontaneous fission by fission barriers up to about 10 MeV.
Particulary for the doubly magic nucleus a fission barrier of 9.6 MeV and hence a partial fission half-life of 1016 years
[5], in a preceding study even 21019 years [6], were expected. In an allegorical picture these
nuclei were regarded to form an island of stability, separated from the peninsula of known nuclei (the heaviest, safely identified element at that time was lawrencium
(Z = 103))
by a sea of instability and soon were denoted as ’superheavy’ (see e.g [7]).
The theoretical predictions initiated tremendous efforts from experimental side to produce these superheavy nuclei and to investigate their decay properties as well as
their nuclear and atomic structure and their chemical properties. The major and so far only successful method to synthesize transactinide elements (Z 103) were complete fusion reactions.
These efforts were accompanied by pioneering technical developments a) of accelerators and ion sources to deliver stable heavy ion beams of high intensity, b) of targets
being able to stand the high beam intensities for long irradiation times ( several weeks), c) for fast and efficient separation of products from complete fusion reactions
from the primary beam and products from nuclear reactions others than complete fusion, d) of detector systems to measure the different decay modes ( - decay, EC - decay, spontaneous
fission and acompanying radiation and conversion electrons), e) of data analysis techniques, and f) for modelling measured particle spectra by advanced simulations, e.g. GEANT4 [8].
Despite all efforts it took more than thirty years until the first serious results on the production of elements Z 114
(flerovium) were reported [9, 10]. However, these first results could not be reproduced independently and are still ambiguous [11].
Nevertheless, during the past twenty years synthesis of elements Z = 113 to Z = 118 has been reported and their discovery was approved
by the International Union for Pure and Applied Chemistry (IUPAC) [12, 13, 14]. The decay data reported for the isotopes of
elements Z 113 that have been claimed to be identified indicate the existence of a region of shell stabilized nuclei towards N = 184,
but the center has not been reached so far. Data on the strength of the possible shells is still scarce.
Tremendous efforts have also been undertaken from the theoretical side to make predictions on stability (’shell effects’), fission barriers, Qα - values, decay modes,
halflives, spin and parity of the ground-state as well as of low lying excited states, etc.. For about thirty years the calculations were performed using
macroscopic-microscopic approaches based on the nuclear drop model [15] and the Strutinsky shell correction method [16]. Although predicted
shell correction energies (’shell effects’)
disagreed considerably the models agreed in Z = 114 and N = 184 as proton and neutron shell closures (see e.g. [17, 18]).
The situation changed by the end of the 1990ties when for the first time results
using self-consistent models like Skyrme-Hartree-Fock-Bogoliubov (SHFB) calculations or relativistic mean-field models (RMF)
were published [19, 20].
Most of the calculations predict Z = 120 as proton shell closure, while others predict Z = 114 (SkI4) or Z = 126 (SkP, SkM*). Skyrme force based calculations agree in N = 184 as neutron shell closure, while the RMF calculations favour N = 172. As a common feature all these parametrizations and also the macroscopic - microscopic calculations result in a wide area of high shell effects.
That behavior is different to that at known shell closures, e.g. Z = 50, N = 50, 82, where the region of high shell effects (or high 2p - and 2n - separation energies) is strongly localized. It is thus not evident if the concept of nuclear shells as known from the lighter nuclei is still reasonable in the region of superheavy nuclei. It might be wiser to speak of regions of high shell stabilization instead.
On the other hand, it has been already discussed extensively by Bender et al.[21]
that the proton number Z and the neutron number N, where the shell closure occurs strongly depend on details in the description of the underlying forces, specifically on the values for the effective masses m∗ and the strength of the spin - orbit interaction. It also
has been emphasized in [21] that the energy gap between the spin - orbit partners
2f5/2 and 2f7/2 determines whether the proton shell occurs at Z = 114 or Z = 120.
Under these circumstances predictions of shell closures at different proton (Z) and/or neutron (N) numbers by different models may be regarded rather as a feature of ’fine tuning’ of the models than as a principle disagreement.
Having this in mind superheavy elements represent an ideal laboratory for investigation of the nuclear (’strong’) force.
More detailed knowledge of properties and structure of superheavy heavy nuclei is thus undoubtedly decisive for
deeper understanding of basic interactions. Therefore investigations of decay properties and structure of superheavy nuclei will become in future even more important than synthesis of new elements.
One has, however, to keep in mind, that the theoretically predicted high density of nuclear levels in a narrow energy interval above the ground-state may lead to complex -decay patterns, while on the other hand often only little numbers of decay events are observed. Therefore it is tempting to take the average of the measured decay data, which finally results to assign the
measured data as due to one transition in case of the -decay energies, or due to originating from one nuclear level in the case of life-times. Thus fine structure in the decay or the existence of isomeric levels might be overseen. Rather, a critical analysis and assessment of the measured data is required.
As already indicated above the expression ’superheavy nuclei’ or ’superheavy elements’ had been originally suggested for the nuclei in the vicinity of the crossing of the spherical proton and neutron shells at Z = 114 and N = 184. The establishment of deformed proton and neutron shells at Z = 108 and N = 162 [22, 23, 24, 25] resulted in the existence of a ridge between the ’peninsula’ of known nuclei and the ’island of stability’. Thus it became common to denote all purely shell stabilized nuclei as ’superheavy’,
i.e. nuclei with liquid drop fission barriers lower than the zero - point motion energy (0.5 MeV).
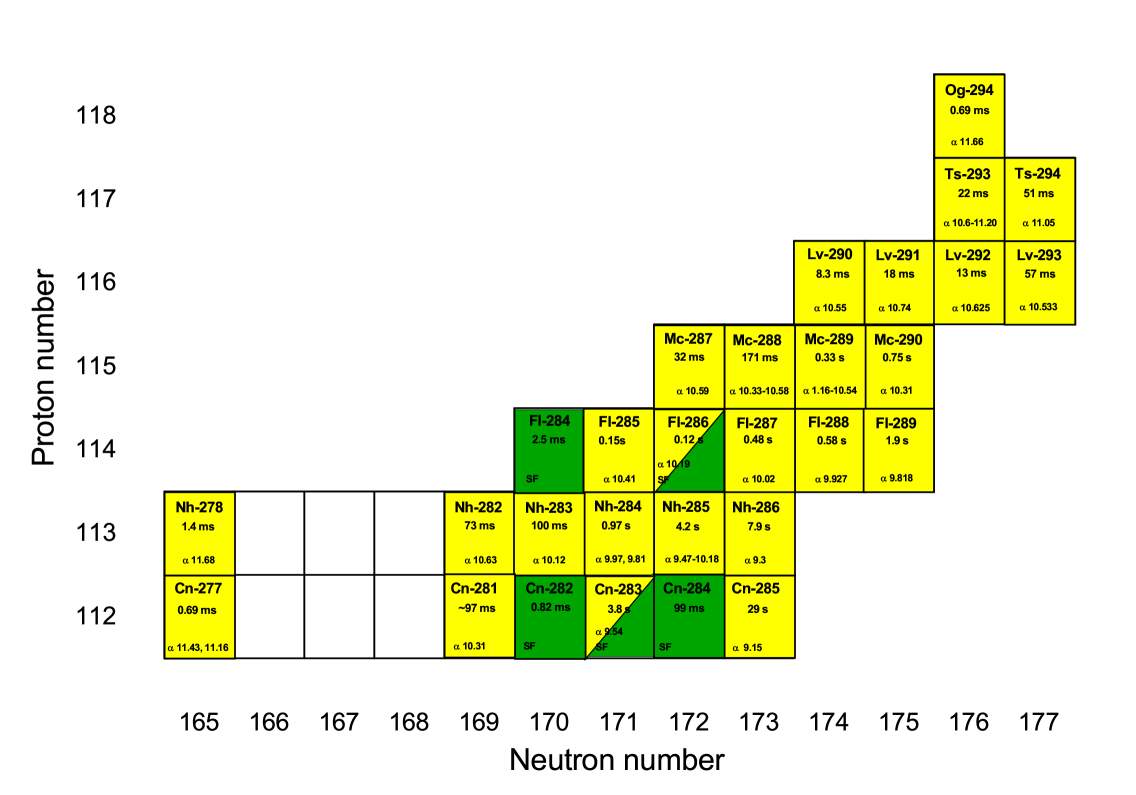
The region of superheavy nuclei that shall be treated in this review is shown in fig. 1.
2 2. Experimental Approach
Complete fusion reactions of suited projectile and target nuclei has been so far the only successful method to produce nuclei with atomic numbers Z 103 (see e.g. [26, 27]).
Under these considerations a separation method has been developped to take into account the specific features of this type of nuclear reactions.
Due to momentum conservation the velocity of the fusion product, in the following denoted as ’compund nucleus’ (CN)†††it is common to denote the primary fusion products which represent in mass and atomic number the sum of projectile and target as ’compound nucleus’ (CN) which is highly excited.The final product after deexcitation by prompt emission of nucleons and/or particles is denoted as ’evaporation residue’ (ER).
can be written as
vCN = (mp / (mp + mt)) x vp
where mp, mt denote the masses of the projectile and target nucleus, and vp the velocity of the projectile. This simply means that a) fusion products are
emitted in beam direction (with an angular distribution around zero degree determined by particle emission from the highly excited CN and by scattering in the target foil)
and b) that CN are slower than the projectiles. It seemed therefore straightforward to use the velocity difference for separation of the fusion products from the projectiles
and products from nuclear reactions others than complete fusion. Such a method has the further advantage of being fast, as the separation is performed in-flight
without necessity to stop the products. So separation time is determined by the flight-time through the separation device. In the region of transactinide nuclei this
separation technique has been applied for the first time at the velocity filter SHIP at GSI, Darmstadt (Germany) [28] for investigation of evaporation residue production in the
reactions 50Ti + 207,208Pb, 209Bi [29, 30] and for the identification of element Z = 107 (bohrium)
in the reaction 54Cr + 209Bi [31]. Separation times in these cases were in the order of 2 s.
As an alternative separation technique gas-filled separators have been developped using the different magnetic rigidities B of fusion products and projectiles
as the basis for separation. Early devices used in investigation of tranfermium nuclei were SASSY [32] and SASSY II [33] at LNBL Berkeley, USA and
HECK [34] at GSI.
Due to their simpler conception and more compact construction, which allows for separation times below 1 s gas-filled separators meanwhile have
become a wide spread tool for investigation of heaviest nuclei and are operated in many laboratories, e.g. RITU (University of Jyväskylä, Finland) [35],
BGS (LNBL Berkeley, USA) [36], DGFRS (JINR, Dubna, Russia) [37], GARIS (RIKEN, Wako, Japan) [38], SHANS (IMP, Lanzhou, China) [39],
TASCA (GSI, Darmstadt, Germany) [40].
Separation, however, is only one side of the medal. The fusion products have also to be identified safely. Having in mind that the essential decay modes of superheavy
nuclei are decay and spontaneous fission (SF) detection methods suited for these items have been developped. After it was shown that suppression of the
projectile beam by SHIP was high enough to use silicon detectors [41] an advanced detection set-up for investigation of heaviest nuclei was built [42].
It consisted of an array of seven position-sensitive silicon detectors (’stop detector’), suited for spectroscopy and registration of heavy particles (fission products,
evaporation residues (ER), scattered projectiles etc.). To obtain a discrimination between particles passing the velocity filter and being stopped in the detector
(ER, projectiles, products from few nucleon transfer) and radioactive decays ( decay, SF) and to obtain a separation of ER and scattered projectiles or
transfer products a time-of-flight detector was placed in front of the stop detector [43]. Also the possibility to measure rays emitted
in coincidence with particles was considered by placing a Ge- detector behind the stop detector.
This kind of detection system has been improved in the course of the years at SHIP [44, 45] and was also adopted in modified versions and improved by other
research groups in other laboratories; examples are GREAT [46], GABRIELA [47] and TASISpec [48].
The improvements essentially comprise the following items:
a) the detector set-ups were upgraded by adding a box-shaped Si - dector arrangement, placed upstream and facing the ’stop detector’,
allowing with high efficiency registration of particles and fission
products escaping the ’stop detector’. This was required as the ranges of particles and fission fragments in silicon are larger than the range of ER; so about
half of the particles and 30 - 50 of the fission fragments will leave the ’stop detector’ releasing only part of their kinetic energy in it.
b) the ’old’ Si detectors where positions were determined by charge division were replaced by pixelized detectors allowing for a higher position resolution and thus
longer correlation times.
c) effort was made to reduce the detector noise to have access to low energy particles (E 500 keV) like conversion electrons (CE).
d) digital electronics was introduced to enable dead time free data aquisition and to have access to short-lived acitivities with halflives
lower than some microseconds.
e) detecor geometry and mechanical components were optimized to use several Ge detectors and to minimize scattering and absorption of rays
in the detector frames to increase the efficiency for ray detection.
As it is not the scope of this work to present experimental techniques and set-ups in detail we refer for this item
to a recent review paper [49].
Another technical aspect concerns the targets. As production cross-sections for heaviest elements are small, highest available beam currents
have to been used. Consequently a technology was desired to avoid destruction of the targets, which led to the development of rotating
target wheels [50]; performance of the wheels and target quality were continuously improved.
As an alternative method to produce superheavy nuclei (SHN) recently the idea of using multinucleon transfer reactions was
resumed, see e.g. [51, 52]. Indeed, intensive studies of those reactions with respect to SHN production, e.g.
238U + 238U or 238U + 248Cm, had been performed at the UNILAC at GSI already about forty years ago. A summary
of these efforts is given in [53]. Heaviest nuclides that could be identified in these experiments were isotopes of mendelevium (Z = 101). A drawback of these studies, however, was the use of radiochemical methods which restricted
isotope identification to those with ’long’ halflives, T1/2 1 min, giving no excess to short-lived nuclei in the
region Z 102. To proceed in studying those reactions new types of separators are required, taking into account not
only short halflives down to the s - range, but also a broad angular distribution of the reaction products.
A more detailed discussion of this feature, however, is beyond the scope of this review.

3 3. Data Selection
Within the commonly used techniques particles passing the in-flight separator are implanted into a silicon-detector set-up.
As separation of the ER from ’unwanted’ particles (scattered projectiles, scattered target nuclei, products from few nucleon
tansfer etc.) is not clean, there will be always a cocktail of particles registered, forming a background covering the energy
range of the decays of the nuclei to be investigated, and usually also the energy range of the spontaneous fission
products. In cases of small production cross sections, typically 1b, decays of the ER are usually not visible in the particle spectra. Further cleaning procedures are required. An often applied procedure is the use of transmission detctors in front
of the ’stop - detector’ and requiring an anticoincidence between events registered in the stop detector and the transmission detector.
In practise the efficiency of the latter is never excatly 100 , therefore there will still be a residual background in the spectra.
In cases of a pulsed beam, one can restrict to the time intervals between the pulses.
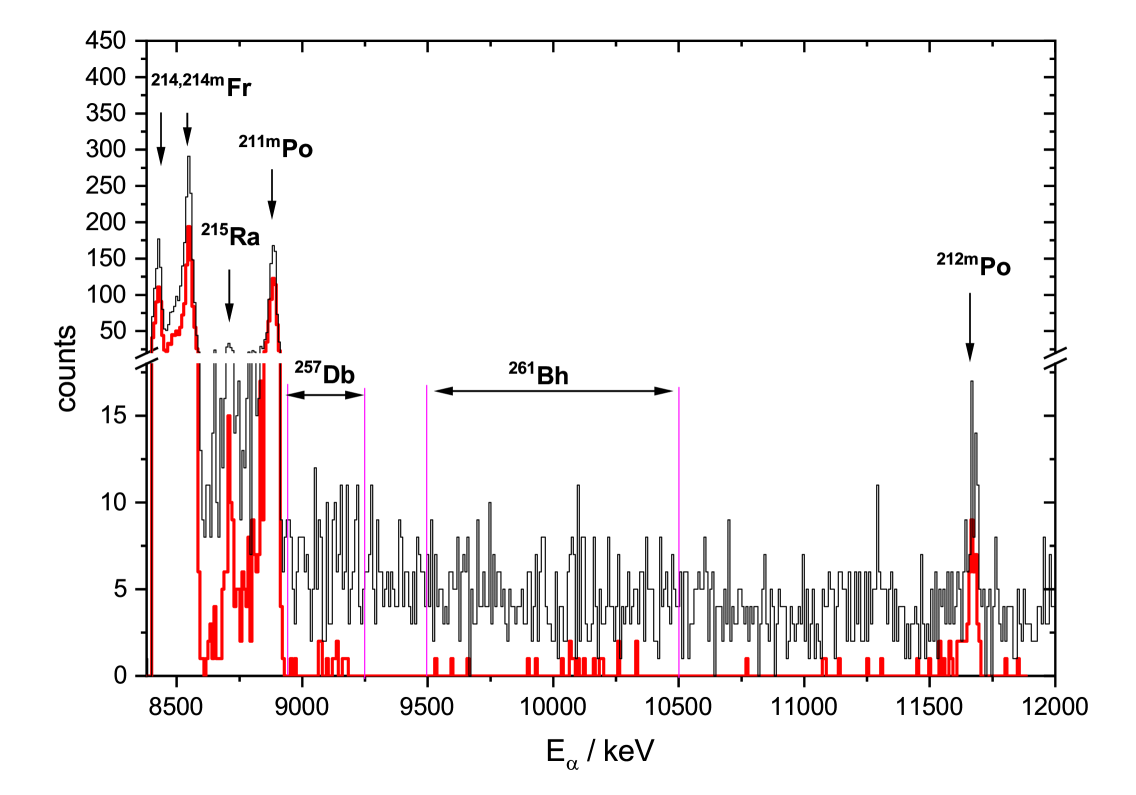
An example is shown in fig. 2. where the spectrum taken in an irradiation of 209Bi with 54Cr (271 MeV) at SHIP is
presented [54].
The black line represents the particle spectrum taken in anti-coincidence with the time-of-flight (TOF) detectors; clearly products
(211m,212mPo, 214,214mFr, 215Ra) stemming from few nucleon transfer reactions are visible, the ER, 261Bh and its
daughter product 257,257mDb, however, are buried under the background. In cases of pulsed beams a further purification is achieved by requiring a ’beam - off’ condition. Thus the decays of 261Bh, 257,257mDb become visible (red line in
fig. 2). Such a restriction, however, is not desirable in many cases as it restricts identification to nuclei having liftimes in the order of the pulse-lengths or longer.
A possible way out is the use of genetic correlations between registered events; these may be correlations of the type ER - ,
- , ER - SF, - SF etc.
4 4. Data Treatment
4.1 4.1 Genetic Correlations
To establish genetic relationships between mother and daughter decays is presently a standard method to identify
unknown isotopes or to assign individual decay energies to a certain nucleus.
Originally it was developped at applying the He - jet technique for stopping the reaction products and transport them to the detection system.
As the reaction products were deposited on the surface of the detector, depending on the direction of emission
of the particle the latter could be either registered in the detector, but the residual nucleus was kicked off the detector
by the recoil of the emitted particle or the residual nucleus was shallowly implanted into the detector, while the particle
was emitted in opposite direction and did not hit the detector. To establish correlations sophisticated detector arrangements were required (see i.e. [55]).
The technique of stopping the reaction products in silicon surface barrier detectors after in-flight separation from the projectile beam simplified the procedures considerably [41, 56].
Due to implantation into the detector by (5 - 10) m the residual nucleus was not kicked out of the detector by the recoil of the emitted particle
and therefore decays of the implanted nucleus and all daughter products occured in the same detector;
so it was sufficient to establish chronological relationship between events measured within the same detector [56].
The applicability of this method was limited by the decay rate in the detector, as the time sequence of decays became accidential if the search time for correlations exceeded the
average time distance between two decays. The application of this technique was improved by using position sensitive silicon detectors [42, 57].
These detectors deliver the position of implantation as an additional parameter. The position resolution is typically around 300 m (FWHM),
while the range of particles of (5 - 10) MeV is (40 - 80) m [58] and the dislocation of the residual nucleus due to the recoil is 1 m.
Thus all subsequent decays of a nucleus will occur at the same position (within the detector resolution). The probability to observe random correlations is reduced significantly
by this procedure.
In these set-ups position signals were produced by charge division between an upper (top) and a lower (bottom) detector electrode (see e.g. [59] for an advanced version of such a detector set-up).
In modern set-ups (see e.g. [48]) these position sensitve detectors have been replaced by pixeled detectors having vertical strips
(a typical width is 1 mm) on one side and horizontal strips of the same width on the other side. The position is then given by the coordinates
representing the numbers of the horizontal and vertical strips. One advantage of the pixeled detectors is a somewhat better position resolution;
taking strip widths of each 1 mm, one obtains a pixel size of 1 mm2; for the SHIP - type detector [59] (5 mm wide strips, position resolution 0.3 mm (FWHM))
taking in the analysis three times the FWHM one obtains an effective pixel size of
4.5 mm2 (3 x 0.3 x 5 mm2). More stringent, however, is the fact that the position resolution for a pixeled detector is given solely by
the strip numbers and is thus independent of the energy deposit of the particle and of the range of the particle
(as long as it does not exceed the strip width).
In position sensitive detectors low energy particles ( particles escaping the detector,
conversion electrons) deliver small signals often influenced by the detector noise and nonlinearities of the used amplifiers and ADCs,
which significantly lowers the position resolution. In many cases signals are missing at all, as they are lower than the detection threshold. Another drawback is that at electron energies of around 300 keV the range in silicon becomes 300 m and thus reaches the detector resolution, which then requires to enhance the position window for correlation search.
But also one drawback of the pixeled detectors should be at least mentioned:
due to the small widths of the strips (typically 1 mm) already for a notable fraction of the implanted particles the energy
signal is split between two strips making sophisticated data analysis algorithms necessary to reconstruct the energy of the particles.
Also, the energy split between two strips also introduces some ambiguities in the determination of the position.
An illustrative example for the benefit of including the position into the correlation search is given in fig. 3. Here the spectrum obtained in an irradiation of 209Bi with 50Ti at SHIP [60] (using the same set-up as in [59]) between the beam bursts is shown in fig. 3a. Besides 258Db (9.0 – 9.4 MeV), produced in the reaction 209Bi(50Ti,n)258Db, and its decay products 254Lr (8.35 – 8.50 MeV) and 254No (8.1 MeV, EC decay daughter of 254Lr) also lines from 212g,212mAt (7.68,7.90 MeV and 211Po (7.45 MeV) are present; these activities were produced by few nucleon transfer reactions; in addition also the line of 215Po (6.78 MeV) is visible, stemming from decay of 223Ra (T1/2 = 11.43 d), produced in a preceeding experiment. In fig. 3b the spectrum of the first particles following an decay of 258Db (energy region is marked by the red lines in fig. 3a is shown. Besides the daughter products 254Lr and 254No, strong random correlations with 211Po, 215Po, 258Db, 212g,212mAt are observed; the random correlation can be significantly suppressed if in addition the occurence of both decays in the same detector strip is required, as seen in fig. 3c; the result of the position correlation analysis finally is shown in fig. 3d. Here, in addition the occurence of both events within a position difference of 0.3 mm is required. The background of decays is completely gone, and also details in the energy distribution of the events are visible; the events at (7.7 - 7.9) MeV stem from decay of 250Md ( - decay daughter of 254Lr) and those at 7.45 MeV are here from 250Fm (-decay daughter of 254No, EC - decay daughter of 250Md). The events at (8.7 - 8.8) MeV are from decay of 253g,253mLr, the decay daughters of 257g,257mDb, which was produced to a small amount in the reaction 209Bi(50Ti,2n)257Db.
4.2 4.2 Summing of -particle and Recoil - energies
Implantation of ER into a silicon detector has consquences for measuring the energies of particles.
One item concerns summing of the particle energy and the energy transferred by the particle to the
residual nucleus, which will be in the following denoted as recoil energy Erec.
The total decay energy Q (for a ground-state to ground-state transition) is given by
Q = (mmother - mdaughter - mα) c2
This energy splits in two components
Q = Eα + Erec = (1 + mα/mdaughter) Eα
Here mmother, mdaughter denote the masses of the mother and daughter nucleus‡‡‡strictly spoken, the atomic mass, not the mass of a bare
nucleus, Eα the kinetic energy of the
the particle.
Evidently the recoil energy Erec = (mα/mdaughter) Eα is stronly dependent on the mass
of the daughter nucleus and the kinetic energy of the - particle.
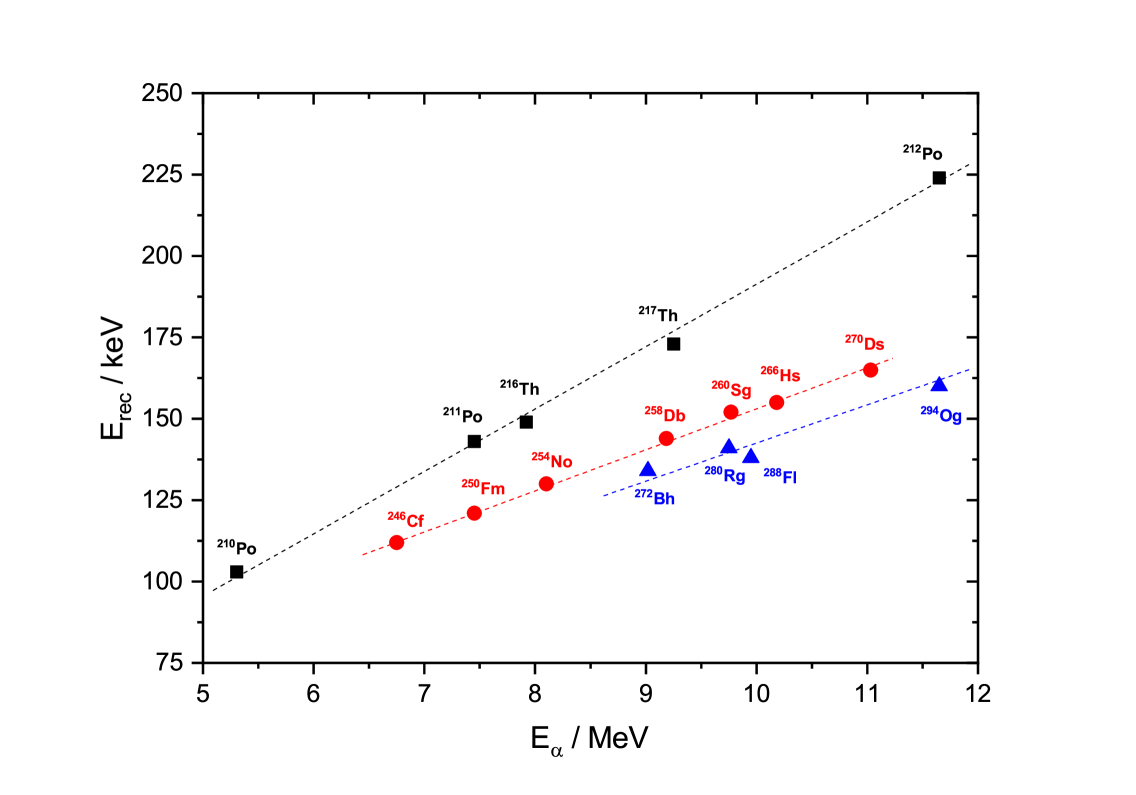
This behavior is shown in fig. 4, where for some isotopes Erec is plotted versus Eα. The black squares represent
the results for 210,211,212Po and 216,217Th, which are often produced in reactions using lead or bismuth targets by nucleon transfer or in
so called ’calibration reactions’ (reactions used to check the performance of the experimental set-up), the red dots are results for ’neutron deficient’ isotopes in the range Z = (98-110), the blue triangles, finally, results for neutron rich SHN produced so far in irradiations of actinide targets with 48Ca. Evidently the recoil energies for the polonium and thorium isotopes
are by 15-30 keV higher than for the Z = (98-110) - isotopes, while the differences between the latter and the
’neutron rich SHN’ are typically in the order of 10 keV; specifically striking is the difference of Erec = 65 keV between 212Po and 294Og, both having nearly the same - decay energy.
In practise, however, the differences are less severe:
the measured energy of the particle is not simply the sum of both contributions as due to the high ionisation density
of the heavy recoil nucleus part of the created charge carriers will recombine and thus only a fraction of them will contribute to the
hight of the detector signal, hence
Eα(measured) = Eα + aErec
with a 1, giving the fraction of the contribution of the recoil energy, which can be considered to be in the
order of a 0.3 [61]. One should, however, keep in mind, that this analysis was performed
for nuclei around A = 150. As ionization density increases for heavier nuclei (larger Z) the recombination
might be larger for SHN, thus a 0.3. Nevertheless different recoil contributions should be considered when
calibrations are performed.
Further discussion of this item is found in [59].
4.3 4.3 Summing of particle and conversion electron (CE) energies
One more problem is connected with energy summing of particles and conversion electrons (CE) in cases
where excited levels are populated decaying towards the ground state by internal conversion, leading to a shift of
the measured energies towards higher values [62].
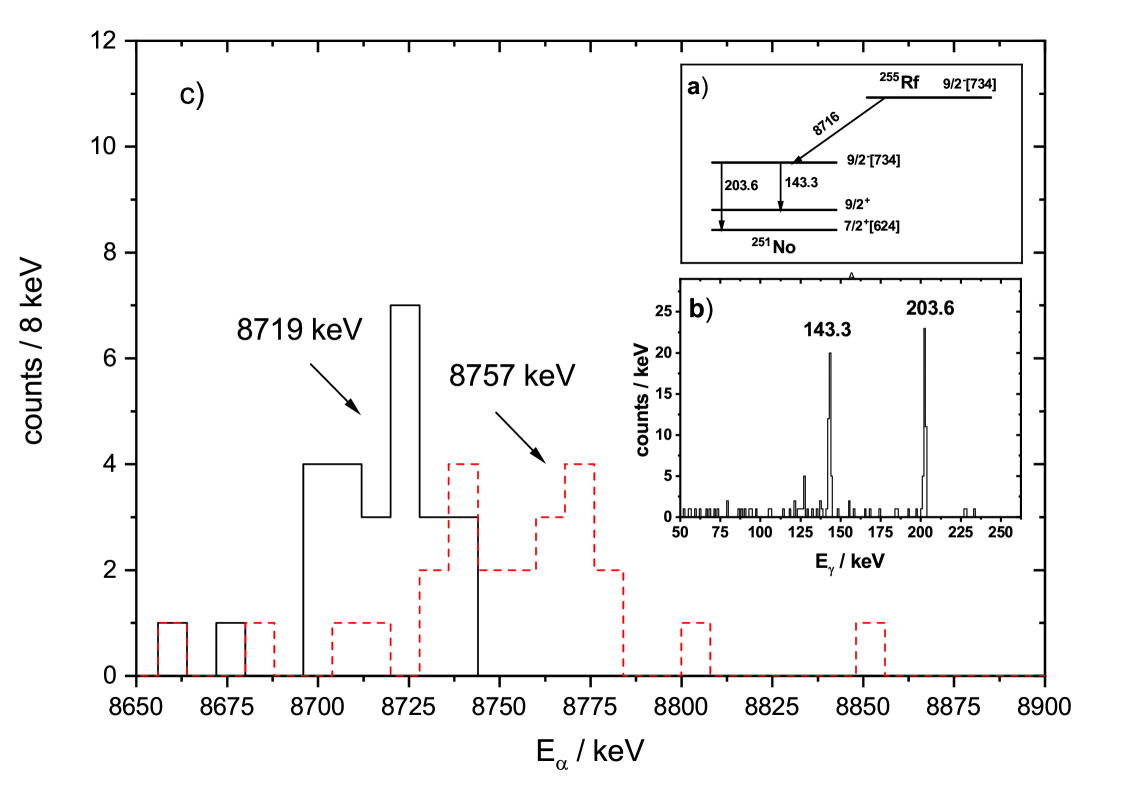
An illustrative example is shown in fig. 5 where the decay of 255Rf is presented.
The decay scheme is shown in fig. 5a; decay populates the 9/2-[734] - level in 251No, which
then decays by emission either into the 7/2+[624] ground-state (Eγ = 203.6 keV ) or
into the 9/2+ state (Eγ = 143.3 keV (fig. 5b) [63].
The M1 - transition 9/2+ 7/2+ is highly converted. In fig 5c we present the energy distributions
of particles either in coincidence with the Eγ = 203.6 keV (black line) or the
Eγ = 143.3 keV (red line). We observe a shift in the energies by E = 38 keV, which is even
larger than the CE energy (31 keV)[64], indicating that not only the CE contribute to the energy shift but also the
energy released during deexcitation of the atomic shell (e.g. Auger electrons).
4.4 4.4 particles escaping the detector
As the implantation depth into the detector is typically 10 m and thus considerably
smaller than the range of - particles in silicon (50 m at E 8 MeV) only part of them
(50 - 60 ) will be registered with full enery.
So if one observes on the basis of a small number of events, besides a ’bulk’ at a mean energy E also particles with energies
of E - E will be registered. So it is a priori not possible to state if these events represent decays into higher lying daughter
levels or if they are just particles of energy E escaping the detector with an energy E - E.
However, some arguments can be given on the basis of the probability to observe the latter events.
As an illustrative example
the spectrum of 253No [65] is given in fig. 6.
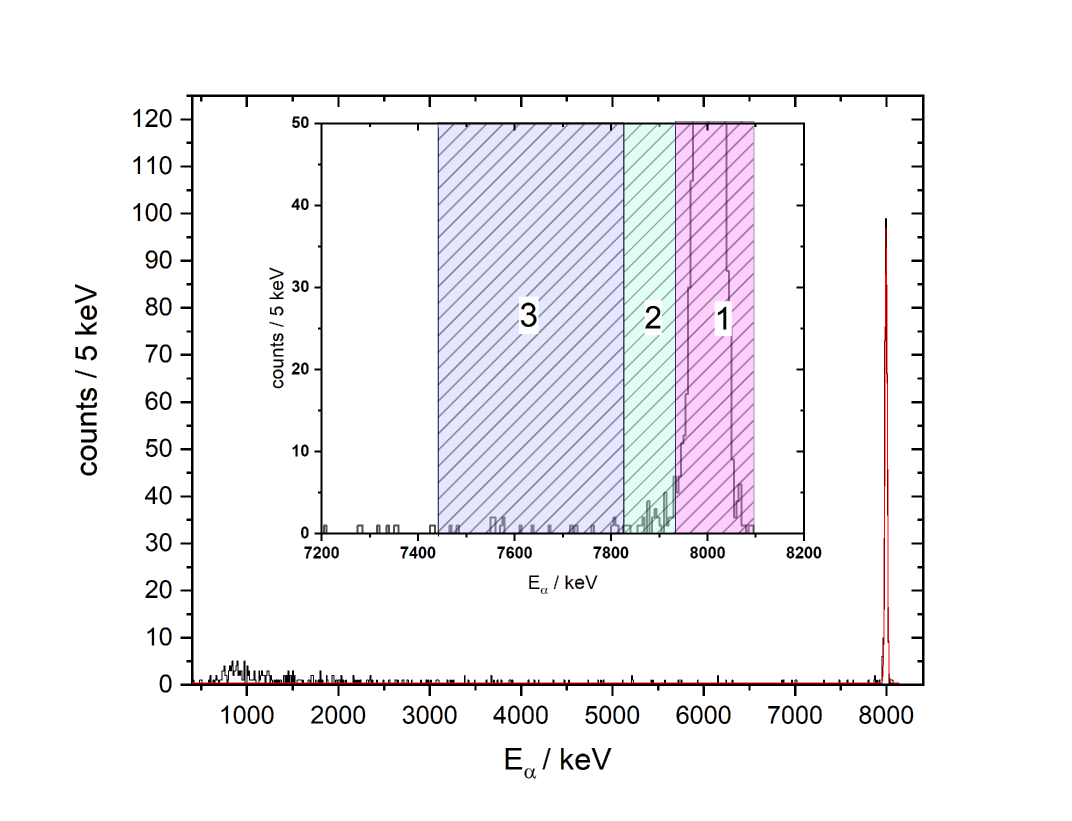
Here the decays in coincidence with the 279.5 keV line are shown, which represents the transition of the
9/2-[734] level in 249Fm populated by the decay, into 7/2+[624] ground-state. In that case one obtains a clean
spectrum of a single transition not disturbed by energy summing with CE.
Besides the ’peak’ at Eα = 8005 keV a bulk of events at E 2 MeV is shown. About
55 of the particles are registered in the peak, about 32 are found at E 2 MeV; the rest
(13) is distributed in the energy range in between. In the insert the energy range between E =(7.2-8.2) MeV
is expanded. It is clearly seen that the number of particles in the range, taken here somewhat arbitrarily
as Emean - 570 keV is small. The ’peak’ is here defined as the energy region E 7935 keV, as at this energy
the number of events (per 5 keV) has been dropped to 5 of the number in the peak maximum (region 1).
The ratio of events in the energy interval (7835,7935) keV (region 2) is about 1.2 of that in the ’peak’ (region 1),
while the ratio of events in the energy interval (7435,7835) keV (region 3) is about 0.8 .
These small numbers indicate that at low number of observed total decays, it is quite
unlikely that
events with energies some hundred keV lower than the ’bulk’ energy represent particles from the ’bulk’ leaving the detector with nearly full energy loss.
They rather stem from decays into excited daughter levels (but possibly influenced by energy summing with CE)§§§We briefly want to point
to an detector effect that may pretend lower energies. In cases where the detector has already suffered from radiation damages the charge
collection may be incomplete and so the signal might be lower than that for a ’full energy event’ even if the particles was
completely stopped in the detector..
4.5 4.5 Compatibility of energy measurements in the region of SHN
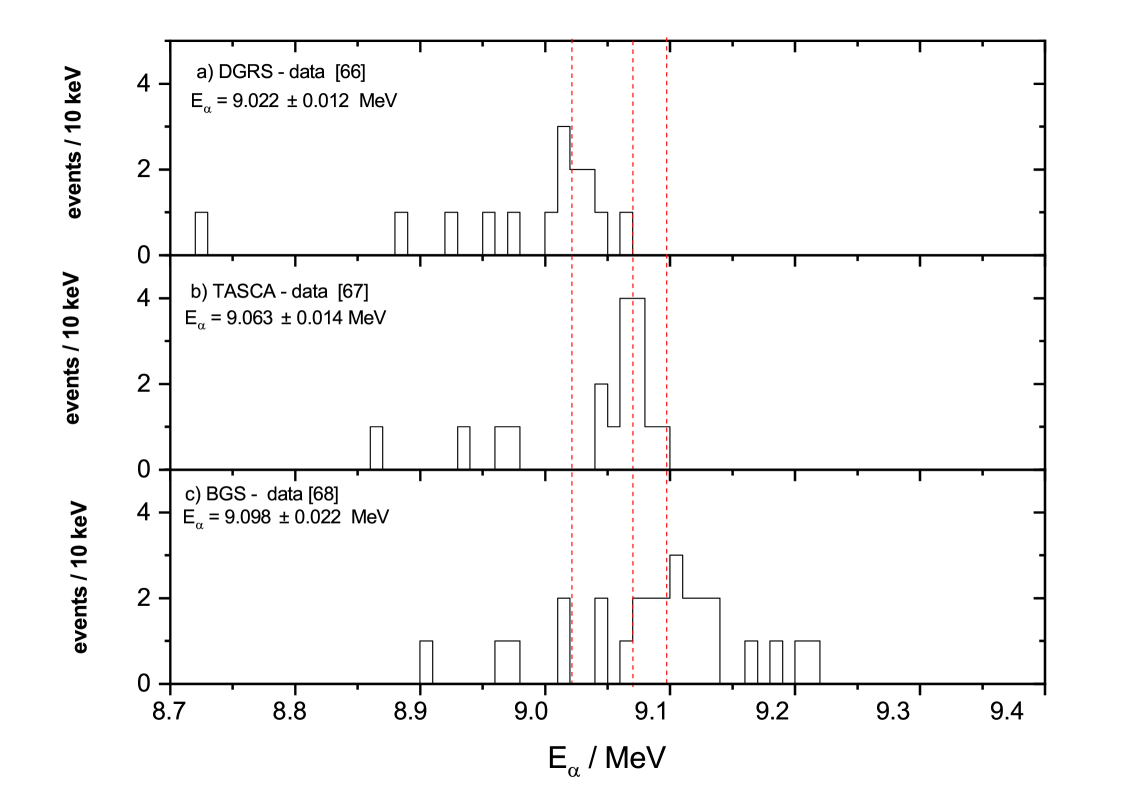
As the numbers of decays observed in specific experiments is usually quite small it seems of high interest to merge data of different experiments to enhance statistics to possibly extract details on the decay properties, e.g. fine structure in the decay. One drawback concerning this item is possible energy summing between particles and CE as discussed above; another problem is the compatibility of the decay energies measured in the different experiments and thus a consequence of calibration. This is not necessecarily a trivial problem as shown in fig. 7, where the energies obtained for 272Bh in three experiments are shown. 272Bh was produced in irradiations of 243Am with 48Ca within the decay chain of 288Mc, via 243Am(48Ca,3n)288Mc 284Nh 280Rg 276Mt 272Bh 268Db. This decay chain has been investigated so far at three different separators, DGFRS at FLNR, Dubna, Russia [66], TASCA at GSI, Darmstadt, Germany [67], and BGS at LNBL, Berkeley, USA [68]. The energy distributions of the odd-odd nuclei occuring in the decay chain of 288Mc are in general quite broad indicating decays into different daughter levels accompanied by energy summing of particles and CE. Solely for 272Bh a ’quite narrow’ line is observed. The results of the different experiments are compared in fig. 7. To avoid ambiguities due to worse energy resolution of ’stop + box’ events we restricted to events with full energy release in the ’stop’ detector. Evidently there are large discrepancies in the energies: the DGFRS experiment [66] delivers a mean value Eα(DGFRS) = 9.022 0.012 MeV, the TASCA experiment [67] Eα(TASCA) = 9.063 0.014 MeV, and the BGS experiment Eα(BGS) = 9.098 0.022 MeV, hence differences Eα(TASCA) - Eα(DGFRS) = 41 keV, Eα(BGS) - Eα(TASC) = 35 keV, Eα(BGS) - Eα(DGFRS) = 76 keV, which are by far larger than calibration uncertainties in the range of 10-20 keV, which might be expected usually. That is a very unsatisfying situation.
5 5. Discovery of elements Z = 107 (bohrium) to Z = 112 (copernicium) and their approvement by the IUPAC
The elements Z = 107 to Z = 112 where first synthesized at the velocity filter SHIP, GSI, in the period 1981 - 1996.
The corresponding isotopes where identified
after implantation into arrangements of silicon detectors by registering their decay chains. Identification was based on
decay properties ( energies, halflives) of at least one member of the decay chain, that had been either known
from literature or had been synthesized and investigated at SHIP in preceeding experiments.
The latter is the main difference to elements Z 114, where the decay chains are not connected to the region of known
and safely identified isotopes. Nevertheless, the elements Z = 107 - Z = 112 depict in some cases already the difficulties to unambiguously
identify an isotope on the basis of only a few observed decays and also the problems evaluaters in charge to approve discovery of
a new element are faced with.
In order not to overtop the banks in the following only the reports of the Tranfermium Working Group of the IUPAC and IUPAP (TWG)
(for elements bohrium to meitnerium) or the IUPAC/IUPAP Joint Working Party (JWP) (for elements darmstadtium to copernicium)
concerning the GSI new element claims are considered. Other claims on discovery of one ore more of these elements are not discussed.
5.1 5.1 Element 107 (Bohrium)
The first isotope of element 107, 262Bh, was synthesized in 1981 in the reaction 209Bi(54Cr,n)262Bh [31]. Altogether six decay chains where observed at that time. Prior to approval of the discovery by the IUPAC two more experiments were performed. The complete results are reported in [69]: two states of 262Bh decaying by emission 262gBh (T1/2 = 102 26 ms (15 decays)) and 262mBh (T1/2 = 8.0 2.1 ms (14 decays)) as well as the neighbouring isotope 261Bh (10 decays) were observed. Thus approval of the discovery of element 107 was based on a ’safe ground’, and it was stated by the TWG [70]: ’This work ([31]) is considered sufficiently convincing and was confirmed in 1989 [69].’
5.2 5.2 Element 108 (Hassium)
Compared to bohrium the data for hassium on which the discovery was approved was scarce. In the first experiment performed in 1984
[71] three decay chains of 265Hs were observed in an irradiation of 208Pb with 58Fe.
In two cases a full energy event of 265Hs was followed by an escape event of 261Sg, while in one case an escape event
of 265Hs was followed by a full energy event of 261Sg. The particle from the granddaughter 257Rf was measured
in all three cases with full energy.
In a follow-up experiment only one decay chain of the neighbouring isotope 264Hs was observed
in an irradiation of 207Pb by 58Fe [72]. The chain consisted of two escape events followed by an SF, which was
attributed to 256Rf on the basis of the decay time.
Nevertheless discovery of element 108 was approved on the basis of these data and it was stated by the TWG [70]: ’The Darmstadt work
in itself is sufficiently convincing to be accepted as a discovery.’
5.3 5.3 Element 109 (Meitnerium)
Discovery of element 109 was connected to more severe problems. In the first experiment at SHIP, performed in summer 1982, only one decay chain shown in fig. 8. was observed [73] in an irradiation of 209Bi with 58Fe.
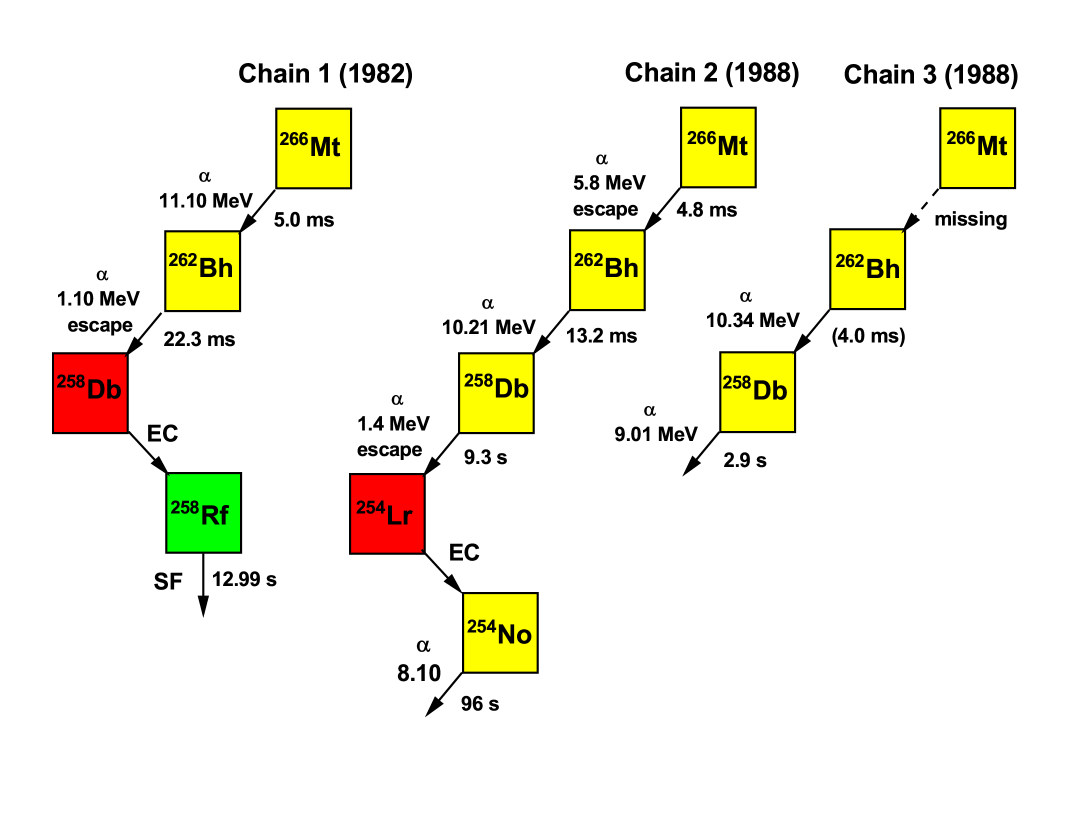
It started with an alpha - event with full energy, followed by an escape event and was terminated by an SF event. The latter was attributed to
258Rf produced by EC decay of 258Db. A thorough investigation of the data showed that the probability for the event sequence to be random
was 10-18 [74]. Among all possible ’starting points’ (energetically possible evaporation residues) 266Mt was the most likely
one [74]. In a second experiment performed early in 1988 (january 31st to february 13th) two more decay chains, also shown in fig. 8
where observed [75]; chain number 2 consisted of four events, two with full energy, and two escape events, attributed to 266Mt (first chain member)
and 258Db (third chain member); the two full energy events were attributed to 262Bh (second chain member) and 254No (forth chain member),
which was interpreted to be formed by EC decay of 254Lr. The third chain consisted of two decays, which were assigned to 262Bh and
258Db on the basis of the measured energies, while the particle from the decay of 266Mt was not observed. The non-registration of 266Mt could have different reasons:
a) 262Bh was produced directly via the reaction 209Bi(58Fe,n)262Bh. This possibility was excluded as this reaction channel
was assumed to be considerably smaller than the 1n - deexcitation channel. And indeed in a later experiment, performed after the approval of element 109
by the IUPAC, twelve more decay chains of 266Mt were observed, but no signature for an n - deexcitation channel was found [76].
b) 266Mt has a short-lived isomer decaying in-flight during separation. This interpretation seemed unlikely as in case of emission
the recoil of the particle would have kicked the residual nucleus out of its trajectory, so it would not have reached the detector placed in the focal
plane of SHIP; similary in case of decay by internal transitions one could expect that emission of Auger electrons following internal conversion would have
changed the charge state of the atom, so it would been also kicked out of its trajectory.
c) a short-lived isomer may decay within 20 s after implantation of the ER, i.e. during the dead time of the data acquisition system, and thus not be
recorded. Also for this interpretation no arguments were found in the later experiment [76].
d) the particle from the decay of 266Mt escaped with an energy loss 670 keV, which was the lower detection limit in this experiment.
This was seen as the
most reasonable case.
To summarize: the three chains presented strong evidence for having produced an isotope of element 109, but it still may be discussed if the presented
data really showed an unambiguous proof. However, the TWG did not share those concerns, leading to the assessment ’The result is convincing even though
originally only one event was observed’ and came to the conclusion ’The Darmstadt work [73] gives confidence that element 109 has been observed’
[70]’.
5.4 5.4 Element 110 (Darmstadtium)
After a couple of years of technical development, including installation of a new low energy RFQ - IH acceleration structure coupled to an ECR ion source
of the UNILAC
and construction of a new detector set-up experiments on synthesis of new elements were resumed in 1994.
The focal plane detector was surrounded by a ’box’ formed of six silicon detectors allowing to measure with a probability of
about 80 the full energy of - particles escaping the ’stop’ detector as the sum
E = E(stop) + Eresidual(box).
The first isotope of element 110, 269Ds, was synthesized 1994 in the reaction 208Pb(62Ni,n)269Ds [44]; four decay chains were observed.
In three of the four chains decays with full energy were observed down to 257Rf or 253No, respectivly.
For the forth decay chain of 269Ds only an energy loss signal was measured, while decays of 265Hs and 261Sg were
registered with full energy. Further members of the decay chain (257Rf, 253No, etc.) were not recorded. In a later
re-analysis of the data this chain could not be reproduced any more, similary to the case of decay chains
reported from irradiations of 208Pb with 86Kr at the BGS, Berkeley, and interpreted to start from an isotope of
element 118 [77, 78].
This deficiency, however, did not concern the discovery of element 110 and it was stated by the JWP of the IUPAC/IUPAP ’Element 110 has been discovered by
this collaboration’ [79].
5.5 5.5 Element 111 (Roentgenium)
The first experiment on synthesis of element 111 was performed in continuation of the element 110 discovery experiment.
In an irradiation of 209Bi with 64Ni three decay chains were observed. They were assigned to 272Rg, produced in the reaction
209Bi(64Ni,n)272Rg [80]. Two of these chains ended with decay of 260Db; for the first member, 272Rg,
only a E signal was registered. In the third chain decay was observed down to 256Lr and all particles from the decay
chain members (272Rg, 268Mt, 264Bh, 260Db, 256Lr) were registered with
’full’ energy. It should be noted that also 268Mt and 264Bh had not been observed before.
The JWP members, however, were quite cautious in that case [79]. It was remarked that the energy of 264Bh in chain 1 was quite different to
the values of chain 2 and 3 and that the energy E = 9.146 MeV of 260Db in chain 2 was in fact in-line with the literature value (given e.g. in
[81]), but was quite different to the value E = 9.200 MeV in chain 3. Further it was noted, that the time difference t(262Db - 256Lr) = 66.3 s, was considerably longer than the known half-life of 256Lr (T1/2 = 283 s [81]). So it was stated (JWP assessment): ’The results of this study are definitely of high quality but there is insufficient internal redundancy to warrant certitude at this stage. Confirmation by further results is needed to assign priority of discovery to this collaboration’ [79]. In a further experiment at SHIP three more decay chains were observed which confirmed the previous
results [82], leading to the JWP statement:’Priority of discovery of element 111 by Hofmann et al. collaboration in [80] has been confirmed
owing to the additional convincing observations in [82]’ [83].
For completeness it should be noted that the SHIP results were later confirmed in experiments performed at the GARIS separator at RIKEN, Wako (Japan), where
the same reaction was used [84], and at the BGS separator at LBNL Berkeley (USA), where, however, a different reaction, 208Pb(65Cu,n)272Rg
was applied [85].
5.6 5.6 Element 112 (Copernicium)
Concerning discovery of element 112 the situation was even more complicated. In a first irradiation of 208Pb with 70Zn performed at SHIP early in
1996 two decay chains interpreted to start from 277Cn were reported [86]. In chain 1 decays down to 261Rf, in chain 2 alpha decays down
to 257No were observed. Both chains showed severe differences in chain members (1) and (2). (In the following (n) in chains 1 and 2 will be
denoted as (n1) and (n2), respectively.)
The energies for 277Cn differed by 0.22 MeV, while the ’lifetimes’ (time differences between ER implantation and decay were comparable)
with Eα11 = 11.65 MeV, = 400 s and Eα12 = 11.45 MeV,
= 280 s.
For (2) (273Ds) the discrepancies were more severe: Eα21 = 9.73 MeV, = 170 ms and Eα22 = 11.08 MeV, = 110 s. It seemed thus likely that the decays of 273Ds (and thus also of 277Cn) occurred from different levels.
This was commented in the JWP report [79] as ’Redundancy is arguably and unfortunately confounded by the effects of isomerism. The two observed alphas
from 277112 involve different states and lead to yet two other very different decay branches in 273110. (…) The first two alpha in the chains show
no redundancy.’ It was further remarked that the energy of 261Rf in chain 2 (E = 8.52 MeV) differed by 0.24 MeV from the literature value [81].
Indeed it was later shown by other research groups [87, 88, 89] that two longlived states decaying by emission exist in 261Rf with one
state having a decay energy and a halflife of Eα = 8.510.06 MeV and T1/2 = 2.6s [89] in-line with the data from
chain 2 (Eα52 = 8.52 MeV, = 4.7 s). But this feature was not known when the TWG report [79] was written.
Consequently it was stated ’The results of this study are of characteristically high quality, but there is insufficient internal redundancy to warrant conviction
at this state. Confirmation by further experiments is needed to assign priority of discovery to this collaboration.’
One further experiment was performed at SHIP in spring 2000, where one more decay chain was observed, which resembled chain 2, but was terminated by a fission
event [82].The latter was remarkable, as the fission branch of 261Rf was estimated at that time as bsf 0.1. But also here later
experiments [87, 88, 89] established a high fission branch for the 2.6 s - activity with the most recent value
bsf = 0.820.09 [89].
Then, during preparing the manuscript [82] a ’desaster’ happed: in a re-analysis of the data from 1996 chain 1 could not be
reproduced, similary to the case of one chain in the element 110 synthesis experiment (see above) and of decay chains
reported from irradiations of 208Pb with 86Kr at the BGS, Berkeley, and interpreted to start from an isotope of
element 118 [77, 78]. It was shown that this chain had been created spuriously [82]. At least this finding could
explain the inconsistencies concerning the data for 277Cn and 273Ds in chains 1 and 2.
On this basis the JWP concluded [83]: ’In summary, though there are only two chains, and neither is completely characterized on its own merit.
Supportive, independent results on intermediates remain less then completely compelling at that stage.’
In the following years two more experiments at SHIP using the reaction 70Zn + 208Pb were performed without observing one more chain
[90], however, decay studies of 269Hs and 265Sg confirmed specifically the data for 261Rf [87], while the decay chains
of 277Cn were reproduced in an irradiation of 208Pb with 70Zn at the GARIS separator at RIKEN, Wako (Japan) [91, 92].
On this basis the JWP concluded in their report from 2009 [93]: ’The 1996 collaboration of Hofmann et al. [86] combined with the
2002 collaboration of Hofmann et al. [82] are accepted as the first evidence for synthesis of element with atomic number 112 being
supported by subsequent measurements of Morita [91, 92] and by assignment of decay properties of likely hassium imtermediates
[87, 94, 95] in the decay chain of 277112’.
6 6. Some Critical assessments of decay chains starting from elements Z112 and discussion of decay data of the chain members
The experiments on synthesis of the new elements with Z = 113 to Z = 118 reflect the extreme difficulties connected
with identification of new elements on the basis of observing their decay when only very few nuclei are produced and decay chains end
in a region where no isotopes had been identified so far or their decay properties are only known scarcely.
Nevertheless discovery of elements Z = 113 to Z = 118 has been approved by IUPAC and discovery priority
was settled [12, 13, 14], and also names have been proposed and accepted so far:
Z = 113: Nihonium (Nh)
Z = 114: Flerovium (Fl)
Z = 115: Moscovium (Mc)
Z = 116: Livermorium (Lv)
Z = 117: Tennessine (Ts)
Z = 118: Oganesson (Og)
Still there remain a couple of open questions and ambiguities concerning decay properties of several isotopes, which may have feedback
to their final assignment. In the following we will discuss some selected cases and point to open problems that need to be clarified
in further experiments.
For illustrating the following discussion an excerpt of the charts of nuclei covering
the region Z 112 and N = (165 - 178)
is shown in fig. 1.
6.1 6.1 Ambiguities in the assignment of decay chains - case of 293Lv - 291Lv
As already briefly mentioned in sect. 3, the continuous implantation of nuclei, the overlap of low energy particles
passing the separator with the - decay energies of the expected particles and efficiencies lower than 100 of detectors used
for anti-coincidence to discriminate between ’implantation of nuclei’ and ’decays in the detector’ introduces a problem of background.
It might be severe, if only very few decay chains are observed, since at a larger number of events single chains containing a member that does not fit to the rest of the data can be easily removed.
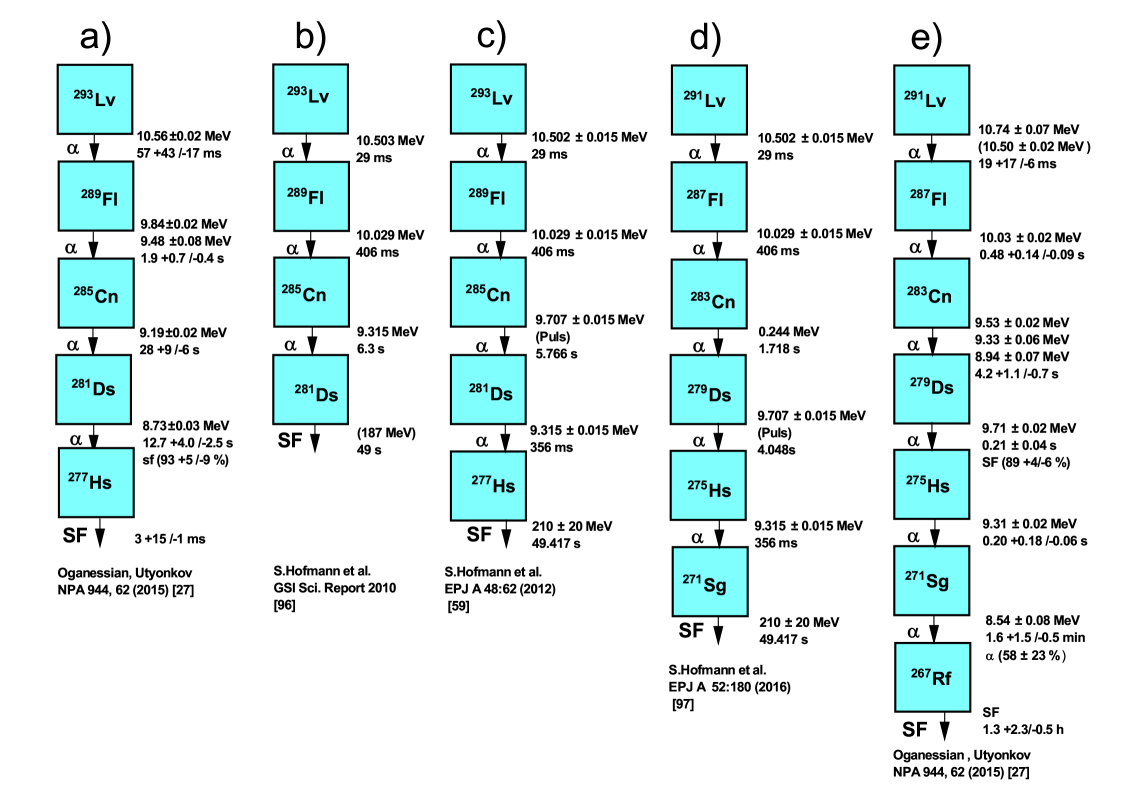
An example to illustrate those related difficulties is given in fig. 9.
The decay chain was observed at SHIP, GSI, in an irradiation of 248Cm with 48Ca at
a bombarding energy Elab = 265.4 MeV [59]. A first analysis of the data resulted in an implantation of an ER,
followed by three decays. The chain was terminated by a spontaneous fission event [96] as shown in fig. 9b.
It was tentatively assigned to the decay of 293Lv.
After some further analysis, one more decay (an event that occured during the beam-on period) placed at the position of 285Cn
was included into the chain, but still assigned tentatively to the decay of 293Lv [59] as shown in fig. 9c.
However, except for 293Lv the agreement of the decay properties ( energies, lifetimes) of the chain members with
literature data [27], shown in fig. 9a, was rather bad.
Therefore in a more recent publication [97] the assigment was revised, including a low energy signal of 0.244 MeV
registered during the beam-off period, but without position signal, into the chain at the place of 283Cn. The chain is now
assigned to the decay of 291Lv (fig. 9d). A comparison with the literature data [27], presented in fig. 9e, shows a good agreement
in decay energies for 287Fl, 279Ds, 275Hs and in ’lifetimes’ (i.e. time differences between consecutive decay events)
for 291Lv, 287Fl, 283Ds, 275Hs, 271Sg. Stringent differences, however, are obtained for the energy of
291Lv and the lifetime of 279Ds (the event observed in the beam-on period).
The differences in the decay energies of 240 keV principally can be explained by decay in different daughter levels. As in
[27] only three decays are reported, it might be that the decay of the lower energy simply was not observed in the experiments
from which the data in [27] were obtained. Such an explanation is principally reasonable.
For Eα = 10.74 MeV one obtains a theoretical decay halflife of Tα = 32 ms using the formula suggested by
Poenaru [98] using the parameter modification suggested in [99] which has been proven to reproduce decay halflives in the region of heaviest nuclei very well [100].
The value is indeed in good agreement with the reported half-life of Tα = 19 ms [27].
For Eα = 10.50 MeV one obtains Tα = 139 ms. This means, that one expects some 20 intensity for an transition
with an energy lower by about 250 keV, provided that decay hindrance factors are comparable for both transitions.
More severe, however, seems the lifetime of 279Ds, which is a factor of twenty longer than the reported half-life of
Tα = 0.210.04 s. The probability to observe an event after twenty halflives is only 10-6.
To conclude: it is certainly alluring to assign this chain to 291Lv, the assignment, however, is not unambiguous.
As long as it is not confirmed by further data, it should be taken with caution.
6.2 6.2 Ambiguities in the assignment of decay chains - case of 289,288Fl
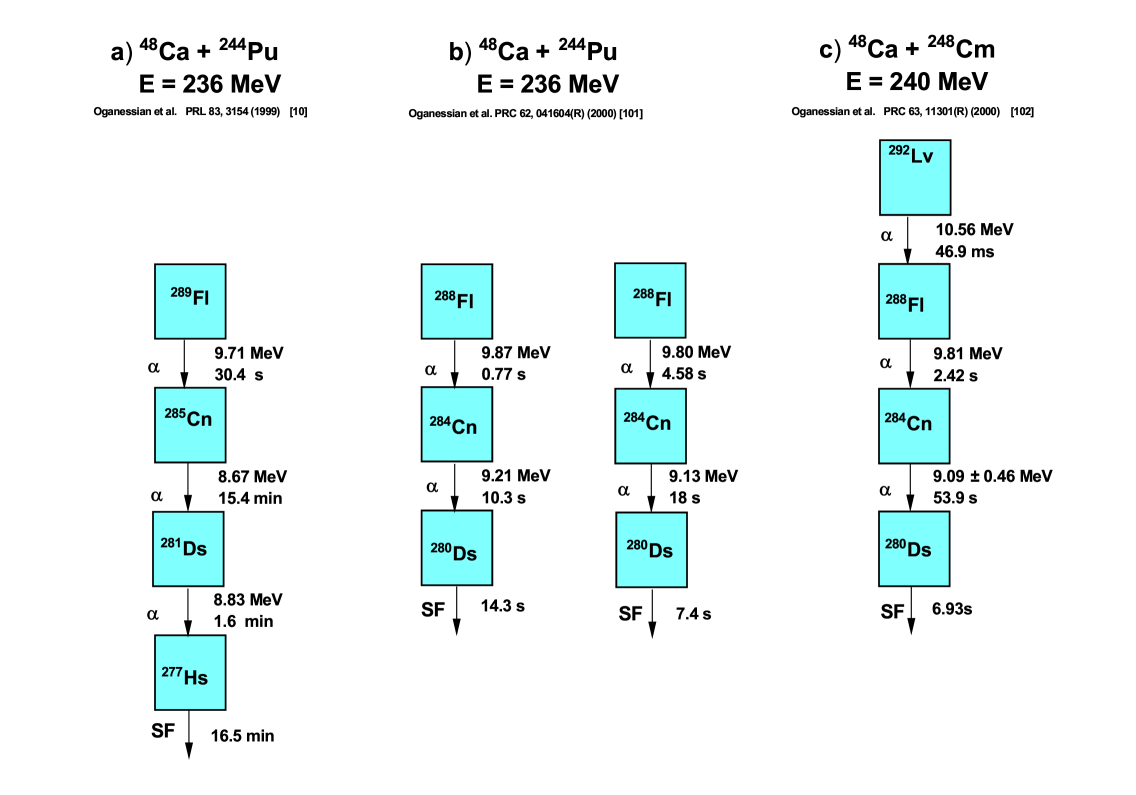
The observation of a decay chain, registered in an irradiation of 244Pu with 48Ca at Elab = 236 MeV
at the Dubna Gasfilled Separator (DGFRS), assigned to start
from 289Fl was reported by Oganessian et al. [10]. The data presented in [10] are shown in fig. 10a.
In a follow-up experiment two more decay chains with different decay chracteristics were observed and attributed to the
neighbouring isotope 288Fl [101], while in an irradiation of 248Cm with 48Ca at Elab = 240 MeV
one decay chain, shown in fig. 10c was registered [102]. Decay properties of members 2, 3 and 4 of the latter chain were
consistent with those for 288Fl, 284Ds, and 280Hs. Consequently the chain (fig. 10c) was interpreted to start from
292Lv.
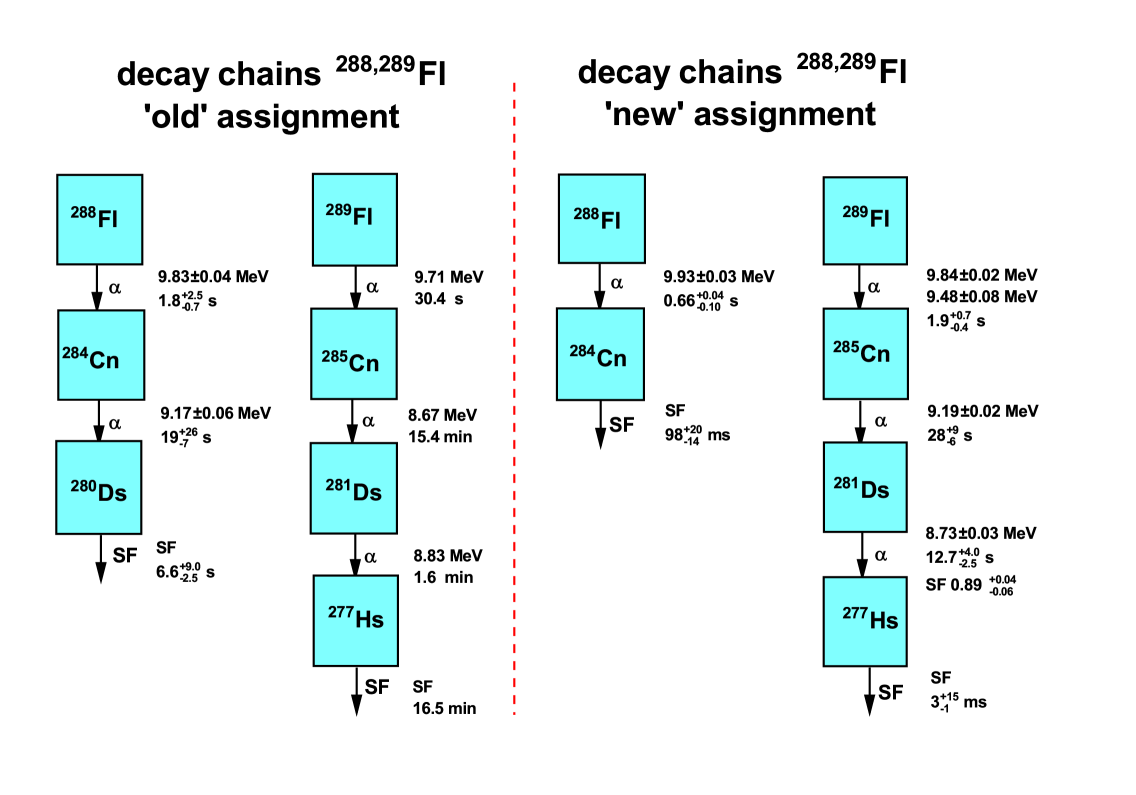
However, results from later irradiations of 244Pu with 48Ca were interpreted in a different way [103].
The activity previously attributed to 288Fl was now assigned to 289Fl, while no further events having the characteristics of the chain
originally attributed to 289Fl [10] were observed. It was now considered as a possible candidate for
290Fl [104]. But this chain was not mentioned later as a decay chain stemming from a
flerovium isotope [105]. However, a new activity, consisting of an decay of Eα = 9.950.08 MeV and
T1/2 = 0.63s followed by a fission activity of
T1/2 = 98ms was observed. It was assigned to the decay sequence
288Fl 284Ds . These ’new’ results were consistent with those obtained in later
irradiations of 244Pu with 48Ca [106] and 248Cm with 48Ca [59, 107] in other labs.
As a summary the ’old’ and new results for 288,289Fl are compared in fig. 11. The ’new’ results are taken from the recent review [27], the ’old’ results for 288Fl are the mean values from the three decays reported in [101, 102] as evaluated by the author.
It should be noticed for completeness, that Kaji et al. [107] observed also a chain consisting of three particles
terminated by a fission event. The chain was not regarded as unambiguous and so and the SF event were only tentatively
assigned to 284Cn () and 280Ds (SF). In a more recent decay study of 288Fl using the production reaction
244Pu(48Ca,4n)288Fl a small - decay branch (bα0.02) and spontaneous fission of 280Ds were
confirmed [108].
6.3 6.3 Ambiguities in the assignment of decay chains - case of 287Fl - 283Cn
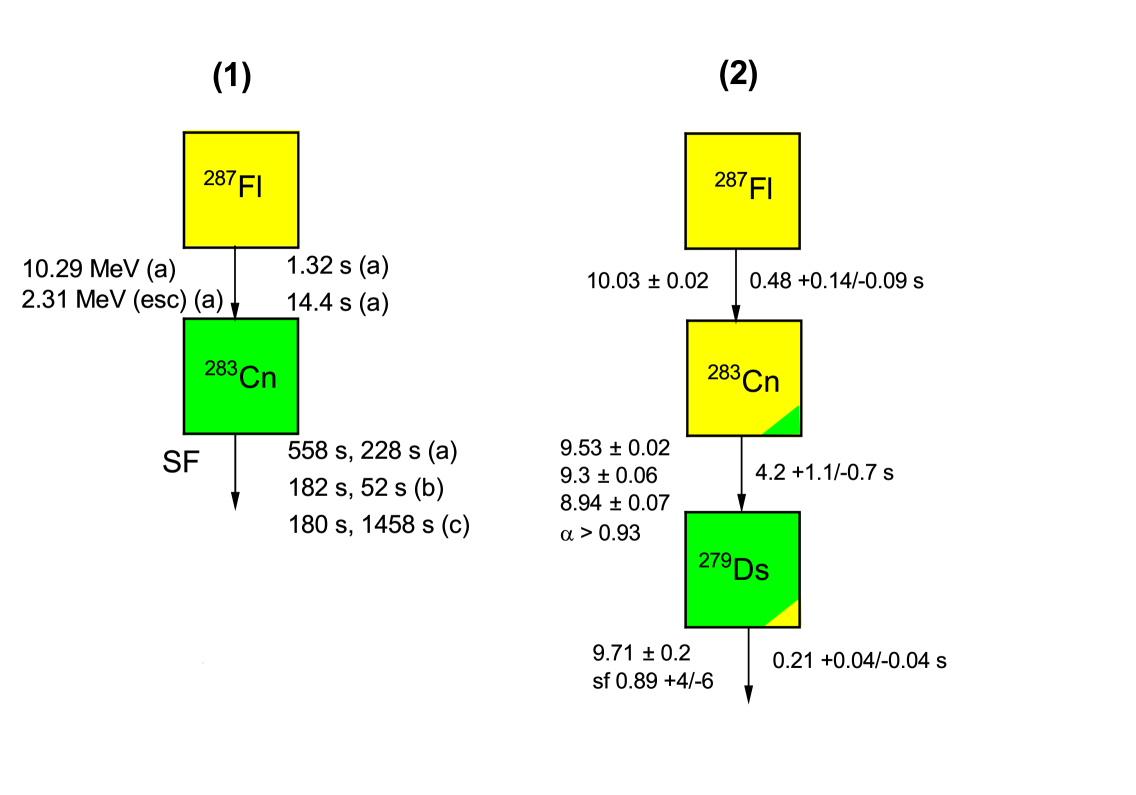
A couple of weeks after submission of [10] (recieved march 9,1999) another paper was submitted by Yu.Ts. Oganessian et al.
reporting on synthesis of a flerovium isotope with mass number A = 287 [9] (received april 19, 1999). The experiment had been performed
at the energy filter VASSILISSA at FLNR-JINR Dubna, and the decay chains (shown in fig. 12a) were observed in bombardments of 242Pu with
48Ca at Elab = 230 - 235 MeV. Two chains consisting of an - decay (in one case only an ’escape’ - particle was registered) followed by
spontaneous fission were observed. Although lifetimes of the SF events were longer than those of two SF events correlated to ER observed in a preceding irradiation of 238U with
48Ca at VASSILISSA [109] (fig. 12b) they were attributed to the same isotope, 283Cn and the decays were attributed to 287Fl. In a later
irradiation of 238U with 48Ca at the same set-up two more SF events attributed to 283Cn were observed [110] (fig. 12c). The production cross section was
= 3.0 pb in fair agreement with the value = 5.0pb obtained in the first experiment [109].
Both acitivities, however, could not be reproduced in irradiations of 238U, 242Pu with 48Ca performed at the Dubna Gas-filled Separator (DGFRS)
[111] (see fig. 12). 287Fl was here interpreted as an emitter of Eα = 10.020.06 MeV, T1/2 = 0.51 s,
283Cn as an emitter of Eα = 9.1620.06 MeV, T1/2 = 4.0 s.
Most of the decay chains were terminated by SF
of 279Ds, except in two cases: in one decay chain, observed in the irradiation of 242Pu also decay of 279Ds and 275Hs was observed and
the chain was terminated by SF of 271Sg; in one chain observed in the irradiation of 238U also decay of 271Sg was observed and the chain was terminated by SF 267Rf.
The previously observed chains at VASSILISSA were suspected to represent a less probable decay mode [104], but not listed any more in later
publications (see e.g. [105]).
The ’DGFR - results’ were in-line with data for 283Cn and 287Fl data later obtained in the reactions 238U(48Ca,3n)283Cn investigated at SHIP, GSI Darmstadt [112] and at GARIS II, RIKEN, Wako [113], as well as in the reaction 242Pu(48Ca,3n)287Fl investigated at BGS, LNBL Berkeley [114], while the
’VASSILISSA - events’ were not observed.
It should be noted, however, that due to a more sensitive detector system used in [112] than that used in [111]
in cases where the decay of 283Cn was denoted as ’missing’ in [111],
since fission was directly following decay of 287Fl, the decay of 283Cn probably was not missing,
but fission occured from 283Cn [112].
The discrepancy between the ’DGFRS results’ and the ’VASSILiSSA results’ could not be clarified so far, but it should be noted that the latter ones were not
considered any more in later reviews of SHE synthesis experiments at FLNR - JINR Dubna [27, 105].
However, the ’VASSILISSA results’ again were discussed in context with a series of events, registered in an irradiation of 248Cm with 54Cr at SHIP, which
were regarded as a signature for a decay chain starting from an isotope of element 120 [97].
It should be noted that a critical re-inspection of this sequence of events showed that it does not fulfil the physics criteria for a ’real’ decay chain and the probability to be a real chain
is p 0.01 [115]. Nevertheless the discussion in [97] can be regarded as an illustrative example of trying to match doubtful data
from different experiments. Therefore it will be treated her in some more detail.
| Isotope | Eα(SHIP) / MeV | t | Eα(VASSILISSA) / MeV | T1/2 / s |
|---|---|---|---|---|
| (299120) | 13.140.030 | 5.4 s* | ||
| (295Og) | 11.8140.040 | 261.069 ms | ||
| (291Lv) | 10.6980.030 | 18.378 ms | ||
| (287Fl) | 0.353 (10.14)** | 20.1 s | 10.290.02 | 5.5 s |
| (283Cn | SF | 701 s | SF | 308 s |
* time difference to the closed possible evaporation residue
** energy calculated from t = 20.1 s for a hindrance factor HF = 104 [97].

The data are shown in table 1. Evidently the events and ’SF’ would represent 287Fl and 283Cn if the chain starts at 299120.
is recorded as an particle escaping the detector, releasing only an energy loss of E = 0.353 MeV in it. Using the measured lifetime (20 s)
and a hindrance factor HF = 104, as derived from the full energy event (10.29 MeV) attributed to 287Fl in [9], the authors calculated a full decay energy
for of E = 10.14 MeV. Using the same procedure they obtained a full energy E = 10.19 MeV for the E = 2.31 MeV - ’escape’ event in [9].
The time differences T( - ) and T( -SF) resulted
in lifetimes () = 20 s
(T1/2 = 14 s) and (SF) = 12 min
(T1/2 = 500 s) [97] and thus were inline with the ’VASSILISSA - data’ for 287Fl (Eα = 10.290.02 MeV, T1/2 = 5.5s)
and 283Cn (T1/2 = 308s).
This finding was seen as a ’mutual support’ of the data strengthen the (tentative) assignments of the chains in [9, 97], although the authors in [97]
could not give a reasonable explanation, why these data were only seen in the VASSILISSA experiment and could not be reproduced in other laboratories. As it was shown in
[115] that the decay chain in [97] represents just a sequence of background events, it becomes clear, that blinkered data analysis may lead to
correlations between background events even if they are obtained in different experiments.
6.4 6.5 Alpha decay chain of N-Z = 59 nuclei
Within the so far assigned superheavy nuclei, the decay properties of the N-Z = 59 nuclei are of specific importance and
interest, as the acceptance of discovery of elements Z = 117 (tenessine) and Z = 115 (moscovium) is based on them.
The heaviest known nucleus of that chain, 293Ts, was produced by the reaction 249Bk(48Ca,4n)293Ts
[116, 117, 118, 119, 120, 121]. A second entry point into this chain is 289Mc produced in the reaction
243Am(48Ca,2n)289Mc [66, 122, 123]. It was stated in [116] ’decay energies and halflives of
the nuclei 289115 285113 281Rg decay chains observed in the 243Am + 48Ca reaction
agree within the statistical uncertainties with the decay properties of the daughter nucleus of the 293117 nucleus produced in the 249Bk(48Ca, 4n)293117 reaction (10 events) […]. Such agreement provides indirect identification and consistency checks via cross - bombardment production of the same nuclei in different fusion reactions of 243Am and 249Bk targets with 48Ca projectiles’.
The fourth IUPAC/IUPAP Joint Working Party (JWP) on the priority of claims to the discovery of the new elements Z = 113, 115 and 117 followed that statement and regarded it as a central issue to have met the criteria for the elements Z = 115 and Z = 117 using the following phrasing [13]:
a) Element 115: ’JWP ASSESSMENT: The 2010 […] jointly with the 2013 […] collaborations of Oganessian et al. have met the Criteria for discovery of the element with the atomic number Z = 115 in as much as the reproducibility of the alpha chain energies and lifetimes of 289115 in a cross reaction comparison is very convincing.’
b) Element 117: ’JWP ASSESSMENT: A convincing case in cross reaction producing 289115 and 285113 from both 48Ca + 249Bk and 243Am is demonstrated in the top of the precious table. Thus, the 2010 […], 2012 […] and 2013 […] jointly with the 2013 […] collaborations of Oganessian et al. have met the criteria for discovery of the elements with atomic numbers Z = 115 and Z = 117.’
This assessment was critizised and a different interpretation of the results was suggested [124]. This issue will be illuminated in the
following discussion. A final solution of the problem, however, cannot be presented on the basis of the available data.
The so far published decay data for the members of the N-Z = 59 chain [27] are summarized in table 2. It should be noted, however,
that they are based solely on the results from the DGFRS - experiments. A complete list of the decay data published so far
for the N-Z = 59 chain members 293Ts, 289Mc, 285Nh and 281Rg are given in table 3.
Altogether eighteen decay chains assigned to start from 293Ts are reported so far, sixteen from experiments at the DGFRS (Dubna) [116, 117, 119] and two from an experiment at TASCA (GSI) [121]. Evidently only one of the TASCA chains was complete, in the second one the first two members (293Ts, 289Mc) were missing. Eleven chains starting
from 289Mc were reported, four from experiments performed at the DGFRS [66], seven from a TASCA experiment
[123]. Also included in table 3 are three events observed in an irradiation of 243Am with 48Ca at the BGS, Berkeley [68], although they were not explicitly assigned to 289Mc.
At first glance three items are striking:
a) four of the decay chains interpreted to start from 289Mc consist of an - sf correlation, i.e. sf decay of 285Nh, while in none of the eighteen chains starting from 293Ts fission of 285Nh was observed;
b) in chain no. D4 of [66] 285Nh has an - decay energy more 0.2 MeV higher than that of all other decays where the particle was registered with full energy (23 cases), which all had values Eα 10 MeV.
c) decay of 281Rg was only observed in decay chains starting from 293Ts.
To obtain more detailed information on the decay properties of the isotopes assigned to the N-Z = 59 chain
a closer inspection of the data listed in table 3 was performed, specifically the results from the ’entry’ into the chain
at 293Ts (reaction 48Ca + 249Bk) and ’entry’ into the chain at 289Mc (reaction 48Ca + 243Am)
were compared.
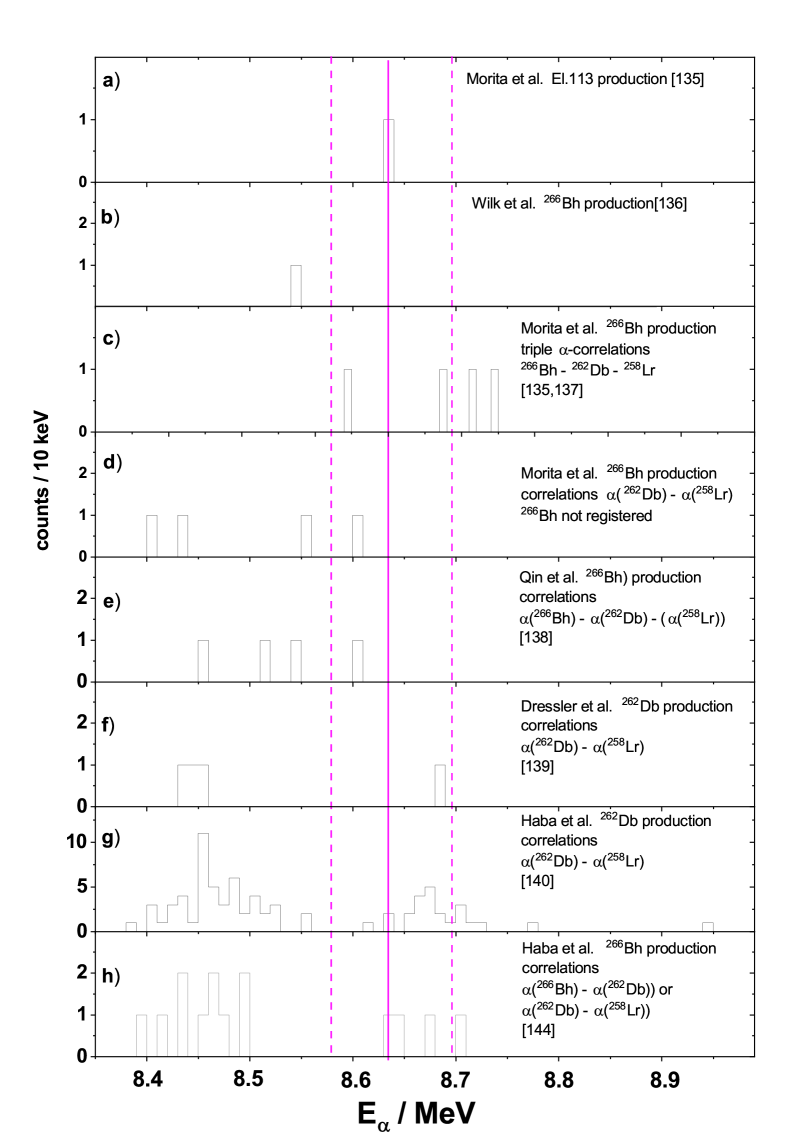
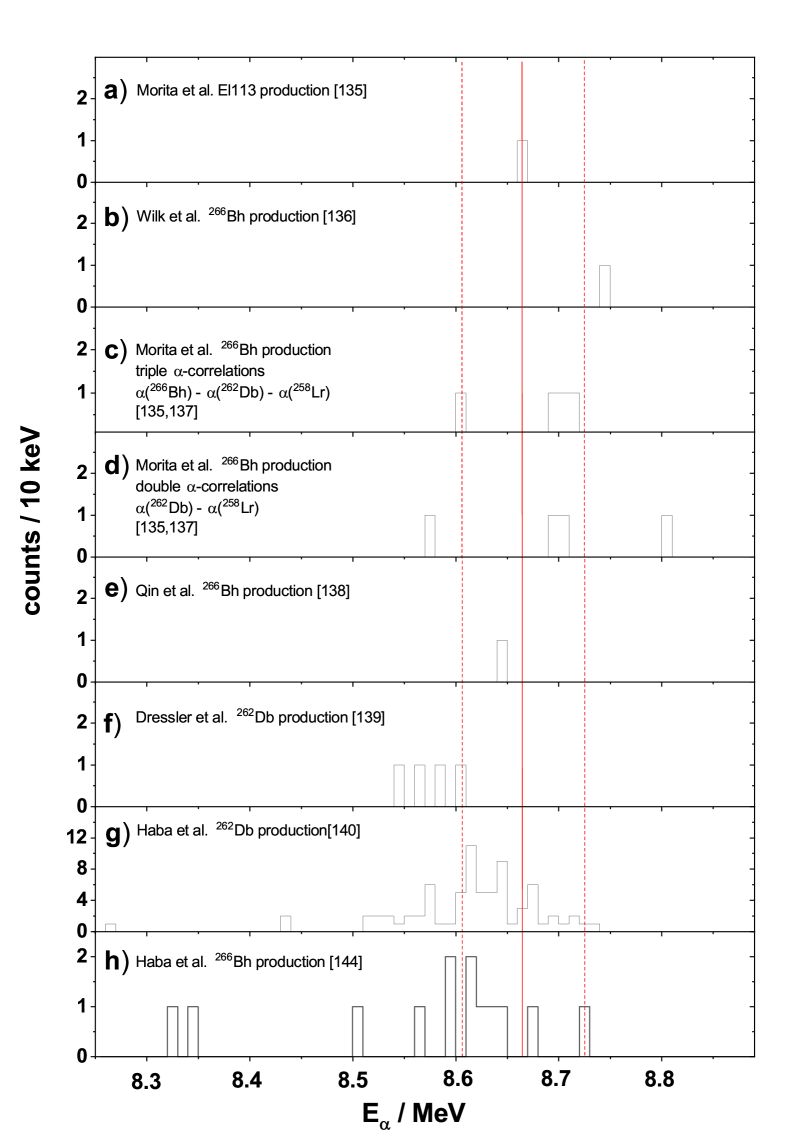
The resulting spectra are shown in fig. 13. Before starting a detailed discussion
it seems, however, necessary to stress some items that could cause confusion.
First, as discussed in sect. 4.4 (individual) energies measured in the experiments performed at the
different laboratories (DGFRS Dubna, TASCA Darmstadt, BGS Berkeley) vary considerably, eventually due to the
calibration procedures applied. Differences E = 76 keV were found between the DGFRS and BGS results,
and E = 41 keV between the DGFRS and TASCA results for 272Bh; as 90 of the data in Table 3
are from DGFRS or TASCA an uncertainty of 50 keV in the absolute value may be considered. As will be shown, the
energy differences from the different production mechanisms are munch larger and thus cannot be attributed to
calibration discrepancies.
Part of the energies were obtained as sum events from ’stop’ and ’box’ detector, thus suffering from worse
accuracy due to worse energy resolution. A few decays (three events) from the DGFRS experiments were registered as ’box - only’ events
(i.e. the particle escaped the ’stop’ detector with an energy loss below the registration threshold).
That means, the measured energies are too low by a few hundred keV. Due to the low number of these events also
this feature cannot be
the reason for the differences in the energy distribtions.
In the considered reaction on direct production of 289Mc also 288Mc is produced; the assigment to 289Mc
was based on the fact, that the properties of the decay chains did not fit to the decay chain of 288Mc.
In principle a production of 287Mc by the reaction 243Am(48Ca,4n)287Mc can also not be ruled out.
However, the properties of the decay chains attributed to 289Mc are not in-line with the decay proprties of 287Mc
and its daughter products (see e.g. [27]).
| Isotope | Decay mode | Eα / MeV | half-life |
|---|---|---|---|
| 293Ts | 10.60-11.20 | 22 ms | |
| 289Mc | 10.15-10.54 | 330 ms | |
| 285Nh | 9.47-10.18 | 4.2 s | |
| 281Rg | (0.12, SF (0.88) | 9.280.05 | 17 s |
| 277Mt | SF | 5 ms |
| Ref. | 293Ts | 289Mc | 285Nh | 281Rg | ||||
| Eα/MeV | t/ms | Eα/MeV | t/s | Eα/MeV | t/s | Eα/MeV | t/s | |
| [119] | 10.99 | 17.01 | missing | 9.72 | (16.17) | SF | 40.19 | |
| [119] | 11.14 | 7.89 | missing | 9.52** | (2.23) | SF | 4.25 | |
| [119] | 11.08* | 4.60 | 10.34 | 0.0175 | 9.71** | 1.17 | SF | 12.3 |
| [119] | 10.91 | 53.0 | 10.25 | 0.5118 | 9.79 | 0.238 | SF | 31.66 |
| [119] | 11.00 | 20.24 | 10.27 | 0.4244 | 9.48 | 13.49 | SF | 76.56 |
| [117] | 10.900.10* | 7.525 | 10.370.28** | 0.2665 | 9.8570.040 | 1.5155 | SF | 9.4192 |
| [117] | 11.1420.065 | 3.305 | 10.3100.065 | 0.1819 | missing | SF | (7.4538) | |
| [117] | 10.1140.089* | 153.948 | missing | 9.6310.067 | (19.0456) | SF | 1.4809 | |
| [117] | 10.9140.068 | 10.547 | 10.1980.068 | 1.4348 | 9.360.3** | 1.3153 | SF | 103.406 |
| [117] | 10.5980.049 | 109.878 | 10.2170.049 | 0.1510 | 9.6830.049 | 1.5155 | SF | 42.1349 |
| [116] | 10.9690.068 | 0.043 | 10.600.33** | 0.0136 | 9.9020.068 | 0.421 | SF | 15.0551 |
| [116] | 11.1830.048 | 2.553 | 10.3640.048 | 0.9572 | 9.8450.048 | 1.3712 | SF | 4.751 |
| [116] | 11.2030.070 | 8.173 | 10.2790.070 | 0.0565 | 9.8670.070 | 4.213 | 9.360.30 | 3.642 |
| [116] | 11.0590.050 | 7.525 | 10.3620.050 | 0.0161 | 9.7580.108 | 0.2589 | 9.2800.050 | 2.9249 |
| [116] | missing | 10.1450.066 | (0.0852) | 9.4710.066 | 0.2456 | SF | 21.8372 | |
| [116] | 10.1900.070 | 36.424 | missing | missing | SF | (4.488) | ||
| [121] | 9.700.08 | 8.65 | 10.000.03 | 0.07698 | (2.74) | 0.97 | 9.340.08 | 1.44 |
| [121] | missing | missing | 9.970.08 | 0.49 | 9.310.08 | 2.57 | ||
| [123] | 10.510.01 | 0.227 | SF | 0.378 | ||||
| [123] | (1.450.01) | 0.0645 | SF | 0.366 | ||||
| [123] | 10.540.04 | 0.261 | 9.950.05 | 1.15 | SF | 0.343 | ||
| [123] | 10.340.01 | 1.46 | 9.890.01 | 0.0262 | SF | 0.432 | ||
| [123] | 10.490.04 | 0.345 | 9.970.01 | 0.369 | SF | 13.4 | ||
| [123] | 10.530.01 | 0.210 | 9.890.05 | 1.05 | SF | 8.27 | ||
| [123] | (0.5410.03) | 0.815 | (3.120.01) | 2.33 | SF | 2.89 | ||
| [66] | 10.3770.062 | 0.2562 | 9.8860.062 | 1.4027 | SF | 1.977 | ||
| [66] | 10.5400.123 | 0.0661 | 9.9160.072 | 1.55 | SF | 2.364 | ||
| [66] | 10.3730.050 | 2.3507 | 9.5790.005 | 22.5822 | SF | 60.185 | ||
| [66] | 10.2920.170*(D4) | 0.0536 | 10.1780.055 | 0.4671 | SF | 0.0908 | ||
| [68] | 10.490.05 | 0.214 | 9.820.02 | 1.54 | (SF)*** | 7.57 | ||
| [68] | 10.490.02 | 0.0591 | SF | 0.824 | ||||
| [68] | 10.220.02 | 0.0455 | SF | 0.142 |
| Isotope | E/alpha / MeV | T1/2 / s | correlation |
|---|---|---|---|
| 289Mc | 10.510.02 | 0.13 | corr. to 285Nh (9.8 - 10.0 MeV) |
| 10.49 - 10.55 | |||
| 289Mc | 10.20 - 10.40 | 0.42 | corr. to 285Nh (9.8 - 10.0 MeV) |
| 289Mc | 10.20 - 10.40 | 0.44 | corr. to 285Nh (9.3 - 9.8 MeV) |
| 285Nh | 9.8 - 10.0 | 0.70 | corr. to 289Mc (10.49 - 10.55 MeV) |
| 285Nh | 9.8 - 10.0 | 0.70 | corr. to 289Mc (10.2 - 10.4 MeV) |
| 285Nh | 9.97, 9.87, 9.76 | 1.02 | corr. to 281Rg decay (9.320.04) |
| 285Nh | 9.3 - 9.8 | 5.69 | corr. to 289Mc (10.2 - 10.4 MeV) |
| 281Rg | SF | 5.5 | corr. to 285Nh (9.8 - 10.0 MeV) and/or |
| corr. to 289Mc (10.49 - 10.55 MeV) | |||
| 281Rg | SF | 6.0 | corr. to 285Nh (9.8 - 10.0 MeV) and/or |
| corr. to 289Mc (10.2 - 10.4 MeV) | |||
| 281Rg | SF | 31.6 | corr. to 285Nh (9.3 - 9.8 MeV) and/or |
| corr. to 289Mc (10.2 - 10.4 MeV) | |||
| 281Rg | decays | 1.8 |
As seen from fig. 13 the energy spectra of 289Mc (figs. 13a,b) and 285Nh (fig. 13c,d) exhibit significant differences for the different production mechanisms. In the production by decay of 293Ts nearly all 289Mc
events (in 11 of 12 cases) have energies Eα 10.4 MeV, while in the direct production seven of twelve events
are concentrated in the energy range Eα = (10.49-10.55) MeV. Also halflives are different; for the group at
Eα 10.4 MeV one abtains T1/2 = 0.39 s, for the group at
Eα 10.4 MeV one abtains T1/2 = 0.11 s. An analogue situation is found for 285Nh;
about two third (10 of 15 cases) of the events from chains starting at 293Ts have energies Eα 9.8 MeV, while for decays within the chains starting at 289Mc only one of nine events is located in this energy interval.
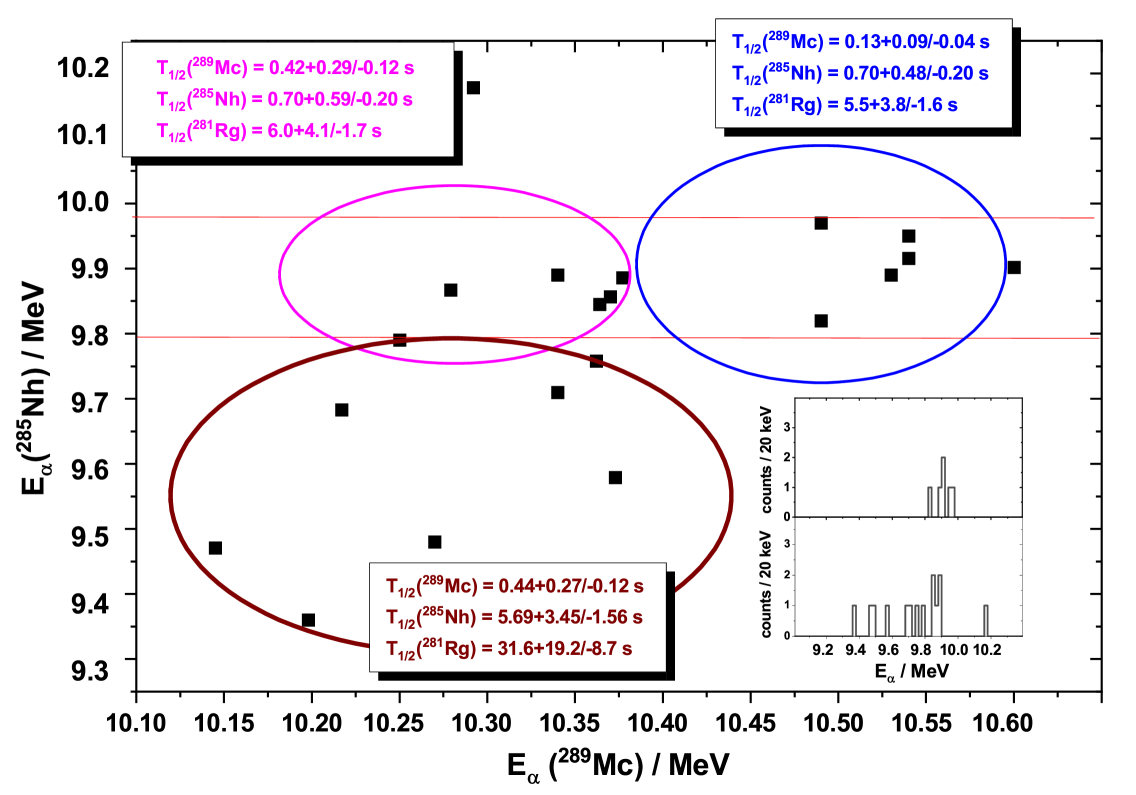
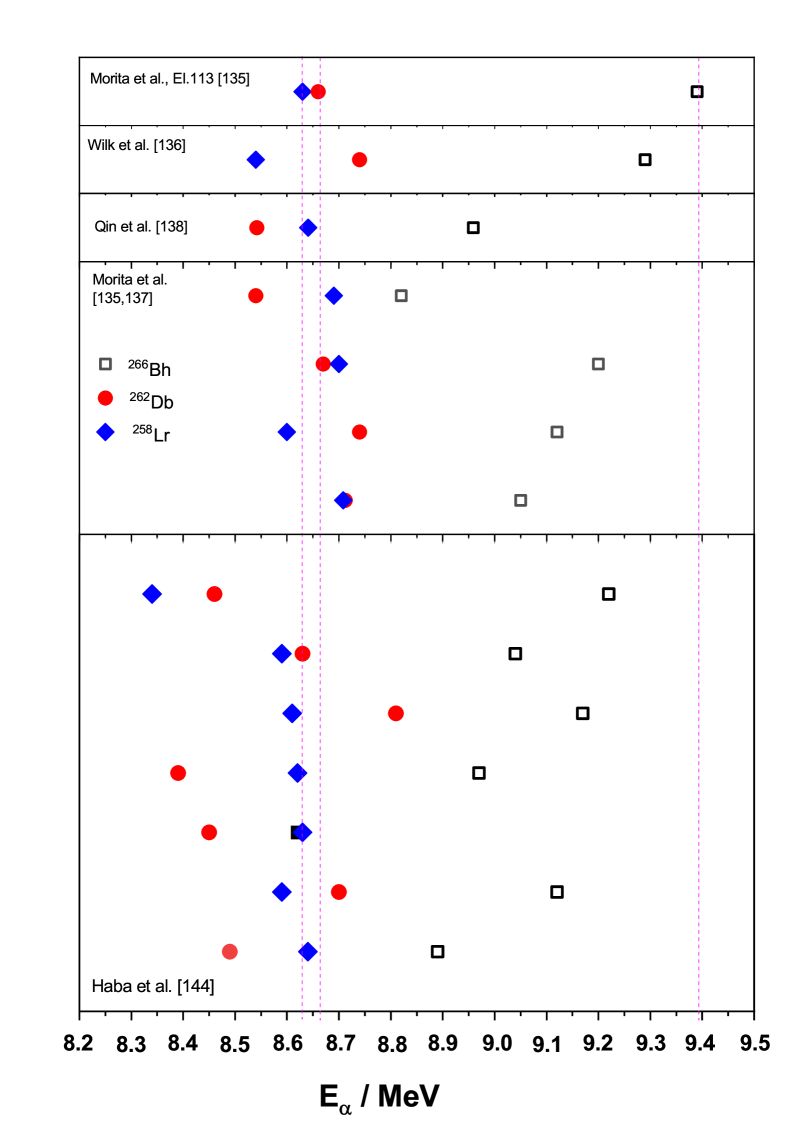
This behavior is also evident in the - correlation spectrum (fig. 14); the Eα 10.4 MeV
component of 289Mc is exclusively correlated to 285Nh events in the energy interval Eα = (9.8-10.0) MeV,
while for 289Mc of Eα 10.4 MeV only about half of the events are correlated
to 285Nh decays in that energy interval. But as seen in the insert of fig. 14 the energy distributions are not the same.
The 285Nh decays correlated to 289Mc at Eα 10.4 MeV (upper figure) have somewhat higher energies
of E(mean) = 9.910.05 MeV than those correlated to 289Mc at Eα 10.4 MeV (lower figure),
which have E(mean) = 9.860.04 MeV.
All these differences indicate that in the direct production a 289Mc component (it also could be a different isotope)
having an energy Eα = 10.530.04 MeV and a hallife of T1/2 = 0.11 s is produced
which is not present in the decay chain of 293Ts, i.e. eventually an isomeric state is populated by deexcitation of the compound nucleus in ’direct’ production reaction, which is not populated by decay of 293Ts. That would be nothing surprising,
as a couple of such examples are known in the transfermium region, e.g. 251No, 257Rf.
The assumption of an isomeric state in 289Mc does not vitiate the JWG assassment, but it clearly shows, how fragile
such conclusions may be on the basis of very low statistics.
So we have to face the following situation considerating all decays listed in table 3:
-
•
Within the production 289Mc via decay of 293Ts the particles of 289Mc are located in an energy interval Eα = (10.2 - 10.4) MeV; the resulting half-life is T1/2 = 0.28 s;
-
•
Within the production of 289Mc ’directly’ via the reaction 243Am(48Ca,2n)289Mc we observe two components in the energies: one at Eα = (10.2 - 10.4) MeV with a half-life of T1/2 = 0.71 s; and one at Eα = (10.49 - 10.55) MeV with a half-life of T1/2 = 0.12 s;
-
•
The 285Nh events from the production via 293Ts 289Mc 285Nh are spread over an energy range Eα = (9.35 - 10.0) MeV and exhibit a half-life T1/2(285Nh) = 2.44 s;
-
•
The 285Nh events from the ’direct production’ of 289Mc via 289Mc 285Nh are in the an energy range Eα = (9.8 - 10.0) MeV (except the two events at 9.58 MeV and 10.18 MeV ) and exhibit a half-life T1/2(285Nh) = 0.76 s;
-
•
Taking into account in addition the - - correlations 289Mc 285Nh, we tentatively can distinguish three groups
-
1.
289Mc (Eα = (10.49-10.55) MeV) 285Nh (Eα = (9.8-10.0) MeV), with T1/2(289Mc) = 0.13 s and T1/2(285Nh) = 0.70 s; the fission events terminating the decay chain have a half-life T1/2(281Rg) = 5.5 s;
-
2.
289Mc (Eα = (10.2 - 10.4) MeV) 285Nh (Eα = (9.8-10.0) MeV), with T1/2(289Mc) = 0.42 s and T1/2(285Nh) = 0.70 s; the fission events terminating the decay chain have a half-life T1/2(281Rg) = 6.0 s;
-
3.
289Mc (Eα = (10.15 - 10.4) MeV) 285Nh (Eα = (9.35 - 9.8)MeV), with T1/2(289Mc) = 0.44 s and T1/2(285Nh) = 5.69 s; the fission events terminating the decay chain have a half-life T1/2(281Rg) = 31.6 s.
-
1.
Under these circumstances we tentatively can distinguish the following decay chains.
-
•
289Mc (Eα = (10.4 - 10.6) MeV, T1/2 = 0.13 s) 285Nh (Eα = (9.8 - 10.0 )MeV, T1/2 = 0.70 s) 281Rg (SF, T1/2 = 5.5 s);
-
•
289Mc (Eα = (10.2 - 10.4) MeV, T1/2 = 0.42 s) 285Nh (Eα = (9.8 - 10.0 )MeV, T1/2 = 0.70 s) 281Rg (SF, T1/2 = 6.0 s);
-
•
289Mc (Eα = (10.2 - 10.4) MeV, T1/2 = 0.44 s) 285Nh (Eα = (9.35-9.8) MeV, T1/2 = 5.69 s) 281Rg (SF, T1/2 = 31.6 s);
This at first glance somewhat puzzling seeming decay pattern can qualitatively explained by existence
of low lying long lived isomeric states in 289Mc, 285Nh and 281Rg decaying by emission or
spontaneous fission. The existence of such states is due to existence of Nilsson states with low and high spins placed closely
at low excitation energies; the decay by internal transitions of such states is hindered by large spin differences and thus lifetimes become
long and decay can compete with internal transitions. That is a well known phenomena in the transfermium regions.
In direct production both states are usually populated; in production by decay the population of the states
depend on the decay of the mother nucleus. If there are two longlived isomeric states in the mother nucleus, also two longlived
states in the daughter nucleus may populated, see e.g. decay of 257Db 253Lr [125]; if there is only one
emitting state populated by the deexcitation process two cases are possible; either only one state in the daughter nucleus is populated
as e.g. in the decay 261Sg 257Rf [126], or both long-lived states in the daughter nucleus may be
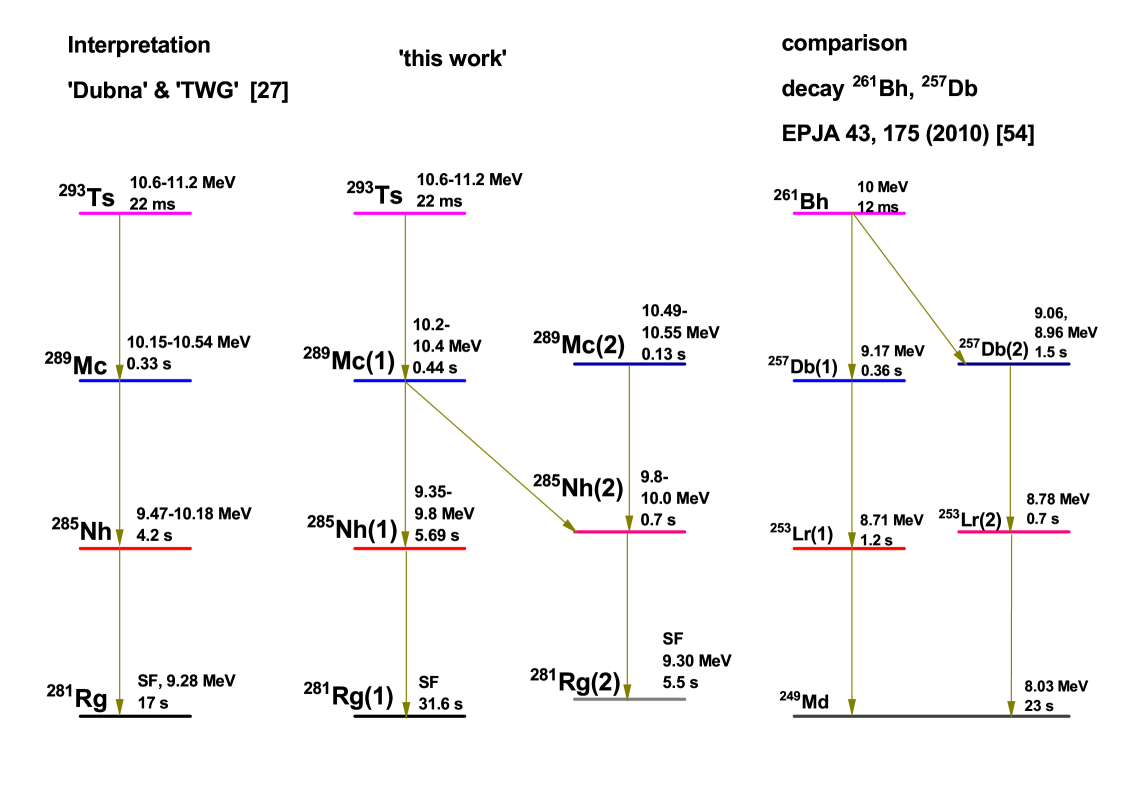
populated, as known for 261Bh 257Db [54].
Under this circumstances the puzzling behavior can be understood in the following way:
decay of 293Ts populates one state 289Mc(1) (10.2-10.4 MeV), while direct production populates two states
289Mc(1) and 289Mc(2) (10.4-10.6 MeV); 289Mc(2) decays exclusively into one state 285Nh(2)(9.8-10.0 MeV), which then
decays into 281Rg(2) which undergoes fission and decay. 289Mc(1) on the other side partly populates 285Nh(2) and 285Nh(1) (9.35-9.8 MeV) which then decays into 281Rg(1) which undergoes probably nearly exclusively spontaneous fission.
The resulting tentative decay scheme is shown in fig. 15.
In addition there might be other contributions, e.g.
the chain marked as D4 in Table 3, which does not fit to the other ones.
Also the very short chains in Table 3 consiting of SF seemingly may have a different origins
The halflives of the events, T1/2() = 0.069 s, and of the fission events.
and T1/2(SF) = 0.3 are lower than the values for 289Mc(2) and 285Nh(2),
but considering the large uncertainties they are not in disagreement. So they could indicate a fission branch of
285Nh in the order of bSF0.4. We remark here also the short half-life of
T1/2 = 1.8s of
the events assigned to 281Rg which is considerably shorter than the half-life of the fission events. Despite this fact we tentatively
assign them to 281Rg(1).
The joint analysis of the data presented for the decay chains interpreted to start either from 293Ts or from
289Mc seem to shed some light into the ’puzzeling’ decay data reported so far and suggests a solution. It should be noted,
however, the conclusions drawn here must be confirmed by more sensitive measurements before they can be finally
accepted.
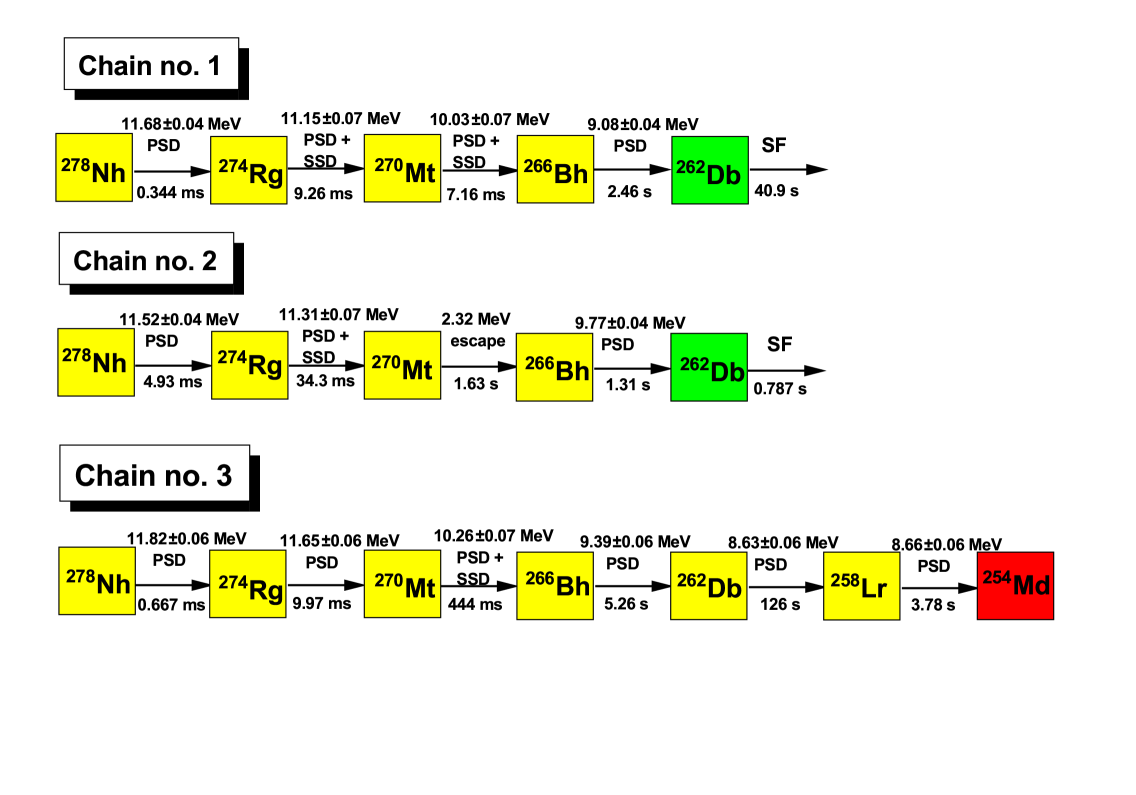
6.5 6.6 Discovery of element 113 - Alpha decay chain of 278Nh
| chain 1 | chain2 | chain 3 | |||||||
|---|---|---|---|---|---|---|---|---|---|
| Isotope | Eα/MeV | T1/2 | Eα/MeV | T1/2 | Eα/MeV | T1/2 | |||
| 278Nh | 11.680.04 | 0.344 ms | 11.520.04 | 4.93 ms | 11.820.06 | 0.667 ms | |||
| 274Rg | 11.150.07 | 9.26 ms | 11.310.07 | 34.3 ms | 10.650.06 | 9.97 ms | |||
| 270Mt | 10.030.07 | 7.16 ms | 2.32 (esc) | 1.63 s | 10.260.07 | 444 ms | |||
| 266Bh | 9.080.04 | 2.47 s | 9.770.04 | 1.31 s | 9.390.06 | 5.26 s | |||
| 262Db | sf | 40.9 s | sf | 0.787 s | 8.630.06 | 126 s | |||
| 258Lr | 8.660.06 | 3.78 s |
The first report on discovery of element 113 was published by Oganessian et al. [127] in 2004. In an irradiation of 243Am with 48Ca performed at the DGFRs three decay chains were observed which were interpreted to start from 288115; the isotope
284113 of the new element 113 was thus produced as the decay descendant of 288115. The data published in 2004
were confirmed at DGFRS [66], at TASCA [67] and also later - after giving credit to the discovery of element 113 - at the BGS [68]. Nevertheless the ’fourth IUPAC/IUPAP joint working Party (JWP) did not accept these results
as the discovery of elemenent 113, as they concluded that the discovery profiles were not fulfilled: ’The 2013 Oganessian
collaboration [66] and the 2013 Rudolph collaboration [67] provide redundancy to the three 288113 chains
observed in 2004 with the energies being in excellent agreement among most of the events. […] However, the criteria (q.v. [128]) have not been met as there is no mandatory identification of the chain atomic numbers neither through a known descendant nor by cross reaction. Chemical determination as detailed in the subsequent profile of Z = 115 where they are documented, serving the important role of assigning atomic number are insufficiently selective although certainly otherwise informative’ [13].
Instead credit for discovery of element 113 was given to Morita et al. on the basis of three decay chains observed in the ’cold’ fusion reaction 70Zn + 209Bi [13].
Although cold fusion had been the successful method to synthesize elements Z = 107 to Z = 112, due to the steep decrease of the
cross-sections by a factor of three to four per element, it did not seem to be straightforward to assume it would be the silver bullet to the
SHE (see fig. 16). Nevertheless after the successful synthesis of element 112 in bombardments of 208Pb with 70Zn [86]
it seemed straightforward to attempt to synthesize element 113 in the reaction 209Bi(70Zn,n)278113. Being optimistic and
assuming a drop in the cross section not larger than a factor of five, as observed for the step from element 110 to element 111
(see fig. 16), a cross section of some hundred femtobarn could be expected.
First attempts were undertaken at SHIP, GSI, Darmstadt, Germany in 1998 [129] and in 2003 [130]. No decay chains
that could be attributed to start from an element 113 isotope were observed. Merging the projectile doses collected in both experiments
an upper production cross section limit 160 fb was obtained [131].
More intensively this reaction was studied at the GARIS separator, Riken, Wako-shi, Japan. Over a period of nine years (from 2003 to 2012)
with a complete irradiation time of 575 days altogether three dcay chains interpreted to start from 278113 were observed
[132, 133, 134, 135].
The collected beam dose was 1.351020 70Zn - ions, the formation cross-section was = 22 fb
[134].
The chains are shown in fig. 17 and the data are presented in table 5. Chain 1 and chain 2 consist of four particles and are
terminated by a fission event, while chain 3 consists of six decays. Already at first glance the large differences in the
energies of members assigned to the same isotope is striking, especially for the events (274Rg) in chains 2 and 3
with E = 0.68 MeV and (266Bh) in chains 1 and 2 with E = 0.69 MeV. Although it is known
that - decay energies can vary in a wide range for odd - odd nuclei in the region of heaviest nuclei, as was shown, e.g.,
for 266Mt, where energies were found to vary in the range Eα = (10.456 - 11.739) MeV [76],
the assignment of such different energies to the decay of the same isotope or the same nuclear level can be debated (see e.g. [11]), as specifcally
concerning the latter case it is known, that in odd - odd (and also in odd - mass) nuclei often low lying isomeric states exist, which
decay by emission with energies and halflives similar to those of the ground state (see e.g. [60]
for the cases of 258Db, 254Lr, and 250Md).
In the present case large energy differences of E 0.1 MeV are evident for the corresponding members in
all chains as shown in table 6.
| isotope | Eα/MeV | Eα/MeV | Eα/MeV | Eα/MeV | Eα/MeV | Eα/MeV |
|---|---|---|---|---|---|---|
| Chain 1 | Chain 2 | Chain 3 | Ch.1 - Ch.2 | Ch.1 - Ch.3 | Ch.2 - Ch. 3 | |
| 278Nh | 11.680.04 | 11.520.04 | 11.820.06 | 0.16 | 0.14 | 0.30 |
| 274Rg | 11.150.07 | 11.310.07 | 10.650.06 | 0.16 | 0.50 | 0.68 |
| 270Mt | 10.030.07 | 2.32 (esc) | 10.260.07 | - | 0,23 | - |
| 266Bh | 9.080.04 | 9.770.04 | 9.390.06 | 0.69 | 0.31 | 0.48 |
These differences are of specific importance for 266Bh which acts as an anchor point for identification of
the chains. The observation of decay of this isotope has been reported by several authors who produced it in diffeent reactions:
a) Wilk et al. [136] used the reaction 249Bk(22Ne,5n)266Bh. They observed one event with an energy of
Eα = 9.29 MeV.
b) Morita et al. [135, 137] used the reaction 248Cm(23Na,5n)266Bh; they observed in total 32 decay chains; 20 of
them
were attributed (partly tentative) to the decay of 266Bh; four decay chains consisted of three particles, assigned as decays
(266Bh) - (262Db) - (258Lr); four decay chains consisted of two particles,
interpreted as decays (266Bh) - (262Db or 258Lr); twelve decay chains consisted of an particle
followed by a fission event, interpreted as (266Bh) - SF(262Db)(possibly SF from 262Rf,
produced by EC decay of 262Db); in the case of four energies of Eα 9 MeV, the
assignment was marked as ’tentative’.
c) Qin et al. [138] used the reaction 243Am(26Mg,3n)266Bh. They observed four decay chains which they assigned
start from 266Bh.
Evidently there is no real agreement for the energies of 266Bh; two of the three energies of 266Bh from the
278113 decay chains (fig. 18a) are outside the range of energies observed in direct production, which is specifically critical
for chain 3, as it is not terminated by fission, but decay is followed by two more events attributed to
262Db and 258Lr and thus is the anchor point for identification of the chain. Some agreement is obtained for the events
from the direct production followed by fission [137, 135] (fig. 18e), the energy in chain 1 (fig. 18a)
(also follwed by fission) and the results from Qin et al. [138] (fig. 18f), where two groups at (9.05 - 9.1) MeV and (8.9 - 9.0) MeV
are visible. Note, that in [137, 135] the events at Eα 9.0 MeV followed by fission are only assigned
tentatively to 266Bh, while in [138] all 266Bh decays are followed by decays.
Unclear is the situation of the events followed by decays. As seen in figs. 18c, 18d, and 18f, there are already in
the results from [137, 135] discrepancies in the 266Bh energies from triple correlations (fig. 18c) and double correlations
(fig. 18d). In the triple correlations there is one event at E = 8.82 MeV, three more are in the interval E = (9.08 - 9.2) MeV, while for the
double correlations all four events are in the range E = (9.14 - 9.23) MeV; tentatively merging the 266Bh energies from events
followed by decay we find six of eight events (75 per cent) in the range E = (9.14 - 9.23) MeV while only one of twelve events
followed by fission is observed in that region. In this enery range none of the events observed by Qin et al. [138] is found, which are all below 9.14 MeV, also none of the events from the decay of 278113, and also not the event reported by Wilk et al. [136] (fig. 18b) is found.
To conclude, the decay energies of 266Bh reported from the different production reactions as well as from the different decay modes of the daughter products ( decay or (SF/EC) vary considerably, so there is no real experimental
basis to use 266Bh as an anchor point for identification of the chain assumed to start at 278113.
Discrepancies are also found for the halflives. From the 278113 decay chains a half-life of T1/2 = 2.2 s is obtained for
266Bh [135], while Qin et al. [138] give a value T1/2 = 0.66 s.
The discrepancy is already slightly outside the 1 confidential interval. No half-life value is given from the direct production
of Morita et al. [135].
The disagreement in the decay properties of 266Bh reported by different authors renders the interpretation of the decay chain
(chain 3) quite difficult. It is therefore of importance to check the following decays assigned to 262Db and 258Lr,
respectively, as they may help to clarify the situation. In order to do so, it is required to review the reported decay properties of these
isotopes and to compare the results with the data in chain 3.
It should also be remarked here that the differences of the energies attributed to 266Bh followed by decays or by SF
in [135] indicates that the assignement of these events to the same isotope is not straightforward, at least not the
assignment to the decay of the same nuclear level.
In a previous data compilation [81] three lines of Eα1 = 8.450.02 MeV (i = 0.75),
Eα2 = 8.530.02 MeV (i = 0.16), Eα3 = 8.670.02 MeV (i = 0.09) and a half-life of
T1/2 = 344 s are reported for 262Db. More recent data were obtained from decay studies of 266Bh [135, 136, 137, 138]
or from direct production via the reaction 248Cm(19F,5n)262Db [139, 140]. The results of the different studies are
compared in fig. 19.
The energy of the one event from the 278113 decay chain 3 is shown in fig. 19a.
The most extensive recent data for 262Db were collected by Haba et al. [140]. They observed two groups of -decay
energies, one at Eα = (8.40-8.55) MeV (in the following also denoted as ’low energy component’) and another one at Eα = (8.60-8.80) MeV (in the following also denoted as ’high energy component’) (fig. 19g).
Mean energy values and intensities are
Eα = 8.460.04 MeV (irel = 0.700.05) and Eα = 8.680.03 MeV
(irel = 0.300.05).
In [140] only
one common half-life of T1/2 = 33.8 s is given for both groups. A re-analysis of the data, however, indicates different
halflives: T1/2 = 39 s for Eα = (8.40 - 8.55) MeV and
T1/2 = 24 s for Eα = (8.60 - 8.80) MeV. A similar behavior is reported by Dressler et al. [139]
2 events at Eα = (8.40 - 8.55) MeV and one event at Eα = (8.60 - 8.80) MeV (see fig. 19f).
Qin et al. [138] oberserved three events at Eα = (8.40 - 8.55) MeV and one event at Eα = 8.604 MeV, outside
the bulk of the high energy group reported in [140](see fig. 19e). A similar behavior is seen for the double correlations
(262Db - 258Lr), with missing 266Bh from the reaction 23Na + 248Cm measured by Morita et al. [135]
(see fig. 19d). Three of four events are located in the range
of the low energy component, while for the triple correlations all four events are in the high energy group (see fig. 19c).
This behavior seems somewhat strange as there is no physical reason why the
decay energies of 262Db should be different for the cases where the preceding 266Bh decay is recorded
or not recorded. It rather could mean that the triple (266Bh 262Db 258Lr) and the
double correlations (262Db 258Lr) of [135] do no respresent the same activities.
The decay energy of the one event observed by Wilk et al. [136] belongs to the low energy group (see fig. 19b). The one
event from the decay chain attributed to start from 278113 does not really fit to one of the groups. The energy is definitely
lower than the mean value of the high energy group, an agreement with that group can only be postulated considering the
large uncertainty (60 keV) of its energy value (see fig. 19a).
Halflives are T1/2 = 44 s for the Eα = (8.40 - 8.55) MeV component in [135],
T1/2 = 16 s for the Eα = (8.55 - 8.80) MeV in agreement with the values of Haba et al. [140],
and T1/2 = 52 s for the SF activity, which is rather in agreement with that of the low energy component.
To summarize: The assignment of the event in chain 3 in [135] to 262Db is not unambiguos on the basis of its
energy, in addition also its ’lifetime’ = tα5-tα4 = 126 s is about five times of the half-life
of the high energy component of 262Db observed in [140]. One should keep in mind, that the probability to observe a decay
at times longer than five halflives is p 0.03.
| ref. [141, 143] | ref. [142, 143] | ||
|---|---|---|---|
| Eα/MeV | iα | Eα/MeV | iα |
| 8.5900.02 | 0.300.04 | 8.5400.02 | 0.100.05 |
| 8.6200.02 | 0.470.03 | 8.5890.01 | 0.450.07 |
| 8.6500.02 | 0.160.03 | 8.6140.01 | 0.350.05 |
| 8.6800.02 | 0.070.04 | 8.6480.01 | 0.100.02 |
| Reference | Isoptope | analysis mode | T1/2 / s |
|---|---|---|---|
| [135] | 266Bh | decay chain 278Nh | 2.2 |
| [138] | 266Bh | 0.66 | |
| [144] | 266Bh | correlated to SF | 12.8 |
| [144] | 266Bh | correlated to decay | 7.0 |
| [144] | 266Bh | all events | 10.0 |
| [81] | 262Db | 344 | |
| [135] | 262Db | E = (8.38-8.52) MeV | 44 |
| [135] | 262Db | E = (8.55-8.80) MeV | 16 |
| [135] | 262Db | corr. 266Bh - SF | 52 |
| [140] | 262Db | E = (8.38-8.52) MeV | 39 |
| [140] | 262Db | E = (8.55-8.80) MeV | 24 |
| [138] | 262Db | 26 | |
| [139] | 262Db | 26 | |
| [144] | 262Bh | corre. 266Bh - SF | 39 |
| [144] | 262Db | E = (8.38-8.52) MeV | 32 |
| [144] | 262Db | E = (8.55-8.80) MeV | 6.7 |
| [81] | 258Lr | 3.9 | |
| [135] | 258Lr | triple corr. 266Bh - 262Db - 258Lr | 4.7 |
| [135] | 258Lr | double corr. 262Db - 258Lr | 3.3 |
| [135] | 258Lr | all events | 4.0 |
| [140] | 258Lr | corr. 262Db, E = (8.38-8.52) MeV | 3.5 |
| [140] | 258Lr | corr. 262Db, E = (8.55-8.80) MeV | 4.1 |
| [140] | 258Lr | all events | 3.5 |
| [139] | 258Lr | 3.1 | |
| [144] | 258Lr | all events | 3.6 |
Observation of 258Lr was first reported by Eskola et al. [141] and later by Bemis et al. [142]. The reported
energies and intensities slightly disagree [143]. The data are given in table 6. The energies given in [142] are 30-50 keV lower than those reported in [141].
More recent data were obtained from decay studies of 266Bh, 262Db [135, 136, 137, 138, 139, 140].
The results are compared in fig. 20.
The quality of the data is lower than that of 262Db, but not less confusing. Haba et al. got a broad energy distribution
in the range Eα = (8.50 - 8.75) MeV with the bulk at Eα = (8.60 - 8.65) MeV having a mean value
Eα = 8.620.02 MeV (see fig. 20g), for which a half-life of
T1/2 = 3.54 s is given. Dressler et al. [139] observed all the events at Eα 8.60 MeV
(see fig. 20f), but obtained a similar halflife of T1/2 = 3.10 s. Each one event within the energy range of the
Haba - data was observed by Qin et al. [138] (fig. 20e) and Wilk et al. [136] (fig. 20b).
Contrary to the energies of 266Bh and 262Db the energies for 258Lr from the 266Bh decay study of
Morita et al. [135] are quite in agreement for the triple (fig. 20c) and double (fig. 20d) correlations, a bulk of five
events at a mean energy of Eα = 8.700.01 MeV, further two events at a mean energy Eα = 8.590.02 MeV,
and single one at Eα = 8.80 MeV; halflives are T1/2 = 4.7 s for the events from the triple correlations,
T1/2 = 3.3 s for the events from the double correlations, being in agreement within the error bars.
They may be merged to a single half-life of T1/2 = 4.0 s.
The one decay event from chain 3 attributed to start from 278113 [135] of Eα = 8.660.06 MeV and = tα6-tα5 = 3.78 s fairly fits into the decay properties reported for 258Lr.
The dilemma is evident as seen from fig. 21 where all triple correlations 266Bh 262Db
258Lr reported so far [135, 136, 138, 144] are shown. None of the fourteen chains agrees with any other
one. This feature may indicate the complicate decay pattern of these isotopes, but it makes the assignment to the same isotope
speculative. In other words: the ’subchain’ 266Bh 262Db
258Lr of the decay chain interpreted to start from 278113 does not agree with any other so far
observed decay chain
interpreted to start from 266Bh. The essential item, however, is that this triple correlation was regared as the key point
for first identification of element 113, to approve the discovery of this element and give credit to the discoverers.
But this decision is based rather on weak probability considerations than on firm experimental facts.
The only solid pillar is the agreement with the decay properties reported for 258Lr, which might be regarded
as rather weak. In other words, the assignment of the three decay chains to the decay of 278Nh is probable, but not firm.
It should be reminded that in case of element 111 in the JWP report from 2001 it was stated: ’The results of this study are definitely of high quality but there is insufficient internal redundancy to warrant certitude at this stage. Confirmation by further results is needed to assign priority of discovery to this collaboration’ [79].
So it seems strange that in a similar situation as evidently here, such concerns were not expressed.
A new decay study of 266Bh was reported recently by Haba et al. [144] using the same production reaction as in [135].
Alpha decays were observed correlated to fission events, assigned to the decay of 262Db and decay chains 266Bh
262Db or 266Bh 262Db 258Lr .
The spectra of decays followed by fission is shown in fig. 18g, that of events followed by decays of 262Db in fig. 18h. Evidently
in correlation to fission events a concentration of events (’peak’) is observed at Eα = 8.85 MeV, not observed in [135], while in the range
Eα = 8.9-9.0 MeV, where in [137] a peak - like structure was oberserved Haba et al. registered only a broad distribution. Also only
a broad distribution without indication of a peak - like concentration in the range Eα = 8.8-9.4 MeV is observed in correlation to decays.
However, two decays at E 9.4 MeV were now reported, close to the energy of 266Bh in the 278Nh decay chain 3 [135].
A remarkable result of Haba et al. [144] is the half-life of 266Bh; values of T1/2 = 12.8 s are obtained for events
correlated to SF, and
T1/2 = 7.0 s for events correlated to decays. This finding suggests a common half-life of
T1/2 = 10.0 s as given in [144] despite the discrepancies in the energies. That value is, however, significantly larger
than the results from previous studies [135, 138].
For 262Db in [144] a similar decay energy distribution is observed as in [140], as seen in figs. 19g and 19h,
but again not in agreement with the results from [137] (figs. 19c and 19d) where the low energy component E = (8.38-8.52) MeV is practically missing.
Halflives of SF events assigned to 262Db are in agreement with those of events at E = (8.38-8.52) MeV (see table 8), but again for the events
at E = (8.55-8.80) MeV a shorter half-life (T1/2 = 6.7 s) is indicated. Interestingly all events at E = (8.55-8.80) MeV are correlated to
266Bh decays E 9 MeV. These are the events no. 13, 28 in [144] and no. 1, 2, 3 in [137]. The two events of 266Bh
in [144] have
extremely low correlation times of (0.92 s and 0.33 s), the 262Db events have a half-life T1/2 = 13.7 s.
Despite the above mentioned differences the same feature is observed in [135]. The data
are summarized in table 8. A halflife T1/2 = 22.5 s is obtained clearly lower than that of the SF events and - events
E = (8.38-8.55 MeV), corroborating the possible existence of two long-lived states in 262Db. Although data are scarce two other features are
indicated: a) all 266Bh energies are above the ’bulk’ of the energy distribution of 266Bh and b) one obtains a half-life
of T1/2 = 3.4 s, lower than the value of 10 s extracted from all events. This can be regarded as a hint for the existence of
two long-lived states in 266Bh decaying by emission, resulting in two essential decay branches 266Bh(1) 262Db(1)
and 266Bh(2) 262Db(2).
The spectrum for 258Lr measured in [144] is shown in fig. 20h. Essentially it is in-line with the one obtained in [140].
To summarize: the new decay study of 266Bh delivers results not really in agreement with those from previous studies concerning the decay
energies and delivers a considerably longer halflife for that isotope. So the results do not remove the concerns on the decay chains interpreted to start
from 278Nh. But it delivers some interesting features: the decays in the range (8.38-8.55) MeV and the SF events following decay of 266Bh
seemingly are due to the decay of the same state in 262Db, the fission activity, however, may be due to 262Rf produced by EC of 262Db.
The - decays of 262Db of E = (8.55-8,80) MeV eventually are from decay of a second long-lived level. There is also strong evidence that this
level is populated essentially by decay of a long-lived level in 266Bh, different to that populating the one in 262Db decaying by
particles in the range (8.38-8.55) MeV. Further studies are required to clarify this undoubtedly interesting feature.
Discussing the items above one has of course to emphasize the different experimental techniques used which may influence the measured energies.
The important feature are the different detector resolutions which determine the widths of the distributions.
So comparison of energies might be somewhat ’dangerous’. Another item is energy summing between particles and CE. In the experiments of Wilk et al.
[136] and Morita et al. [135], the reaction products were implanted into the detector after in-flight separation.
Qin et al. [138], Dressler et al. [139] and Haba et al. [140, 144] collect the reaction products on the detector surface or on a thin foil
between two detectors. The letter procedure reduces the efficiency for energy summing of particles and CE considerably. This could be the reason for the ’shift’ of
the small ’bulk’ of the 266Bh energy distribution from 8.85 MeV [144] in fig. 18g to 8.95 MeV [135]
in fig. 18e. This interpretation might be speculative, but it clearly shows that such effects renders the consistency of data more difficult if different
experimental techniques are applied.
7 7. (Exemplified) Cross-checks with Nuclear Structure Theory
In the following some discussion on selected decay and nuclear structure properties will be presented.
7.1 7.1 Alpha-decay energies / Q-alpha values; even Z, odd-A, odd-odd nuclei
Alpha-decay energies provide some basic information about nuclear stability and properties. Discussing the properties
one strictly has to distinguish two cases, a) decay of even-even nuclei, and b) decay of isotopes
with odd proton and/or odd neutron numbers.
In even-even nuclei transitions occur with highest intensities between the Iπ = 0+ ground - states of mother and daughter isotopes. Still, in the region of strongly deformed heaviest nuclei (Z 90) notable population with
relative intensities of (10-30 ) is observed for transitions into the Iπ = 2+ level of the ground-state rotational band [81], while band members of higher spins (4+, 6+ etc.) are populated only weakly with
relative intensities of 1. Under these circumstances the line of highest intensity represents the Q-value of the transition and is thus a measure for the mass difference of the mother and the daughter nucleus. It should be kept in mind, however,
that only in cases where the mass of the daughter nucleus is known, the Q-value can be used to calculate the mass of the mother nucleus, and only in those cases -decay energies can be used to ’directly’ test nuclear mass predictions. Nevertheless, already the mass differences, i.e. the Q-values, can be used for qualitative assessments of those models. Particulary, as crossing of nucleon shells is accompanied by a strong local decrease of the Qα - values, existence, and by some extent also strength of such shells can be verified by analyzing systematics of Qα - values. That feature is displayed in fig. 22, where experimental Qα values for the known isotopes of even-Z elements Z 104 are compared with results of two (widely used) mass predictions based on the macropscopic - microscopic approach, the one reported by R. Smolanczuk and A. Sobiczewski [17] (fig. 22a), and the one reported by P. Möller et al. [18] (fig. 22b). The neutron shells
at N = 152 and N = 162, indicated by the black dashed lines are experimentally and theoretically verified by the local minima in the Qα - values. But significant differences in the theoretical predictions are indicated, those of [17] reproduce the experimental data in general quite fairly, while the agreement of those from [18] is
significantly worse.

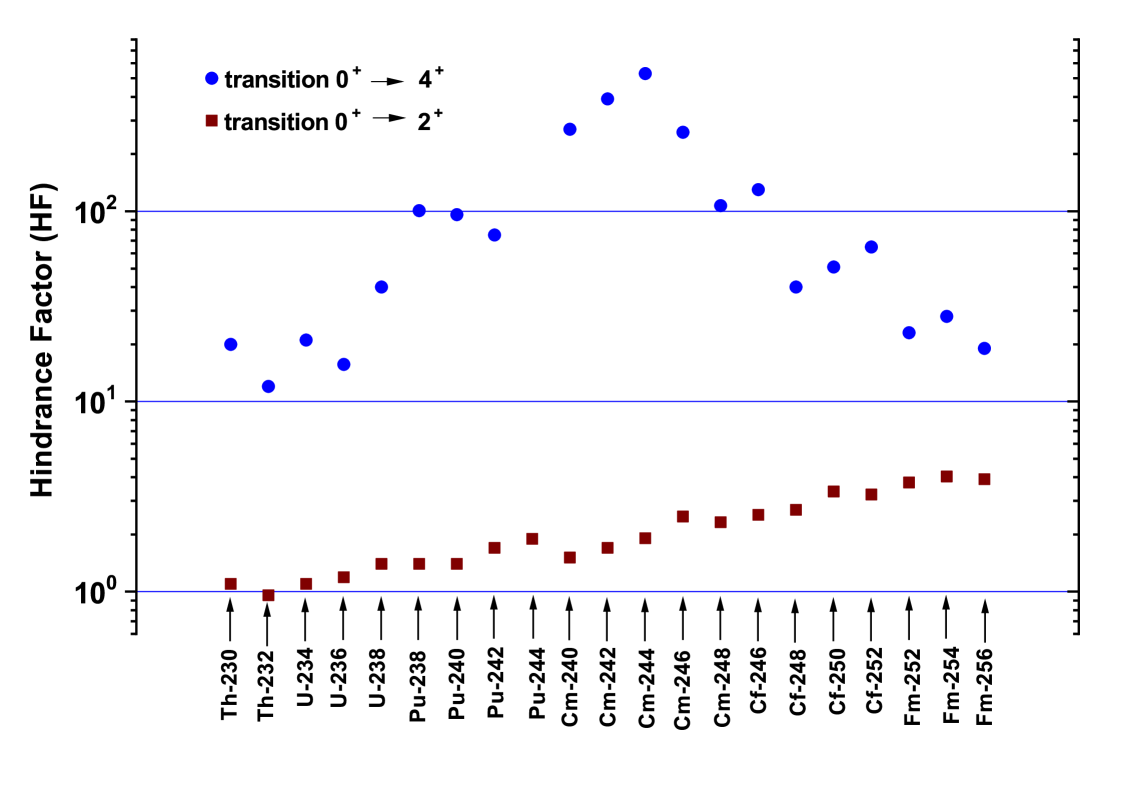


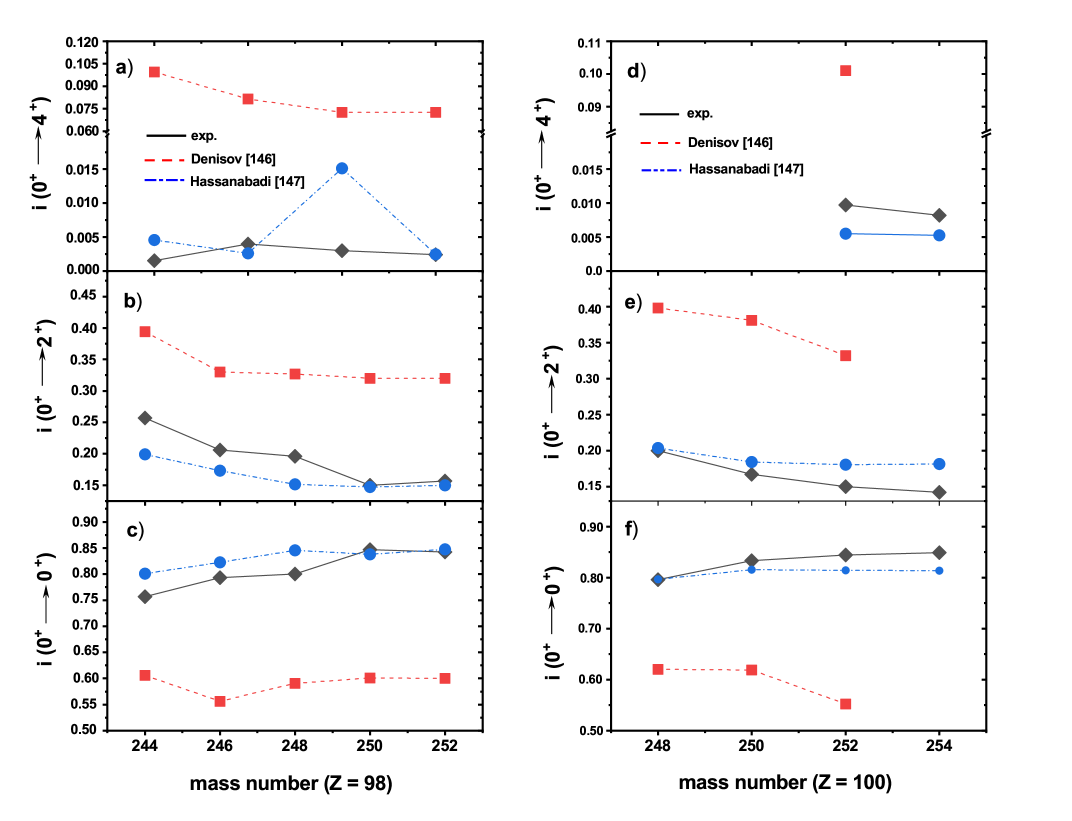
Alpha-decay between states of different spins are hindered. Quantitatively the hindrance can be expressed by a hindrance factor HF, defined as HF = Tα(exp) / Tα(theo), where Tα(exp) denotes the experimental partial -decay half-life and Tα(theo) the theoretical one. To calculate the latter a couple of (mostly empirical) relations are available. In the following will use the one proposed by D.N. Poenaru [98] with the parameter modification suggested by Rurarz [99]. This formula has been proven to reproduce experimental partial -decay halflives of even-even nuclei in the region of superheavy nuclei within a factor of two [100].
A semi-empirical relation for the hindrance due to angular momentum change was given in 1959 by J.O. Rasmussen [145].
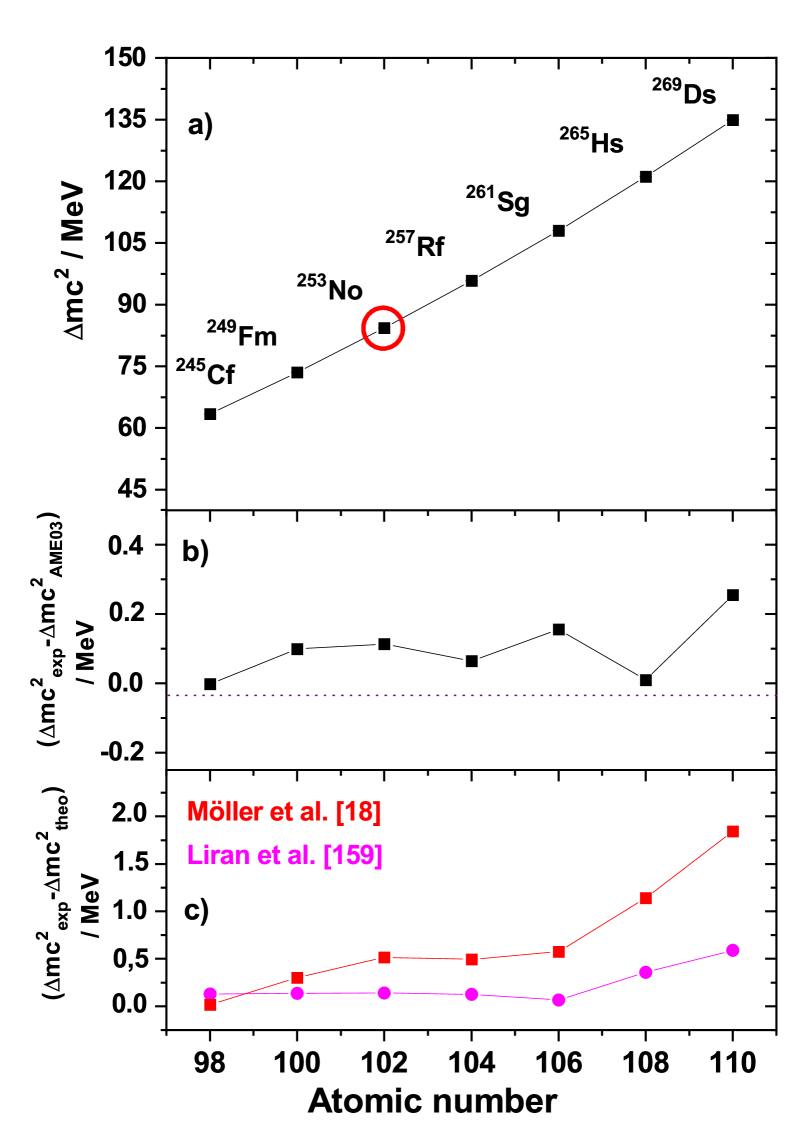
The change of the transition probability P0 (no angular momentum change) through the barrier, which can be equated with the inverse hindrance factor,
was given as
PL/P0 = exp[-0.2027L(L+1)Z-1/2A-1/6]
with L denoting change of the angular momentum, Z and A the atomic number of the daughter nuclei.
In the range of actinide nuclei where
data are available (Z 90 - 102) one expects hindrance factors HF (1.6 - 1.7) for L = 2
and HF (5 - 6) for L = 4, with a slight decrease at increasing A and Z.
The experimental hindrance factors for decay into the Iπ = 2+ and Iπ = 4+ levels for the known cases in the actinide region Z 90 are shown in fig. 23.
They exhibit a complete different behavior: for the L = 2 transitions the experimental hindrance factor are comparable, but increase at increasing A and Z. For the L = 4 transitions the hindrance factors are considerably larger and a maximum is indicated for curium isotopes in the mass range A = (240 - 246).
Interestingly this behavior can be related to the ground-state deformation as shown in fig. 24 and 25. In fig. 24 the hindrance factors for the Iπ = 0+ Iπ = 2+ transitions are plotted as function of the quadrupole deformation parameter (taken from [18]). Evidently a strong increase of the hindrance factor at increasing quadrupole deformation is observed. In fig. 25 the hindrance factors for the Iπ = 0+ Iπ = 4+ transitions are plotted as a function of the hexadecapole deformation parameter (taken from [18]). Here, a maximum at a deformation parameter 0.08 is indicated.
This suggests a strong dependence of the hindrance factor on nuclear deformation and
measuring transitions into rotational members of the ground-state band may already deliver valuable information about the ground-state deformation of the considered nuclei.
Some attempts to calculate the transition probabilty into the ground - state rotational band members have been undertaken by
V. Yu. Denisov and A.A. Khudenko [146] as well as by H. Hassanabadi and S.S. Hosseini [147].
In both papers the halflives were calculated in the ’standard’ way as
T1/2 = ln2/P
with denoting the frequency of assaults on the barrier, and P being the penetration probability through the potential barrier using
the semiclassic WKB method.
In [147] the - nucleus potential was parameterized as a polynominal of third order for rCt and as sum of Coulomb VC,
nuclear VN and centrifugal Vl + (l(l+1)/(2r2)) potential. For VC and Vl ’standard expressions’ were used, for Vn
the ’proximity potential’ of Blocki et al. [148]. Ct is the touching configuration of daughter nucleus (d) and particle (),
Ct = Cd + Cα, with Ct denoting the Suessman central radii (see [147] for details).
V.Yu. Denisov and A.A. Khudenko [146] use the ’unified model for decay and capture (UMADAC). Their potential represents the sum
of a ’standard’ centrifugal potential Vl (see above), a Coulomb potential VC including quadrupole () and hexadecapole ()
deformations, and a nuclear potential VN of Woods-Saxon type (see [146] for further details).
Their results for the californium and fermium isotopes are compared with the experintal values in fig. 26.
Obviously the calculations of Denisov and Khudenko do not well reproduce the experimental data for both,
californium and fermium isotopes; the calculated
(relative) intensities for the 0+ 0+ transitions (fig. 26c) are too low and hence too high values
for the 0+ 2+ transitions (fig. 26c) and the 0+ 4+ transitions (fig. 26a) are obtained.
The latter are even roughly an order of magnitude higher than the experimental data for the respective transition.
Quite fair agreement between experimental data is evident for the calculations of Hassanabadi and Hosseini
(blue lines and symbols).
In odd-mass nuclei the situation is completely different as ground-state of mother and daughter nuclei usually differ in spin and
often also in parity. So ground-state to ground-state decays are usually hindered. Hindrance factors significally depend on the spin difference, as well as on a possible parity change and/or a spin flip. For odd-mass nuclei an empirical classification of the hindrance factors into five groups has been established (see e.g. [149]). Hindrance factors HF 4 characterize transitions between the same Nilsson levels in mother and daughter nuclei and are denoted as ’favoured transitions’. Hindrance factors HF = (4 - 10) indicate a favourable overlap between the initial and final nuclear state, while values
HF = (10 - 100) point to an unfavourable overlap, but still parallel spin projections of the initial and final state.
Factors HF = (100 - 1000) indicate a parity change and still parallel spin projections, while HF 1000 mean a parity change and a spin flip.
Thus hindrance factors already point to differences in the initial and final states, but on their own do not allow for spin and parity assignments. It is, however, known that in even-Z odd-mass nuclei nuclear structure and thus decay patterns are similar along the isotone lines (see e.g. [150]), while in odd-Z odd-mass nuclei this feature is evident along the isotope lines (see e.g. [151]). So, in certain cases, based on empirical relationships tentative spin and parity
assignments can be established, as done e.g. in suggesting an decay pattern for 255No by P. Eskola et al.
[152], which later was confirmed by - spectroscopy measurement [153, 154].
Another feature in the case of odd-mass nuclei is the fact, that competition between structural hindrance and Q-value hindrance may lead to complex - decay patterns. Nilsson levels identical to the ground-state of the mother nucleus may be excited states located at several hundred keV in the daughter nuclei, e.g.,
in a recent decay study of 259Sg it was shown that the 11/2-[725] Nilsson level assigned to the ground-state in this isotope, is located at E∗ 600 keV in the daughter nucleus 255Rf [155]. Therefore the advantage of a low hindrance factor may be cancelled by a lower barrier transmission probability due to a significantly lower Q-value compared to the ground-state to ground-state transition. Consequently transitions with moderate hindrance factors into lower lying levels may have similar or even higher intensities than the favored transition as it is the case in the above mentioned examples, 255No and 259Sg.
A drawback of many recent decay studies of odd-mass nuclei in the transfermium region was the fact that the ground-state to ground-state transition could not be clearly identified and thus the ’total’ Qα value could not be established.
Another difficulty in these studies was the existence of isomeric states in several nuclei, also decaying by - emission
and having halflives similar as to the ground-state, as in the cases of 251No [63] or 257Rf [156], while in early studies ground-state decay and isomeric decay could not be disentangled. Enhanced experimental techniques, applying also - spectroscopy have overcome widely that problem in the transfermium region. An illustrative example is the
N-Z = 49 - line, where based on the directly measured mass of 253No [157],
and decay data of 253No [65], 257Rf, 261Sg [126], 265Hs [158] and 269Ds [44]
experimental masses could be determined up to 269Ds and could serve for a test of theoretical predictions [18, 159] and empirical evaluations [160], as shown in fig. 27.
The masses predicted by Möller et al. [18] agree with the experimental value within 0.5 MeV
up to Z = 106, while towards Z = 110 (269Ds) deviations rapidly increase up to nearly 2 MeV.
A similar behavior was observed for the
even-even nuclei of the N-Z = 50 line [100], which was interpreted as a possible signature for a lower
shell effect at N = 162.
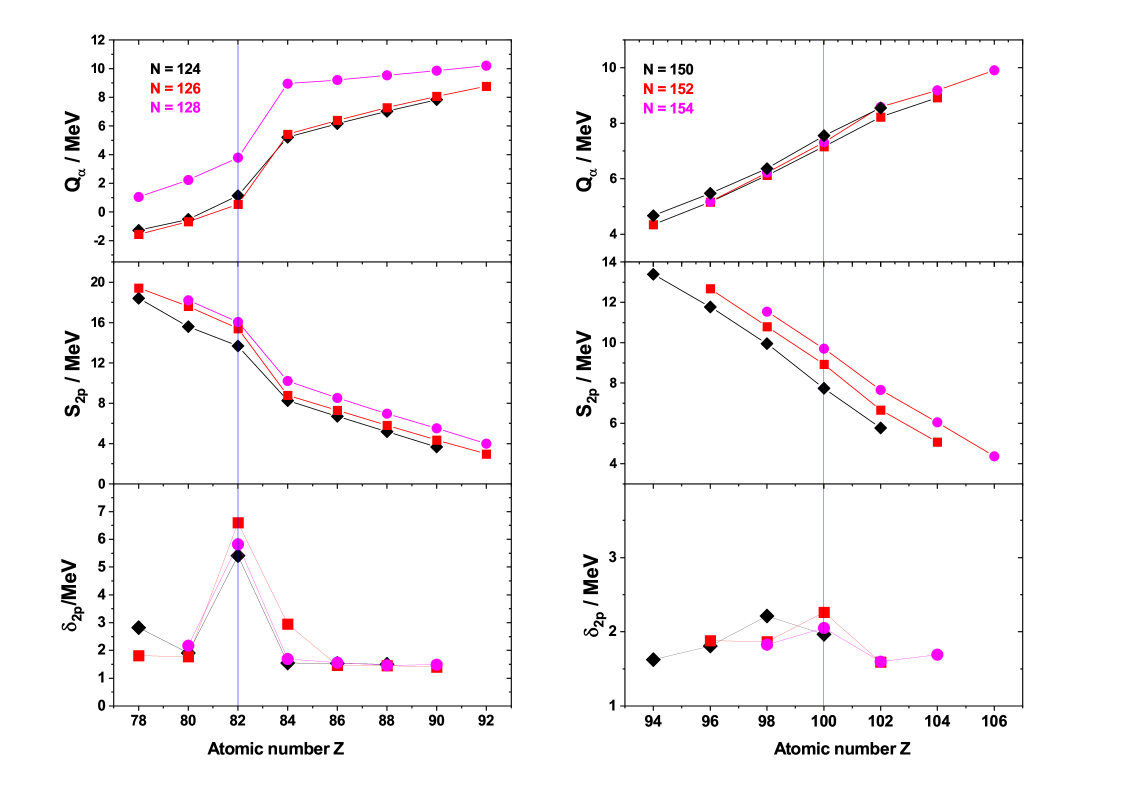
7.2 7.2 Qα values as signatures for nuclear shells
Historically evidence for nuclear shells was first found from the existence of specifically stable nuclei at certain
proton and neutron numbers (Z,N = 2, 8, 20, 28, 50, 82 and N = 126) which were denoted as ’magic’. Experimental signatures
were, e.g. strong kinks in the 2p- or 2n - binding energies at the magic numbers and on the basis of enhanced nuclear decay
data also by local minima in the Qα values.
The existence of nuclear shells was theoretically explained by the nuclear shell model [1, 2], which showed
large energy gaps in the single particle levels at the ’magic’ numbers, which were equated with ’shell closures’.
This item was the basis for the prediction of ’superheavy’ elements around Z = 114 and N = 184 when the nuclear shell model was extended in the region
of unknown nuclei far above Z = 82 and N = 126 [3, 4].
As the shell gap is related to a higher density of single particle levels, compared to the nuclear average (expected e.g. from a Fermi gas model)
below the Fermi level and a lower density above the Fermi level,
the large energy gaps at the magic numbers go hand in hand with large shell correction energies, leading to the
irregularities in the 2p-, 2n- separation energies and in the Qα values.
In between Z = 82, N = 126 and Z = 114 and N = 184 a wide region of stronly deformed nuclei is existing.
Calculations (see e.g. [161]) resulted in large shell gaps at N = 152 and Z = 100. Later theoretical studies
also showed in addition a region of large shell correction energies in between N = 152 and N = 184 [22, 23, 24, 25]
the center of which is presently set at N = 162 and Z = 108.
While the (deformed) nuclear shell at N = 152 is well established on the basis of the Qα - value as seen from fig. 22 and there is,
despite of scarce data, strong evidence for a shell at N = 162, the quest for a shell closure at Z = 100 is still open.
It was pointed out by Greenlees et al. [162] that their results on nuclear structure investigation of 250Fm
are in-line with a shell gap at Z = 100, but 2p - separation energies and Qα - values do not support a shell closure.
The item is shown in fig. 28. On the right hand side Qα values and 2p - binding energies (S2p) are plotted for
three isotone chains (N = 124, 126, 128) around Z = 82. In all three cases a strong increase in the Qα values and
a strong decrease in the S2p values is observed from Z = 82 to Z = 84. On the right hand side Qα values
and S2p
values are plotted around Z = 100 for N = 150, 152, and 154. Here a just a straight increase for both is observed from Z = 94 to
Z = 106.
Alternatively the so-called ’shell-gap parameter’defined as the difference of the 2n () - or 2p () - binding energies is used
characterize nuclear shells. In the present case we get
= S2p(N,Z) - S2p(N,Z+2)
A proton shell is indicated by a local maximum of .
The result for the regions around Z = 82 and Z = 100 are shown in the lower panels of fig. 28. We observe a clear maximum
at Z = 82 is seen for the N = 124, 126, 128 - isotones. A ’mean dífference’ , defined as the average value for all
= (Z=82,N) - (Z=80,N) and = (Z=82,N) - (Z=84,N)
with N = 124, 126, 128 of = 3.930.48 MeV is obtained.
At Z = 100 the situation is different. Here a maximum of at Z = 100 is observed only for the N = 152, 154 isotone lines,
for N = 150 the maximum is located Z = 98, while for the N = 152, 154 we obtainin addition only a small value of = 0.440.18 MeV.
So not only the location of the ’shell’ is not unambiguous, but the ’strength’ is much lower than at Z = 82. So it does not seem
to be justified to speak of a proton shell (or a ’magic’ number) at Z = 100 as claimed recently [49].
7.3 7.3 Electron Capture decays
The analysis of decay chains from SHN produced in reactions of 48Ca with actinide targets
so far acted on the assumptions that the chains consisted on a sequence of
decays and were finally terminated by spontaneous fission [27]. The possibility that one of the chain members
could undergo EC - decay was not considered. Indeed, EC - decay of superheavy nuclei has been only little investigated so
far. Mainly this is due to the technical difficulties to detect EC decay at very low production rates of the isotopes.
Consequently, only very recently EC decay has been investigated successfully in the transactinide region for the cases of
257Rf [164] and 258Db [100]. Two ways of identifying EC - decay turned out to be successful,
a) measuring delayed coincidences between K X-rays and decay or spontaneous fission of the EC - daughter, and b)
measuring delayed coincidences between implanted nuclei and conversion electrons (CE) from decay of excited states
populated by the EC or delayed coincidences between CE and decays ( decay or spontaneous fission) of
the EC daughter. The latter cases, however, require population of excited level decaying by internal conversion, which is not necessarily the case.
Evidence for occuring EC within the decay chains of SHE gives the termination of the decay chains of odd-odd nuclei by spontaneous fission. Since spontaneous fission of odd-odd nuclei is strongly hindered, it can be assumed that it may not the odd-odd nucleus that undergoes fission, but the even-even daughter nucleus, produced by EC decay [165].
The situation is, however, quite complicated. To illustrate we compare in fig. 29 the experimental
(EC/) - halflives of lawrencium and dubnium isotopes with recently calculated [166] EC - halflives.
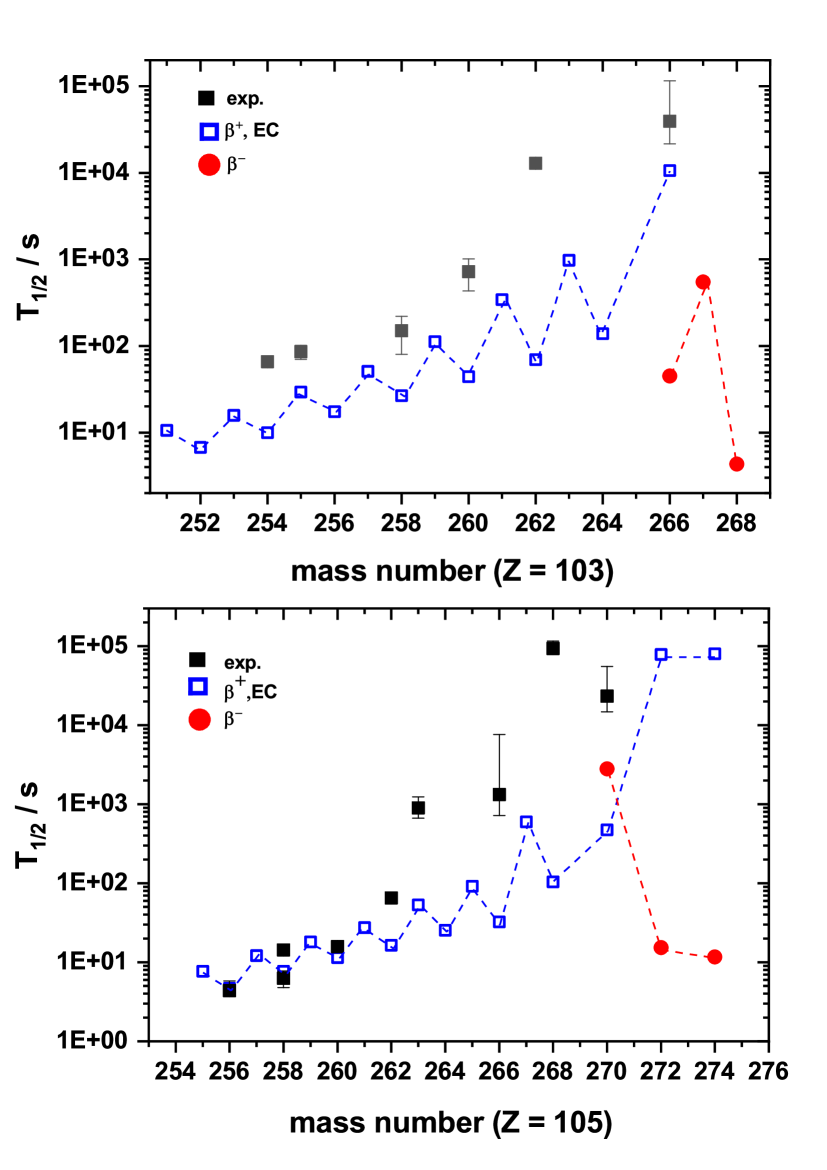
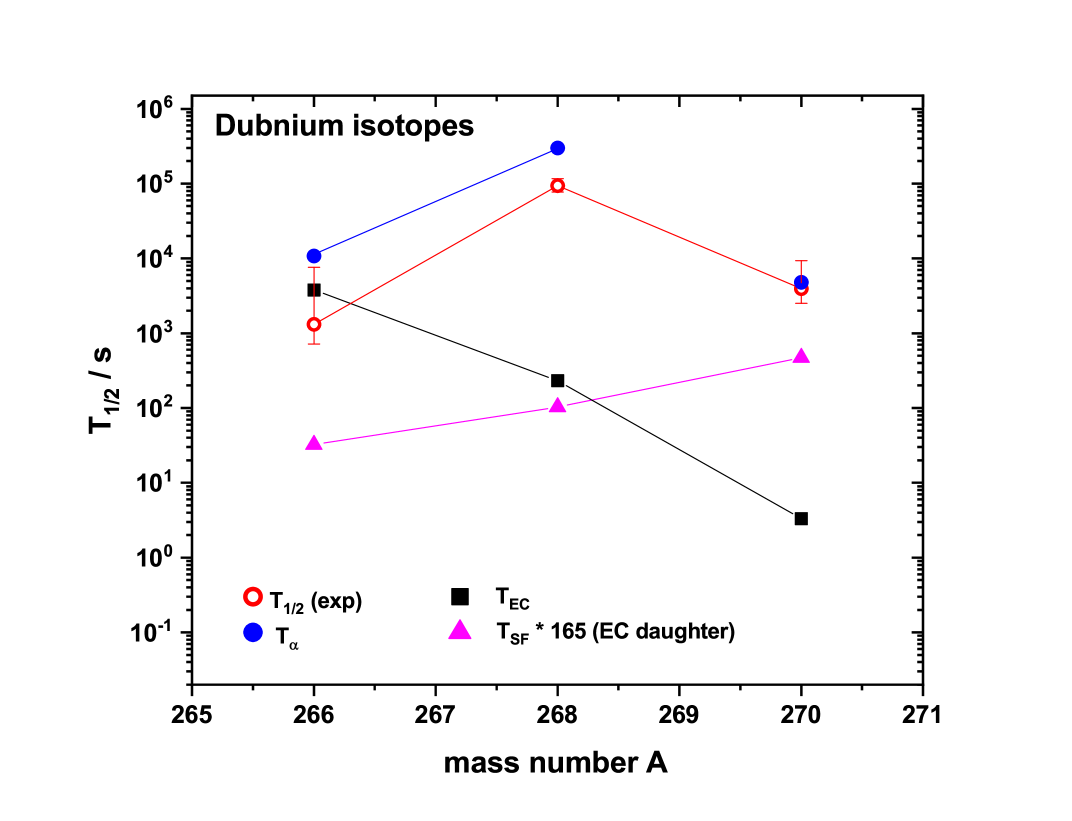
In general the agreement between experimental and calculated values is better for the dubnium, specifcally for A 262, than for the lawrencium isotopes. Evidently, however, the disagreement increases at approaching the line of beta - stability. The experimental EC halflives are up to several orders of magnitude higher than the theoretical values, which may lead to assume that direct spontaneous of the odd-odd nuclei is observed indeed. So there is lot of room for speculation. In this context the difficulties to make also some ’empirical’ conclusions shall be briefly discussed. So far, only in two cases, 260Md and 262Db observation of spontaneous fission of an odd-odd isotope is reported. 262Db seems, however, a less certain case (see discussion in [167]). In table 10 the ’fission halflives’ of 268Db, 262Db and 260Md are compared with the values obtained for their odd-mass neighbouring isotopes with A-1 and Z-1, respectively.
| Isotope | TSF /s | HF |
| 268Db | 93600 | |
| 267Db | 4320 | 21.7 |
| 267Rf | 4680 | 20.0 |
| 262Db | 103 | |
| 261Db | 18.4 | 5.6 |
| 261Rf | 32.5 | 3.2 |
| 260Md | 2.75x10⁶ | |
| 259Md | 5700 | 482 |
| 261Rf | 1.5 | 1.9x10⁶ |
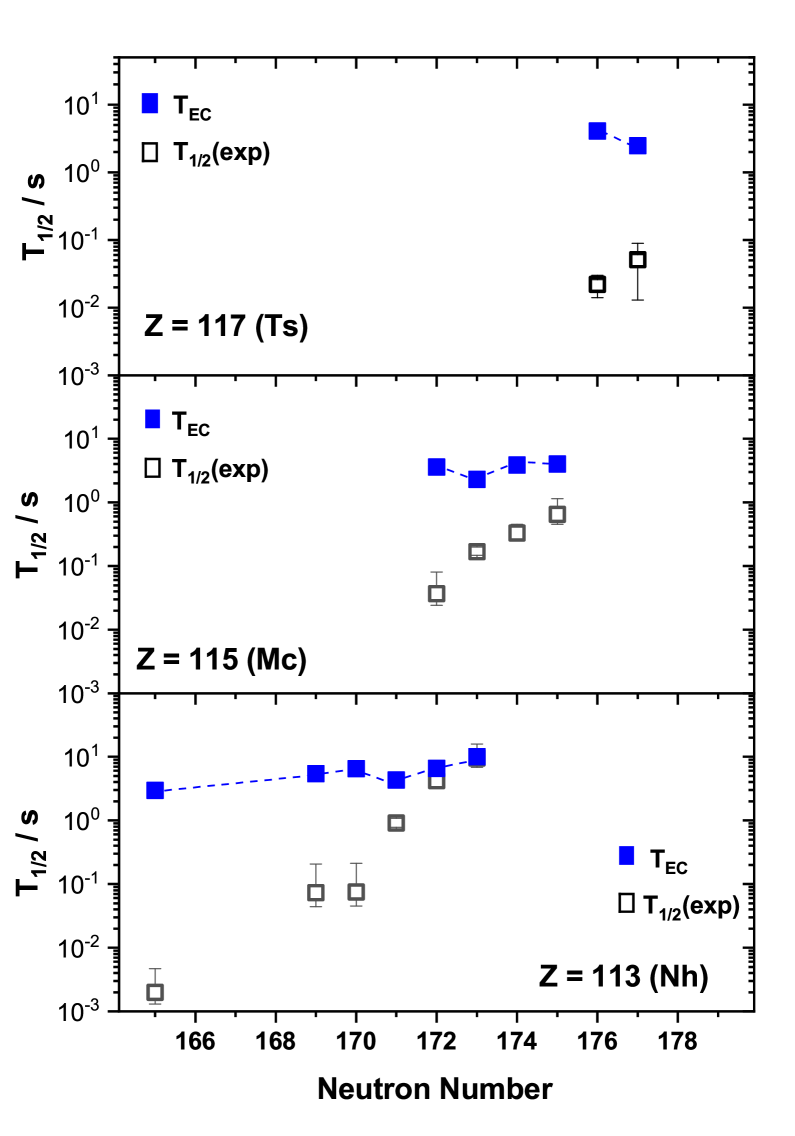
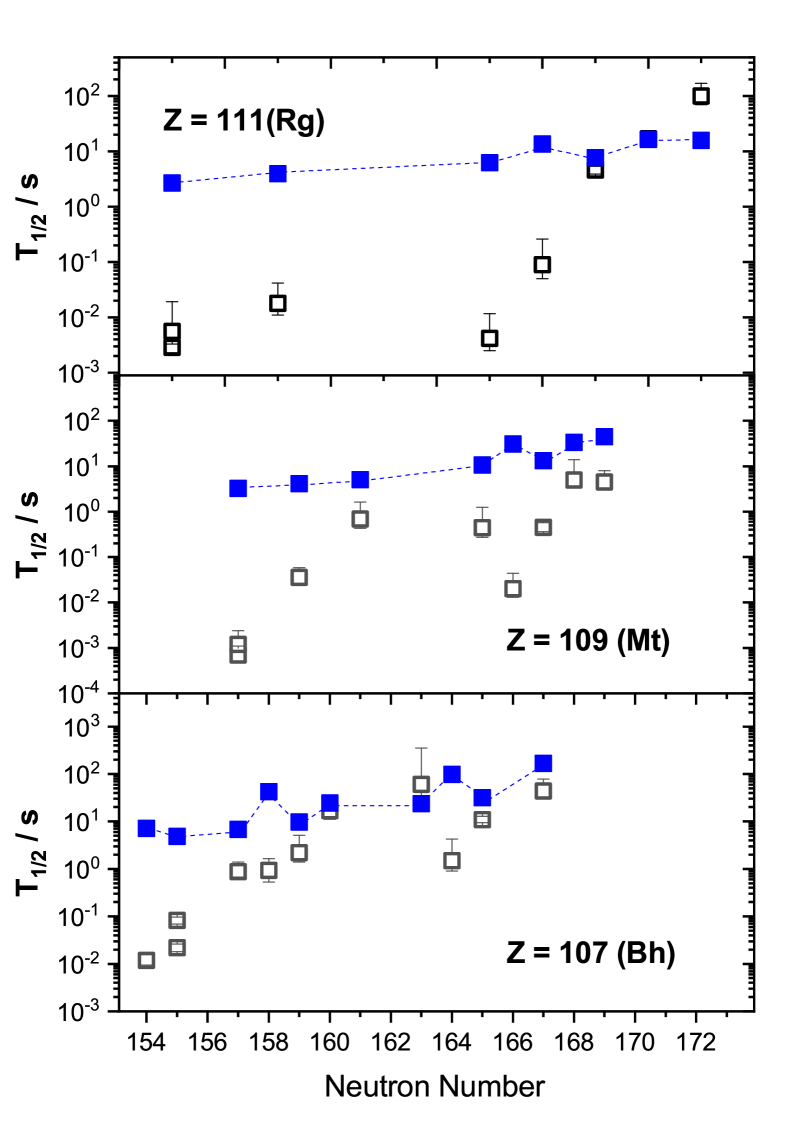
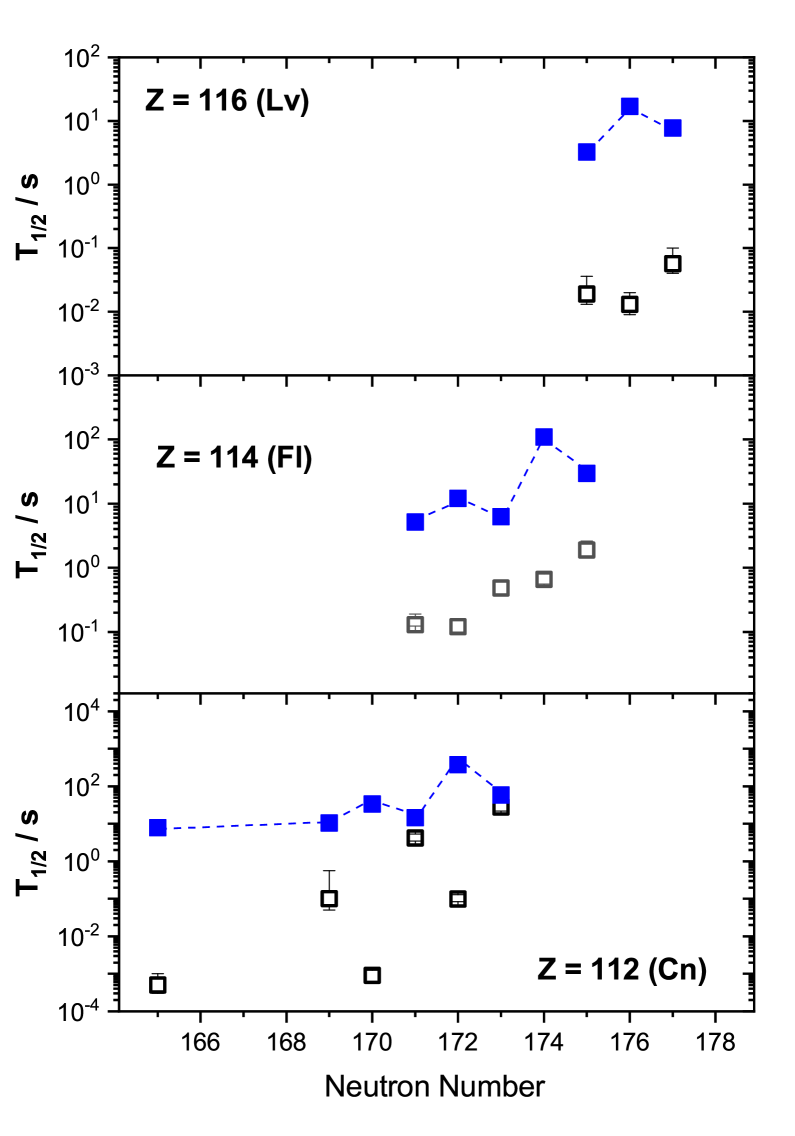
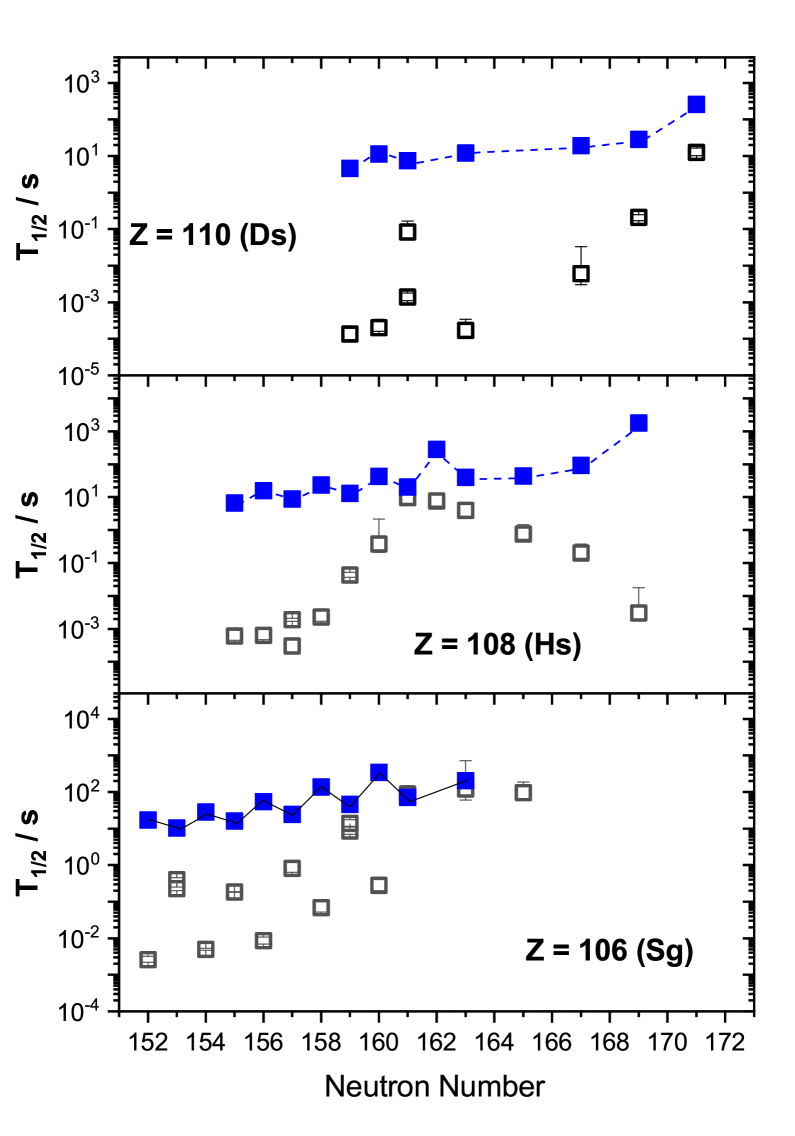
Evidently the resulting hindrance factors HF = TSF(Z,A)/TSF(Z,A-1) or HF = TSF(Z,A)/TSF(Z-1,A-1) are
much lower for 268Db (21.7, 20.0) than for 260Md (482, 1.9x10⁶). These low values suggest that ’fission’ of 268Db originates indeed
from the EC - daughter 268Rf. The lower hindrances factors for 262Db (see table 10), although the case is debated, puts
some doubts in that interpretation. On the other hand it is quite common to take the ratio of the experimental
fission half-life and an ’unhindered’ fission half-life, defined as the geometric mean of the neighbouring
even - even isotopes (see [167] for more detailed discussion), but to estimate reliable hindrance factors the
spontaneous fission halflives of the surrounding even-even nuclei have to be known. In the region of 266,268,270Db
only for one even-even isotope, 266Sg the fission halflive is known, Tsf = 58 s, while a theoretical value of
Tsf = 0.35 s was reported [168], which is lower by a factor of 165. Under these
cirumstances it does not make much sense to use theoretical values to estimante hindrance factors for
spontaneous fission.
Therefore final decision if the terminating odd - odd nuclei may fission directly must be left to future experiments.
Techniques to identify EC decay have been presented at the beginnig of this section. But it has to be kept in mind that the
identification mentioned was performed for isotopes with production cross sections of some nanobarn, while in
the considered SHE region production rates are roughly three orders of magnitude lower. So technical effort to
increase production rates and detection efficiencies are required to perform successful experiments in that direction.
From physics side such experiments may cause big problems as seen from fig. 30, where experimental halflives of
266,268,270Db (red circles) are compared with the calculated EC halflives from [166] (black squares).
Calculated SF halflives from [168] for the even-even EC - daughters 266,268,270Rf, are in the
range of 20 ms - 20 s, so the technique for identification should be applicable.
The situation could be, however, unfavourable if there is a similar situation as in the case of 266Sg, where the
experimental SF halflife is a factor of 165 longer than the predicted one. These modified SF halflives are shown in
fig. 30 by the margenta triangles.
For comparison in fig. 30 also the expected decay halflives for 266,268Db based on the Eα values
calculated from the mass predictions of [18]
(Eα(266Db) = 7242 keV, Eα(268Db) = 7076 keV) are presented.
As for 270Db a value of Eα = 7721 keV is predicted in [18], which is roughly 200 keV
lower than the experimental value of Eα = 7.900.03 MeV, conservatively 300 keV higher values were taken for
266,268Db. The halflives were calculated using the formula from [98]. Results are shown as blue dots in fig. 30. For
270Db the experimental - decay half-life is given. Evidently the values for 266,268Db are still about an order
of magnitude higher, so non-observation of decay of these isotopes so far is in-line with the expectations.
Another interesting feature is to identify candidates for EC - decay within the - decay chains. With respect to the
quite uncertain predictions of EC - halflives that task is not trivial. As the experimental EC halflives are longer than the
calculated ones for the lawrencium and dubnium isotopes (see fig. 29) one tentatively may assume that conditions are
similar for the heavier elements (it should be kept in mind that this item is not proven !). In other words, candidates for
EC decay are isotopes for which the experimental half-life is similar or even longer than the calculated [166] EC - half-life.
In figs. 31-34, the experimental and calculated EC halflives are compared for the known nuclei with Z 106. As seen
no EC decay can be expected for isotopes of elements of Z = 108, Z = 110, and Z = 114-118;
possible candidates are 285,286Nh (N=172,174), 283,285Cn (N=171,173), 280,281,282Rg (N=169,170,171), 270Bh (N=163), and
269Sg. It should, however, stressed that these isotopes are just ’candidates’.
An example for possibly having observed EC in decay chains are the ’short chains’ registered in irradiations of
243Am with 48Ca [123], denoted as B1 - B3. As a possible explantion the decay sequence
288Mc 284Nh 284Cn was given
in scenario 2. So far, this item is, however, is just an interesting feature, which has to be investigated thoroughly in future.
7.4 7.4 Spontaneous fission
Spontaneous fission is believed to finally terminating the charts of nuclei towards increasing proton numbers Z. The strong shell stabilization of nuclei in the vicinity of the spherical proton and neutron shells Z = 114 or Z = 120 and N = 172 or N = 184 leads also to high fission barriers and thus long fission halflives. Qualitatively these expections are in line with the experimental results. For all nuclei Z 114 so far only decay was observed, while for Z = 112 – 114 only for five nuclei 284,286Fl, 282,283,284Cn spontaneous fission was reported. The spontaneous fission halflives of the even-even nuclei 284,286Fl, 282,284Cn, 280Ds agree within two orders of magnitude, those for 284,286Fl even within one order of magnitude with the predictions of R. Smolanczuk et al. [168], which calculations also quite fairly reproduce the halflives of the even-even isotopes of rutherfordium (Z = 104), seaborgium (Z = 106), and hassium (Z = 108). These results indicate that the expected high stabilization against spontaneous fission in the vicinity of the spherical proton and neutron shells is indeed present. For further discussion of these items we refer to the review paper [167].
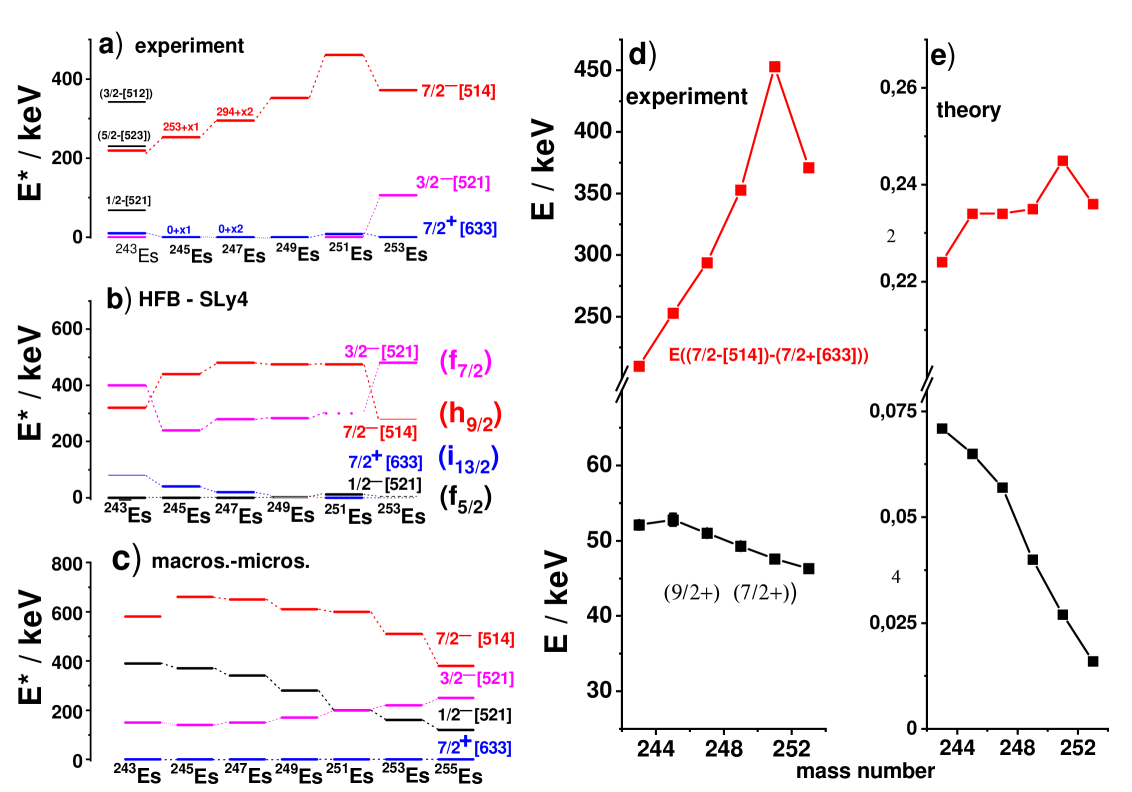
7.5 7.5 Systematics in nuclear structure - odd-mass einsteinium isotopes
Detailed information on nuclear structure of heaviest nuclei provide a wide field of information for testing nuclear models with respect to their predictive power. Presently the situation, however, is not very satisfying for at least three major reasons;
a) ’detailed’ decay studies using - spectroscopy are essentially only possible for nuclei with Z 107 due to low production rates;
b) for many isotopes only very few Nilsson levels have been identified, while the assignment is partly only tentative;
c) agreement between experimental data and results from theoretical calculations is in general rather poor.
In [150] experimental data are compared with results from theoretical calculations for N = 151 and N = 153 isotones of even-Z elements in the range Z = 94-106. Agreement in excitation energies of the Nilsson levels is often not better than a few hundred keV and also the experimentally established ordering of the levels is often not reproduced by the calculations. Thus,
for example, the existence of the low lying 5/2+[622] - isomers in the N = 151 isotones is not predicted by the calculations. These deficiencies, on the other hand, make it hard to trust in predictions of properties of heavier nuclei by these models.
In this study the situation is illustrated for the case of the odd-mass einsteinium isotopes (fig. 35). Experimentally only two Nilsson levels have been established in most of presented isotopes, namely 7/2+[633] and 7/2-[514]. In the heaviest isotopes, 251,253Es also the 3/2-[521] was assigned. While in 253,249Es 7/2+[633] was identified as
ground - state [169, 170], in case of 251Es the ground-state was assigned as 3/2-[521] [171].
For the lighter einsteinium isotopes the situation is unclear. The Nilsson levels 7/2+[633] and 7/2-[514] have been established from - decay studies of odd-mass mendelvium isotopes [151, 172]. However no ground-state assigment was made for 245,247Es as on the basis of the results for the heavier einsteinium isotopes as it could not be excluded, that the
7/2+[633] and 3/2-[521] are close in energy and may alter as ground-state. In a more detailed decay study of
247Md the 3/2-[521] level was identified as the ground-state in 243Es, while the 7/2+[633] is located at
E∗ = 10 keV [173]. In addition the 1/2-[521] level and also, tentatively, the 5/2-[523] and 3/2-[512] Nilsson levels were
identified in that study.
The experimental data are compared with theoretical calculations in figs. 35b und 35c. In fig. 35b the results from a self-consistent Hartree-Fock-Bogoliubov calculation using SLy4 force (HBF - SLy4) are presented (data taken from [172]), in fig. 35c the results from a macroscopic - microscopic calculation [174]. The HBF - SLy4 calculations only predict the ground-state of 253Es correctly, for 251Es they result in 7/2+[633] as for 253Es. For the lighter isotopes
the ground-state is predicted as 1/2-[521], while the 3/2-[521], for which strong experimental evidence exists that it is ground-state or located close to the ground-state, is located at E∗ 400 keV, except for 253Es. The macroscopic - microscopic calculations, on the other side, predict 7/2+[633] as a low lying level but the 3/2-[521] one in an excitation energy range of E∗ (400-600) keV.
As noted in fig. 35b, the 3/2-[521], 7/2-[514] and 7/2+[633] Nilsson levels arise from the f7/2, h9/2 and i13/2 subshells located below the shell gap at Z = 114, while the 1/2-[521] stems from the f5/2 subshell located above it [161]. The 3/2-[521], 7/2-[514] and 1/2-[521] decrease in energy at increasing deformation, while the 7/2+[633] increases in energy. At a deformation 0.3 where a shell gap of
1 MeV is expected at Z = 100, the 3/2-[521] and 7/2+[633] states are located below the predicted shell gap, while the 7/2-[514] and 1/2-[521] are located above it. From this side one can expect that the energy difference E = E(7/2-[514]) - E(7/2+[633]) gives some information about the size of the shell gap. Indeed the experimental energy difference is lower than predicted by the HFB-SLy4 calculations (typically 400 keV) and
by the macroscopic - microscopic calcultions (typically 600 keV) as seen from figs. 35a - 35c, which hints to a lower shall gap as preticted. Indeed this could explain the non-observation of a discontinuity in the two-proton binding energies and the Qα - values when crossing Z = 100 (see sect. 7.2).
Two more interesting features are evident: in figs. 35d and 33e (upper panel) the energy difference E = E(7/2-[514]) - E(7/2+[633] is compared with the quadrupole deformation parameter , while in the lower panels the energy difference of the 7/2-[514] bandhead and the 9/2- rotational level is compared with the
hexadecapole deformation parameter , both taken from [18]. Both, the experimental energy differences E = E(7/2-[514]) - E(7/2+[633]) (not so evident in the calculation) and the values show a pronounced maximum at N = 152, while as well as the energy differences E(9/2-) - E(7/2- as the - values decrease at increasing mass number or increasing neutron number, respectively.
7.6 7.6 Nuclear structure predictions for odd-odd nuclei - exemplified for 250Md and 254Lr

Predictions of level schemes in heaviest odd-odd nuclei are scarce so far. Only for a couple of cases calculations have
been performed so far. Thus we will discuss here only two cases, 250Md and 254Lr for which recently new results
have been reported [60].
The ground-state of 250Md was predicted by Sood et al.[175] as Kπ = 0- and a long-lived isomeric state
with spin and parity Kπ = 7-
expected to decay primarily by emission or electron capture was predicted at E∗ = 8030 keV.
Recently a longlived isomeric state at E∗ = 123 keV was identified [60] in quite good agreement
with the calculations. However, no spin and parity asignments have be done for the groud state and the isomeric state.
The other case concerns 254Lr. Levels at E∗250 keV were recently calculated on the basis of a
’Two-Quasi-Particle-Rotor-Model’ [176]. The results
are shown in fig. 36. The ground-state is predicted as Kπ = 1+ and an isomeric state Kπ = 4+
is predicted at E∗75 keV. Recently an isomeric state at E∗ = 108 keV was
identified in 254Lr. Tentative spin and parity assigments are, however, different.
The ground-state was assigned as Kπ = 4+, the isomeric state as Kπ = 1- (see fig. 36). This
assignment was based on the assumed ground-state configuration Kπ = 0- of 258Db and the low -decay hindrance factor
HF30 for the transition 258gDb 254mLr
which rather favors Kπ = 1- than Kπ = 4+ as the latter configuration would require an angular momentum change
K = 3 and a change of the parity which requires a much larger hindrance factor (see sect. 7.1).
Here, however, two items should be considered:
a) the spin-parity assigmnent of 258Db is only tentative,
b) the calculations are based on the energies of low lying levels in the neighboring odd mass nuclei,
in the respecting case 253No (N = 151) and 253Lr (Z = 103). The lowest Nilsson
levels in 253No are 9/2-[734] for the ground-state and 5/2+[622] for a shortlived isomer at E∗ = 167 keV [126].
In 253Lr tentative assignments of the ground-state (7/2-[514]) and 1/2-[521]
for a low lying isomer are given in [125]. The energy of the isomer is experimentally not established, for the calculations a value
of 30 keV was taken [176]. It should be noted, however, that for the neighboring N = 152 isotope of lawrencium, 255Lr the ground-state had be determined as the Nilsson level 1/2-[521], while 7/2- was attributed to a low lying isomeric
state at E∗ = 37 keV [172]. Therefore, with respect to the uncertain starting conditions,
the results of the calculations although not in ’perfect agreement’ with the experimental results, are still
promising, and may be improved in future.
It should be noticed the that existence and excitation energy of the isomeric state in 254Lr has been confirmed
by direct mass measurents at SHIPTRAP [177], and there is some confidence that spins can be determined in near future
by means of laser spectroscopy using the RADRIS technique [178].
7.7 7.7 Attempts to synthesize elements Z = 119 and Z = 120 - Quest for the spherical proton shell at Z = 114 or Z = 120
Although elements up to Z = 118 have been syntheszied so far, the quest for the location of the spherical ’superheavy’ proton and neutron shells is still open. Indeed synthesis of elements up Z = 118 in 48Ca induced reactions show a maximum in the cross sections at Z = 114, which might be seen as an indication of a proton shell at Z = 114 (see fig. 16). Such an interpretation, however, is not unambiguous since a complete understanding of the evaporation residue (ER) production process (capture of projectile and target nuclei, formation of the compund nucleus, deexcitation of the compound nucleus, competition between particle emission and fission) is required to draw firm conclusions. Indeed V.I. Zagebaev and W. Greiner [179] could reproduce cross-sections for elements Z = 112 to Z = 118 produced in 48Ca induced reaction quite fairly, but evidently a main ingredient of their calculations was quite uncertain. They approximated fission barriers as the sum of the ’shell effects’ (according to [18]) and a ’zero-point energy’ of 0.5 MeV, which resulted in quite different values than obtained from ’direct’ fission barrier calculations (see e.g. [180, 181, 182]). Due to these uncertainties measured cross sections are not a good argument identification for a proton shell at Z = 114. Indeed on the basis of the results on decay studies of 286,288Fl and their daughter products Samark-Roth et al. [108] claimed that there is not a real indication for a poton shell at Z = 114. Indirect evidence that the proton shell may not be located at Z = 114 but rather at Z = 120 comes from a recent decay study of 247Md, where the 1/2-[521] level was located at E∗ = 6811 keV [173]. As shown in fig. 35b, the Nilsson - levels 3/2-[521], 7/2+[633], and 7/2-[514] Nilsson levels stem from the 2f7/2, 1i13/2, and 1h9/2 sub shells, respectively, which are located below the shell gap at Z = 114, while the 1/2-[521] level stems from the 2f5/2 sub shell located above the Z = 114 [161] shell gap. As seen in fig. 35 this level is predicted as the ground-state of 243Es by the HFB SLy4 - calculations (fig. 35b) predicting Z = 120 as proton shell, but as an excited level at E∗400 keV by the macroscipic-microscopic calculations (fig. 35c) predicting Z = 114 as proton shell. The low excitation energy of the 1/2-[521] level might thus be a hint, that the 2f5/2 sub-shell is lower in energy, and the enery difference E(2f5/2) - E(2f7/2) which is decisive for the occurence of the shell gap at Z = 114 or at Z = 120 [20], i.e. that the proton shell indeed may be located at Z = 120.
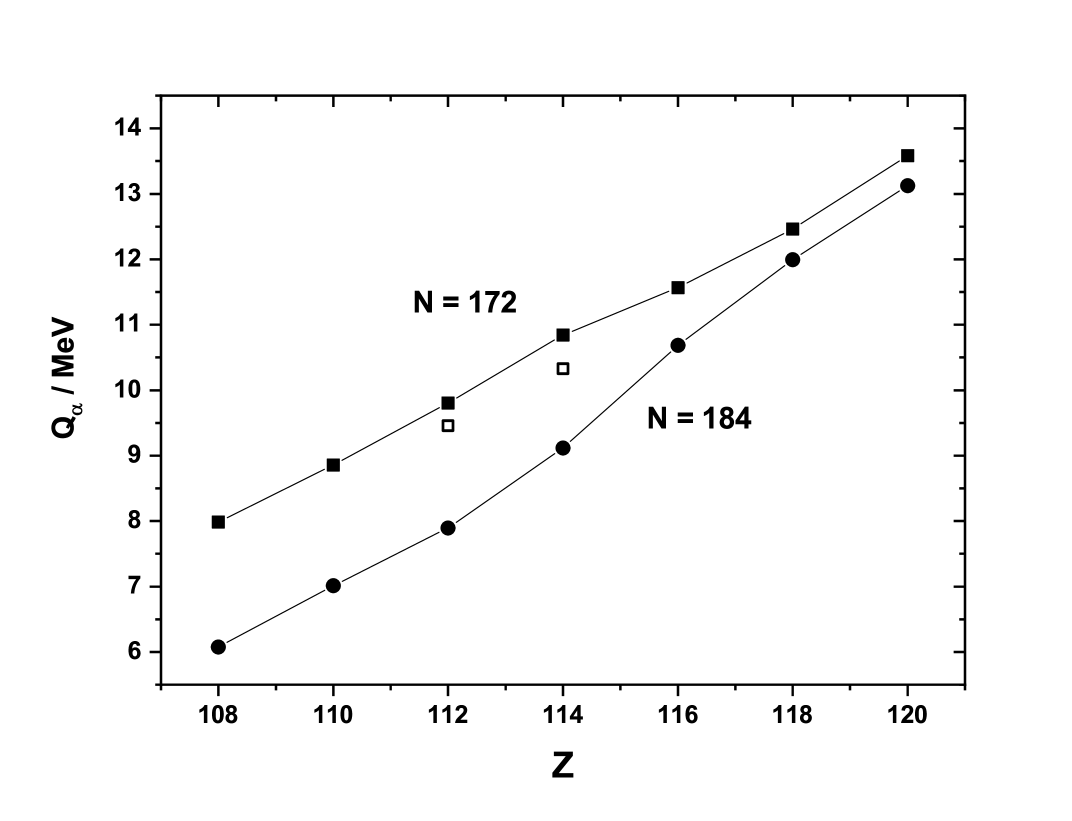
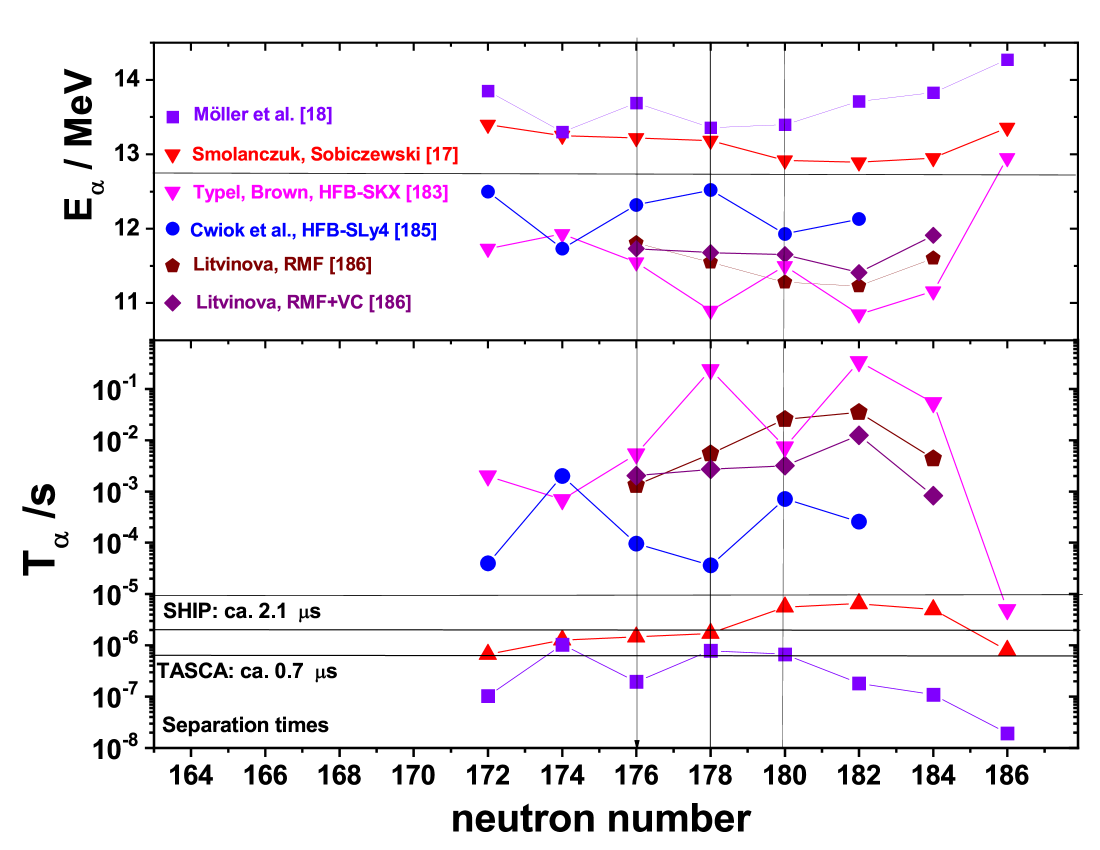
From this point of view it rather seems useful to take the decay properties as a signature for a shell, as discussed in sect. 7.2. However, one has to note that strictly spoken even - even nuclei have to be considered since only for those a ground-state to ground-state transition can be assumed a priori as the strongest decay line. However one is presently not only confronted with the lack of experimental data. The situation is shown in fig. 37 where predicted Qα values for the N = 172 and N = 184 isotones are presented. Different to the situation at Z = 82 (see fig. 28) calculations of Smolanczuk et al. [17] predicting Z = 114 as proton shell
result only in a rather small change in decrease of Qα values when crossing the shell, even at the predicted neutron shell at N = 184 compared to the heavier and lighter isotones.
At N = 172 there is practically no effect any more, one gets a more or less straight decrease of the
Qα values. So probably Qα values could not be
applied for identifying Z = 114 as a proton shell even if more data would be available.
A possibility to decide whether the proton shell is located Z = 114 or Z = 120 results from comparison of experimental
Qα values and halflives with results from models predicting either Z = 114 or Z = 120. However, one has to consider a large straggling
of the predicted
values, so it is required to produce and to investigate nuclei in a region, where uncertainties of the predictions are
larger than the results from models predicting either Z = 114 or Z = 120 as proton shells.
An inspection of the different models shows that element 120 seems to be first one where the differences are so large that the quest of the proton shell can be
answered with some certainty.
The situation is shown in fig. 38, where predicted Qα values and calculated halflives are compared.
Despite the large straggling of the predicted energies and halflives there is seemingly a borderline at Eα = 12.75 MeV evident between models precting Z = 120 als proton shell [183, 184, 185, 186] and those predicting Z = 114 as proton shell [17, 18] while halflives 10-5 s hint to Z = 114, halflives 10-5 s to Z = 120 as proton shell. This feature makes synthesis of element 120 even more interesting than the synthesis of element 119. Suited reactions to produce an even-even isotope of element 120 seem 50Ti(249Cf,3n)296120 (N=176), 54Cr(248Cm,2n,4n)298,300120 (N=178,180). Expected cross-sections are, however small.
V.I. Zagrebaev and W. Greiner [187] predicted cross sections of 25 fb for 54Cr(248Cm,4n)298120 and a slightly higher
value of 40 fb for 50Ti(249Cf,3n)296120. So far only few experiments on synthesis of element 120 reaching cross sections limits
below 1 pb have been performed: 64Ni + 238U at SHIP, GSI with 0.09 pb [188], 54Cr + 248Cm at SHIP, GSI with 0.58 pb [97], 50Ti + 249Cf at TASCA, GSI with 0.2 pb [189], and 58Fe + 244Pu at DGFRS, JINR Dubna with 0.5 pb [190].
8 9. Challenges / Future
There are two major problems concerning the experimental techniques used in the investigation of superheavy elements.
The first is connected with the implantation of the reaction products into silicon detectors which are also used to measure
the -decay energy, conversion electrons and fission products. This simply means that, e.g. in the case of
decay not only the kinetic energy of the -particle is measured but also part of the recoil energy transferred by the particle to the residual nucleus. Due to the high ionisation density in the stopping process of the heavy residual nucleus and partial recombination of the charge carriers, typically only about one third of the recoil energy is measured
[61]. It results in energy shift of the -decay energy by 50 keV, which can be compensated by a proper calibration, and a deterioration of the energy resolution of the detector by typically 5 - 10 keV.
A second item is more severe. It is connected with populating excited levels in nuclei decaying promptly (with life-times of some s or lower) by internal conversion. In these cases energy summing of particles with conversion electrons (and also low energy X-rays and Auger electrons from deexcitation of the atomic shell) is observed [62]. The influence on the measured spectra is manifold, depending also on the energy of the conversion electrons; essentially are broadening and shifting the energies often washing out peak structures of decay pattern. An illustrative case is decay of 255No
which has been investigated using the implantation technique [153] and the He-jet technique with negligible probability of energy summing [154]. Specifically, different low lying members of the same rotational are populated, which decay by practically completely converted M1 or E2 transitions towards the band-head. These fine structures of the decay spectrum cannot be resolved using the implantation technique (see also [150]). Although in recent years successful attempts have been untertaken to model those influences by GEANT - simulations [65], direct measurements are preferred from experimental side. First steps in this direction have been recently undertaken by coupling an ion trap [191] or an MRTOF - system [192] to a recoil separator and the BGS + FIONA system, which was used
to directly measure mass number of 288Mc [193].
Also mass number measurement is an interesting feature, the ultimate goal is a save Z and A identification of a nuclide. This can be
achieved via high precision mass measuremts, allowing for clear isobaric separation (ion traps and possibly also MRTOF - systems).
Presently limits are set by the production rate.
The most direct method to determine the atomic number of a nucleus is measuring characteristic X-rays in prompt or delayed coincidence with its radioactive decay.
Such measurements are, however, a gamble as they need both, highly K - converted transitions (M1, M2) with transition energies above the K - binding energy.
The latter is not a trivial problem as energies raise steadily and are in the order of 180 keV at Z = 110.
Such measurements have been applied so far up bohrium (Z = 107 [158]). In the region of superheavy nuclei (Z 112) such attempts have been recently performed by D. Rudolph et al. [67] and J. Gates et al. [68] by investigating the decay chains starting from the odd-odd nucleus 288Mc (Z = 115), but no positive result was obtained.
Alternatively one can attempt to measure L - X-rays to have excess to lower energies and also to E2 transitions. Such measurement have been performed successfully
up to Z = 105 [194], but are more complicated due to the more complex structure of the L X-ray spectra.
An alternative method for X-ray identification is measuring the X-rays emitted during electron capture (EC) decay in delayed coincidence
with decay or spontaneous fission of the daughter nucleus. This technique has been recently for the first time successfully applied in the transactinide region [100], by measuring Kα and
Kβ X-rays from EC - decay of 258Db in delayed coincidence with spoantaneous fission and decay of the daughter nucleus 258Rf.
Application in the SHN region seems possible, problems connected with that technique are discussed in sect. 7.3.
REFERENCES
- [1] M. Göppert-Mayer, Phys. Rev. 74, 235 (1948).
- [2] O. Haxel, J.H.D. Jensen, H.E. Suess, Phys. Rev. 75, 1769 (1949).
- [3] A. Sobczewski, F.A. Gareev, B.N. Kalinkin, Phys. Lett. 22, 500 (1966).
- [4] H. Meldner, Arkiv för fysik 36, 593 (1967).
- [5] S.G. Nilsson, C.F. Tsang, A. Sobiczewski, Z. Szymanski, S. Wycech, C. Gustafson, I–L. Lamm, P. Möller, B. Nilsson, Nucl. Phys. A 131, 1 (1969).
- [6] S.G. Nilsson, J.R. Nix, A. Sobiczewski, Z. Szymanski, S. Wycech, C. Gustafson, P. Möller, Nucl. Phys. A 115, 545 (1968).
- [7] B. Fricke, W. Greiner, Physik in unserer Zeit 1, 21 (1970).
- [8] S. Agostinelli, J. Allison, K. Amako, J. Apostolakis, H. Ataujo, P. Arce, M. Asai, D. Axen, S. Banerjee, G. Barrand, F. Behner, L. Bellagamba, J. Boudreau, L. Briglia, A. Brunengo, H. Burkhardt, S. Chauvie, J. Chuma, R. Chytracek, G. Cooperman, G. Cosmo, P. Degtyarenko, A. Dell’Acqua, G. Pepaola, D. Dietrich, R. Enami, A. Feliciello, C. Ferguson, H. Fesefeldt, G,. Folger, F. Foppiano, A. Forti, S. Garelli, S. Giani, R. Giannitrapani, D. Gibin, J.J. Gomez Cadenas, I. Gonzalez, G. Gracia April, G. Greeniaus, W. Greiner, V. Grichine, A. Grossheim, S. Guatelli, P. Gumplinger, R. Hamamatsu, K. Hashimoto, H. Hasui, A. Heikkinen, A. Howard, V. Ivanchenko, A. Johnson, F.W. Jones, J. Kallenbach, N. Kanaya, M. Kawabata, Y. Kawabata, M. Kawaguti, S. Kelner, P. Kent, A. Kimura, T. Kodama, R. Kokoulin, M. Kossov, H. Kurashinge, E. Lamanna, T. Lampen, V. Lara, V. Lefebure, F. Lei, M. Liendl, W. Lockman, F. Longo, S. Magni, M. Maire, E. Medernach, K. Minamimoto, P. Mora de Freitas, Y. Morita, K. Murakami, M. Nagamatu, R. Nartallo, P. Nieminen, T. Nishimura, K. Ohtsubo, M. Okamura, S. O’Neale, Y. Oohata, K. Paech, J. Perl, A. Pfeiffer, M.G. Pia, F. Ranjard, A. Rybin, S. Sadilov, E. Di Salvo, G. Santin, T. Sasaki, N. Savvas, Y. Sawada, S. Scherer, S. Sei, V. Sirotenko, D. Smith, N. Starkov, H. Stoecker, J. Sulkimo, M. Takahata, S. Tanaka, E. Tcherniaev, E. Safai Tehrani, M. Tropeano, P. Truscott, H. Uno, L. Urban, P. Urban, M. Verderi, A. Walkden, W. Wander, H. Weber, J.P. Wellisch, T. Wenaus, D.C. Williams, D. Wright, T. Yamada, H. Yoshida, D. Zschiesche, Nucl. Instr. Meth. in Phys. Research A 506, 250 (2003).
- [9] Yu. Ts. Oganessian, A.V. Yeremin, A.G. Popeko, S.L. Bogomolov, G.V. Buklanov, M.L. Chelnokov, V.I. Chepigin, B.N. Gikal, V.A. Gorshkov, G.G. Gulbekian, M.G. Itkis, A.P. Kabachenko, A.Yu. Lavrentev, O.N. Malyshev, S. Rohac, R.N. Sagaidak, S. Hofmann, S. Saro, G. Giardina, K. Morita, Nature 400, 242 (1999).
- [10] Yu. Ts. Oganessian, V.K. Utyonkov, Yu.V. Lobanov, F.Sh. Abdullin, A.N. Polyakov, V. Shirokovsky, Yu.Ts. Tsyganov, G.G. Gulbekian, S.L. Bogomolov, B.N. Gikal, A.N. Metzentsov, S. Iliev, V.G. Subbotin, A.M. Sukhov, G.V. Buklanov, K. Subtic, M.G. Itkis, K.J. Moody, J.F. Wild, N.J. Stoyer, M.A. Stoyer, R.W. Lougheed, Phys. Rev. Lett. 83, 242 (1999).
- [11] F.P. Heßberger, ChemPhysChem., 14, 483 (2013).
- [12] R.C. Barber, P.J. Karol, H. Nakahara, E. Vardaci, E.W. Vogt, Pure Appl. Chem. 83, 1485 (2011).
- [13] P.J. Karol, R.C. Barber, B.M. Sherrill, E. Vardaci, T. Yamazaki, Pure Appl. Chem. 88, 139 (2016).
- [14] P.J. Karol, R.C. Barber, B.M. Sherrill, E. Vardaci, T. Yamazaki, Pure Appl. Chem. 88, 155 (2016).
- [15] C.F. von Weizsäcker, Z. Phys. 96, 461 (1935).
- [16] V.M. Strutinsky, Nucl. Phys. A 95 442 (1967).
- [17] R. Smolanczuk, A. Sobiczewski, Proc. EPS Conf. ’Low Energy Nuclear Dynamics’, St. Petersburg 1995, eds. Yu.Ts. Oganessian et al., World Scientific, Singapore, New Jersey, London, Hong Kong 1995, 313 (1995).
- [18] P. Möller, J.R. Nix, W.D. Myers, W.J. Swiatecki, At. Data and Nucl. Data Tables 59, 185 (1995).
- [19] K. Rutz, M. Bender, T. Bürvenich, T. Schilling, P.-G. Reinhard, J. Marhun, W. Greiner, Phys. Rev. C 56, 238 (1997).
- [20] M. Bender, P.-H. Heenen, P.-G. Reinhard, Rev. of Mod. Physics 75, 121 (2003).
- [21] M. Bender, K. Rutz, P.-G. Reinhard, J.A. Marhun, W. Greiner, Phys. Rev. C 60, 034304 (1999).
- [22] S. Cwiok, V.V. Pashkevich, J. Dudek, W. Nazarewicz, Nucl. Phys. A 410, 254 (1983).
- [23] P. Möller, G.A. Leander, J.R. Nix, Z. Phys. A 323, 41 (1986).
- [24] Z. Patyk, A. Sobiczewski, Phys. Lett. B 256, 307 (1991).
- [25] Z. Patyk, A. Sobiczewski, Nucl. Phys. A 533, 132 (1991).
- [26] G. Münzenberg, Nucl. Phys. A944, 5 (2015).
- [27] Yu. Ts. Oganessian, V.K. Utyonkov, Nucl. Phys. A944, 62 (2015).
- [28] G. Münzenberg, W. Faust, S. Hofmann, P. Armbruster, K. Güttner, H. Ewald, Nucl. Instr. Meth. 161, 65 (1979).
- [29] F.P. Heßberger, G. Münzenberg, S. Hofmann, W. Reisdorf, K.H. Schmidt, H.J. Schött, P. Armbruster, R. Hingmann, B. Thuma, D. Vermeulen, Z. Phys. A 321, 317 (1985).
- [30] F.P. Heßberger, G. Münzenberg, S. Hofmann, Y.K. Agarwal, K. Poppensieker, W. Reisdorf, K.H. Schmidt, J.R.H. Schneider, W.F.W. Schneider, H.J. Schött, P. Armbruster, B. Thuma, C.-C. Sahm, D. Vermeulen, Z. Phys. A 322, 557 (1985).
- [31] G. Münzenberg, S. Hofmann, F.P. Heßberger, W. Reisdorf, K.H. Schmidt, J.R.H. Schneider, P. Armbruster, C.-C. Sahm, B. Thuma, Z. Phys. A 300, 107 (1981).
- [32] A. Ghiorso, S. Yashita, M.E. Leino, L. Frank, J. Kalnins, P. Armbruster, J.-P. Dufor, P.K. Lemmerts, Nucl. Instr. Meth. A 269, 192 (1988).
- [33] A. Ghiorso, J. of Radioanalytical and Nucl. Chem. 124, 407 (1988).
- [34] V. Ninov, P. Armbruster, F.P. Heßberger, S. Hofmann, G. Münzenberg, Y. Fujita, M. Leino, A. Lüttgen, Nucl. Instr. Meth. in Phys. Research A 357, 486 (1995).
- [35] M. Leino, J. Äystö, T. Enqvist, P. Heikkinen, A. Jokinen, M. Nurmia, A. Ostrowski, W.H. Trzaska, J. Uusitalo, P. Armbruster, V. Ninov, Nucl. Instr. Meth. in Phys. Research B 99, 653 (1995).
- [36] V. Ninov, K.E. Grgorich, C.A. McGrath, Proc. ’Exotic Nuclei and Atomic Masses’ (ENAM98), eds. B.M. Sherrill, D.J. Morrissey, C.A. Davids, American Institute of Physics, Widbuy, New York, 704 (1998).
- [37] Yu.A. Lazarev, Yu.V. Lobanov, A.N. Menzensev, Yu.Ts. Oganessian, V.G. Subbotin, V.K. Utyonkov, F.Sh. Abdullin, V.V. Bechterev, S. Iliev, I.V. Kolesov, A.N. Polyakov, I.M. Sedhyk, I.V. Shirokovsky, A.M. Sakhov, Yu.Ts. Tsyganov, V.E. Zuchko, Proc. Internat. School-Seminar on Heavy Ion Physics Vol. 2, eds. Yu.Ts. Oganessian, Yu.E. Penionzkhevich, R. Kalpachieva, Joint Institute of Nuclear Research, Dubna, 497 (1993).
- [38] K. Morita, A. Yoshita, T.T. Inamura, M. Koizumi, T. Nomura, M. Fujioka, T. Shinonzuka, M. Miyatake, K. Sueki, H. Kudo, Y. Nagai, T. Toriyama, K. Yoshimura, Y. Hatsukawa, Nucl. Instr. Meth. in Phys. Research B 70, 220 (1992).
- [39] T.Y. Zhang et al., Nucl. Instr. Meth. in Phys. Research B 317, 315 (2013).
- [40] A. Semchenkov, W. Brüchle, E. Jäger, E. Schimpf, M. Schädel, C. Mühle, F. Klos, A. Türler, A. Yakushev, A. Belov, T.Belykova, M. Karpakova, V. Kukhitin, E. Lanzin, S. Sytchevsky, Nucl. Instr. Meth. in Phys. Research B 266, 4153 (2008).
- [41] K.H. Schmidt, P. Armbruster, W. Faust, S. Hofmann, G. Münzenberg, W. Reisdorf, H.-G. Clerc, W. Lang, D. Vermeulen, H. Ewald, K. Güttner, Z. Phys. A 284, 431 (1978).
- [42] S. Hofmann, G. Münzenberg, F.P. Heßberger, H.J. Schött Nucl. Instr. Meth. in Phys. Research 223, 312 (1984).
- [43] F.P. Heßberger, P. Armbruster, K.D. Hildenbrand, S. Hofmann, G. Münzenberg, W. Reisdorf, K.H. Schmidt, J.R.H. Schneider, W.F.W. Schneider, GSI Annual Report 1981, GSI 82-1, 223 (1982).
- [44] S. Hofmann, V. Ninov, F.P. Heßberger, P. Armbruster, H. Folger, G. Münzenberg, H.J. Schött, A.G. Popeko, A.V. Yeremin, A.N. Andreyev, S. Saro, R. Janik, M. Leino, Z. Phys. A 350, 277 (1995).
- [45] D. Ackermann, A.K. Mistry, F.P. Heßberger, B. Andel, S. Antalic, M. Block, L. Caceres, P. Chhetri, F. Dechery, Ch. Droese, Ch.E. Düllmann, F. Giacoppo, J. Hoffmann, O. Kaleja, O. Kamalou, N. Kurz, J. Khuyagbaatar, R.R. Mändl, T. Murböck, M. Laatiaoui, J. Maurer, O. Mosat, J. Piot, S. Raeder, H. Savajols, O. Sorlin, Ch. Stodel, J.C. Thomas, M. Vostinar, P. Wieczorek, A. Yakushev, Nucl. Instr. Meth. in Phys. Research nn, nn (2018) (https://doi.org.10.1016/j.nima.2018.01096).
- [46] R.D. Page et al. Nucl. Instr. Meth. in Phys. Research B 204, 634 (2003).
- [47] K. Hauschild, A.V. Yeremin, O. Dorveaux, A. Lopez-Martens, A.V. Belozerov, Ch. Briancon, M.I. Chelnokov, V.I. Chepigin, S.A. Garcia-Santamaria, V.A. Gorshkov, F. Hanappe, A.P. Kabachenko, A. Korichi, O.N. Malyshev, Yu.Ts. Oganessian, A.G. Popeko, N. Rowley, A.V. Shutov, L. Stuttge, A.I. Svirikhin, Nucl. Instr. Meth. in Phys. Research A 560, 388 (2006).
- [48] L.-L. Andersson, D. Rudolph, P. Gobulev, R.-D. Herzberg, R. Hoischen, E. Merchan, D. Ackermann, C.E. Düllmann, K. Eberhardt, J. Even, J. Gerl, F.P. Heßberger, E. Jäger, J. Khuyagbaatar, I. Kojouharov, J.V. Kratz, J. Krier, N. Kurz, W. Prokopowicz, M. Schädel, H. Schaffner, B. Schausten, E. Schimpf, A. Semchenkov, A. Türler, H.-J. Wollersheim, A. Yakushev, P. Thörle-Pospiech, W. Hartmann, A.Hübner, B. Lommel, B. Kindler, J. Steiner Nucl. Instr. Meth. in Phys. Research A 662, 164 (2010).
- [49] D. Ackermann, Ch. Theisen, Phys. Scr. 92, 083002 (2017).
- [50] D. Marx, F. Nickel, G. Münzenberg, K. Güttner, H. Ewald, W. Faust, S. Hofmann, H.J. Schött, Nucl. Instr. Meth. 163, 15 (1979).
- [51] V.I. Zagrebaev, W. Greiner, Phys. Rev. C 83, 044618 (2011).
- [52] V.I. Zagrebaev, W. Greiner, Phys. Rev. C 87, 034608 (2013).
- [53] J.V. Kratz, M. Schädel, H.W. Gäggeler, Phys. Rev. C 88, 054615 (2013).
- [54] F.P. Heßberger, S. Antalic, D. Ackermann, S. Heinz, S. Hofmann, J. Khuyagbaatar, B. Kindler, I. Kojouharov, B. Lommel, R. Mann, Eur. Phys. J. A43, 175 (2010).
- [55] A. Ghiorso, ’Actinides in Perspective’ ed. M. Edelstein, Pergamon Press Pacific Grove, 23 (1982).
- [56] K.-H. Schmidt, W. Faust, G. Münzenberg, H.-G. Clerc, W. Lang, K. Pielenz, D. Vermeulen, H. Wohlfahrt, H. Ewald, K. Güttner, Nucl. Phys. A 318, 253 (1979).
- [57] S. Hofmann, W. Faust, G. Münzenberg, W. Reisdorf, P. Armbruster, K. Güttner, H. Ewald, Z. Phys. A 291, 53 (1979).
- [58] L.C. Northcliffe, R.F. Shilling, Nucl. Data Tables A 7, 233 (1970).
- [59] S. Hofmann, S. Heinz, R. Mann, J. Maurer, J. Khuyagbaatar, D. Ackermann, S. Antalic, W. Barth, M. Block, H.G. Burkhard, V.F. Comas, L. Dahl, K. Eberhardt, J. Gostic, R.A. Henderson, J.A. Heredia, F.P. Heßberger, J.M. Kenneally, B. Kindler, I. Kojouharov, J.V. Kratz, R. Lang, M. Leino, B. Lommel, K.J. Moody, G. Münzenberg, S.L. Nelson, K. Nishio, A.G. Popeko, J. Runke, S. Saro, D.A. Shaughnessy, M.A. Stoyer, P. Thörle-Pospiech, K. Tinschert, N. Trautmann, J. Uusitalo, P.A. Wilk, A.V. Yeremin Eur. Phys. J. A 48:62 (2012).
- [60] M. Vostinar, F.P. Heßberger, D. Ackermann, B. Andel, S. Antalic, M. Block, Ch. Droese, J. Even, S. Heinz, Z. Kalaninova, I. Kojouharov, M. Laatiaoui, A.K. Mistry, J. Piot, H. Savajols, Eur. Phys. J. A 55:17 (2019).
- [61] S. Hofmann, G. Münzenberg, K. Valli, F. Heßberger, J.R.H. Schneider, P. Armbruster, B. Thuma, Y. Eyal, GSI Scientific Report 1981, GSI 82-1, 241 (1982)
- [62] F.P. Heßberger, S. Hofmann, G. Münzenberg, K.H. Schmidt, P. Armbruster, R. Hingmann, Nucl. Instrum. Meth. In Physics Research A 274, 522 (1989).
- [63] F.P. Heßberger, S. Hofmann, D. Ackermann, S. Antalic, B. Kindler, I. Kojouharov, P. Kuusiniemi, M. Leino, B. Lommel, R. Mann, K. Nishio, A.G. Popeko, B. Sulignano, S. Saro, B. Streicher, M. Venhart, A.V. Yeremin, Eur. Phys. J. A 30 561 (2006).
- [64] T. Kibeti, T.W. Burrows, M.B. Trzhaskovskaya, P.M. Davidson, C.W. Nestor, Jr., Nucl. Instr. and Meth. A 589, 202 (2008).
- [65] F.P. Heßberger, S. Antalic, D. Ackermann, Z. Kalaninova, S. Heinz, S. Hofmann, B. Streicher, B. Kindler, I. Kojouharov, P. Kuusiniemi, M. Leino, B. Lommel, R. Mann, K. Nishio, S. Saro, B. Sulignano, M. Venhart, Eur. Phys. J. A 48:75 (2012).
- [66] Yu.Ts. Oganessian, F.Sh. Abdullin, S.N. Dmitriev, J.M. Gostic, J.H. Hamilton, R.A. Henderson, M.G. Itkis, K.J. Moody, A.N. Polyakov, A.V. Ramayya, J.B. Roberto, K.P.Rykaczewski, R.N. Sagaidak, D.A. Shaughnessy, I.V. Shirokovsky, M.A. Stoyer, N.J. Stoyer, V.G. Subbotin, A.M. Sukhov, Yu.S. Tysganov, V.K. Utyonkov, A.A. Voinov, G.K.Vostokin, Phys. Rev. C 87, 014302 (2013).
- [67] D. Rudolph, U. Forsberg, P. Golubev, L.G. Sarmiento, A. Yakushev, L.-L. Andersson, A. Di Nitto, Ch. E. Düllmann, J.M. Gates, K.E. Gregorich, C.J. Gross, F.P. Heßberger, R.-D. Herzberg, J. Khuyagbaatar, J.V. Kratz, K. Rykaczewski, M. Schädel, S. Aberg, D. Ackermann, M. Block, H. Brand, B.G. Carlsson, D. Cox, X. Derkx, K. Eberhardt, J. Even, C. Fahlander, J. Gerl, E. Jäger, B. Kindler, J. Krier, I. Kojouharov, N. Kurz, B. Lommel, A. Mistry, C. Mokry, H. Nitsche, J.P. Omtvedt, P. Papadakis, I. Ragnarsson, J. Runke, H. Schaffner, B. Schausten, P. Thörle-Pospiech, T. Torres, T. Traut, N. Trautmann, A. Türler, A. Ward, N. Wiehl, Phys. Rev. Lett. 111, 112502 (2013).
- [68] J.M. Gates, K.E. Gregorich, O.R. Gothe, E.C. Uribe, G.K. Pang, D.L. Bleuel, M. Block, R.M. Clark, C.M. Campell, H.L. Crawford, M. Cromaz, A. Di Nitto, Ch. E. Düllmann, N.E. Esker, C. Fahlander, P. Fallon, R.M. Farjadi, U. Forsberg, J. Khuyagbaatar, W. Loveland, A.O. Macchiavalli, E.M. May, P.R. Mudder, D.T. Olive, A.C. Rice, J. Rissanen, L.G. Sarmiento, J.A. Shusterman, M.A. Stoyer, A. Wiens, A. Yakushev, H. Nitsche, Phys. Rev. C 92, 021301(R) (2015).
- [69] G. Münzenberg, P. Armbruster, S. Hofmann, F.P. Heßberger, H. Folger, J.G. Keller, V. Ninov, K. Poppensieker, A.B. Quint, W. Reisdorf, K.-H. Schmidt, J.R.H. Schneider, H.-J. Schött, K. Sümmerer, I. Zychor, M.E. Leino, D. Ackermann, U. Gollerthan, E. Hanelt, W. Morawek, D. Vermeulen, Y. Fujita, T, Schwab, Z. Phys. A 333, 163 (1989).
- [70] D.H. Wilkinson, A.H. Wapstra, I. Ulehla, R.C. Barber, N.N. Greenwood, A. Hrynkiewiecz, Y.P. Jeannin, M. Lefort, M. Sakai (TWR members), Pure and Applied Chemistry 65, 1757 (1993).
- [71] G. Münzenberg, P. Armbruster, H. Folger, F.P. Heßberger, S. Hofmann, J. Keller, K. Poppensieker, W. Reisdorf, K.-H. Schmidt, H.-J. Schött, M.E. Leino, R. Hingmann, Z. Phys. A 317, 235 (1984).
- [72] G. Münzenberg, P. Armbruster, G. Berthes, H. Folger, F.P. Heßberger, S. Hofmann, K. Poppensieker, W. Reisdorf, B. Quint, K.-H. Schmidt, H.-J. Schött, K. Sümmerer, I. Zychor, M.E. Leino, U. Gollerthan, E. Hanelt, Z. Phys. A 334, 489 (1986).
- [73] G. Münzenberg, P. Armbruster, F.P. Heßberger, S. Hofmann, K. Poppensieker, W. Reisdorf, J.H.R. Schneider, W.F.W. Schneider, K.-H. Schmidt, C.-C. Sahm, D. Vermeuelen, Z. Phys. A 324, 489 (1986).
- [74] G. Münzenberg, W. Reisdorf, S. Hofmann, Y.K. Agarwal, F.P. Heßberger, K. Poppensieker, J.R.H. Schneider, W.F.W. Schneider, K.-H. Schmidt, H.-J. Schött, P. Armbruster, C.-C. Sahm, D. Vermeuelen, Z. Phys. A 315, 145 (1984).
- [75] G. Münzenberg, S. Hofmann, F.P. Heßberger, H. Folger, V. Ninov, K. Poppensieker, A.B. Quint, W. Reisdorf, H.-J. Schött, K. Sümmerer, P. Armbruster, M.E. Leino, D. Ackermann, U. Gollerthan, E. Hanelt, W. Morawek, T.Schwab, A. Türler, Z. Phys. A 330, 435 (1988).
- [76] S. Hofmann, F.P. Heßberger, V. Ninov, P. Armbruster, G. Münzenberg, C. Stodel, A.G. Popeko, A.V. Yeremin, S. Saro, M. Leino, Z. Phys. A 358, 377 (1997).
- [77] V, Ninov, K.E. Gregorich, W. Loveland, A. Ghioro, D.C. Hoffmann, D.M. Lee, H. Nitsche, W.J. Swiatecki, U.W. Kirbach, C.A. Laue, J.L. Adams, J.B. Patin, D.A. Shaughnessy, D.A. Strellis, P.A. Wilk, Phys. Rev. Lett. 83, 1104 (1999).
- [78] V, Ninov, K.E. Gregorich, W. Loveland, A. Ghioro, D.C. Hoffmann, D.M. Lee, H. Nitsche, W.J. Swiatecki, U.W. Kirbach, C.A. Laue, J.L. Adams, J.B. Patin, D.A. Shaughnessy, D.A. Strellis, P.A. Wilk, Phys. Rev. Lett. 89, 039901 (2002).
- [79] P.J. Karol, H. Nakahara, B.W. Petley, E. Vogt, Pure Appl. Chem. 73, 959 (2001).
- [80] S. Hofmann, V. Ninov, F.P. Heßberger, P. Armbruster, H. Folger, G. Münzenberg, H.J. Schött, A.G. Popeko, A.V. Yeremin, A.N. Andreyev, S. Saro, R. Janik, M. Leino, Z. Phys. A 350, 281 (1995).
- [81] R.B. Firestone, S.Y. Frank Chu, V.S. Shirley, C.M. Baglin, J. Zipkin, Table of Isotopes, 8th Edition, (John Wiley Sons, Inc. New York, Chichester, Brisbane, Toronto, Songapre, 1996).
- [82] S. Hofmann, F.P. Heßberger, D. Ackermann, G. Münzenberg, S. Antalic, P. Cagarda, B. Kindler, J. Kojouharova, M. Leino, B. Lommel, R. Mann, A.G. Popeko, S. Reshitko, S. Saro, J. Uusitalo, A.V. Yeremin, Eur. Phys. J. A 14, 147 (2002).
- [83] P.J. Karol, H. Nakahara, B.W. Petley, E. Vogt, Pure Appl. Chem. 75, 1601 (2003).
- [84] K. Morita, K. Morimoto, D. Kaji, H. Haba, E. Ideguchi, J.C. Peter, R. Kanungo, K. Katori, H. Kuora, H. Kudo, T. Ohnishi, A. Ozawa, T. Suda, K. Sueki, I. Tanihata, H. Xu, A.V. Yeremin, A. Yoneta, A. Yoshida, Y. Zhao, T. Zheng, S. Goto, F. Tokana, Journ. Phys. Soc. of Japan 73, 1738 (2004).
- [85] C.M. Folden III, K.E. Gregorich, Ch. Düllmann, H. Mahmudi, G.K, Pang, J.M. Schwantes, R. Sudowne, P.M. Zielinski, H. Nitsche, D.C. Hoffman, Phys. Rev. Lett. 93, 212702 (2004).
- [86] S. Hofmann, V. Ninov, F.P. Heßberger, P. Armbruster, H. Folger, G. Münzenberg, H.J. Schött, A.G. Popeko, A.V. Yeremin, S. Saro, R. Janik, M. Leino, Z. Phys. A 354, 229 (1996).
- [87] J. Dvorak, W. Brüchle, M. Chelnokov, R. Dressler, Ch.E. Düllmann, K. Eberhardt, V. Gorshkov, E. Jäger, R, Krücken, A. Kuznetsov, Y. Nagame, F. Nebel, Z. Novackova, Z. Qin, M. Schädel, B. Schausten, E. Schimpf, A. Semchenkov, P. Thörle, A. Türler, M. Wegrzecki, B. Wierczinski, A. Yakushev, A. Yeremin, Phys. Rev. Lett. 100, 132503 (2008).
- [88] H. Haba, D. Kaji, H. Kikanaga, K. Morimoto, K. Morita, K. Ozeki, T. Sumita, Y. Yoneda, Y. Kasamatsu, Y. Komori, K. Ooe, A. Shinohara, Phys. Rev. C 83, 034602 (2011).
- [89] H. Haba, D. Kaji, Y. Kudou, K. Morimoto, K. Morita, K. Ozeki, R. Sakai, T. Sumita, Y. Yoneda, Y. Kasamatsu, Y. Komori, A. Shinohara, H. Kikunaga, H. Kudo, K. Nishio, K. Ooe, N. Sato, K. Tsukuda Phys. Rev. C 85, 024611 (2012).
- [90] F.P. Heßberger, priv. communication (2020)
- [91] K. Morita, K. Morimoto, D. Kaji, T. Akiyama, S. Goto, H. Haba, E. Ideguchi, H. Koura, H. Kudo, T. Ohnishi, A. Ozawa, T. Suda, K. Sueki, H. Xu, T. Yamaguchi, A. Yoneda, A. Yoshida, Y.-L. Zhao, RIKEN Accel. Prog. Rep. 39, 69 (2005).
- [92] K. Morita, K. Morimoto, D. Kaji, T. Akiyama, S. Goto, H. Haba, E. Ideguchi, K. Katori, H. Koura, H. Kudo, T. Ohnishi, A. Ozawa, T. Suda, K. Sueki, F. Tokonai, T. Yamaguchi, A. Yoneda, A. Yoshida, J. Phys. Soc. Jpn. 76, 043201 (2007).
- [93] R.C. Barber, H.W. Gäggeler, P.J. Karol, H. Nakahara, E. Vardaci, E. Vogt, Pure Appl. Chem. 81, 1331 (2009).
- [94] Ch.E. Düllmann, W. Brüchle, R. Dressler, K. Eberhardt, B. Eichler, R. Eichler, H.W. Gäggeler, T.N. Ginter, F. Glaus, K.E. Gregorich, D.C. Hoffman, E. Jäger, D.T. Jost, U.W. Kirbach, D.M. Lee, H. Nitsche, J.B. Patin, V. Pershina, D. Piguet, Z. Qin, M. Schädel, B. Schausten, E. Schimpf, H.-J. Scött, S. Soverna, R. Sudowe, P. Thörle, S.N. Timohkin, N. Trautmann, A. Türler, A. Vahle, G. Wirth, A.B. Yakushev, P.M. Zielinski, Nature 418, 69 (2002).
- [95] A. Türler, Ch.E. Düllmann, H.W. Gäggeler, U.W. Kirbach, A.B. Yakushev, M. Schädel, W. Brüchle, R. Dressler, K. Eberhardt, B. Eichler, R. Eichler, T.N. Ginter, F. Glaus, K.E. Gregorich, D.C. Hoffman, E. Jäger, D.T. Jost, D.M. Lee, H. Nitsche, J.B. Patin, V. Pershina, D. Piguet, Z. Qin, B. Schausten, E. Schimpf, H.-J. Scött, S. Soverna, R. Sudowe, P. Thörle, S.N. Timohkin, N. Trautmann, A. Vahle, G. Wirth, P.M. Zielinski, Eur. Phys. J. A 17, 505 (2003).
- [96] S. Hofmann, S. Heinz, R. Mann, J. Maurer, J. Khuyagbaatar, D. Ackermann, S. Antalic, W. Barth, M. Block, H.G. Burkhard, V.F. Comas, L. Dahl, K. Eberhard, R.A. Henderson, J.A. Heredia, F.P. Heßberger, J.M. Kenneally, B. Kindler, I. Kojouharov, J.V. Kratz, R. Lang, M. Leino, B. Lommel, K.J. Moody, G. Münzenberg, S.L. Nelson, K. Nishio, A.G.Popeko, J.Runke, S.Saro, D.A.Shaughnessy, M.A.Stoyer, P.Thörle-Pospiech, K. Tinschert, N. Trautmann, J. Uusitalo, P.A. Wilk, A.V. Yeremin, GSI Scientific Report 2010 PHN-NUSTAR-SHE-01, 197 (2011).
- [97] S. Hofmann, S. Heinz, R. Mann, J. Maurer, G. Münzenberg, S. Antalic, W. Barth, H.G. Burkhard, L. Dahl, K. Eberhardt, R. Grzywacz, J.H. Hamilton, R.A. Henderson, J.M. Kenneally, B. Kindler, I. Kojouharov, R. Lang, B. Lommel, K. Miernik, D. Miller, K.J. Moody, K. Morita, K. Nishio, A,G. Popeko, J.B. Roberto, J. Runke, K.P. Rykaczewski, S, Saro, C. Scheidenberger, H.J. Schött, D.A. Shaughnessy, M.A. Stoyer, P. Thörle-Pospiech, K. Tinschert, N. Trautmann, J. Uusitalo, A.V. Yeremin, Eur. Phys. J. A 52:180 (2016).
- [98] D.N. Poenaru, M. Ivanscu, M. Mazila, J. Physique Lett. 41, 589 (1980).
- [99] E. Rurarz, Act. Phys. Pol. B 14, 917 (1983).
- [100] F.P. Heßberger, S. Antalic, D. Ackermann, B. Andel, M. Block, Z. Kalaninova, B. Kindler, I. Kojouharov, M. Laatiaoui, B. Lommel, A.K. Mistry, J. Piot, M. Vostinar, Eur. Phys. J. A 52:328 (2016).
- [101] Yu.Ts. Oganessian, V.K. Utyonkov, Yu.V. Lobanov, F.Sh. Abdullin, A.N. Polyakov, I.V. Shirokovsky, Yu.S. Tsyganov, G.G. Gulbekian, S.L. Bogomolov, B.N. Gikal, A.N. Mezentsev, S. Iliev, V.G. Subbotin, A.M. Sukhov, O.V. Ivanov, G.V. Buklanov, K. Subotic, M.G. Itkis, K.J. Moody, J.F. Wild, N.J. Stoyer, M.A. Stoyer, R.W. Lougheed, Phys. Rev. C. 62, 041604(R) (2000).
- [102] Yu.Ts. Oganessian, V.K. Utyonkov, Yu.V. Lobanov, F.Sh. Abdullin, A.N. Polyakov, I.V. Shirokovsky, Yu.S. Tsyganov, G.G. Gulbekian, S.L. Bogomolov, B.N. Gikal, A.N. Mezentsev, S. Iliev, V.G. Subbotin, A.M. Sukhov,O.V. Ivanov, G.V. Buklanov, K. Subotic, M.G. Itkis, K.J. Moody, J.F. Wild, N.J. Stoyer, M.A. Stoyer, R.W. Lougheed, C.A. Laue, Ye.A. Karelin, A.N. Tatarinov, Phys. Rev. C. 63, 011301(R) (2001).
- [103] Yu.Ts. Oganessian, V.K. Utyonkov, Yu.V. Lobanov, F.Sh. Abdullin, A.N. Polyakov, I.V. Shirokovsky, Yu.S. Tsyganov, G.G. Gulbekian, S.L. Bogomolov, B.N. Gikal, A.N. Mezentsev, S. Iliev, V.G. Subbotin, A.M. Sukhov, A.A. Voinov, G.V. Buklanov, K. Subotic, V.I. Zagrebaev, M.G. Itkis, J.B. Patin, K.J. Moody, J.F. Wild, M.A. Stoyer, N.J. Stoyer, D.A. Shaughnessy, J.M. Keneally, R.W. Lougheed, Phys. Rev. C 69, 054607 (2004).
- [104] Yu.Ts. Oganessian, V.K. Utyonkov, Yu.V. Lobanov, F.Sh. Abdullin, A.N. Polyakov, I.V. Shirokovsky, Yu.S. Tsyganov, G.G. Gulbekian, S.L. Bogomolov, B.N. Gikal, A.N. Mezentsev, S. Iliev, V.G. Subbotin, A.M. Sukhov, A.A. Voinov, G.V. Buklanov, K. Subotic, V.I. Zagrebaev, M.G. Itkis, J.B. Patin, K.J. Moody, J.F. Wild, M.A. Stoyer, N.J. Stoyer, D.A. Shaughnessy, J.M. Keneally, R.W. Lougheed, Nucl. Phys. A 734, 109 (2004).
- [105] Yu. Ts. Oganessian, J. Phys. G. Nucl. Part. Phys. 34, R165 (2007)
- [106] J.M. Gates, Ch.E. Düllmann, M. Schädel, A. Yakushev, A. Türler, K. Eberhardt, J.V. Kratz, D. Ackermann, L.-L. Andersson, M. Block, W. Brüchle, J. Dvorak, H.G. Essel, P.A. Ellison, J. even, U. Forsberg, J. Gellanki, A. Gorshkov, R. Graeger, K.E. Gregorich, W. Hartmann, R.-D. Herzberg, F.P. Heßberger, D. Hild, A. Hübner, E. Jäger, J. Khuyagbaatar, B. Kindler, J. Krier, N. Kurz, S. Lahiri, D. Liebe, B. Lommel, M. Maiti, H. Nitsche, J.P. Omtvedt, E. Parr, D. Rudolph, J. Runke, H. Schaffner, B. Schausten, E. Schimpf, A. Semchenkov, J. Steiner, P. Thörle-Pospiech, J. Uusitalo, M. Wegrzecki, N. Wiehl, Phys. Rev. C 83, 054018 (2011).
- [107] D. Kaji, K. Morita, K. Morimoto, H. Haba, M. Asai, K. Fujita, Z. Gan, H. Geissel, H. Hasebe, S. Hofmann, M. Huang, Y. Komori, L. Ma, J. Maurer, M. Murakami, M. Takayama, F. Tokanai, T. Tanaka, Y. Wakabayashi, T. Yamaguchi, S. Yamaki, T. Yoshida, J. Phys. Soc. Jpn. 86, 034201 (2017).
- [108] A. Samark-Roth, D.M. Cox, D. Rudolph, L.G. Sarmiento, B.G. Carlsson, J.L. Egido, P. Golubev, J. Heery, A. Yakushev, S. Aberg, H.M. Albers, M. Albertsson, M. Block, H. Brand, T. Calverley, R. Cantemir, R.M. Clark, Ch.E, Düllmann, J. Eberth, C. Fahlander, U. Forsberg, J.M. Gates, F. Giacoppo, M. Götz, S. Götz, R.-D. Herzberg, Y. Hrabar, E. Jäger, D. Judson, J. Khuyagbaatar, B. Kindler, I. Kojouharov, J.V. Kratz, J. Krier, N. Kurz, L. Lens, J. Ljungberg, B. Lommel, J. Louko, C-.C. Meyer, A. Mistry, C. Mokry, P. Papadakis, E. Parr, J.L. Pore, I. Ragnarsson, J. Runke, M. Schädel, H. Schaffner, B. Schausten, D.A. Shaughnessy, P. Thörle - Pospiech, N. Trautmann, J. Uusitalo, Phys. Rev. Lett. 126, 032503 (2021).
- [109] Yu. Ts. Oganessian, A.V. Yeremin, G.G. Gulbekian, S.L. Bogomolov, V.I. Chepigin, B.N. Gikal, V.A. Gorshkov, M.G. Itkis, A.P. Kabachenko, V.B. Kutner, A.Yu. Lavrentev, O.N. Malyshev, A.G. Popeko, J. Rohac, R.N. Sagaidak, S. Hofmann, G. Münzenberg, M. Veselsky, S. Saro, N. Iwasa, K. Morita, Eur. Phys. J. A 5, 63 (1999)
- [110] Yu. Ts. Oganessian, A.V. Yeremin, A.G. Popeko, O.N. Malyshev, A.V. Bolozerov, G.V. Buklanov, M.L. Chelnokov, V.I. Chepigin, V.A. Gorshkov, S. Hofmann, M.G. Itkis, A.P. Kabachenko, B. Kindler, G. Münzenberg, R.N. Sagaidak, S. Saro, H.-J. Schött, B. Streicher, A.V. Shutov, A.I. Svirikin, G.K. Vostokin, Eur. Phys. J. A 19, 3 (2004)
- [111] Yu.Ts. Oganessian, V.K. Utyonkov, Yu.V. Lobanov, F.Sh. Abdullin, A.N. Polyakov, I.V. Shirokovsky, Yu.S. Tsyganov, G.G. Gulbekian, S.L. Bogomolov, B.N. Gikal, A.N. Mezentsev, S. Iliev, V.G. Subbotin, A.M. Sukhov, A.V. Voinov, G.V. Buklanov, K. Subotic, V.I. Zagrebaev, M.G. Itkis, J.B. Patin, K.J. Moody, J.F. Wild, M.A. Stoyer, N.J. Stoyer, D.A. Shaughnessy, J.M. Kenneally, R.W. Lougheed, R.I. Il’kaev, S.P. Vesnovskii , Phys. Rev. C 70, 06409 (2004).
- [112] S. Hofmann, D. Ackermann, S. Antalic, H.G. Burkhard, V.F. Comas, R. Dressler, Z. Gan, S. Heinz, J.A. Heredia, F.P. Heßberger, J. Khuyagbaatar, B. Kindler, I. Kojouharov, P. Kuusiniemi, M. Leino, B. Lommel, R. Mann, G. Münzenberg, K. Nishio, A.G. Popeko, S. Saro, H.J. Schött, B. Streicher, B. Sulignano, J. Uusitalo, M. Venhart, A.V. Yeremin, Eur. Phys. J. A 32, 251 (2007).
- [113] D. Kaji, K. Morimoto, H. Haba, Y, Wakabayashi, M. Takeyama, S. Yamaki, Y. Komori, S. Yanou, S, Goto, K. Morita, J. Phys. Soc. Jpn. 86, 085001 (2017)
- [114] L. Stavsetra, K.E. Gregorich, J. Dvorak, P.A. Ellison, I. Drgojevic, M.A. Garcia, H. Nitische, Phys. Rev. Lett. 103, 132502 (2009).
- [115] F.P. Heßberger, D. Ackermann, Eur. Phys. J. A 53:123 (2017).
- [116] Yu.Ts. Oganessian, F,Sh. Abdullin, C. Alexander, J. Binder, R.A. Boll, S.N. Dmitriev, J.Ezold, K. Felker, J.M. Gostic, R.K. Grzywacz, j.H. Hamilton, R.A. Henderson, M.G. Itkis, K. Miernik, D. Miller, K.J. Moody, A.N. Polyakov, A.V. Ranayya, J.B. Roberto, M.A. Ryaninin, K.P. Rykaczewski, R.N. Sagaidak, D.A. Shaughnessy, I.V. Shirokovsky, M.V. Shumeiko, M.A. Stoyer, N.J. Stoyer, V.G. Subbotin, A.M. Sukhov, Yu.S. Tsyganov, V.K. Utyonkov, A.A. Voinov, G.K. Vostokin, Phys. Rev. C 87, 054621 (2013).
- [117] Yu.Ts. Oganessian, F.Sh. Abdullin, C. Alexander, J. Binder, R.A. Boll, S.N. Dmitirev, J. Ezold, K. Felker, J.M. Gostic, R.K. Grzywacz, J.H. Hamilton, R.A. Henderson, M.G. Itkis, K. Miermik, D. Miller, K.J. Moody, A.N. Polyakov, A.V. Ramayya, J.B. Roberto, M.A. Ryabinin, K.P. Rykaczewski, R.N. Sagaidak, D.A. Shaughnessy, I.V. Shirokovsky, M.V. Shumeiko, M.A. Stoyerm N.J. Stoyer, V.G. Subbotin, A.M. Sukhov, Yu.S. Tsyganov, V.K. Utyonkov, A.A. Voinov, G.K. Vostokin, Phys. Rev. Lett. 109, 162501 (2012).
- [118] Yu.Ts. Oganessian, F.Sh. Abdullin, P.D. Bailey, D.E. Benker, M.E. Bennett, S.M. Dmitriev, J.G. Ezold, J.H. Hamilton, R.A. Henderson, M.G. Itkis, Yu.V. Lobanov, A.N. Metzentsev, K.J. Moody, S.L. Nelson, A.N. Polyakov, C.E. Porter, A.V. Ramayya, F.D. Riley, J.B. Roberto, M.A. Ryabinin, K.P. Rykaczewski, R.N. Sagaidak, D.A. Shaughnessy, I.V. Shirokovsky, M.A. Stoyer, V.G. Subbotin, R. Sudowe, A.M. Sukhov, Yu.S. Tysganov, V.K. Utyonkov, A.A. Voinov, G.K. Vostokin, P.A. Wilk, Phys. Rev. Lett. 104, 142502 (2010).
- [119] Yu.Ts. Oganessian, F.Sh. Abdullin, P.D. Bailey, D.E. Benker, M.E. Bennett, S.M. Dmitriev, J.G. Ezold, J.H. Hamilton, R.A. Henderson, M.G. Itkis, Yu.V. Lobanov, A.N. Metzentsev, K.J. Moody, S.L. Nelson, A.N. Polyakov, C.E. Porter, A.V. Ramayya, F.D. Riley, J.B. Roberto, M.A. Ryabinin, K.P. Rykaczewski, R.N. Sagaidak, D.A. Shaughnessy, I.V. Shirokovsky, M.A. Stoyer, V.G. Subbotin, R. Sudowe, A.M. Sukhov, R. Taylor, Yu.S. Tysganov, V.K. Utyonkov, A.A. Voinov, G.K. Vostokin, P.A. Wilk, Phys. Rev. C 83, 054315 (2011).
- [120] J. Khuyagbaatar, A. Yakushev, Ch.E. Düllmann, D. Ackermann, L.-L. Andersson, M. Asai, M. Block, R.A. Boll, H. Brand, D.M. Cox, M. Dasgupta, X. Derkx, A. Di Nitto, K. Eberhard, J. Even, M. Evers, C. Fahlander, U. Forsberg, J.M. Gates, N. Gharibyan, P. Gobulev, K.E. Gregorich, H.J. Hamilton, W. Hartmann, R.-D. Herzberg, F.P. Heßberger, D.J. Hinde, J. Hoffmann, R. Hollinger, A. Hübner, E. Jäger, B. Kindler, J.V. Kratz, J. Krier, N. Kurz, M. Laatiaoui, S. Lahiri, R. Lang, B. Lommel, M. Maiti, K. Miernik, S. Minami, A. Mistry, C. Mokry, H. Nitsche, J.P. Omtvedt, G.K. Pang, P. Papadakis, D. Renisch, J. Roberto, D. Rudolph, J. Runke, K.P. Rykaczewski, L.G. Sarmiento, M. Schädel, B. Schausten, A. Semchenkov, D.A. Shaughnessy, P. Steinegger, J. Steiner, E.E. Tereshatov, P. Thörle-Pospiech, K. Tinschert, T. Torres De Heidenreich, N. Trautmann, A. Tr̈ler, J. Uusitalo, D.E. Ward, M. Wegrzecki, N. Wiehl, S.M. Van Cleve, A. Yakusheva, Phys. Rev. Lett. 112, 172501 (2014).
- [121] J. Khuyagbaatar, A. Yakushev, Ch.E. Düllmann, D. Ackermann, L.-L. Andersson, M. Asai, M. Block, R.A. Boll, H. Brand, D.M. Cox, M. Dasgupta, X. Derkx, A. Di Nitto, K. Eberhard, J. Even, M. Evers, C. Fahlander, U. Forsberg, J.M. Gates, N. Gharibyan, P. Gobulev, K.E. Gregorich, H.J. Hamilton, W. Hartmann, R.-D. Herzberg, F.P. Heßberger, D.J. Hinde, J. Hoffmann, R. Hollinger, A. Hübner, E. Jäger, B. Kindler, J.V. Kratz, J. Krier, N. Kurz, M. Laatiaoui, S. Lahiri, R. Lang, B. Lommel, M. Maiti, K. Miernik, S. Minami, A. Mistry, C. Mokry, H. Nitsche, J.P. Omtvedt, G.K. Pang, P. Papadakis, D. Renisch, J. Roberto, D. Rudolph, J. Runke, K. P. Rykaczewski, L.G. Sarmiento, M. Schädel, B. Schausten, A. Semchenkov, D.A. Shaughnessy, P. Steinegger, J. Steiner, E.E. Tereshatov, P. Thörle-Pospiech, K. Tinschert, T. Torres De Heidenreich, N. Trautmann, A. Türler, J. Uusitalo, D.E. Ward, M. Wegrzecki, N. Wiehl, S.M. Van Cleve, A. Yakusheva, Phys. Rev. C 99, 172501 (2019).
- [122] Yu.Ts. Oganessian, F.Sh. Abdullin, S.M. Dmitriev, J.M. Gostic, J.H. Hamilton, R.A. Henderson, K.J. Moody, A.N. Polyakov, A.V. Ramayya, J.B. Roberto, K.P. Rykaczewski, R.N. Sagaidak, D.A. Shaughnessy, I.V. Shirokovsky, M.A. Stoyer, V.G. Subbotin, A.M. Sukhov, Yu.S. Tysganov, V.K. Utyonkov, A.A. Voinov, G.K. Vostokin, Phys. Rev. Lett. 108, 022502 (2012).
- [123] U. Forsberg, D. Rudolph, L.-L. Andersson, A. Di Nitto, Ch.E. Düllmann, J.M. Gates, K.E. Gregorich, C.J. Gross, R.-D. Herzberg, F.P. Heßberger, J. Khuyagbaatar, J.V. Kratz, K. Rykaczewski, L.G. Sarmiento, M. Schädel, A. Yakushev, S. Aberg, D. Ackermann, M. Block, H. Brand, B.G. Carlsson, D. Cox, X. Derkx, J. Dobaczewski, K. Eberhardt, J. Even, J. Gerl, E. Jäger, B. Kindler, J. Krier, I. Kojouharov, N. Kurz, B. Lommel, A. Mistry, C. Mokry, W. Nazarewicz, H. Nitsche, J.P. Omtvedt, P. Papadakis, I. Ragnarsson, J. Runke, H. Schaffner, B. Schausten, B. Schausten, Yue Shi, P. Thörle-Pospiech, T. Torres, T. Traut, N. Trautmann, A. Türler, A. Ward, D.E. Ward, N. Wiehl, Nucl. Phys. A 953, 117(2016).
- [124] U. Forsberg, D. Rudolph, C. Fahlander, P. Gobulev, L.G. Sarmiento, S. Aberg, M. Block, Ch. Düllmann, F.P. Heßberger, J.V. Kratz, A. Yakushev, Phys. Lett. B 760, 293 (2016).
- [125] F.P. Heßberger, S. Hofmann, D. Ackermann, V. Ninov, M. Leino, G. Münzenber, S. Saro, A. Lavrentev, A.G. Popeko, A.V. Yeremin, Ch. Stodel, Eur. Phys. J. A 12, 57
- [126] B. Streicher, F.P.Heßberger, S. Antalic, S. Hofmann, D. Ackermann, S. Heinz, B. Kindler, J. Khuyagbaatar, I. Kojouharov, P. Kuusiniemi, M. Leino, B. Lommel, R. Mann, S. Saro, B. Sulignano, J. Uusitalo, M. Venhart, Eur. Phys. J. A 45 275 (2010).
- [127] Yu.Ts Oganessian, V.K. Utyonkov, Yu.V. Lobanov, F.Sh. Abdullin, A.N. Polyakov, I.V. Shirolovsky, Yu.Ts. Tsyganov, G.G. Gulbekian, S.L. Bogomolov, A.N. Mezentsev, S. Iliev, V.G. Subbotin, A.M. Sukhov, A.A. Voinov, G.V. Buklanov, K. Subotic, V.I. Zagrebaev, M.G. Itkis, J.B. Patin, K.J. Moody, J.F. Wild, M.A, Stoyer, N.J. Stoyer, D.A. Shaughnessy, J.M. Keneally, R.W. Lougheed, Phys. Rev. C 69, 021601(R) (2004).
- [128] A.H. Wapstra, Pure Appl. Chem. 63, 879 (1991).
- [129] S. Hofmann, F.P. Heßberger, V. Ninov, P. Armbruster, G. Münzenberg, C. Stodel, A.Yu. Lavrentev, A.G. Popeko, A.V. Yeremin, S. Saro, M. Leino, GSI Scientific Report 1998, GSI-99-1, 7 (1999).
- [130] S. Hofmann, D. Ackermann, S. Antalic, H.G. Burkhard, P. Cagarda, F.P. Heßberger, B. Kindler, I. Kojuharov, P. Kuusiniemi, M. Leino, B. Lommel, O.N. Malyshev, R. Mann, G. Münzenberg, A.G. Popeko, S. Saro, H.J. Schött, B. Streicherm B. Sulignano, J. Uusitalo, A.V. Yeremin, GSI Scientific Report 2003, GSI Report 2004-1, 1 (2004).
- [131] S. Hofmann, Radiochim. Acta 99, 405 (2011).
- [132] K. Morita, K. Morimoto, D.Kaji, T. Akiyama, S. Goto, H. Haba, E. Ideguchi, R. Kanungo, K. Katori, H. Kuora, H. Kudo, T. Ohnishi, A. Ozawa, T. Suda, K. Sueki, H. Xu, T. Yamaguchi, A. Yoneda, A. Yoshida, Y. Zhao, Journ. Phys. Soc. Japan 73, 2593 (2004).
- [133] K. Morita, K. Morimoto, D.Kaji, T. Akiyama, S. Goto, H. Haba, E. Ideguchi, K. Katori, H. Kuora, H. Kikunaga, T. Ohnishi, A. Ozawa, N. Sato, T. Suda, K. Sueki, F. Tokanai, T. Yamaguchi, A. Yoneda, A. Yoshida, Journ. Phys. Soc. Japan 76, 045001 (2007).
- [134] K. Morita, K. Morimoto, D.Kaji, H. Haba,K. Ozeki, V. Kudou, T. Sumita, Y. Wakabayashi, A. Yoneda, K. Tanaka, S. Yamaki, R. Sakai, T. Akiyama, S. Goto, H. Hasebe, M. Huang, T. Huang, E. Ideguchi, Y. Kasamatsu, K. Katori, Y. Kaniya, H. Kikunaga, H. Kuora, H. Kudo, A. Mashiko, K. Mayama, S. Mitsuoka, T. Moriya, M. Murakami, H. Murayama, S. Namai, A. Ozawa, N. Sato, K. Sueki,M. Takeyama, F. Tokanai, F. Tokanai, T. Yamaguchi, A. Yoshida, Journ. Phys. Soc. Japan 81, 103201 (2012).
- [135] K. Morita, Nucl. Phys. A 944, 30 (2015).
- [136] P.A. Wilk, K.E. Gregorich, T. Türler, C.A. Laue, R. Eichler, V. Ninov, J.A. Adams, U.W. Kirbach, M.R. Lane, D.M. Lee, D.A. Shaughnessy, D.A. Strellis, H. Nitsche, D.C. Hoffman, Phys. Rev. Lett. 85, 2697 (2000).
- [137] K. Morita, K. Morimoto, D.Kaji, H. Haba, K. Ozeki, N. Sato, T. Sumita, T. Ichikawa, F. Fujimori, S. Goto, E. Ideguchi, Y. Kasamatsu, K. Katori, Y. Komori, H. Kuora, H. Kudo, K. Ooe, A. Ozawa, F. Tokanai, K. Tsakuda, A. Yoshida, Journ. Phys. Soc. Japan 78, 064201 (2009).
- [138] Z. Qin, X. Wu, H. Ding, W. Wu, W. Huang, X. Lei, Y. Xu, X. Yuan, B. Guo, W. Yang, Z. Gan, H. Fan, J. Guo, H. Xu, G. Xiao, Nucl. Phys. Review 23, 401 (2006).
- [139] R. Dressler, B. Eichler, D.T. Jost, D. Piguet, A. Türler, Ch. Düllmann, R. Eichler, H.W. Gäggeler, M. Gärtner, M. Schädel, S. Taut, A. Yakushev, Phys. Rev. C 59, 3433 (1999).
- [140] H. Haba, M. Huang, D, Kaji, J. Konaya, Y. Kudou, K. Morimoto, K. Morita, M. Murakami, K. Ozeki, R. Sakai, T. Sumita, Y. Wakabayashi, A. Yoneda, Y. Kasamatsu, Y. Kikutani, Y. Komori, K. Nakamara, M. Kikunaga, K. Kudo, K. Nishio, A. Toyoshima, K. Tskadu, Phys. Rev. C 89, 024618 (2014).
- [141] K. Eskola, P. Eskola, M. Nurmia, A. Ghiorso, Phys. Rev. C 4, 632 (1971).
- [142] C.E. Bemis, Jr., D.C. Hensley, P.F. Dittner, R.L. Hahn, R.J. Silva, J.R. Tarrant, L.D. Hunt, ORNL-5111, 58 (1976).
- [143] Y.K. Akolvali, Nucl. Data Sheets 94, 131 (2001).
- [144] H. Haba, F. Fan D, Kaji, Y. Kasamatsu, H. Kikunaga, Y. Komori, N. Kono, H. Kudo, K. Morimoto, K. Morita, M. Murakami, K. Nishio, J.P. Omtvedt, K. Ooe, Z. Qin, D. Sato, N. Sato, T.K. Sato, Y. Shigekawa, A. Shinohara, M. Takeyama, A. Toyoshima, K. Tsukada, Y. Wakabayashi, Y. Wang, S. Wulff, S. Yamaki, S. Yano, Y. Yasuda, T. Yokokita, Phys. Rev. C 102, 024625 (2020).
- [145] J.O. Rasmussen, Phys. Rev. 115, 1675 (1959).
- [146] V.Yu. Denisov, A.A. Khudenko, Phys. Rev. C 80, 034609 (2009).
- [147] H. Hassanabadi, S.S. Hosseini, Nucl. Phys. A 974, 72 (2018).
- [148] J. Blocki, J. Randrup, W.J. Swiatecki, C.F. Tsang, Annals of Physics 105, 427 (1977).
- [149] G.T. Seaborg, W.D. Loveland, ’The Elements Beyound Uranium’, John Wiley Sons, Inc., New York, Chichester, Brisbane, Toronto, Singapore, 153 (1990)
- [150] M. Asai, F.P. Heßberger, A. Lopez-Martens, Nucl. Phys. A 944, 308 (2015).
- [151] F.P. Heßberger, S. Antalic, B. Streicher, S. Hofmann, D. Ackermann, B. Kindler, I. Kojouharov, P. Kuusiniemi, M. Leino, B. Lommel, R. Mann, K. Nishio, S. Saro, S. Sulignano, Eur. Phys. J. A 26, 233 (2005)
- [152] P. Eskola; K. Eskola, M. Nurmia, A. Ghiorso, Phys. Rev. C 2, 1058 (1970).
- [153] F.P. Heßberger, S. Hofmann, D. Ackermann, S. Antalic, B. Kindler, I. Kojouharov, P. Kuusiniemi, M. Leino, B.Lommel, R. Mann, K. Nishio, A.G. Popeko, B. Sulignano, S. Saro, B. Streicher, M. Venhart, A.V. Yeremin, Eur. Phys. J. A 29, 165 (2006).
- [154] M. Asai, K. Tsukada, H. Haba, Y. Ishii, T. Ichikawa, A. Toyoshima, T. Ishii, Y. Nagame, I. Nishinaka, K. Sueki, Phys. Rev. C83, 0143315 (2011).
- [155] S. Antalic, F.P. Heßberger, D. Ackermann, S. Heinz, S. Hofmann, B. Kindler, J. Khuyagbaatar, B. Lommel, R. Mann, Eur. Phys. J. A 51:41 (2015).
- [156] F.P. Heßberger, S. Hofmann, V. Ninov, P. Armbruster, H. Folger, G. Münzenberg, H.J. Schött, A.G. Popeko, A.V. Yeremin, A.N. Andreyev, S. Saro, Z. Phys. A 359, 415 (1997).
- [157] M. Dworschak, M. Block, D. Ackermann, G. Audi, K. Blaum, C. Droese, S. Eliseev, T. Fleckenstein, E.Haettner, F. Herfurth, F.P. Heßberger, S. Hofmann, J. Ketelaer, J. Ketter, H.-J. Kluge, G. Marx, M. Mazzocco, Yu.N. Novikov, W.R. Plaß, A. Popeko, S. Rahaman, D .Rodriguez, C. Scheidenberger, L. Schweikhard, P.G. Thirolf, M. Wang, G.K. Vorobyev, C. Weber, Phys, Rev. C 81, 064312 (2010)
- [158] F.P. Heßberger, S. Hofmann, B. Streicher, B. Sulignano, S. Antalic, D. Ackermann, S. Heinz, B. Kindler, I. Kojouharov, P. Kuusiniemi, M. Leino, B. Lommel, R. Mann, A.G. Popeko, S. Saro, J. Uusitalo, A.V. Yeremin, Eur. Phys. J. A 41, 145 (2009).
- [159] S. Liran, A. Marinov, N. Zeldes, Phys. Rev.63 017302 (2000).
- [160] G. Audi, A.H. Wapstra, C. Thibault, Nucl. Phys. A 729, 337 (2003).
- [161] R.R. Chasman, I. Ahmad, A.M. Friedman, J.R. Erskine, Rev. of Mod. Phys. 49, 833 (1977).
- [162] P. Greenlees, R.-D. Herzberg, S. Ketelhut, P.A. Butler, P. Chowdhury, T. Grahn, C. Gray-Jones, G.D. Jones, P. Jones, R. Julin, S. Juutinen, T.-L. Khoo, M. Leino, S. Moon, M. Naman, J. Pakarinen, P. Rahkila, D. Rostrom, J. Saren, C. Scholey, J. Sorri, S.K. Tandel, J. Uusitalo, M. Venhart, Phys. Rev. C 78, 021303(R) (2008).
- [163] Men Wang, G. Audi, F.G. Kondev, W.J. Huang, S. Naimi, Xing Xu, Chinese Physics C 41, 030003 (2016).
- [164] F.P. Heßberger, S. Antalic, A.K. Mistry, D. Ackermann, B. Andel, M. Block, Z. Kalaninova, B. Kindler, I. Kojouharov, M. Laatiaoui, B. Lommel, J. Piot, M. Vostinar, Eur. Phys. J. A 52:192 (2016).
- [165] Yu. Ts. Oganessian, V.K. Utyonkov, Rep. Prog. Phys.78, 036301 (2015).
- [166] A.V. Karpov, V.I. Zagrebaev, Y. Martinez Palenzuela, L. Felipe Ruiz, W. Greiner, Int. Journal of Modern Physics E21, 1250013 (2012).
- [167] F.P. Heßberger, Eur. Phys. J. A 53:75 (2017).
- [168] R. Smolanczuk, J. Skalski, A. Sobiczewski, Phys. Rev. C 52, 1871 (1995).
- [169] K. Moody, R.W. Lougheed, J.F. Wild, R.J. Dougan, E.K. Hulet, R.W. Hoff, C.M. Henderson, R.J. Dupzyk, K. Sümmerer, G.D. O’Kelly, G.R. Berthune, Nucl. Phys. A 563, 21 (1993).
- [170] I. Ahmad, R.K. Sjoblom, R.F. Burnes, E.P. Horwitz, P.R. Fields, Nucl. Phys. A 140, 141 (1970).
- [171] I. Ahmad, R.R. Chasman, P.R. Fields, Nucl. Phys. A 140, 141 (1970).
- [172] A. Chatillon, Ch. Theisen, P.T. Greenlees, G. Auger, J.E. Bastin, E. Bouchez, B. Bouriquet, J.M. Casandjian, R. Cee, E. Clement, R. Dayras, G. de France, R. de Toureil, S. Eeckhaudt, A. Görgen, T. Grahn, S. Grevy, K. Hauschild, R.-D. Herzberg, P.J.C. Ikin, G.D. Jones, P. Jones, R. Julin, S. Juutinen, H. Kettunen, A. Korichi, W. Korten, Y. Le Coz, M. Leino, A. Lopez-Martens, S.M. Lukyanov, Yu.E. Penionzhkevich, J. Perkowski, A. Pritchard, P. Rahkila, M. Rejmund, J. Saren, C. Scholey, S. Siem, M.G. Saint-Laurent, C. Senenel, Yu.G. Sobolev, Ch. Stodel, J. Uusitalo, A. Villari, M. Bender, P. Bonche, P.-H. Heenen, Eur. Phys. J. A 30, 397 (2006).
- [173] F. Giacoppo, F.P. Heßberger, to be published.
- [174] A. Parkhomenko, A. Sobiczewski, Acta Phys. Pol. B 35, 2447 (2004).
- [175] P.C. Sood, M. Sainath, K. Venkataramaniah, Internat, Journal of Modern Physics E, Vol.9, No. 4, 309 (2000).
- [176] R. Gowrishankar, Praven M. Jodidar, P.C. Sood, Proceedings ’64th. DAE-BRNS Symposium on Nuclear Physics’ Dec. 23-27, 2019, Lucknow, India, 132 (2019)
- [177] O. Kaleja, PHD, Johannes Gutenberg-Universität Mainz (2020)
- [178] M. Laatiaoui, H. Backe, M. Block, F.P. Heßberger, P. Kunz, F. Lautenschläger, W. Lauth, M. Sewtz, T. Walter Eur. Phys. J. D68:71 (2014).
- [179] V.I. Zagrebaev, W. Greiner, Nucl. Phys. A 944, 257 (2015).
- [180] P. Möller, A.J. Sierk, T. Ichikawa, A. Iwamoto, R. Bengtsson, H. Uhrenholdt, S. Aberg, Phys. Rev. C 79, 064304 (2009).
- [181] P. Möller, A.J. Sierk, T. Ichikawa, A. Iwamoto, M. Mumpower, Phys. Rev. C 91, 024310 (2015).
- [182] M. Kowal, P. Jachimowicz, A. Sobiczewski, Phys. Rev. C 82, 014303 (2010).
- [183] S. Typel, B.A. Brown, Phys. Rev. C 67, 034313 (2003).
- [184] S. Cwiok et al., Nature 433, 705 (2005).
- [185] S. Cwiok, W. Nazarewicz, P.H. Heenen, Phys. Rev. Lett 83, 1108 (1999).
- [186] E. Litvinova, Phys. Rev. C 85, 021303(R) (2012).
- [187] V.I. Zagrebaev, W. Greiner, Phys. Rev. C 78, 024603 (2008).
- [188] S. Hofmann, D. Ackermann, S. Antalic, V.F. Comas, S. Heinz, J.A. Heredia, F.P.Heßberger, J. Khuyagbaatar, B. Kindler, I. Kojuharov, M. Leino, B. Lommel, R. Mann, K. Nishio, A.G. Popeko, S. Saro, J. Uusitalo, M. Venhart, A.V. Yeremin, GSI Scientific Report 2008 (GSI-Report 2009-1), NUSTAR-SHE-01, 131 (2009).
- [189] J. Khuyagbaatar, A. Yakushev, Ch.E. Dü llmann, D. Ackermann, L.-L. Andersson, M. Asai, M. Block, R.A. Boll, H. Brand, D.M. Cox, M. Dasgupta, X. Derkx, A. di Nitto, K. Eberhardt, J. Even, M. Evers, C. Fahlander, U. Forsberg, J.M. Gates, N. Gharibyan, P. Gobulev, K.E. Gregorich, J.H. Hamilton, W. Hartmann, R.-D. Herzberg, F.P. Heßberger, D.J. Hinde, J. Hoffmann, R. Hollinger, A. Hü bner, E. Jä ger, B. Kindler, J.V. Kratz, J. Krier, N. Kurz, M. Laatiaoui, S. Lahiri, R. Lang, B. Lommel, M. Maiti, K. Miernik, S. Minami, A. Mistry, C. Mokry, H. Nitsche, J.P. Omtvedt, G.K. Pang, P. Papadakis, D. Renisch, J. Roberto, D. Rudolph, J. Runke, K.P. Rykaczewski, L.G. Sarmiento, M. Schä del, B. Schausten, A. Semchenkov, D.A. Shaughnessy, P. Steinegger, J. Steiner, E.E. Tereshatov, P. Thö rle-Pospiech, K. Tinschert, T. Torres de Heidenreich, N. Trautmann, A. Tü rler, J. Uusitalo, D.E. Ward, M. Wegrzecki, N. Wiejl, S.M. Van Cleve, V. Yakushev, Phys. Rev. C 79, 024603 (2009).
- [190] Yu.Ts Oganessian, V.K. Utyonkov, Yu.V. Lobanov, F.Sh. Abdullin, A.N. Polyakov, R.N. Sagaidak, I.V. Shirolovsky, Yu.Ts. Tsyganov, A.A. Voinov, A.N. Mezentsev, V.G. Subbotin, A.M. Sukhov, K. Subotic, V.I. Zagrebaev, S.N. Dmitriev, R.A. Henderson, K.J. Moody, J.M. Keneally, J.H. Landrun, D.A. Shaughnessy, M.A, Stoyer, N.J. Stoyer, P.A. Wilk, Phys. Rev. C 102, 064602 (2020).
- [191] D. Rudolph, M. Block, F.P. Heßberger, D. Ackermann, L.-L. Andersson, M.L. Cortes, C. Droese, M. Dworschak, M. Eibach, U. Forsberg, P. Golubev, R. Hoischen, J. Ketelaer, I. Kojouharov, J. Khuyagbaatar, D. Nesterenko, H. Schaffner, S. Stolze, and the SHIPTRAP Collaboration, GSI Scientific Report 2009, GSI-Report 2010-1, NUSTAR-SHE-08, 177 (2010)
- [192] P. Schury, M. Wada, Y. Ito, D. Kaji, F. Arai, M. McCormick, I. Murray, H. Haba, S. Jeong, S. Kimura, H. Koura, H. Miyatake, K. Morimoto, A. Ozawa, M. Rosenbusch, M. Reponen, P.-A. Söderström, A. Takamine, T. Tanaka, H. Wollnik, Phys. Rev. C 95, 011305(R) (2017).
- [193] J.M. Gates, G.K. Pang, J.L. Pore, K.E. Gregorich, J.T. Kwarsick, G. Savard, N.E. Esker, M. Kireff Covo, M.J. Mojannam, J.C. Batchelder, D.L. Bleuel, R.M. Clark, Crawford, P. Fallon, K.K. Hubbard, A.M. Hurst, I.T. Kolaja, A.O. Macchiavelli, C. Morse, R. Orford, L. Phair, M.A. Stoyer, Phys. Rev. Lett. 121, 222501 (2018).
- [194] C.E. Bemis, Jr., P.F. Dittner, R.J. Silva, R.L. Hahn, J.R. Tarrant, L.D. Hunt, D.C. Hensley, Phys. Rev. C 16, 1146 (1977).