Infrared Echoes of Optical Tidal Disruption Events: 1% Dust Covering Factor or Less at sub-parsec Scale
Abstract
The past decade has experienced an explosive increase of optically-discovered tidal disruption events (TDEs) with the advent of modern time-domain surveys. However, we still lack a comprehensive observational view of their infrared (IR) echoes in spite of individual detections. To this end, we have conducted a statistical study of IR variability of the 23 optical TDEs discovered between 2009 and 2018 utilizing the full public dataset of Wide-field Infrared Survey Explorer. The detection of variability is performed on the difference images, yielding out 11 objects with significant (¿) variability in at least one band while dust emission can be only fitted in 8 objects. Their peak dust luminosity is around erg s-1, corresponding to a dust covering factor at scale of sub-parsec. The only exception is the disputed source ASASSN-15lh, which shows an ultra-high dust luminosity ( erg s-1) and make its nature even elusive. Other non-detected objects show even lower , which could be one more order of magnitude lower. The derived is generally much smaller than those of dusty tori in active galactic nuclei (AGNs), suggesting either a dearth of dust or a geometrically thin and flat disk in the vicinity of SMBHs. Our results also indicate that the optical TDE sample (post-starburst galaxies overrepresented) is seriously biased to events with little dust at sub-pc scale while TDEs in dusty star-forming systems could be more efficiently unveiled by IR echoes.
1 Introduction
Supermassive black holes (SMBHs) are ubiquitous in the centers of galaxies with massive bulges. Moreover, the tightness of the BH-bulge mass relationship hints a symbiotic connection between the formation and growth of BHs and galaxy spheroids (Kormendy & Ho 2013). The SMBHs accumulate their tremendous mass ( ) by accreting gas through the phase of active galactic nucleus (AGNs) while they are mostly quiescent in the local universe. A fundamental question has been raised why some SMBHs are active but the majority of remaining are not (e.g., Alexander & Hickox 2012). Observational constrains on the AGN triggering mechanisms remain elusive with only sparse evidence at galactic scales (Storchi-Bergmann & Schnorr-Müller 2019). As the accreting material, the interstellar medium (ISM) at different scales might give important clues to the underlying mechanism. It is found that Seyfert AGNs generally reside in host galaxies with a younger stellar population than quiescent galaxies, confirming that an abundant fuel supply is available in kiloparsec (kpc) scale (e.g., Kauffmann et al. 2003). Further efforts are devoted to explore their differences at smaller scale, such as finding a factor of four difference in gas mass between Seyfert and quiescent galaxies within radius of 100 pc (Hicks et al. 2013). Nevertheless, a clear picture of AGN triggering is unachievable without going deep into the proximity of SMBHs, that is down to -scale under the gravitational influence of SMBHs.
The structure of AGNs is cognized under the scheme of unified model (Antonucci 1993), in which the equatorial optically thick torus at -scale lays the foundation of unification and has bridged the scale of accretion disk and their host galaxy. Besides, the dust along the polar direction may also exist in some AGNs suggested by interferometric observations (Hönig et al. 2012; see also Lyu & Rieke 2018), leading to the dusty wind model (Hönig et al. 2013; Hönig & Kishimoto 2017). In contrast, the study of -scale environment of normal galaxies is much more challenging without the illumination from central engines. The far-IR imaging of our Milky Way center has uncovered a circumnuclear ring centered on Sgr A⋆ with thickness and radius of 0.34 pc and 1.4 pc, respectively (Lau et al. 2013; see also Latvakoski et al. 1999 for an agreed result). However, similar map is impossible for more distant galaxies due to poor resolution. The groundbreaking instrument GRAVITY mounted on the very large telescope has achieved mili-arcsec resolution in -band, but it only applies to -band luminous sources and thus barely nearby AGNs have been successfully observed (GRAVITY Collaboration et al. 2020a, b).
Nevertheless, the gas and dust in the vicinity of inactive SMBHs have another possibility to be lighted up temporarily by tidal disruption events (TDEs), which happens when a star occasionally passes within the tidal radius of SMBH. Part of the disrupted stellar debris will be accreted by the BH and produce a flash of electromagnetic radiation peaked in UV or soft X-ray band, with a characteristic decline on timescale of months to years (Rees 1988; Phinney 1989). If the local environment of a SMBH is dusty, the UV/optical photons from TDE will be unavoidably absorbed and re-processed into the infrared (IR) band, giving rise to a so-called IR echo. Lu et al. (2016) has performed a 1-D radiative transfer model and proved that the dust emission peaks at mid-IR (MIR) with typical luminosity between and erg s-1 depending on the dust covering factor. Immediately after the prediction, Jiang et al. (2016) achieved the detection of IR echo of dust at scale of in ASASSN-14li. At almost the same time, van Velzen et al. (2016) have claimed another two echoes (PTF-09ge and PTF-09axc) and derived a dust covering factor of for both events. Therefore, IR echoes of TDEs offer us a new and powerful means to probe the dust around the BH down to sub-pc scale.
The technique of IR echo is subject to the occurrence of TDEs. The TDE event rate is yet known to be as low as (Wang & Merritt 2004; Stone & Metzger 2016) and thus makes the discovered events quite rare until recently. The number of TDEs has been growing rapidly in the past decade thanks to the booming wide-field optical surveys, such as PanSTARRS, PTF, and ASAS-SN (Komossa 2015; van Velzen et al. 2020a). Particularly, the ZTF survey (Graham et al. 2019) since 2018 has made TDE enter into a new era of population studies (van Velzen et al. 2021). As of the end of 2019, approximately 30 TDEs have been discovered at optical bands (see Table 1 of van Velzen et al. 2020a). On the other side, the detection of IR echoes all have used the archival data of Wide-field Infrared Survey Explorer (WISE; Wright et al. 2010) and Near-Earth Object WISE Reactivation mission (NEOWISE-R; Mainzer et al. 2014). Actually, the dataset has provided multi-epoch MIR date with time coverage matching with almost all optical TDEs. There is however still no statistical study to date. Giving the increased number of optical TDEs in the past few years and available IR data, it is the perfect time to perform a comprehensive study. We assume a cosmology with km s-1 Mpc-1, , and .
| ID | Name | IAU Name | R.A. | DEC. | log | log¡¿ | log | p | log | log | ||
|---|---|---|---|---|---|---|---|---|---|---|---|---|
| erg/s | K | Day | ||||||||||
| (1) | (2) | (3) | (4) | (5) | (6) | (7) | (8) | (9) | (10) | (11) | (12) | (13) |
| 1 | PTF-09axc | … | 14:53:13.08 | +22:14:32.3 | 0.1146 | 55016 | ||||||
| 2 | PTF-09djl | … | 16:33:55.97 | +30:14:16.7 | 0.1840 | 55048 | ||||||
| 3 | PTF-09ge | … | 14:57:03.18 | +49:36:41.1 | 0.0640 | 54992 | ||||||
| 4 | PS1-10jh | … | 16:09:28.28 | +53:40:24.1 | 0.1696 | 55393 | ||||||
| 5 | PS1-11af | … | 09:57:26.82 | +03:14:00.9 | 0.4046 | 55578 | ||||||
| 6 | ASASSN-14ae | … | 11:08:40.12 | +34:05:52.2 | 0.0436 | |||||||
| 7 | ASASSN-14li | … | 12:48:15.23 | +17:46:26.4 | 0.0206 | |||||||
| 8 | ASASSN-15oi | … | 20:39:09.18 | -30:45:20.1 | 0.0484 | |||||||
| 9 | ASASSN-15lh | … | 22:02:15.39 | -61:39:34.6 | 0.2326 | 57247 | … | … | ||||
| 10 | iPTF-15af | … | 08:48:28.13 | +22:03:33.4 | 0.0790 | 57061 | ||||||
| 11 | iPTF-16axa | … | 17:03:34.34 | +30:35:36.6 | 0.1080 | |||||||
| 12 | iPTF-16fnl | … | 00:29:57.01 | +32:53:37.2 | 0.0163 | 57626 | ||||||
| 13 | OGLE16aaa | … | 01:07:20.81 | -64:16:21.4 | 0.1655 | 57414 | ||||||
| 14 | PS17dhz | AT2017eqx | 22:26:48.37 | +17:08:52.4 | 0.1089 | 57910 | ||||||
| 15 | PS18kh | AT2018zr | 07:56:54.54 | +34:15:43.6 | 0.0710 | 58180 | ||||||
| 16 | ASASSN-18pg | AT2018dyb | 16:10:58.77 | -60:55:23.2 | 0.0180 | 58346 | ||||||
| 17 | ASASSN-18ul | AT2018fyk | 22:50:16.13 | -44:51:52.4 | 0.0590 | |||||||
| 18 | ASASSN-18zj | AT2018hyz | 10:06:50.87 | +01:41:34.1 | 0.0457 | |||||||
| 19 | ZTF19aabbnzo | AT2018lna | 07:03:18.65 | +23:01:44.7 | 0.0910 | 58508 | ||||||
| 20 | ZTF18aahqkbt | AT2018bsi | 08:15:26.62 | +45:35:32.0 | 0.0510 | |||||||
| 21 | ZTF18abxftqm | AT2018hco | 01:07:33.64 | +23:28:34.3 | 0.0880 | 58401 | ||||||
| 22 | ZTF18acaqdaa | AT2018iih | 17:28:03.93 | +30:41:31.4 | 0.2120 | 58442 | ||||||
| 23 | ZTF18actaqdw | AT2018lni | 04:09:37.65 | +73:53:41.7 | 0.1380 | 58460 |
Note. — Column (1): Object ID in this paper. Column (2): Discovery Name of the TDE. Column (3): IAU Name of the TDE. Column (4)-(5): RA and DEC of the TDE. Column (6): redshift of the TDE host galaxy. Column (7): MJD of the optical peak. The asterisks indicate the time of fist detection since these TDEs are only detected post-peak. Column (8): the UV-optical bolometric luminosity () the optical peak which is drawn from van Velzen et al. (2020a). Column (9): mean blackbody temperature () measured during the first 100 days post peak. Column (10): linear change during the first year of observations. Column (10)-(11): and are the free parameters of a power-law decay (). Column (12): black hole mass () derived from - relation for target 1,2,3,4,6,7,10,11,12 (Wevers et al. 2017) and 9 (Krühler et al. 2018); from model fitting for target 5,8,13 (Mockler et al. 2019); from - for other objects (Reines & Volonteri 2015). Column (13): host stellar mass. The data from Column (7) to (11) are all drawn from van Velzen et al. (2020a) except for ASASSN-15lh.
2 Sample and Data
2.1 TDE Sample
The TDE candidates studied in this work are primarily collected from van Velzen et al. (2020a), which has reviewed all TDEs discovered in optical band up to 2019. We have only selected optical TDEs since they usually possess well-sampled multi-wavelength light curves with wide time span which is important for us to get the knowledge of the basic properties of these events, such as the peak time and luminosity. Furthermore, we only investigate events found between 2009 and 2018 to ensure available MIR data within one year after the TDE, since the WISE project starts from early 2010 and its public data goes on to the end of 2019. The cut results in 22 sources. In addition, we have also included another controversial TDE candidate ASASSN-15lh (Leloudas et al. 2016; Krühler et al. 2018) which was first reported as the most ever luminous supernova (Dong et al. 2016). We take it into consideration in hope of gaining some new clues from the IR variability. Thus, our final sample has 23 objects in total (see their information in Table 1).
2.2 MIR Data
The WISE has conducted a full-sky imaging survey in four broad MIR bandpass filters centered at 3.4, 4.6, 12 and 22 m (labeled W1-W4) from 2010 February to August (Wright et al. 2010). The solid hydrogen cryogen used to cool the W3 and W4 instrumentation was depleted later and it was placed in hibernation in 2011 February. WISE was reactivated and renamed NEOWISE-R since 2013 October, using only W1 and W2, to hunt for asteroids that could pose as impact hazard to the Earth (Mainzer et al. 2014). The WISE scans a specific sky area every half year and average 12 times of single exposures have been taken within each epoch (typically one day). As of now, the WISE and its successor NEOWISE surveys have provided us a public dataset from 2010 February to 2019 December, which contains 14-15 epochs of observations for each TDE. Therefore, the observing schedule of WISE is in excellent overlap with the discovery period of the optical TDEs in our sample (2009-2018).
Our previous works have shown that the IR echoes of TDEs are detectable on time scales of months to years while the variability within each epoch is negligible (Jiang et al. 2016, 2017, 2019; Dou et al. 2016, 2017), so the original single-exposure photometry have been simply binned in those works. However, it is not accurate enough to detect weak variability or put clear upper limit of the non-detection sources. In order to acquire more accurate measurements, particularly for TDEs with weak echoes, We choose to perform photometry on the time-resolved WISE/NEOWISE Coadds. The coadds have stacked the individual exposures within typically day intervals to produce one coadd per band per epochthat is, one coadd every six months at a given position on the sky (Meisner et al. 2018)111 Website link: https://portal.nersc.gov/project/cosmo/temp/ameisner/neo6. In addition, the associated noise and mask images have been also generated during the process. Therefore, it provides us a convenient dataset which is very suitable for study the long-timescale MIR variability.
3 Analysis and Results
3.1 Variability Detection by Image Subtraction
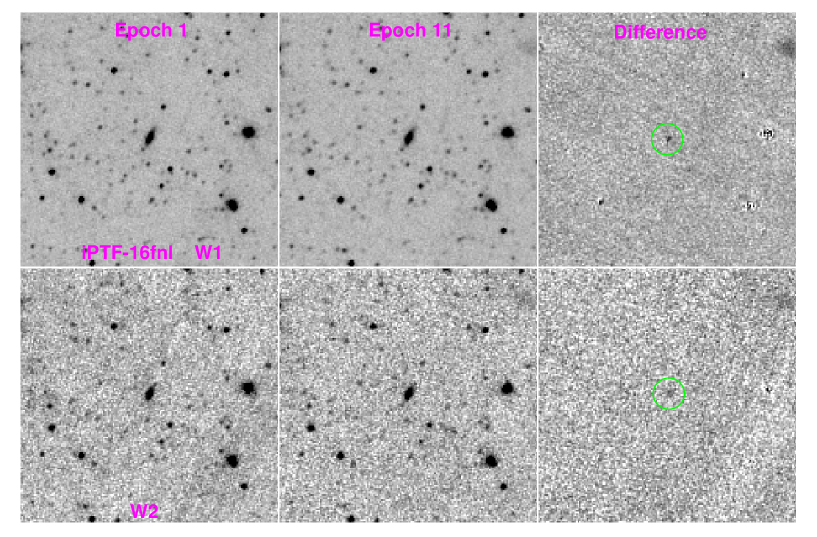
We try to detect variability using the standard image subtraction procedure HOTPANTS (Becker 2015) 222 https://github.com/acbecker/hotpants. The images at latest epoch are taken as the references to be subtracted for TDEs discovered before 2013, otherwise the first epoch images are adopted. Then we begin to perform PSF photometry on the difference images using the IDL routine FASTPHOT (Béthermin et al. 2010). The PSF models specifically constructed for coadd images (Meisner & Schlafly 2019) 333https://github.com/legacysurvey/unwise_psf have been used as the input PSF images during the measurement.
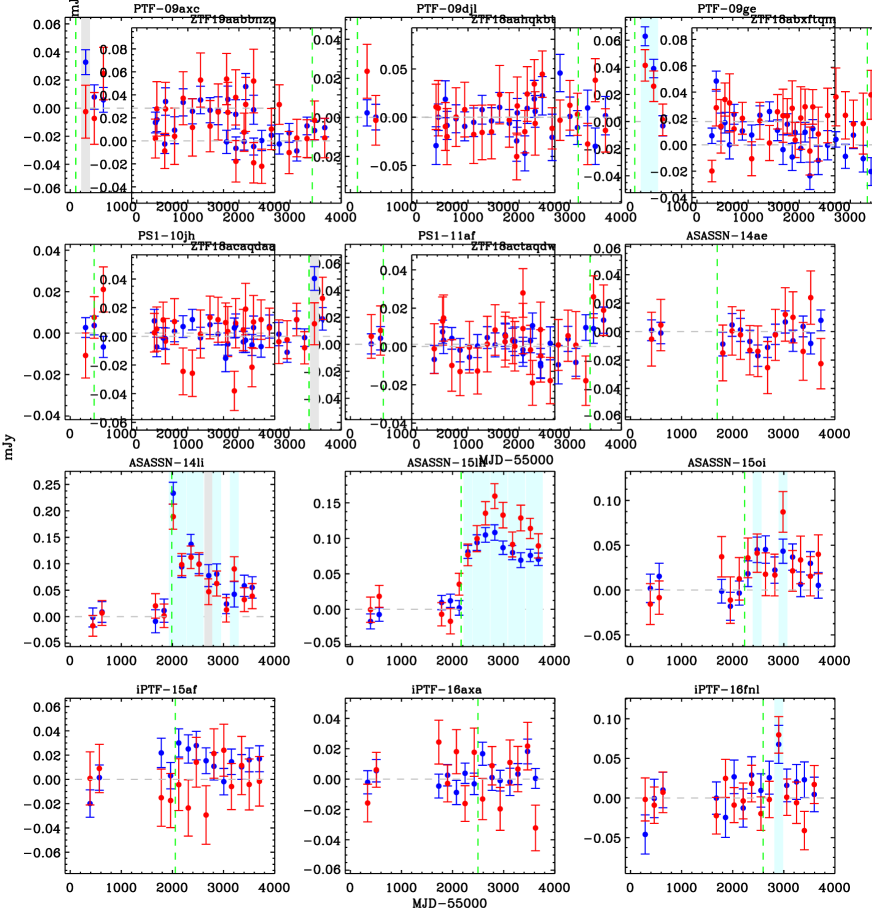
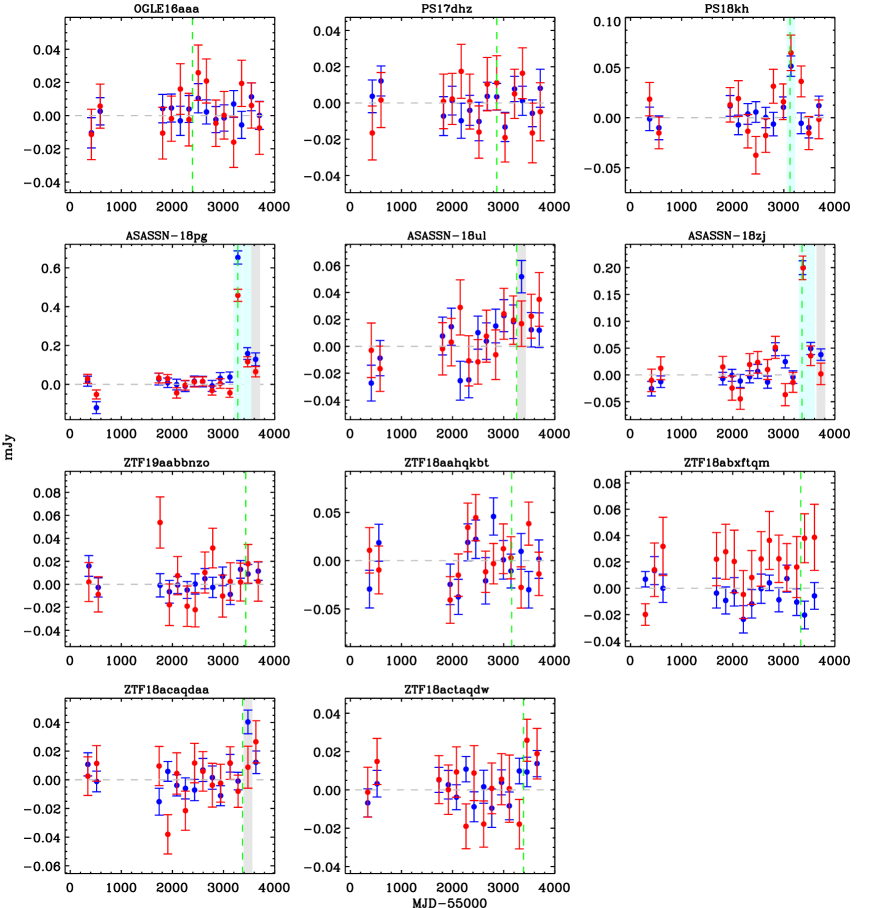
Since the single-epoch reference image we used above can be slightly offset from the real quiescent level from the host galaxy emission, we begin to estimate the offset by averaging fluxes of epochs at least 180 days before the optical peak for TDEs after 2013, or at least 1500 days after optical peak for TDEs before 2013. Then we corrected the offset and added its error to the fluxes of difference images. Finally, we have obtained the light curves with background (host) emission subtracted (see Figure 2).
We consider the flux at certain epoch with signal to noise ratio (S/N) higher than 3 as a robust detection of variability. If none epoch satisfies the condition, we put a upper limit of the fluxes in which the is determined by the mean errors of all epochs. According to this criterion, 11 TDEs show variability in either W1 or W2 band at one or multiple epochs. Among them, we note that the IR echoes of ASASSN-14li at the first two epochs has been reported by Jiang et al. (2016). PTF-09ge and PTF-09axc only shows signal in W1 band but not in W2 band, that is also consistent with the results given by van Velzen et al. (2016). All of the measurements are presented in Table 2.
| ID | Name | Days | log | log | log | |||
|---|---|---|---|---|---|---|---|---|
| mJy | mJy | erg/s | erg/s | erg/s | K | |||
| (1) | (2) | (3) | (4) | (5) | (6) | (7) | (8) | (9) |
| 1 | PTF-09axc | 182 | 0.0330.009 | ¡0.054 | 42.000.12 | ¡42.10 | … | … |
| 2 | PTF-09djl | … | ¡0.022 | ¡0.043 | ¡42.27 | ¡41.95 | … | … |
| 3 | PTF-09ge | 200 | 0.0630.007 | 0.0410.012 | 41.740.05 | 41.420.12 | 42.220.68 | 1976 1235 |
| 3 | PTF-09ge | 362 | 0.0390.007 | 0.0260.011 | 41.540.08 | 41.220.19 | 42.001.03 | 1933 1806 |
| 4 | PS1-10jh | … | ¡0.015 | ¡0.034 | ¡42.04 | ¡41.77 | … | … |
| 5 | PS1-11af | … | ¡0.026 | ¡0.055 | ¡43.13 | ¡42.84 | … | … |
| 6 | ASASSN-14ae | … | ¡0.023 | ¡0.055 | ¡40.96 | ¡40.72 | … | … |
| 7 | ASASSN-14li | 29 | 0.2330.021 | 0.1890.024 | 41.300.04 | 41.070.05 | 41.480.28 | 1338 276 |
| 7 | ASASSN-14li | 199 | 0.0940.020 | 0.0980.021 | 40.910.09 | 40.790.09 | 41.010.47 | 1019 290 |
| 7 | ASASSN-14li | 387 | 0.1370.019 | 0.1120.021 | 41.070.06 | 40.850.08 | 41.270.42 | 1337 407 |
| 7 | ASASSN-14li | 549 | 0.0990.018 | 0.0990.022 | 40.930.08 | 40.790.10 | 41.050.46 | 1073 306 |
| 7 | ASASSN-14li | 743 | 0.0780.021 | 0.0470.024 | 40.820.12 | 40.470.22 | … | … |
| 7 | ASASSN-14li | 903 | 0.0800.019 | 0.0630.024 | 40.840.10 | 40.590.16 | 41.080.83 | 1440 922 |
| 7 | ASASSN-14li | 1257 | 0.0420.024 | 0.0900.023 | 40.560.25 | 40.750.11 | 40.870.80 | 623 208 |
| 8 | ASASSN-15lh | 112 | 0.0810.009 | 0.0770.015 | 43.070.05 | 42.900.09 | 43.360.39 | 1367 332 |
| 8 | ASASSN-15lh | 265 | 0.0940.011 | 0.1000.018 | 43.130.05 | 43.020.08 | 43.410.36 | 1224 247 |
| 8 | ASASSN-15lh | 405 | 0.1050.010 | 0.1350.016 | 43.180.04 | 43.150.05 | 43.460.24 | 1037 123 |
| 8 | ASASSN-15lh | 562 | 0.1080.011 | 0.1600.018 | 43.190.04 | 43.220.05 | 43.510.22 | 943 96 |
| 8 | ASASSN-15lh | 697 | 0.0870.010 | 0.1330.018 | 43.100.05 | 43.140.06 | 43.420.26 | 920 106 |
| 8 | ASASSN-15lh | 857 | 0.0800.010 | 0.0910.018 | 43.060.05 | 42.980.08 | 43.330.37 | 1143 224 |
| 8 | ASASSN-15lh | 993 | 0.0690.010 | 0.1290.018 | 43.000.07 | 43.130.06 | 43.400.29 | 814 98 |
| 8 | ASASSN-15lh | 1153 | 0.0760.009 | 0.1140.014 | 43.040.05 | 43.080.05 | 43.360.25 | 931 106 |
| 8 | ASASSN-15lh | 1286 | 0.0700.009 | 0.0890.017 | 43.010.05 | 42.970.08 | 43.290.36 | 1052 186 |
| 9 | ASASSN-15oi | 245 | 0.0450.014 | 0.0410.021 | 41.340.14 | 41.170.23 | 41.281.31 | 985 707 |
| 9 | ASASSN-15oi | 752 | 0.0430.014 | 0.0870.023 | 41.330.14 | 41.500.11 | 41.630.58 | 654 148 |
| 10 | iPTF-15af | … | ¡0.033 | ¡0.065 | ¡41.65 | ¡41.33 | … | … |
| 11 | iPTF-16axa | … | ¡0.023 | ¡0.041 | ¡41.78 | ¡41.43 | … | … |
| 12 | iPTF-16fnl | 316 | 0.0680.024 | 0.0800.023 | 40.560.15 | 40.490.13 | 40.660.68 | 917 349 |
| 13 | OGLE16aaa | … | ¡0.025 | ¡0.044 | ¡42.22 | ¡41.86 | … | … |
| 14 | PS17dhz | … | ¡0.026 | ¡0.044 | ¡41.85 | ¡41.47 | … | … |
| 15 | PS18kh | 17 | 0.0520.010 | 0.0650.018 | 41.750.09 | 41.710.12 | 41.820.60 | 814 223 |
| 16 | ASASSN-18pg | 0 | 0.6530.034 | 0.4580.031 | 41.630.02 | 41.340.03 | 41.730.21 | 1461 246 |
| 16 | ASASSN-18pg | 197 | 0.1590.030 | 0.1160.026 | 41.010.08 | 40.740.10 | 41.300.56 | 1554 738 |
| 16 | ASASSN-18pg | 358 | 0.1290.033 | 0.0650.027 | 40.920.11 | 40.490.18 | … | … |
| 17 | ASASSN-18ul | 95 | 0.0520.012 | 0.0170.017 | 41.590.10 | 40.960.43 | … | … |
| 18 | ASASSN-18zj | 21 | 0.2000.013 | 0.2000.022 | 41.940.03 | 41.800.05 | 42.010.23 | 1033 133 |
| 18 | ASASSN-18zj | 170 | 0.0490.011 | 0.0360.018 | 41.330.10 | 41.050.22 | 41.601.20 | 1582 1509 |
| 18 | ASASSN-18zj | 369 | 0.0380.011 | 0.0020.020 | 41.220.12 | 39.794.55 | … | … |
| 19 | ZTF19aabbnzo | … | ¡0.026 | ¡0.052 | ¡41.67 | ¡41.37 | … | … |
| 20 | ZTF18aahqkbt | … | ¡0.059 | ¡0.069 | ¡41.51 | ¡40.96 | … | … |
| 21 | ZTF18abxftqm | … | ¡0.030 | ¡0.060 | ¡41.71 | ¡41.40 | … | … |
| 22 | ZTF18acaqdaa | 91 | 0.0400.008 | 0.0090.015 | 42.670.09 | 41.870.72 | … | … |
| 23 | ZTF18actaqdw | … | ¡0.022 | ¡0.039 | ¡42.00 | ¡41.63 | … | … |
Only the epochs with detection have been presented, while upper limits are given for TDEs showing detections at all epochs. We have not given the values of Column (8) and (9) for epochs with unreliable measurements ().
Note. — Column (1): Object ID in this paper. Column (2): Discovery Name of the TDE. Column (3): Rest-frame days since the optical peak. Column (4): W1 flux in unit of mJy. Column (5): W2 flux in unit of mJy. Column (6): W1 luminosity. Column (7): W2 luminosity. Column (8)-(9): Fitted dust luminosity and temperature. The contribution from the UV-optical components has been subtracted off during the fitting.
| ID | Name | log | log | log | ||
|---|---|---|---|---|---|---|
| Days | pc | erg/s | erg/s | |||
| (1) | (2) | (3) | (4) | (5) | (6) | colhead(7) |
| 3 | PTF-09ge | 200 | 0-0.31 | 44.040.01 | 42.220.68 | -1.820.68 |
| 7 | ASASSN-14li | 29 | 0-0.17 | 43.660.02 | 41.480.28 | -2.180.28 |
| 8 | ASASSN-15lh | 562 | 0.35-0.60 | 45.340.04 | 43.510.22 | -1.830.22 |
| 9 | ASASSN-15oi | 752 | 0.49-0.78 | 44.470.04 | 41.630.56 | -2.840.56 |
| 12 | iPTF-16fnl | 316 | 0.12-0.41 | 43.180.03 | 40.660.67 | -2.520.67 |
| 15 | PS18kh | 17 | 0-0.16 | 43.780.02 | 41.820.53 | -1.960.60 |
| 16 | ASASSN-18pg | 0 | 0-0.15 | 44.160.01 | 41.730.17 | -2.430.21 |
| 18 | ASASSN-18zj | 21 | 0-0.17 | 44.110.01 | 42.010.21 | -2.100.23 |
| 1 | PTF-09axc | 182 | 0.02-0.29 | 43.460.03 | 42.160.12 | -1.300.12* |
| 17 | ASASSN-18ul | 95 | 0-0.22 | 44.480.04 | 41.740.10 | -2.740.11* |
| 22 | ZTF18acaqdaa | 91 | 0-0.20 | 44.620.04 | 42.880.09 | -1.740.10* |
| 2 | PTF-09djl | … | … | 44.420.04 | ¡42.46 | ¡-1.96 |
| 4 | PS1-10jh | … | … | 44.470.07 | ¡42.23 | ¡-2.24 |
| 5 | PS1-11af | … | … | 44.160.03 | ¡43.43 | ¡-0.73 |
| 6 | ASASSN-14ae | … | … | 43.870.02 | ¡41.10 | ¡-2.77 |
| 10 | iPTF-15af | … | … | 44.220.01 | ¡41.81 | ¡-2.41 |
| 11 | iPTF-16axa | … | … | 43.820.02 | ¡41.94 | ¡-1.88 |
| 13 | OGLE16aaa | … | … | 44.220.01 | ¡42.41 | ¡-1.81 |
| 14 | PS17dhz | … | … | 43.820.05 | ¡42.01 | ¡-1.81 |
| 19 | ZTF19aabbnzo | … | … | 44.560.06 | ¡41.84 | ¡-2.72 |
| 20 | ZTF18aahqkbt | … | … | 43.870.01 | ¡41.66 | ¡-2.21 |
| 21 | ZTF18abxftqm | … | … | 44.250.04 | ¡41.87 | ¡-2.38 |
| 23 | ZTF18actaqdw | … | … | 44.210.29 | ¡42.17 | ¡-2.04 |
Note. — Column (1): Object ID in this paper. Column (2): Discovery Name of the TDE. Column (3): The rest-frame days of the MIR peak since the optical peak (or first detection). Column (4): The range of the characteristic dust scale estimated from the time lag between MIR and optical emission, in which the uncertainties are mainly caused by the poor cadence of MIR light curves. Column (5): The peak (or first detection) blackbody luminosity of the optical-UV emission. Column (6): The peak dust luminosity with the UV-optical contribution subtracted off. Column (7): The dust covering factor estimated as . The of the first 8 objects, whose variability detections are reliable in both W1 and W2 bands, are calculated directly from the dust emission fitting. The 3 objects in the middle, show ¿3 detection only in W1 band, thus we have naively assumed that =1000 K, that is comparable with the average of the first 8 objects. We denote their with asterisks, emphasizing their large uncertainties and likely underestimated errors. Lastly, only upper limits have been put for the rest 12 objects because their S/N are too low to infer the dust properties.
3.2 Dust Emission
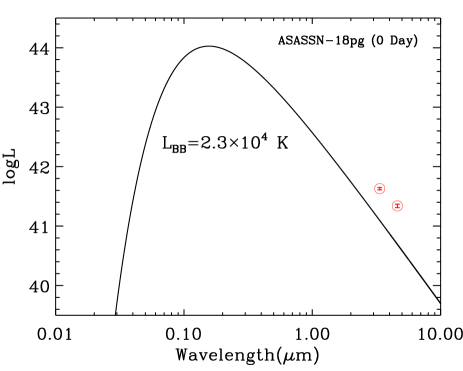
After the detection of IR variability, the dust emission can be then estimated. Although the extrapolated emission of the UV-optical blackbody should be generally weak in the MIR bands, it could be not negligible at the very early stage of TDEs. For instance, the IR variability of ASASSN-18pg is detected at almost the same time with the optical peak. The expected logarithmic luminosity at W1 and W2 band of the optical blackbody () is 41.09 and 40.69, that is only 0.54 and 0.65 dex lower than observations, respectively (see Figure 3).
In order to minimize the contamination of optical blackbody, we then try to subtract its contribution from the observed IR flux. We adopted the parameters listed in van Velzen et al. (2020a) to characterize the optical luminosity:
| (1) |
in which the relevant parameters can be found in Table 1. Here we assume that blackbody temperature () keeps constant to be the average of the first 100 days. Since ASASSN-15lh displays a non-monotonic declination with an exotic rebrightening feature in the UV-optical light curves (Leloudas et al. 2016), we have estimated its extension to the IR band from the measured luminosity at corresponding WISE epochs directly.
After flux correction, the dust temperature () can be inferred as below.
| (2) |
Following our previous works (e.g., Jiang et al. 2021), we simply assume that the dust grains follow a MRN size distribution (Mathis et al. 1977; see also Draine & Lee 1984) as with m, m and an average density of for silicate grains.
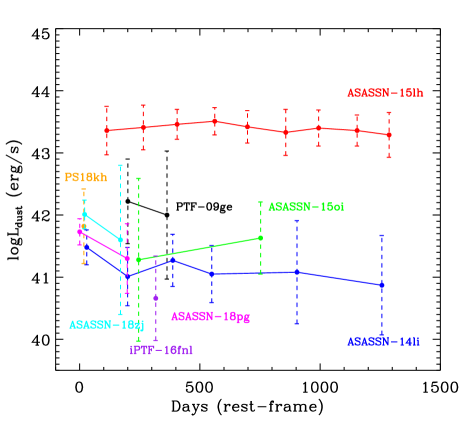
Since PTF-09axc shows negative flux in W2 band at the epoch of W1 detection, we have ignored it in the following analysis. In addition, the calculated of some epochs are unreasonably higher (with large errors) than the allowed temperature () suppressed by dust sublimation (Barvainis 1987; Mor & Netzer 2012). Their are mainly caused by low S/N detection in W2 bands. For this reason, we have abandoned the epochs with measured since their dust properties at corresponding epochs are obviously unreliable. Accompanied with , the dust luminosity () is obtained for the 8 TDEs with robust detection in both W1 and W2 bands (see Table 2). The change of with time is shown in Figure 4. The peak luminosity is mostly at orders of erg s-1 except for ASASSN-15lh ( erg s-1), whose nature is still under hotly debated (Dong et al. 2016; Leloudas et al. 2016).
The spatial scale of dust can be roughly inferred from the time lag between the peak dust emission () and primary optical-UV emission (). Apparently, the estimation have large errors due to poor cadence (half year) of MIR light curves. As a conservative treatment, we put an error of 180 days (observer-frame) to the MIR peak time. On the other hand, there are 7 TDEs which are detected only at the post-peak stage and their first detection epochs have been adopted as alternatives of the peak time (marked as asterisks in Table 1). The errors introduced in this step might be minor as the luminosity at the first detection ( erg s-1) is comparable with the peak luminosity of other TDEs, indicating that the time of first detection is very close to their real peak. It is also confirmed by the model fitting of ASASSN-14ae, ASASSN-14li and ASASSN-15oi (Mockler et al. 2019). Consequently, the time lag errors are mainly dominated by the peak time of dust emission. The corresponding dust scale from lags are presented as ranges in Table 3. We can conclude that the dust revealed by IR echoes are all located at sub-pc, mostly at , even if it is hard to measure precisely with available data.
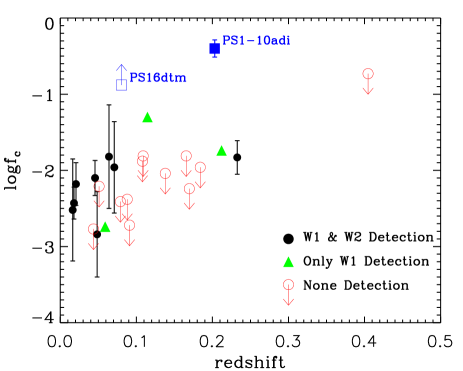
Another parameter widely adopted to characterize dust content is the covering factor of dust (). Here we try to estimate it by the ratio of peak dust emission and optical emission, that is . The 8 objects with measurements show (see Table 3). It needs to be emphasized that of ASASSN-15lh is on the same level albeit with much higher luminosity. We yet noticed that its MIR luminosity displays a much slower decay with that of the latest epoch remains comparable with the peak after 2 years. If we employ the energy ratio as an alternative estimate of ASASSN-15lh, the integrated IR energy ( erg) as of the end of 2019 yields out provided a total optical energy erg (Godoy-Rivera et al. 2017). The high IR luminosity of ASASSN-15lh is not only unusual in our TDE sample, but also much higher than other superluminous supernova (L.M.Sun et al. in preparation). Any future explanations of its nature must also account for the distinctive IR light curve successfully.
Regarding the three with only reliable detection in W1 band, we have made a very crude assumption of the () and have got a very similar . At the end, there are 12 objects left which have not been detected in W1 nor in W2 band. We choose to just give the upper limits of derived from the W1 luminosity (upper limits) as well as a fixed . The limits of are mainly dependent on the redshift of TDEs, with closer TDEs having lower upper limits (see Figure 5). Taking the nearest (among the non-detected) TDE ASASSN-14ae (z=0.0436) as an example, ¡1.3 erg s-1, resulting in ¡. To sum up, optical TDEs show or even less, which can be as low as . Because of the low dust content, only nearest TDEs (z¡0.1 except for ASASSN-15lh) show detectable IR echoes with WISE images (see Figure 5).
4 Conclusion and Discussion
The pc-scale environment, namely the gas and dust, around SMBHs plays an important role in understanding the triggering mechanism of AGNs. Nevertheless, there is hitherto no statistical comparison of the environments between active and quiescent galaxies. The efforts are mainly hindered by the unachievable resolving power. By means of IR echoes of TDEs, we now have the great opportunity to take a snapshot of dust at sub-pc scale in normal galaxies (Lu et al. 2016; Jiang et al. 2016; van Velzen et al. 2016). The study presented here has reviewed IR echoes of all optical TDEs discovered in the past decade (2009-2018) taking full advantage of available data resources. Confident (¿) IR variability has been detected in 11 targets and dust emission has been measured in 8 among them. The concerned sub-pc scale dust revealed by IR echoes shows covering factor , with the caveat that other non-detected sources show likely even lower . Our conclusion agrees nicely with the pilot study of two TDEs (van Velzen et al. 2016) while with higher statistical significance owing to the increased sample size. It is noticeable that our sample has gone beyond for luminous TDE candidate (ASASSN-15lh) , any current generation of instruments have not resolved sub-pc scale dust at such high redshift to our knowledge. In one word, our work has further proved that IR echoes can serve as a novel and effective method to probe dust down to sub-pc scale around SMBHs, which is especially unique for inactive galaxies and distant galaxies.
4.1 SMBHs are Quiescent due to Lack of Gas Supplies
The torus in AGNs can reprocess the UV-optical photons from accretion to IR band and its covering factor has been commonly inferred from the the spectral energy distribution (SED) decomposition of the primary and reprocessed emission. Past works have shown that the torus covering factor is averagely close to one half (e.g., Fritz et al. 2006; Mor et al. 2009; Roseboom et al. 2013). Consequently, TDEs in AGNs must produce associated IR outburst as a result of dust echoes. This scenario is fully supported by the ubiquitously detected luminous (- erg s-1) IR echoes in AGN TDEs (Dou et al. 2017; Jiang et al. 2017, 2019; Mattila et al. 2018). Furthermore, the derived from them is also generally consistent with the traditional SED fitting method (Jiang et al. 2019; see also Figure 5).
The optical TDEs considered in this work all happened in inactive galaxies (including LINERs). They all show weak or non-detected IR echoes with , that is more than one order of magnitude lower than AGNs, corroborating the conclusion given in van Velzen et al. (2016). It implies that either the pc-scale dust is quite sparse or it is concentrated on a geometrically thin and flat disk. In any case, such few dust is definitely not sufficient to form a standard torus. In comparison, the of the circumnuclear ring in the Galactic center is 0.12 inferred from parameters given by Lau et al. (2013). We may thus conclude that the -scale dust of normal galaxies, represented by the optical TDE hosts, is not only much less than AGNs, but also less than the Milky Way. The selection effect is minimal here as they are all optically discovered without any prior IR information. In some theoretical models, AGN radiation pressure is necessarily involved to both produce the torus toroidal structure and maintain its thick structure (e.g., Krolik 2007; Wada 2012). One may wonder if torus remains there when an AGN is turned off. Our results hint that the torus, which is first introduced into the AGN unification as a toy model, may only exist in AGNs but not normal galaxies. Likewise, the dusty wind in the polar direction should be also absent when the SMBH is inactive, otherwise the polar dust will also responds to the TDE as an notable IR echo (e.g., Mattila et al. 2018).
In other words, SMBHs are dormant probably because of a shortage of gas in the vicinity instead of any formidable force to prevent gas flow to the BH. AGNs seemingly to be easily triggered as long as the ambient pc-scale gas is rich. However, it is not the whole story. Apart from the TDEs analyzed in this work, which are captured by optical transient surveys, there is another class of TDE candidates selected by transient coronal line emitters and dust IR echoes (Wang et al. 2012, 2018; Yang et al. 2013; Dou et al. 2016). They imply that SMBHs can be quiescent even if they lurk in ISM-rich environments. Albeit we are aware of a selection effect of this technique itself, it is worthwhile to further explore if the circumambient gas runs into a stone wall of losing angular momentum or they are on the eve of AGN phase (turn-on AGNs, e.g., Gezari et al. 2017; Yan et al. 2019) in the future.
4.2 Implications to Demography of TDE Hosts
One of the most puzzling open questions in TDE field is that optical TDEs show an unexpected preference in post-starburst (or so-called E+A) galaxies, with the rate elevated by a factor of (e.g. Arcavi et al. 2014; French et al. 2016, 2020b). Scenarios which may contribute to the rate enhancement, such as SMBH binaries (Chen et al. 2009, Coughlin et al. 2019), central stellar overdensity (French et al. 2020a) and radial velocity anisotropy (Stone et al. 2018) have been proposed out. However, those scenarios can not well address why TDEs are absent in galaxies with occurrent intense star formation (Guillochon 2017).
The serendipitous discoveries of obscured TDEs in ultra-luminous infrared galaxies (ULIRGs) by IR echoes indicate promisingly that the absence of TDEs in star-forming (SF) systems is at least partly due to dust attenuation (Tadhunter et al. 2017; Mattila et al. 2018; Kool et al. 2020; see also Sun et al. 2020). Actually, the TDE event rate of ULIRGs is estimated to be even higher than post-starburst galaxies, which could be as high as (Tadhunter et al. 2017, Kool et al. 2020). Aside from ULIRGs, ordinary SF galaxies lying at the main sequence can also contain plenty of dust in the galactic nucleus. A recent modeling of optical TDE detections in surveys indeed suggest that the dust obscuration is crucial for suppressing the TDE detection rate in SF galaxies while the unusual preference for post-starburst hosts can not be entirely explained (Roth et al. 2020). We caution that their estimate of extinction based on Balmer decrement have two caveats. First, the dust distribution is usually not uniform but the extinction of TDEs is only dependent on the dust along the line of sight. Second, we still lack the knowledge of dust extinction in the galactic nucleus, which is likely different from the SF regions. Thus further study on the impact of dust extinction must take the caveats into consideration.
Jiang et al. (2021) has performed a blind search
of MIR outburst in nearby galaxies and has yielded out a considerable number
of TDE candidates in SF galaxies.
Their peak MIR luminosity ( erg s-1) is
much higher than the dust echoes revealed in optical TDEs.
This work and other progresses of TDE search by means of dust echoes suggest
that the IR band is an efficient wavelength to unveil TDEs
embedded in dusty environment.
In contrast, the optical search is only prone to uncover TDEs in SMBHs
with very low dust covering factor ().
If that is true, it on the other hand indicates that E+A galaxies might be a
special type of galaxies with the lowest amount of dust in the nuclear region.
The dust content in other inactive galaxies, like Milky Way, could be
significantly higher than E+A galaxies.
In the near future, we have the opportunity to obtain a panoramic picture of the
pc-scale environment of SMBHs with IR echoes of TDEs in various types of galaxies.
References
- Alexander & Hickox (2012) Alexander, D. M., & Hickox, R. C. 2012, New Astronomy, 56, 93
- Antonucci (1993) Antonucci, R. 1993, ARA&A, 31, 473
- Arcavi et al. (2014) Arcavi, I., Gal-Yam, A., Sullivan, M., et al. 2014, ApJ, 793, 38
- Barvainis (1987) Barvainis, R. 1987, ApJ, 320, 537
- Becker (2015) Becker, A. 2015, Astrophysics Source Code Library. ascl:1504.004
- Béthermin et al. (2010) Béthermin, M., Dole, H., Cousin, M., et al. 2010, A&A, 516, A43
- Béthermin et al. (2013) Béthermin, M., Dole, H., Cousin, M., et al. 2013, Astrophysics Source Code Library. ascl:1302.008
- Blanchard et al. (2017) Blanchard, P. K., Nicholl, M., Berger, E., et al. 2017, ApJ, 843, 106
- Chen et al. (2009) Chen, X., Madau, P., Sesana, A., et al. 2009, ApJ, 697, L149
- Coughlin et al. (2019) Coughlin, E. R., Armitage, P. J., Lodato, G., et al. 2019, Space Sci. Rev., 215, 45
- Dong et al. (2016) Dong, S., Shappee, B. J., Prieto, J. L., et al. 2016, Science, 351, 257
- Dou et al. (2016) Dou, L., Wang, T., Jiang, N., et al. 2016, ApJ, 832, 188
- Dou et al. (2017) Dou, L., Wang, T., Yan, L., et al. 2017, ApJ, 841, L8
- Draine & Lee (1984) Draine, B. T., & Lee, H. M. 1984, ApJ, 285, 89
- Evans & Kochanek (1989) Evans, C. R., & Kochanek, C. S. 1989, ApJ, 346, L13
- French et al. (2016) French, K. D., Arcavi, I., & Zabludoff, A. 2016, ApJ, 818, L21
- French et al. (2020a) French, K. D., Arcavi, I., Zabludoff, A. I., et al. 2020, ApJ, 891, 93
- French et al. (2020b) French, K. D., Wevers, T., Law-Smith, J., et al. 2020, Space Sci. Rev., 216, 32
- Fritz et al. (2006) Fritz, J., Franceschini, A., & Hatziminaoglou, E. 2006, MNRAS, 366, 767
- Gezari et al. (2017) Gezari, S., Hung, T., Cenko, S. B., et al. 2017, ApJ, 835, 144
- Godoy-Rivera et al. (2017) Godoy-Rivera, D., Stanek, K. Z., Kochanek, C. S., et al. 2017, MNRAS, 466, 1428
- Graham et al. (2019) Graham, M. J., Kulkarni, S. R., Bellm, E. C., et al. 2019, PASP, 131, 078001
- GRAVITY Collaboration et al. (2020a) GRAVITY Collaboration, Pfuhl, O., Davies, R., et al. 2020, A&A, 634, A1
- GRAVITY Collaboration et al. (2020b) GRAVITY Collaboration, Dexter, J., Shangguan, J., et al. 2020, A&A, 635, A92
- Guillochon (2017) Guillochon, J. 2017, Nature Astronomy, 1, 0068
- Hicks et al. (2013) Hicks, E. K. S., Davies, R. I., Maciejewski, W., et al. 2013, ApJ, 768, 107
- Hönig et al. (2012) Hönig, S. F., Kishimoto, M., Antonucci, R., et al. 2012, ApJ, 755, 149
- Hönig et al. (2013) Hönig, S. F., Kishimoto, M., Tristram, K. R. W., et al. 2013, ApJ, 771, 87
- Hönig & Kishimoto (2017) Hönig, S. F. & Kishimoto, M. 2017, ApJ, 838, L20
- Jiang et al. (2016) Jiang, N., Dou, L., Wang, T., et al. 2016, ApJ, 828, L14
- Jiang et al. (2017) Jiang, N., Wang, T., Yan, L., et al. 2017, ApJ, 850, 63
- Jiang et al. (2019) Jiang, N., Wang, T., Mou, G., et al. 2019, ApJ, 871, 15
- Jiang et al. (2021) Jiang, N., Wang, T., Dou, L., et al. 2021, ApJS, 252, 32
- Kankare et. (2017) Kankare, E., Kotak, R., Mattila, S., et al. 2017, Nature Astronomy, 1, 865
- Kauffmann et al. (2003) Kauffmann, G., Heckman, T. M., Tremonti, C., et al. 2003, MNRAS, 346, 1055
- Komossa (2015) Komossa, S. 2015, Journal of High Energy Astrophysics, 7, 148
- Kool et al. (2020) Kool, E. C., Reynolds, T. M., Mattila, S., et al. 2020, MNRAS, 498, 2167
- Kormendy & Ho (2013) Kormendy, J., & Ho, L. C. 2013, ARA&A, 51, 511
- Krolik (2007) Krolik, J. H. 2007, ApJ, 661, 52
- Krühler et al. (2018) Krühler, T., Fraser, M., Leloudas, G., et al. 2018, A&A, 610, A14
- Laor & Draine (1993) Laor, A., & Draine, B. T. 1993, ApJ, 402, 441
- Latvakoski et al. (1999) Latvakoski, H. M., Stacey, G. J., Gull, G. E., & Hayward, T. L. 1999, ApJ, 511, 761
- Lau et al. (2013) Lau, R. M., Herter, T. L., Morris, M. R., Becklin, E. E., & Adams, J. D. 2013, ApJ, 775, 37
- Leloudas et al. (2016) Leloudas, G., Fraser, M., Stone, N. C., et al. 2016, Nature Astronomy, 1, 0002
- Lu et al. (2016) Lu, W., Kumar, P., & Evans, N. J. 2016, MNRAS, 458, 575
- Lyu & Rieke (2018) Lyu, J. & Rieke, G. H. 2018, ApJ, 866, 92
- Mainzer et al. (2014) Mainzer, A., Bauer, J., Cutri, R. M., et al. 2014, ApJ, 792, 30
- Mathis et al. (1977) Mathis, J. S., Rumpl, W., & Nordsieck, K. H. 1977, ApJ, 217, 425
- Meisner et al. (2018) Meisner, A. M., Lang, D., & Schlegel, D. J. 2018, AJ, 156, 69
- Meisner & Schlafly (2019) Meisner, A. & Schlafly, E. 2019, Astrophysics Source Code Library. ascl:1901.004
- Mattila et al. (2018) Mattila, S., Pérez-Torres, M., Efstathiou, A., et al. 2018, Science, 361, 482
- Mockler et al. (2019) Mockler, B., Guillochon, J., & Ramirez-Ruiz, E. 2019, ApJ, 872, 151
- Mor et al. (2009) Mor, R., Netzer, H., & Elitzur, M. 2009, ApJ, 705, 298
- Mor & Netzer (2012) Mor, R., & Netzer, H. 2012, MNRAS, 420, 526
- Phinney (1989) Phinney, E. S. 1989, The Center of the Galaxy, 136, 543
- Rees (1988) Rees, M. J. 1988, Nature, 333, 523
- Reines & Volonteri (2015) Reines, A. E., & Volonteri, M. 2015, ApJ, 813, 82
- Roseboom et al. (2013) Roseboom, I. G., Lawrence, A., Elvis, M., et al. 2013, MNRAS, 429, 1494
- Roth et al. (2020) Roth, N., van Velzen, S., Cenko, S. B., et al. 2020, arXiv:2008.11231
- Stone et al. (2018) Stone, N. C., Generozov, A., Vasiliev, E., et al. 2018, MNRAS, 480, 5060
- Stone & Metzger (2016) Stone, N. C., & Metzger, B. D. 2016, MNRAS, 455, 859
- Storchi-Bergmann & Schnorr-Müller (2019) Storchi-Bergmann, T. & Schnorr-Müller, A. 2019, Nature Astronomy, 3, 48
- Sun et al. (2020) Sun, L., Jiang, N., Wang, T., et al. 2020, ApJ, 898, 129
- Tadhunter et al. (2017) Tadhunter, C., Spence, R., Rose, M., Mullaney, J., & Crowther, P. 2017, Nature Astronomy, 1, 0061
- van Velzen et al. (2016) van Velzen, S., Mendez, A. J., Krolik, J. H., & Gorjian, V. 2016, ApJ, 829, 19
- van Velzen et al. (2021) van Velzen, S., Gezari, S., Hammerstein, E., et al. 2021, ApJ, 908, 4
- van Velzen et al. (2020a) van Velzen, S., Holoien, T. W.-S., Onori, F., et al. 2020, Space Sci. Rev., 216, 124
- Wada (2012) Wada, K. 2012, ApJ, 758, 66
- Wang & Merritt (2004) Wang, J., & Merritt, D. 2004, ApJ, 600, 149
- Wang et al. (2012) Wang, T.-G., Zhou, H.-Y., Komossa, S., et al. 2012, ApJ, 749, 115
- Wang et al. (2018) Wang, T., Yan, L., Dou, L., et al. 2018, MNRAS, 477, 2943
- Wevers et al. (2017) Wevers, T., van Velzen, S., Jonker, P. G., et al. 2017, MNRAS, 471, 1694
- Wright et al. (2010) Wright, E. L., Eisenhardt, P. R. M., Mainzer, A. K., et al. 2010, AJ, 140, 1868-1881
- Yan et al. (2019) Yan, L., Wang, T., Jiang, N., et al. 2019, ApJ, 874, 44
- Yang et al. (2013) Yang, C.-W., Wang, T.-G., Ferland, G., et al. 2013, ApJ, 774, 46