Near-unity third-harmonic circular dichroism driven by quasi-BIC in asymmetric silicon metasurfaces
Abstract
We use numerical simulations to demonstrate third-harmonic generation with near-unity nonlinear circular dichroism (CD) and high conversion efficiency () in asymmetric Si-on-SiO2 metasurfaces. The working principle relies on the spin-selective excitation of a quasi-bound state in the continuum, characterized by a very high () quality-factor. By tuning multi-mode interference with the variation of the metasurface geometrical parameters, we show the possibility to control both linear CD and nonlinear CD. Our results pave the way for the development of all-dielectric metasurfaces for nonlinear chiro-optical devices with high conversion efficiency.
Polarization is one of the most fundamental properties of electromagnetic radiation.
The capability to measure, manipulate, and control the polarization state of a light beam is essential for a huge range of applications such as classical and quantum optical communications Wang et al. (2012, 2015); Virte et al. (2013), biological and chemical sensing Barron (2009); Estephan et al. (2010); Pellegrini et al. (2018), imaging and holography Ni et al. (2013); Lee et al. (2020), spectropolarimetry and metrology Sterzik et al. (2012); Salvail et al. (2013).
In this context, optical rotation (OR) - rotation of the polarization axis of linearly polarized waves - and circular dichroism (CD) - difference in the absorption/reflectivity/transmittivity spectra of left-circularly polarized (LCP) and right-circularly polarized (RCP) light - are of paramount importance. Although these chiro-optical phenomena are extremely weak in natural materials, the recent development of chiral metamaterials and metasurfaces (MSs) Wang et al. (2016); Valev et al. (2013); Mun et al. (2020); Hentschel et al. (2017); Keren-Zur et al. (2016) has demonstrated giant OR and CD enhancement suitable for chiral biosensing and imaging Hentschel et al. (2017), polarization conversion Zhao et al. (2012), negative refraction Pendry (2004), spin-controlled wavefront shaping Ye et al. (2016), and chiral detectors Li et al. (2015).
Most chiral metamaterials demonstrated so far are made of three-dimensional (3D) metallic nanostructures Wang et al. (2016); Valev et al. (2013); Mun et al. (2020); Hentschel et al. (2017); Fasold et al. (2018); Tanaka et al. (2020).
However, the complexity of the associated fabrication technology and optical absorption have hindered their application. Although all-dielectric chiral metamaterials have been recenlty demonstrated Tanaka et al. (2020), two-dimensional (2D) or planar metamaterials - i.e. MSs - are highly attractive due to compatibility with planar fabrication technologies. Despite a lower chiro-optical response due to inherent reflection symmetry, planar structures sustaining Fano resonances can exhibit strong non-reciprocal CD due to modal interference Hopkins et al. (2016).
Thus, the recent insurgence of dielectric nanostructures and MSs enabled the realization of lossless planar structures with strong chiro-optical effects Kuznetsov et al. (2012); Anthur et al. (2020); Gómez et al. (2019); Gorkunov et al. (2018); Ullah et al. (2018); Zhu et al. (2018); Solomon et al. (2018); Hu et al. (2019); Wu et al. (2014); Ma et al. (2018); Gorkunov et al. (2020).
Chiral dielectric MSs are cornerstone for developing efficient integrated components enabling the measurement of the polarization state of light which is an essential functionality for many applications Li et al. (2015); Gorkunov et al. (2020); Tanaka et al. (2020); Overvig et al. (2021).
Over the past decade, investigations of nonlinear optical effects in chiral metamaterials and MSs have grown in interest Wang et al. (2016); Li et al. (2017); Ren et al. (2012); Chen et al. (2016); Tang et al. (2020); Kim and Kim (2020); Kim et al. (2020) due to the possibility to enhance the chiro-optical response. Nonlinear CD, i.e. strong difference in second-harmonic generation (SHG) or third-harmonic generation (THG) conversion efficiency between LCP and RCP pump, opens to new possible applications such as nonlinear holography, nonlinear wavefront control, and chiral sensors. Although near-unity nonlinear CD has been demonstrated Wang et al. (2016); Li et al. (2017); Ren et al. (2012); Chen et al. (2016); Tang et al. (2020), the conversion efficiency and pump intensity have been limited by the employment of metallic structures. Recently, enhanced nonlinear CD with high conversion efficiency has been demonstrated in an hybrid multiple-quantum-well structure Kim et al. (2020); Makarov et al. (2017).
However, optical absorption still limits the pump power that these structures can sustain. Albeit mainly plasmonic and hybrid structures have been investigated so far, dielectric resonators demonstrated considerably higher SHG and THG conversion efficiencies Pertsch and Kivshar (2020). In particular, concepts inspired by the bound state in the continuum (BIC) physics are providing a new framework to enhance nonlinear optical phenomena at the nanoscale Carletti et al. (2018); Koshelev et al. (2020); Carletti et al. (2019); Koshelev et al. (2019); Anthur et al. (2020); Liu et al. (2019); Overvig et al. (2021).
Non-plasmonic symmetry-broken structures sustaining quasi-BIC, which were recently shown to display a very important linear CD in the transmittivity Gorkunov et al. (2020); Overvig et al. (2021), are thus promising to enable both high nonlinear CD and high conversion efficiency Chen et al. (2016); Li et al. (2017); Kim et al. (2020); Kim and Kim (2020); Frizyuk et al. (2021).
In this work, we use numerical simulations to demonstrate symmetry-broken Si MSs supporting a quasi-BIC, the latter enhancing THG conversion efficiency up to and enabling near-unity nonlinear CD ().
The high () quality-factor (-factor) of our engineered quasi-BIC and the high value of the third-order nonlinear susceptibility () in silicon in the near-infrared spectrum render this approach promising for an efficient THG.
Our results show that the quasi-BIC is selectively excited only for one circular polarization enabling near unity nonlinear CD.
The unique opportunity to engineer a high-Q mode in lossless dielectric metasurfaces provides the unprecedented possibility to enhance simultaneously the nonlinear response and the nonlinear CD which, so far, have been hindered by the use of plasmonic metasurfaces.
The designed MS is depicted in Fig. 1.
It is composed by periodic unit cells made by two Si blocks on a silica substrate, which is compatible with the silicon-on-insulator material system. The MS periodicity is , whereas the width and the height of each Si block are and , respectively.
The distance between the two blocks is .
To induce the symmetry breaking, the length of one block in the unit cell is reduced by the quantity , where is the length of the unperturbed block and () is the asymmetry parameter (see Fig. 1).
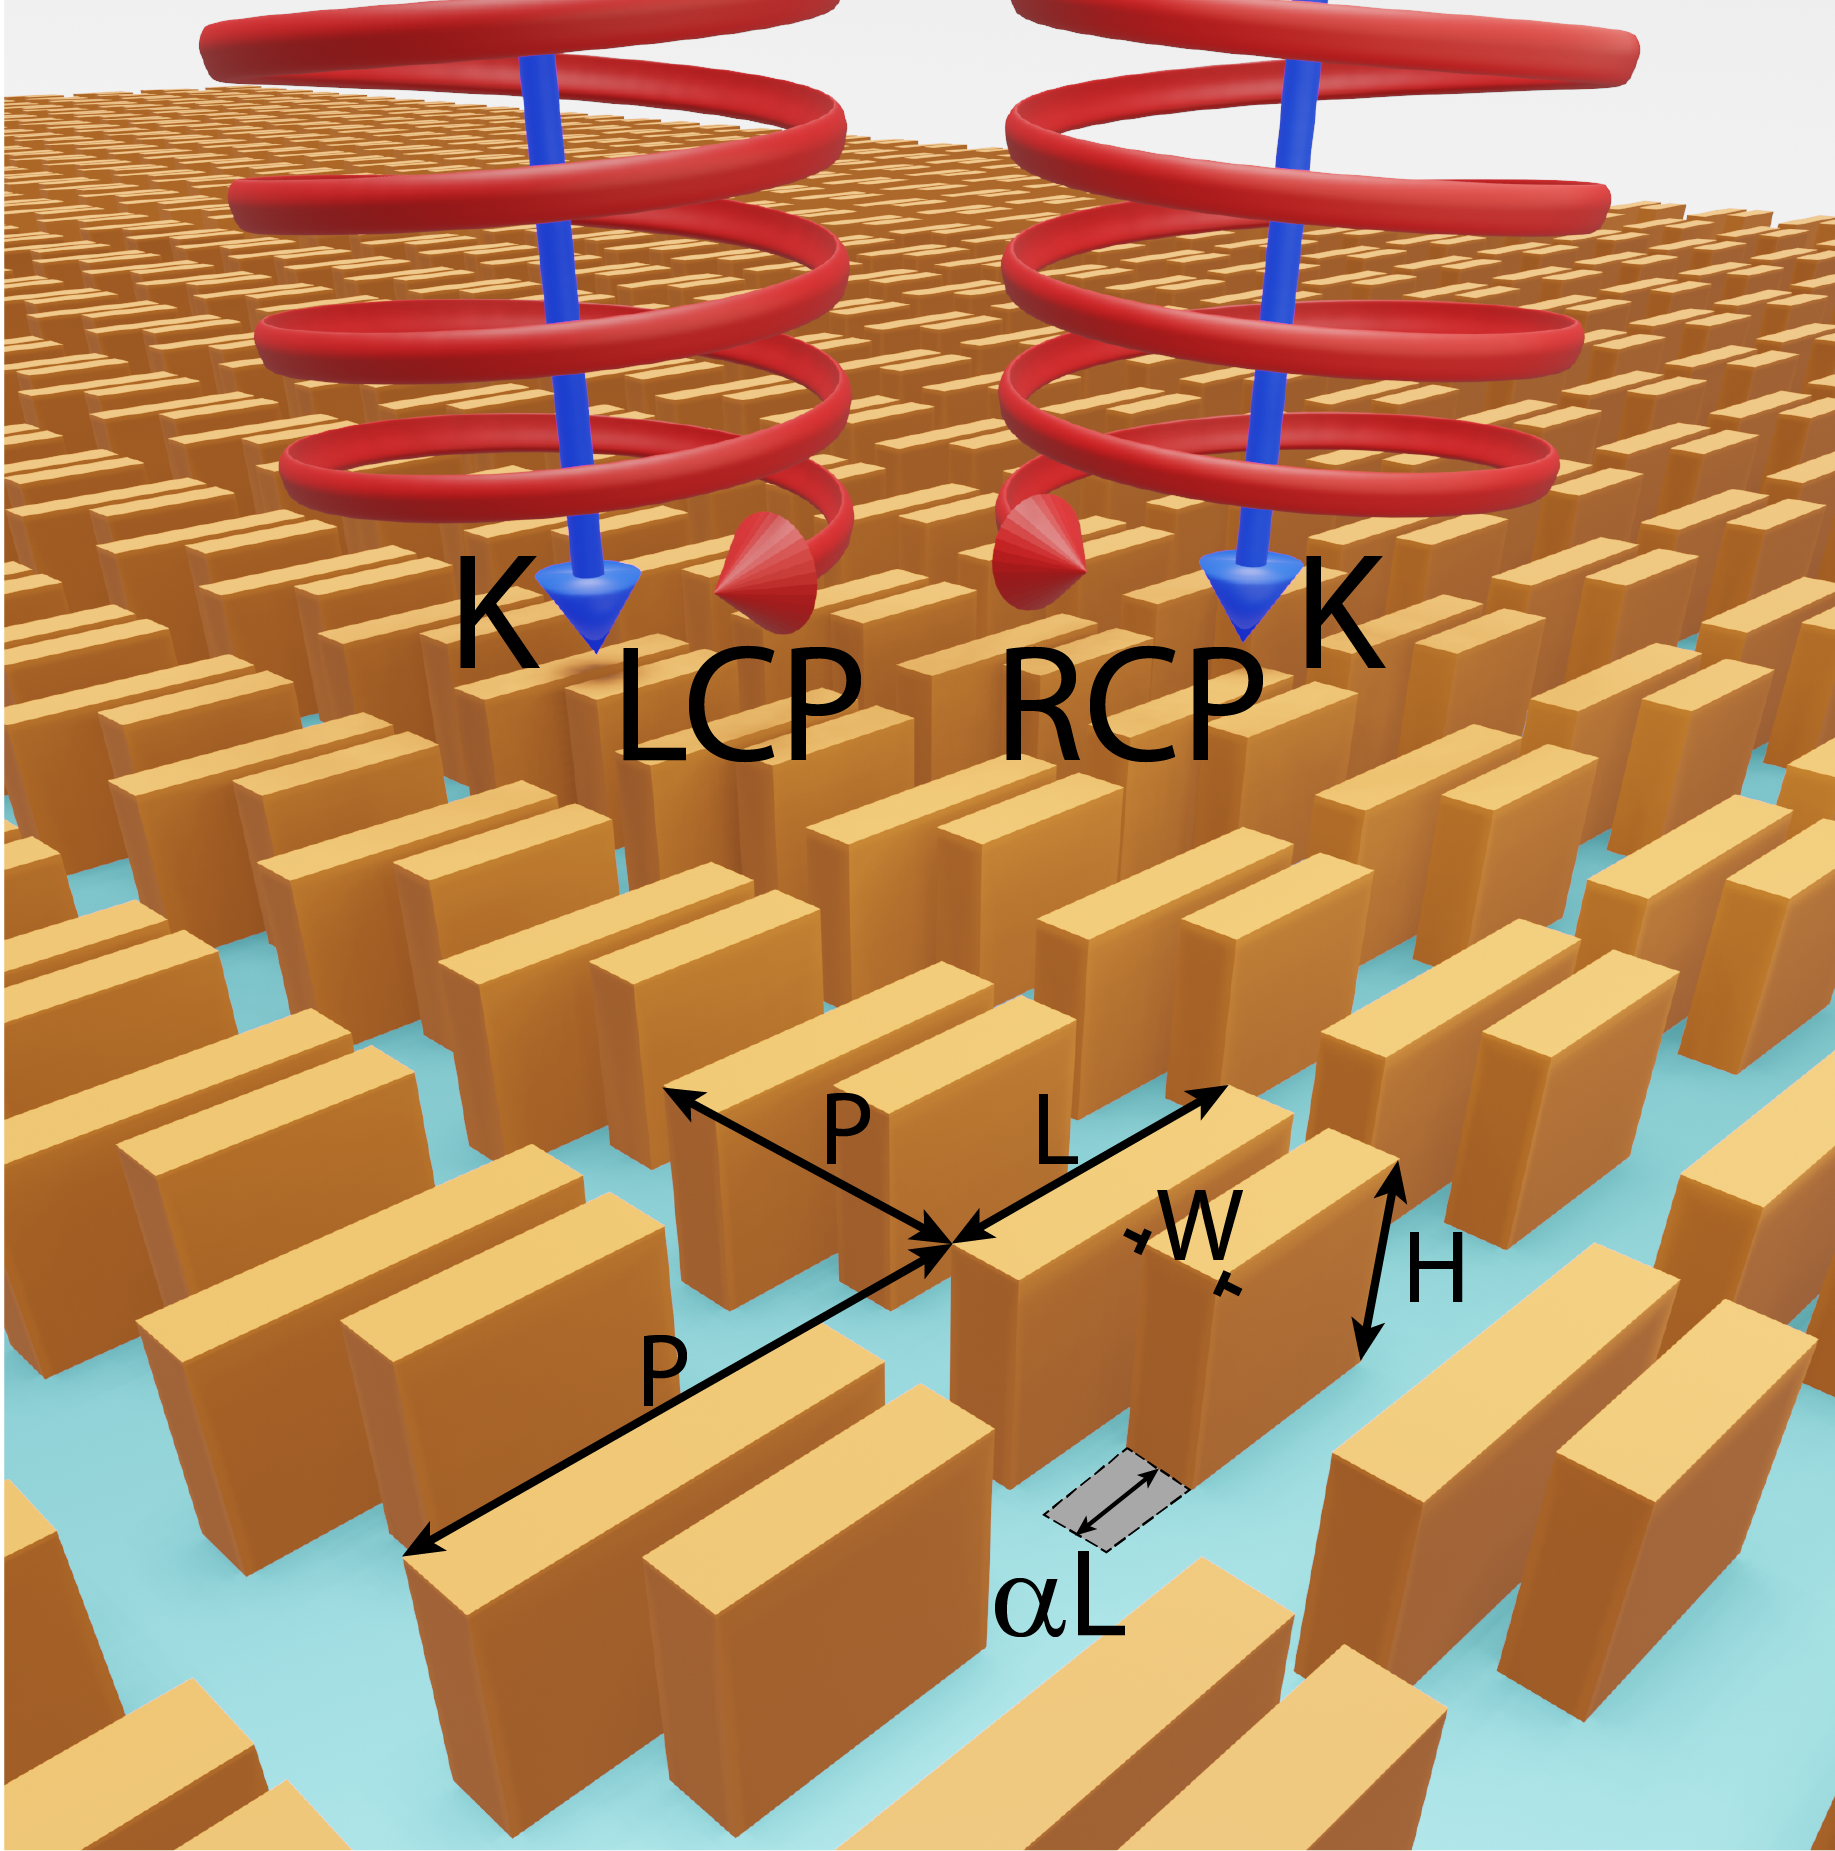
When , this MS can sustain symmetry protected BICs. As the symmetry of the unit cell is broken, the BIC evolves into a quasi-BIC due to the opening of a radiation channel to free-space Koshelev et al. (2018, 2019).
In this work we fix the following geometrical parameters as: , , , and , chosen in order to tune the BIC wavelength in the telecom range.
We develop a full-vectorial numerical model in COMSOL Multiphysics Gandolfi et al. (2018) for the calculation of the optical eigenmodes in the structure (see Appendix for further details).
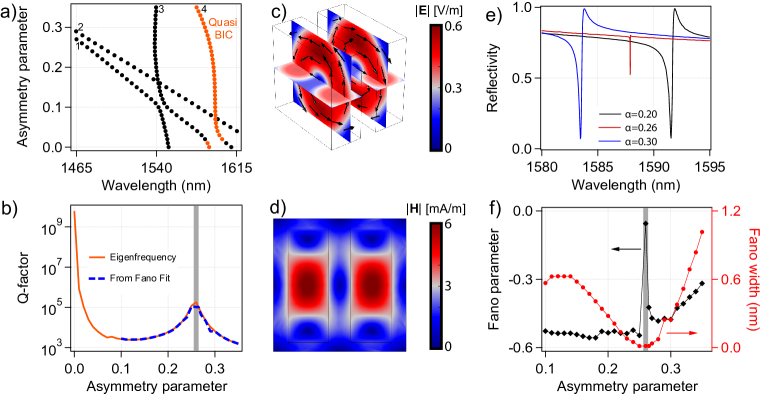
We start our analysis from the case nm and we study how the modes in the MS evolve as the asymmetry parameter increases from up to . Fig. 2a shows the wavelength, , (horizontal axis) of the MS eigenmodes as a function of the asymmetry parameter (vertical axis). We highlight in orange the quasi-BIC which is characterized by a much higher -factor, the latter defined as
| (1) |
where is the complex eigenfrequency of the mode.
The -factor of the quasi-BIC as a function of is shown in
Fig. 2b (orange curve). For , the -factor diverges towards infinity and observation of the electric and magnetic
field profiles shown in Figs. 2c and 2d reveals that
it is a symmetry protected BIC.
In particular, each block sustains a magnetic dipole mode with opposite momentum that results in an odd-symmetric y-component of the electric field at the MS-air interface.
As is slightly increased (), the BIC evolves into a quasi-BIC due to the opening of a radiation channel to free-space and Koshelev et al. (2018, 2019).
For further increase of , we notice that the -factor shows a local maximum around the critical value .
The origin of the latter can be ascribed to accidental BIC formed due to a simultaneous destructive interference of leakage channels Hsu et al. (2016), as demonstrated at THz frequencies Han et al. (2021).
The quasi-BIC physics is further investigated by solving the electromagnetic scattering problem with full-vectorial numerical calculations (see Appendix for further details).
The incident light is linearly polarized with the electric filed parallel to the block side with length and it impinges on the MS from the air side at normal incidence.
The reflectivity as a function of the wavelength is computed for different asymmetry parameters, .
In Fig. 2e, we report the reflectivity for three cases, i.e. in proximity of the -factor local maximum (red curve) and on the two flanks (black and blue curves).
The spectra show a marked Fano resonance in proximity of the quasi-BIC wavelength. At the critical value the resonance width shrinks, consistently with the modal -factor enhancement.
We fit the reflectivity (R) spectra with a Fano function Limonov et al. (2017):
| (2) |
where is the photon energy, is the resonance energy, is the resonance full width at half maximum (FWHM), is the Fano parameter, is an offset, and is a multiplicative constant.
In Fig. 2f we report the Fano parameter, , (left axis, black) and (right axis, red) as function of the asymmetry parameter, .
Below the quasi-BIC is very close to another mode with lower -factor (see Fig. 2a), thus our fit with a single Fano resonance does not allow a careful reproduction of the reflectivity curve.
The dashed blue line in Fig. 2b shows the -factor retrieved from Fano fit on the reflectivity curves obtained from the full vectorial simulations (calculated as ).
This is in excellent agreement with the eigenmode analysis results, meaning that the two methods are consistent and reliable.
We observe that the Fano parameter, , is always negative except in proximity of , meaning that in the latter situation the quasi-BIC and the continuum phases are shifted by almost Limonov et al. (2017).
The quasi-BIC with high -factor occurring for is very interesting for technological applications.
This scenario, corresponding to a MS with a high asymmetry, supporting a Fano resonance, and exhibiting a strong electric field enhancement at the same time, is the perfect playground where nonlinear CD may be observed.
Indeed, the exploitation of a quasi-BIC with high -factor is beneficial to enhance the electric field within the structure.
Temporal coupled-mode theory indicates that the coupling efficiency of the incident energy to the resonator scales as the inverse of the -factor while the electric field is enhanced due to the resonant response of the resonator and scales as Maier (2006). As a result, the electric field enhancement inside the resonator is proportional to , thus the quasi-BIC is expected to yield a strong electric field enhancement that is beneficial to enhance optical nonlinearities Carletti et al. (2018); Koshelev et al. (2020).
For these reasons, we investigate the MS response to circularly polarized (CP) light at normal incidence when .
We solve the electromagnetic problem for different values of , both for LCP and RCP light, in order to analyze the CD.
We use the following convention to define the CD of a certain variable Chen et al. (2016); Tang et al. (2020):
| (3) |
The first variable for which we calculate the CD is the average intensity enhancement, defined as:
| (4) |
where and are the local and the incident light intensity, and is the volume of the two Si blocks.
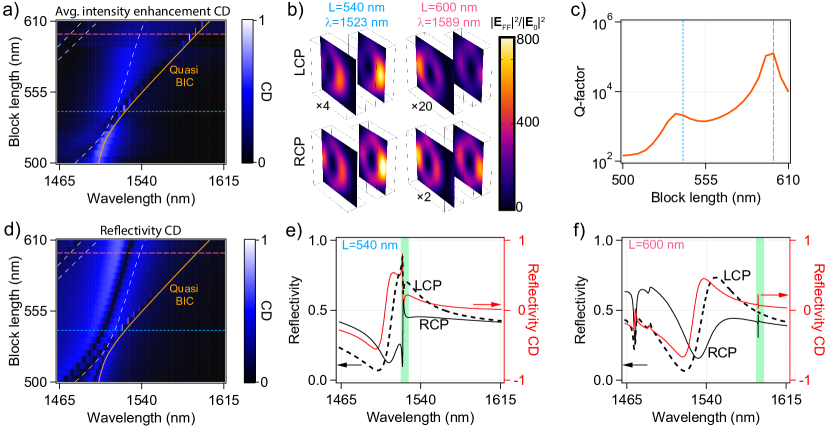
Fig. 3a shows the average intensity enhancement CD as a function of and wavelength.
A high average intensity enhancement CD can be observed when the wavelength of the incident light is tuned in proximity of a MS mode.
In particular a strong average intensity enhancement CD up to is observed close to the quasi-BIC wavelength (orange line) for and (cyan and magenta dashed lines).
The strong average intensity enhancement CD occurring at the quasi-BIC for 540 and 600 nm can also be observed in Fig. 3b, where the map of inside the Si blocks is reported ( and are the incident and the local electric field at the fundamental frequency, respectively).
We can observe that the quasi-BIC is selectively excited by RCP incident light and only weakly excited by LCP light. Furthermore, the high maximum intensity enhancement (up to 800) is due to the high quasi-BIC -factor that is shown as a function of the block length in Fig. 3c.
Scenarios with high average intensity enhancement CD and high intensity enhancements are promising for the achievement of nonlinear CD in THG with high conversion efficiency.
Indeed, if the intensity enhancement within the Si blocks is very different upon LCP or RCP excitation, then we expect that the THG may follow the same trend.
Fig. 3d shows the reflectivity CD () spectra as a function of block length, . We can observe that around the quasi-BIC is high for nm, but not for nm.
To better appreciate this aspect, we plot the reflectivity curves (left axes, black) as a function of the wavelength (horizontal axes) for nm (Fig. 3e) and for nm (Fig. 3f).
The dashed and solid black lines correspond to LCP and RCP light illumination, respectively.
The reflectivity CD is reported as a red line (right axis, red).
As we can see, in proximity of the quasi-BIC (green vertical bar), the reflectivity CD is much higher in the case of nm () than for nm ().
The high CD obtained for the MS with nm is due to interference between the quasi-BIC and the other mode of the MS in the same wavelength range.
Indeed, by analysing the field distributions of these modes, we can observe that while the quasi-BIC originates from a magnetic resonance, the second resonance corresponds to an electric resonance (see Fig. A2 of Appendix).
This enhancement of both electric and magnetic fields provides an enhancement of the electromagnetic density of chirality Solomon et al. (2018).
We point out that the linear CD for the transmittivity shows the same trend as .
We analyze the THG of the MS using full-vectorial numerical simulations assuming an undepleted pump regime Smirnova et al. (2016) (see Appendix for further details).
We tune the pump wavelength in proximity of the quasi-BIC and evaluate the normalized TH conversion efficiency , where and are the power at the frequency emitted by the MS (in all diffraction modes and towards both air and substrate) and the incident pump power, respectively.
The conversion efficiency is maximum when the pump is tuned at the quasi-BIC wavelength regardless of the incident polarization handedness.
The peak value is W-2 (see Figs. A1 c and d of Appendix). This is comparable with the measured THG efficiency of hybrid multiple quantum-well and Gammadion-type plasmonic chiral nanoresonators Kim et al. (2020), and higher than state-of-the-art demonstration in all-dielectric structures Liu et al. (2019).
The wavelength
of the TH occurs in the absorption band of the silicon Green (2008).
As a consequence, resonant modes in that range would be spectrally broad and are not expected to significantly contribute to the enhancement of the emitted TH signal.
This is also confirmed from the fact that the peak THG efficiency is obtained for a pump wavelength precisely corresponding to the quasi-BIC and that, as the pump wavelength is changed close to the quasi-BIC condition, the THG efficiency follows the quasi-BIC spectral signature.
If a mode at the TH wavelength significantly contributed to the enhancement of the THG efficiency, the peak of the latter would more likely occur at a slightly different light wavelength and result in a spectrally broader peak. This is not the case, confirming that the resonance at the pump wavelength is the leading mechanism to achieve a high THG conversion efficiency.
The THG emission is distributed over 9 diffraction orders since the TH wavelength is shorter than the MS period, .
We focus our attention on the THG emitted in the (0,0) diffraction order in air. This light is emitted normally to the MS plane and can be collected by using low-cost optics with small numerical aperture.
By defining and the THG emitted powers with right-hand, RH, or left-hand, LH, polarization, we can define the polarization-dependent TH conversion efficiency through the (0,0) diffraction order as for RH light and for LH light, where is the incident pump power.
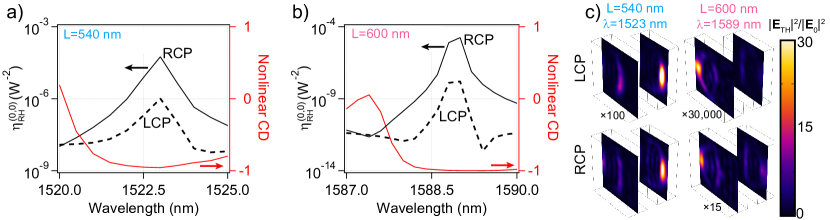
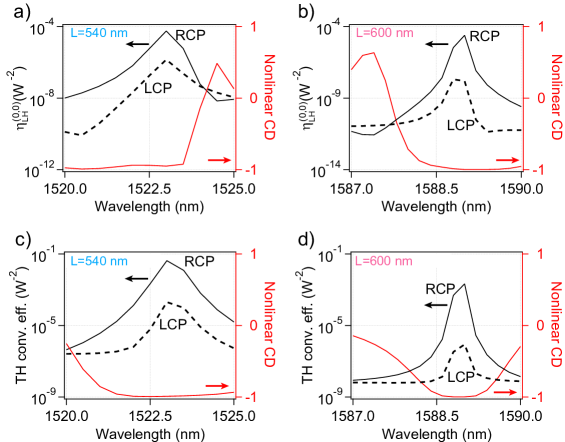
In Figs. 4a and 4b we report (left axes, black, log scale) as a function of the incident wavelength for and nm, respectively.
In particular, the full black (dashed black) lines are obtained for a RCP (LCP) pump.
The strong differences between obtained with RCP vs LCP pump imply the presence of an important THG CD.
The latter is plotted in Figs. 4a and 4b as red lines (right axes, red).
As we can see, in both cases the THG CD is very high in absolute value, up to 1.
Indeed, may differ by more than 2 orders of magnitude if the pump is LCP or RCP.
This is due to a selective excitation of the quasi-BIC with RCP incident light with respect to LCP as observed in Fig. 3b.
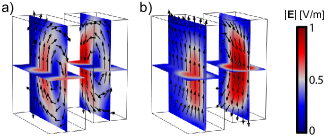
Consequently, the TH fields in the MS are mainly focused in the region corresponding to high intensity enhancement at the quasi-BIC wavelength (see Fig. 3b) and increase considerably depending on the polarization handedness as it can be observed in Fig. 4c, where the map of within the Si blocks is reported ( being the electric field at frequency ).
We point out that these results are obtained for RCP TH light emitted in (0,0) diffraction order towards the air.
However, identical results in terms of nonlinear CD are observed for any other diffraction order (including the ones towards the substrate) and also for LCP THG (in Figs. A1 a and b of Appendix we report the plot of and its CD).
The same conclusions extend to the TH conversion efficiency summed over all the diffraction orders (see Figs. A1 c and d of Appendix).
In conclusion, we have used extensive numerical simulations to characterize the linear and nonlinear chiro-optical response of a Si MS with a broken-symmetry supporting a quasi-BIC with high () -factor.
Exploiting the consequent strong electric field confinement, we demonstrate a THG conversion efficiency up to W-2.
Owing to the chiral broken-symmetry and the mode interaction in the MS, selective excitation of the quasi-BIC is achieved for RCP incident light. This results in near-unity nonlinear CD (or THG CD) with high conversion efficiency that is comparable to state-of-the-art hybrid multi-quantum-well structures demonstrated in the infrared Kim et al. (2020).
Furthermore, by tuning the length of the blocks we observe that the linear CD in reflectivity can be enhanced due to multi-mode interference quite independently from the THG CD.
Indeed, for block length nm both the reflectivity and THD CDs are high () for incident light wavelength at quasi-BIC. On the other hand, for nm and at the quasi-BIC wavelength only the THG CD is high (), whereas the reflectivity CD does not exceed 0.25.
These results show the potential of lossless all-dielectric MSs for nonlinear CD and pave the way for new applications requiring a precise control of the spin of the light such as telecommunications, quantum optics, holography, information storage, and biology.
Acknowledgements.
This work is partially funded by the European Commission Horizon 2020 H2020-FETOPEN-2018-2020 grant agreement no. 899673 (METAFAST), by the National Research Council Joint Laboratories program, project SAC.AD002.026 (OMEN), and by the Italian Ministry of University and Research (MIUR) through the PRIN project NOMEN (2017MP7F8F).Appendix
Modelling. The numerical models are developed in COMSOL Multiphysics. The refractive index for the Si blocks is taken from Ref. Green (2008), while the refractive index for the silica substrate is for all the considered wavelengths Malitson (1965).
The computational cell is a block corresponding to the unit cell of the MS.
Periodic boundary conditions are enforced, in order to mimic the MS.
The air and substrate domains are truncated with perfectly matched layers (PML) domains to avoid spurious reflections Gandolfi et al. (2018).
Eigenmode analysis. An eigenfrequency solver is used to find the MS modes in the telecom region. The refractive index dispersion of Si is accounted by using an auxiliary-field formulation Yan et al. (2018). The Si permittivity from Ref. Green (2008) at wavelengths between and is modeled with a single pole Lorentz-Drude model
with , , , and .
Linear simulations. The reflectivity and transmittivity spectra are obtained using two ports at the air-PML and substrate-PML boundaries. The excitation is set only on the former port by setting either a linearly or a circularly polarized plane wave.
A frequency domain solver is used to compute the fields at the same frequency of the incident radiation.
THG simulations. The electric fields calculated with the linear simulations are used to calculate the nonlinear polarization in the Si blocks, defined as:
where m2/V2 and
Moss et al. (1990); Smirnova et al. (2016).
The nonlinear polarization is used as a source term for the TH calculations and
no other sources are present (i.e. there are no ports).
A frequency domain study is used to compute the fields at frequency . The power, , emitted by the MS at frequency is:
where is the Poynting vector at frequency , is the external surface of the air and substrate domains (i.e. the surface in contact with the PML domains), and
is the unit vector normal to the surface pointing outside the computational domain (i.e. in the opposite direction with respect to the MS).
CD for LH light emitted through the diffraction order (0,0) towards the air.
In Fig. A1 a) and b) we report and its CD, as functions of the wavelength, in analogy to Fig. 4.
Normalized total THG conversion efficiency. In Fig. A1 c) and d) we report the total TH conversion efficiency vs pump wavelength, where is the power at the frequency emitted by the MS in all diffraction orders, towards both air and substrate and with both LCP and RCP polarizations.
The full black (dashed black) line is obtained for RCP (LCP) pump.
is the incident pump power. The corresponding nonlinear CD is reported as red lines (right axes, red).
-factor reduction due to fabrication defects. The results reported in the manuscript are obtained for an ideal structure, with structures with vertical and smooth side-walls and infinite, exactly identical unit cells. A fabricated device, provided that the patterned area is large enough to accommodate some tens of unit cells, will differ from this ideal structure mainly in both side-wall quality (verticality and roughness) and lattice uniformity. These fabrication imperfections and defects will decrease the photons lifetime in the mode. To account for these phenomena, we can define a photon lifetime associated with fabrication features. Hence, the total photons lifetime, , may be expressed as
where is the photon lifetime of the ideal structure.
Thus, the lifetime strongly depends on the specific fabrication procedure used for the realization of the metasurface.
The -factor is equal to with the angular frequency of the quasi-BIC.
The photons lifetime due to fabrication related features decreases the -factor according to
Comparing the measured -factor with simulations results, an estimation of lifetime can be obtained.
Electric field profiles of the quasi-BIC and the closer mode for the structure with nm. In Fig. A2a we report the electric field profile of the quasi-BIC mode of the structure with nm and , occurring at wavelength 1525 nm.
The mode profile shows a magnetic resonance.
In Fig. A2b we display the electric field profile of the other mode, at wavelength 1515 nm, falling closer to the quasi-BIC.
This second mode corresponds to an electric resonance.
Marco Gandolfi, Andrea Tognazzi, Davide Rocco, Costantino De Angelis, and Luca Carletti
Phys. Rev. A 104, 023524.
Copyright 2021 by the American Physical Society.
References
- Wang et al. (2012) J. Wang, J.-Y. Yang, I. M. Fazal, N. Ahmed, Y. Yan, H. Huang, Y. Ren, Y. Yue, S. Dolinar, M. Tur, et al., Nature photonics 6, 488 (2012).
- Wang et al. (2015) X.-L. Wang, X.-D. Cai, Z.-E. Su, M.-C. Chen, D. Wu, L. Li, N.-L. Liu, C.-Y. Lu, and J.-W. Pan, Nature 518, 516 (2015).
- Virte et al. (2013) M. Virte, K. Panajotov, H. Thienpont, and M. Sciamanna, Nature Photonics 7, 60 (2013).
- Barron (2009) L. D. Barron, Molecular light scattering and optical activity (Cambridge University Press, 2009).
- Estephan et al. (2010) E. Estephan, D. Bajoni, M.-b. Saab, T. Cloitre, R. Aulombard, C. Larroque, L. C. Andreani, M. Liscidini, A. M. Malvezzi, and C. Gergely, Langmuir 26, 10373 (2010).
- Pellegrini et al. (2018) G. Pellegrini, M. Finazzi, M. Celebrano, L. Duò, and P. Biagioni, Chirality 30, 883 (2018).
- Ni et al. (2013) X. Ni, A. V. Kildishev, and V. M. Shalaev, Nature communications 4, 1 (2013).
- Lee et al. (2020) D. Lee, J. Gwak, T. Badloe, S. Palomba, and J. Rho, Nanoscale Advances 2, 605 (2020).
- Sterzik et al. (2012) M. F. Sterzik, S. Bagnulo, and E. Palle, Nature 483, 64 (2012).
- Salvail et al. (2013) J. Z. Salvail, M. Agnew, A. S. Johnson, E. Bolduc, J. Leach, and R. W. Boyd, Nature Photonics 7, 316 (2013).
- Wang et al. (2016) Z. Wang, F. Cheng, T. Winsor, and Y. Liu, Nanotechnology 27, 412001 (2016).
- Valev et al. (2013) V. K. Valev, J. J. Baumberg, C. Sibilia, and T. Verbiest, Advanced Materials 25, 2517 (2013).
- Mun et al. (2020) J. Mun, M. Kim, Y. Yang, T. Badloe, J. Ni, Y. Chen, C.-W. Qiu, and J. Rho, Light: Science & Applications 9, 1 (2020).
- Hentschel et al. (2017) M. Hentschel, M. Schäferling, X. Duan, H. Giessen, and N. Liu, Science advances 3, e1602735 (2017).
- Keren-Zur et al. (2016) S. Keren-Zur, O. Avayu, L. Michaeli, and T. Ellenbogen, Acs Photonics 3, 117 (2016).
- Zhao et al. (2012) Y. Zhao, M. Belkin, and A. Alù, Nature communications 3, 1 (2012).
- Pendry (2004) J. Pendry, Science 306, 1353 (2004).
- Ye et al. (2016) W. Ye, F. Zeuner, X. Li, B. Reineke, S. He, C.-W. Qiu, J. Liu, Y. Wang, S. Zhang, and T. Zentgraf, Nature communications 7, 1 (2016).
- Li et al. (2015) W. Li, Z. J. Coppens, L. V. Besteiro, W. Wang, A. O. Govorov, and J. Valentine, Nature communications 6, 1 (2015).
- Fasold et al. (2018) S. Fasold, S. Linß, T. Kawde, M. Falkner, M. Decker, T. Pertsch, and I. Staude, ACS Photonics 5, 1773 (2018), ISSN 23304022.
- Tanaka et al. (2020) K. Tanaka, D. Arslan, S. Fasold, M. Steinert, J. Sautter, M. Falkner, T. Pertsch, M. Decker, and I. Staude, ACS nano (2020).
- Hopkins et al. (2016) B. Hopkins, A. N. Poddubny, A. E. Miroshnichenko, and Y. S. Kivshar, Laser & Photonics Reviews 10, 137 (2016).
- Kuznetsov et al. (2012) A. Kuznetsov, A. Miroshnichenko, Y. Fu, J. Zhang, and B. Luk’Yanchuk, Rep 2, 492 (2012).
- Anthur et al. (2020) A. P. Anthur, H. Zhang, R. Paniagua-Dominguez, D. A. Kalashnikov, S. T. Ha, T. W. Maß, A. I. Kuznetsov, and L. Krivitsky, Nano Letters (2020).
- Gómez et al. (2019) F. R. Gómez, J. R. Mejía-Salazar, and P. Albella, ACS omega 4, 21041 (2019).
- Gorkunov et al. (2018) M. V. Gorkunov, O. Y. Rogov, A. V. Kondratov, V. V. Artemov, R. V. Gainutdinov, and A. A. Ezhov, Scientific reports 8, 1 (2018).
- Ullah et al. (2018) K. Ullah, B. Garcia-Camara, M. Habib, X. Liu, A. Krasnok, S. Lepeshov, J. Hao, J. Liu, and N. Yadav, Journal of Quantitative Spectroscopy and Radiative Transfer 208, 71 (2018).
- Zhu et al. (2018) A. Y. Zhu, W. T. Chen, A. Zaidi, Y.-W. Huang, M. Khorasaninejad, V. Sanjeev, C.-W. Qiu, and F. Capasso, Light: Science & Applications 7, 17158 (2018).
- Solomon et al. (2018) M. L. Solomon, J. Hu, M. Lawrence, A. García-Etxarri, and J. A. Dionne, ACS Photonics 6, 43 (2018).
- Hu et al. (2019) J. Hu, M. Lawrence, and J. A. Dionne, ACS Photonics 7, 36 (2019).
- Wu et al. (2014) C. Wu, N. Arju, G. Kelp, J. A. Fan, J. Dominguez, E. Gonzales, E. Tutuc, I. Brener, and G. Shvets, Nature communications 5, 1 (2014).
- Ma et al. (2018) Z. Ma, Y. Li, Y. Li, Y. Gong, S. A. Maier, and M. Hong, Optics express 26, 6067 (2018).
- Gorkunov et al. (2020) M. V. Gorkunov, A. A. Antonov, and Y. S. Kivshar, Physical Review Letters 125, 093903 (2020).
- Overvig et al. (2021) A. Overvig, N. Yu, and A. Alù, Physical Review Letters 126, 073001 (2021).
- Li et al. (2017) G. Li, S. Zhang, and T. Zentgraf, Nature Reviews Materials 2, 1 (2017).
- Ren et al. (2012) M. Ren, E. Plum, J. Xu, and N. I. Zheludev, Nature communications 3, 1 (2012).
- Chen et al. (2016) S. Chen, F. Zeuner, M. Weismann, B. Reineke, G. Li, V. K. Valev, K. W. Cheah, N. C. Panoiu, T. Zentgraf, and S. Zhang, Advanced Materials 28, 2992 (2016).
- Tang et al. (2020) Y. Tang, Z. Liu, J. Deng, K. Li, J. Li, and G. Li, Laser & Photonics Reviews p. 2000085 (2020).
- Kim and Kim (2020) K.-H. Kim and J.-R. Kim, Annalen der Physik p. 2000078 (2020).
- Kim et al. (2020) D. Kim, J. Yu, I. Hwang, S. Park, F. Demmerle, G. Boehm, M.-C. Amann, M. A. Belkin, and J. Lee, Nano Letters 20, 8032 (2020).
- Makarov et al. (2017) S. V. Makarov, M. I. Petrov, U. Zywietz, V. Milichko, D. Zuev, N. Lopanitsyna, A. Kuksin, I. Mukhin, G. Zograf, E. Ubyivovk, et al., Nano letters 17, 3047 (2017).
- Pertsch and Kivshar (2020) T. Pertsch and Y. Kivshar, MRS Bulletin 45, 210 (2020).
- Carletti et al. (2018) L. Carletti, K. Koshelev, C. De Angelis, and Y. Kivshar, Physical review letters 121, 033903 (2018).
- Koshelev et al. (2020) K. Koshelev, S. Kruk, E. Melik-Gaykazyan, J.-H. Choi, A. Bogdanov, H.-G. Park, and Y. Kivshar, Science 367, 288 (2020).
- Carletti et al. (2019) L. Carletti, S. S. Kruk, A. A. Bogdanov, C. De Angelis, and Y. Kivshar, Physical Review Research 1, 023016 (2019).
- Koshelev et al. (2019) K. Koshelev, Y. Tang, K. Li, D.-Y. Choi, G. Li, and Y. Kivshar, ACS Photonics 6, 1639 (2019).
- Liu et al. (2019) Z. Liu, Y. Xu, Y. Lin, J. Xiang, T. Feng, Q. Cao, J. Li, S. Lan, and J. Liu, Physical Review Letters 123, 253901 (2019).
- Frizyuk et al. (2021) K. Frizyuk, E. Melik-Gaykazyan, J.-H. Choi, M. I. Petrov, H.-G. Park, and Y. Kivshar, Nano Letters (2021).
- Koshelev et al. (2018) K. Koshelev, S. Lepeshov, M. Liu, A. Bogdanov, and Y. Kivshar, Physical review letters 121, 193903 (2018).
- Gandolfi et al. (2018) M. Gandolfi, A. Crut, F. Medeghini, T. Stoll, P. Maioli, F. Vallée, F. Banfi, and N. Del Fatti, The Journal of Physical Chemistry C 122, 8655 (2018).
- Hsu et al. (2016) C. W. Hsu, B. Zhen, A. D. Stone, J. D. Joannopoulos, and M. Soljačić, Nature Reviews Materials 1, 16048 (2016), ISSN 2058-8437, URL http://www.nature.com/articles/natrevmats201648.
- Han et al. (2021) S. Han, P. Pitchappa, W. Wang, Y. K. Srivastava, M. V. Rybin, and R. Singh, Advanced Optical Materials n/a, 2002001 (2021), ISSN 2195-1071, URL https://onlinelibrary.wiley.com/doi/10.1002/adom.202002001.
- Limonov et al. (2017) M. F. Limonov, M. V. Rybin, A. N. Poddubny, and Y. S. Kivshar, Nature Photonics 11, 543 (2017).
- Maier (2006) S. A. Maier, Optics Express 14, 1957 (2006).
- Smirnova et al. (2016) D. A. Smirnova, A. B. Khanikaev, L. A. Smirnov, and Y. S. Kivshar, ACS Photonics 3, 1468 (2016).
- Green (2008) M. A. Green, Solar Energy Materials and Solar Cells 92, 1305 (2008), ISSN 09270248, URL https://www.sciencedirect.com/science/article/pii/S0927024808002158?via{%}3Dihubhttps://linkinghub.elsevier.com/retrieve/pii/S0927024808002158.
- Malitson (1965) I. H. Malitson, Josa 55, 1205 (1965).
- Yan et al. (2018) W. Yan, R. Faggiani, and P. Lalanne, Physical Review B 97, 205422 (2018), URL https://link.aps.org/doi/10.1103/PhysRevB.97.205422.
- Moss et al. (1990) D. Moss, E. Ghahramani, J. Sipe, and H. Van Driel, Physical Review B 41, 1542 (1990).