Creepy Technology:
What Is It and How Do You Measure It?
Abstract.
Interactive technologies are getting closer to our bodies and permeate the infrastructure of our homes. While such technologies offer many benefits, they can also cause an initial feeling of unease in users. It is important for Human-Computer Interaction to manage first impressions and avoid designing technologies that appear creepy. To that end, we developed the Perceived Creepiness of Technology Scale (PCTS), which measures how creepy a technology appears to a user in an initial encounter with a new artefact. The scale was developed based on past work on creepiness and a set of ten focus groups conducted with users from diverse backgrounds. We followed a structured process of analytically developing and validating the scale. The PCTS is designed to enable designers and researchers to quickly compare interactive technologies and ensure that they do not design technologies that produce initial feelings of creepiness in users.
1. Introduction
When creating novel interactive technologies, be it for research or practical purposes, managing first impressions is key (Harrison et al., 2015; Nourani et al., 2020; Reinecke et al., 2013). A technology that looks intimidating, scary or unpleasant is unlikely to engage the user’s willingness to interact with it. This challenge becomes even more salient when dealing with technologies that reflect recent trends in Human-Computer Interaction (HCI) such as wearable computing (Kelly and Gilbert, 2016) or sensory amplification (Schmidt, 2017). While such trends promise attractive technological futures, they also envision many technologies that could initially be perceived negatively. As a consequence, designers of future technologies need to understand how to build technologies that offer positive first impressions. This gives rise to the need for methods that would enable designers to compare alternative prototypes in terms of first impressions.
The HCI field has a history of studying technologies that users perceive as potentially creepy. Privacy research used the term creepy to describe technologies that were perceived as potentially encroaching on the users’ privacy, e.g. (Pierce, 2019). Research in avatars and robots equated creepy with uncanny (Ho et al., 2008) to denote humanoid representations that produce a certain unease in users. However, the use of the term was not exclusive to these two domains. Past research has reported that self-driving cars (Moore et al., 2019a), traffic lights (Paredes et al., 2016), headphones (Grinter and Woodruff, 2002), voice assistants (Seymour and Van Kleek, 2020) or toilets (LLC, 2014) could also be creepy.
More and more people are beginning to encounter creepy technologies in their everyday lives. Newspapers report about technologies from dating apps (Burgess, 2018) to speakers (Dugan, 2018) being perceived as creepy. A recent concern is facial recognition technology, which is beginning to be deployed in physical and online stores to help retailers improve how they customise the shopping experience. Smart AI platforms are emerging that can detect at a glance our gender, race, approximate age, where and how long we have been looking at something, and in what emotional state we are (Hill, 2020). Further, creepy technologies are not only developed by corporations but also by users themselves. Modern development tools enable proficient users to develop personal apps such as a chatbot for talking to a late friend based on past conversations (Matei, 2017). In this case, even the creator of the chatbot was concerned that the application could be creepy. As users are increasingly likely to experience creepiness in everyday interactions, HCI needs to understand more about the phenomenon to minimise the negative impact of future interactive technologies.
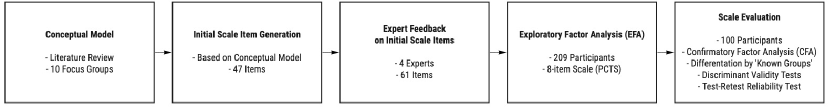
To this end, this paper explores the qualities in technology that give users the heebie-jeebies. We propose a structured framing of the creepiness of interactive technologies and proposes an accompanying measurement instrument—the Perceived Creepiness of Technology Scale (PCTS). We followed a structured scale development process where we first formed a conceptual understanding of creepiness, followed by empirically building the scale using the guidelines collected by Boateng et al. (Boateng et al., 2018). We first investigated past work in HCI and identified papers which reported technologies being creepy outside of the humanoid or robotics fields. To empirically explore how users think about creepiness, we then conducted a set of ten focus groups where users expressed their opinions about potentially creepy technologies. Based on the literature and our analysis of the focus group content, we then proposed a general framing of the concept for HCI. The elements of the model served as an inspiration to generate initial items for the scale, which were then subjected to an expert review. We used exploratory factor analysis to reduce the number of items and obtain the final scale, which was then validated in a number of evaluation assessments. For an overview of our scale development process, see Figure 1. Our work offers the first, to our knowledge, conceptualisation of creepiness in HCI and a validated scale for assessing the creepiness of interactive artefacts.
2. Related Work
To frame our inquiry, we first chart the use of the concept of creepiness and the adjective creepy in past research. We report on how the terms were used in privacy research and Human-Robot Interaction. We then investigate the relationship between creepiness and acceptability. Finally, we report on how creepiness was ascribed to non-humanoid digital artefacts in past HCI research.
2.1. Creepiness in privacy research
Studies in privacy of personal technologies have extensively used the term creepy to refer to technologies that are perceived as potentially threatening privacy. Creepiness was particularly ascribed to technologies that collect personal information about their users. Pierce (Pierce, 2019) researched speculative scenarios for home cameras and concluded that minute details in the design of home devices led to different levels of creepiness. This work calls for unpacking the reasons behind creepiness and shows how creepy a device is perceived is influenced by diverse factors. Zhang et al. (Zhang et al., 2014) studied how targeted advertisements evoked feelings of creepiness in users. The study focused on the consequences of this on the use of social media and not the sources of creepiness per se. Also, in the context of advertising, Ur et al. (Ur et al., 2012) reported that creepiness was associated with the feeling of being followed. Importantly for our understanding of creepiness, Shklovski et al. (Shklovski et al., 2014) found that creepiness was not connected to an anticipated negative end result of using a technology while studying mobile app use. In this context, both Sklovski et al. and Phelan et al. (Phelan et al., 2016) equated creepy with disturbing. The later paper underlined the intuitiveness of the concept with creepiness (intuitive concern) being less rational than considered concern. Other research also reported creepiness in the context of privacy violation when users were involved in unsolicited meetings on social media (Barkhuus and Tashiro, 2010) and crowdworking (Hanson et al., 2020). The examples listed here are just a few, illustrating the breadth of the use of the term creepy in privacy research. While this body of research addresses a broad scope of applications, it shares a common understanding of creepiness as an, often unspoken and innate, anticipation of the technology violating ethical principles held by the user. Our work is inspired by accounts of creepiness in privacy research. We aim, however, to broaden the scope of understanding creepiness beyond privacy concerns.
2.2. Creepiness of humanoid avatars and robots
In research on virtual avatars and Human-Robot Interaction (HRI) the notion of creepiness is primarily associated with ‘uncanniness’ and the uncanny valley phenomenon, i.e. unsettling feelings experienced by someone elicited by an artefact’s spooky resemblance to a human being or other animate beings. Schwind et al. (Schwind et al., 2017) reported how some representations of the users’ hands evoked feelings of creepiness. Early HRI research showed that creepiness was prevalent when robots offered emergency help (Murphy et al., 2004). Lin et al. (Lin et al., 2020) reported that parents wanted to explicitly limit the creepiness of robots when they allowed them to interact with their children. The representation of faces for both robots (Kalegina et al., 2018) and virtual avatars (McDonnell and Breidt, 2010) elicited feelings of creepiness related to the mismatch between their appearance and the user’s expectations. Löffler et al. (Löffler et al., 2020) proposed a different interpretation of creepiness. They used a scale where creepy was the opposite of friendly to assess the perception of animal-like robots. Creepiness has also been viewed as a pragmatic concern, lowering the effectiveness of interaction when robotic assistants helped with analytical tasks (Somanath et al., 2013). HRI work has contributed a number of understandings of creepiness and identified technologies being potentially creepy as a key concern when building new interactive artefacts. In this paper, we extend the notion of creepiness based on HRI experiences and broaden the scope of potentially creepy technologies beyond robots and human-like artefacts.
2.3. Acceptability and creepiness in HCI
Previous research in HCI has often associated the term creepy with social unacceptability. For example, the WEAR scale (Kelly and Gilbert, 2016) explicitly used the adjective creepy as a contribution to the acceptability scale. Consequently, it might appear that creepiness is a subordinate concept to acceptability. This, however, is in conflict with past work discussed above, which reported users willingly using technologies despite their creepiness, e.g. (Phelan et al., 2016). In fact, in Koelle et al.’s (Koelle et al., 2020) review of social acceptability research, the WEAR scale is the only mention of creepiness. Thus, related work suggests that creepiness is a distinct concept from acceptability. Here, we investigate creepiness as one’s personal perception of an artefact, which is different from acceptability, which is understood as the lack of negative reactions from others (Koelle et al., 2020; Kelly and Gilbert, 2016). Thus, while acceptability has an inherently social dimension (Toney et al., 2003), we found no previous work that would suggest that creepiness is necessarily social.
We identified only one paper in HCI which investigated the notion of creepiness in an explicit manner. Yip et al. (Yip et al., 2019) studied perceptions of creepiness in children interacting with technology. They found that the key factors contributing to creepiness were: ‘deception, lack of control, mimicry, ominous physical appearance, and unpredictability’. They based their inquiry on the socionormative formulation of creepiness by Tene and Polonetsky (Tene and Polonetsky, 2014). The results, however, show that creepiness with regard to technology is beyond social norms. The different aspects of creepiness identified by Yip et al. serve as a starting point of our inquiry. The goal of our research is to develop a more structured understanding of these dimensions and a measurement instrument that facilitates comparison in terms of creepiness.
2.4. Creepy Technologies
Having established the two domains where the term creepy was present, we decided to investigate what other, i.e. non-robot and outside of privacy research, technologies studied in HCI were reported to be creepy. To this end, we conducted a literature review in the ACM Digital Library. We used the query ‘creepy NOT privacy NOT robot’111Note that the new ACM DL includes derivative forms of the word, thus, e.g. creep, creeping and creepiness were included as keywords., which resulted in 178 papers in SIGCHI sponsored conferences and an additional 9 papers in the ToCHI journal. We then reviewed all the papers and decided to exclude publications which: (1) used the verb to creep in a figurative sense or to denote movement, (2) referred to creep as a term in materials science, (3) discussed feature creep—a phenomenon in software development and (4) used the term creepy as part of a citation from prior work. This filtering process yielded 31 papers, which we then open-coded to identify key domains where research reported creepy technologies. While the full results of the review are beyond the scope of this paper, we report here the main areas which we identified with selected examples.
Unsurprisingly, the largest group of papers consisted of papers where the design intention was to make the user feel a certain unease. Exploration through provocative art pieces (Oozu et al., 2017; Lee, 2017; Kang et al., 2014) or unconventional artefacts (Šimbelis et al., 2014; Paredes et al., 2016; Annett et al., 2016) was a prevalent theme in the reviewed corpus. The reported research illustrates how creepiness is an aspect of interactive technologies which designers explicitly consider, thus showing a need for a deeper understanding of the concept. We note that all the artefacts in this group featured differing levels of ambiguity (Gaver et al., 2003). This suggests that creepiness is connected to not precisely knowing the nature of the artefact. In a similar way, unconventional audio interactions (Rogers et al., 2018; Kayali et al., 2017) led to not knowing what to expect from a technology and thus experiencing creepiness. For many of these interactive technologies, creepiness may not necessarily be a negative property.
Creepiness when using mediated touch (Pallarino et al., 2016; Levesque et al., 2011; Israr and Abnousi, 2018; Doucette et al., 2013; Gooch and Watts, 2012) also featured highly in the literature. These papers are considered less relevant to the current paper as the users’ perception of unease when using mediated touch was previously defined as disfordance by Mejia and Yarosh (Mejia and Yarosh, 2017) and can be measured with a validated scale. In contrast, our aim is to capture the concept of creepiness for a larger class of artefacts, while building on the lessons learnt from previous research.
Earlier research has noted how interacting with technologies that could be assigned agency was also a source of creepiness. Studies describing interactions with voice assistants (Seymour and Van Kleek, 2020; Parviainen and Søndergaard, 2020) and with autonomous cars (Moore et al., 2019a, b; Gambino and Sundar, 2019) found that both were perceived as creepy. These examples show that creepiness can be experienced where artefacts take an assumed social presence and possibly violate norms related to this presence. An example of this kind of creepiness is how someone feels when crossing the road in front of a driverless car (Moore et al., 2019b).
Some of the other papers reported that interactive technologies that have direct contact with our bodies can be perceived as creepy. In particular, creepiness has been reported for wearables (Grinter and Woodruff, 2002; Genaro Motti and Caine, 2014) and technologies that use physiological sensing (Merrill and Chuang, 2018; Merrill et al., 2019; Kang et al., 2016; Boem et al., 2017). These works offer two ways to frame creepiness. First, we see the notion of a certain magical element, i.e. providing insight one should not have as in Merrill et al.’s (Merrill et al., 2019) where EEG systems were perceived as mind readers. Second, creepiness is also related to a perception of possible harm (Merrill and Chuang, 2018).
Experiences of Augmented Reality (Ni et al., 2011; Kang et al., 2020) were also potential sources of creepiness. Ni et al. (Ni et al., 2011) reported on an Augmented Reality system for facilitating communication with physicians. They equated a creepy feeling with emotional discomfort.
Additionally, we noted how the term creepy has often been used by children (Yip et al., 2019; Kayali et al., 2017; Kang et al., 2016). This is explained by child development research, where it has been found that standards of creepiness are formed early in life (Brink et al., 2019). Furthermore, we even found one paper that reported on creepiness in interactions between the users of a makerspace (Toombs et al., 2015) and one describing social media behaviour (Lim and Fussell, 2017) (with no direct connection to privacy).
The variety of findings revealed in our literature review demonstrates the need for a shared conceptual understanding of creepiness within the HCI community. We aim to address this gap by developing a conceptual model of creepiness in HCI and a complementary measurement instrument.
2.5. Creepiness outside HCI
The concept of creepiness has also been studied more broadly in the social sciences. For example, Watt and Gallagher (Watt et al., 2017) studied how human faces can be defined as creepy. While their study is not directly relevant to the creepiness of inanimate objects, their findings echoed some of the qualitative evidence in HCI where creepiness is linked to violation of norms and the perceived possibility of harm. McAndrew and Koehnke (McAndrew and Koehnke, 2016) used an online survey to establish that unpredictability was a key factor in creepiness. This finding is a relevant aspect for our work as the potentially creepy technologies in HCI research also contained a certain je ne sais quoi element. Given the prevalence of the term and its apparent importance for the evaluation of certain classes of technologies, it would be beneficial for HCI to develop a structured understanding of creepiness and the means to evaluate if interactive technologies are creepy.
The nearest operationalised concept that has been developed for understanding creepiness in an interactive technology context is Langer and König’s (Langer and König, 2018) CRoSS scale. This was designed to rate the creepiness of situations and some of the examined situations involved technology. However, Langer and König attributed creepiness purely to context. In contrast, our investigation focuses solely on creepiness as a property of an interactive technology. By doing so, our objective is to assess creepiness as part of a design process as opposed to the context.
3. Focus Groups
Our literature review revealed that creepiness has been explained in HCI as a multifaceted concept. Moreover, we found little agreement on what qualities of an artefact contributed to it being perceived as creepy. In order to broaden our understanding of creepiness, we conducted a series of ten focus groups in which participants communicated their first impressions of technologies that could be considered creepy. After the first two focus groups, we refined our focus group protocol. In the first two focus groups, we contrasted different interactive technologies to determine which stimuli were perceived as creepy. This informed our remaining eight focus groups where we focused on one particular creepy technology.
3.1. Participants
Eight participants ( female male) took part in the first two focus groups. Occupations included business analysts, research associates, students, journalists, project managers and physiotherapists. All participants either had a master’s () or a bachelor’s () degree. Participation was voluntary and compensated by 10 Euros.
For the following eight focus groups (), we targeted a broader age distribution in order to obtain a more heterogeneous view of the concept of creepiness. Our participant group included older (, 6 female, 6 male) and younger adults (, 5 female, 7 male). Participants had diverse occupations such as teachers, designers, public servants, students, engineers in different areas including IT, advertising, human resources, political science and psychology. Most participants had a bachelor’s degree (), followed by a master’s degree () and completed apprenticeships (). Participation was voluntary and compensated by 10 Euros. See Table 1 for an detailed overview of the participants.
| Variables | Younger adults | Older adults | ||
| N | % | N | % | |
| Gender | ||||
| Women | 5 | 41.7 | 6 | 50.0 |
| Men | 7 | 58.3 | 6 | 50.0 |
| Education | ||||
| No degree | 1 | 8.3 | 1 | 8.3 |
| Completed apprenticeship | 2 | 16.7 | 0 | 0 |
| Bachelor’s degree, equivalent | 5 | 41.7 | 1 | 8.3 |
| Master’s degree, equivalent | 3 | 25.0 | 9 | 75.0 |
| Not specified, equivalent | 1 | 8.3 | 1 | 8.3 |
| Work sector | ||||
| (Producing) industry | 1 | 8.3 | 3 | 25.0 |
| Service sector | 3 | 25.0 | 6 | 50.0 |
| Public sector, equivalent | 4 | 33.3 | 0 | 0 |
| Education, equivalent | 0 | 0 | 2 | 16.7 |
| Social services, equivalent | 1 | 8.3 | 1 | 8.3 |
| Undergoing training, equivalent | 3 | 25.0 | 0 | 0 |
3.2. Procedure
The focus groups were divided into an exploratory phase () and a follow-up group interview () moderated by one of the experimenters and accompanied by two short questionnaires querying demographics, technology adoption and experience with wearable devices.
In the first two focus groups, participants experienced a set of four technologies varying in aesthetics, comfort and perceived trust. We divided the technologies into conventional devices including the consumer products Fitbit Flex 2222https://www.fitbit.com/de/flex2 and the Empatica E4333https://www.empatica.com/research/e4/. Additionally, we included two research prototypes; one showing real-time muscle activity (EMG) through attached electrodes and the other a step-counter based on a pressure-sensitive shoe sole that was attached to the participants’ shoes. Under the supervision of two experimenters, the participants took turns in trying out all four devices.
In the follow-up group discussion, the moderator inquired about the participants’ first impression of the presented devices. Further topics included their level of trust in the technologies, aspects about the interactive technologies that caught their interest and the perceived interaction with the technologies. Lastly, the group discussed potential usage scenarios.
Based on our findings in the first set of focus groups, the EMG-based technology triggered the most creepy feelings amongst the participants. Thus, we decided to elect the EMG-based device as stimulus for further inquiries. Three participants took part in each of the eight focus groups after they had been introduced to the EMG prototype. After the introduction and an exploration phase, which lasted minutes, the focus group started. Again, the focus groups followed a semi-structured protocol and lasted . We inquired about general perception and interaction with the device. Furthermore, we explored concerns, fears and desires the participants have when interacting with unknown technology. Following a ladder interview approach (Gutman, 1982), we paid special attention to adjectives associated with creepiness, such as creepy, unpleasant, strange, threatening, frightening. In such cases, the moderators explored the topic further. The adjectives were adapted from related work (Langer and König, 2018; McAndrew and Koehnke, 2016; Ni et al., 2011; Watt et al., 2017; Yip et al., 2019) with the help of the Oxford Thesaurus of English (Waite, 2009).
3.3. Data analysis
All focus group recordings were transcribed verbatim. Then, four authors of the paper open-coded a sample of 20% of the material and conducted a discussion to establish an initial coding tree in line with Blandford et al. (Blandford et al., 2016). We further used the factors contributing to creepiness from our literature review as sensitising concepts (Saldaña, 2015) in the analysis. The remaining data was distributed equally amongst the four coders. We then iteratively refined the coding of the data that resulted in the construction of three core themes that described the facets of creepiness—as reported by the focus group participants. These themes, together with the insights from our literature review form the foundation of our conceptual model of creepiness.
4. A Conceptual Model of Creepiness
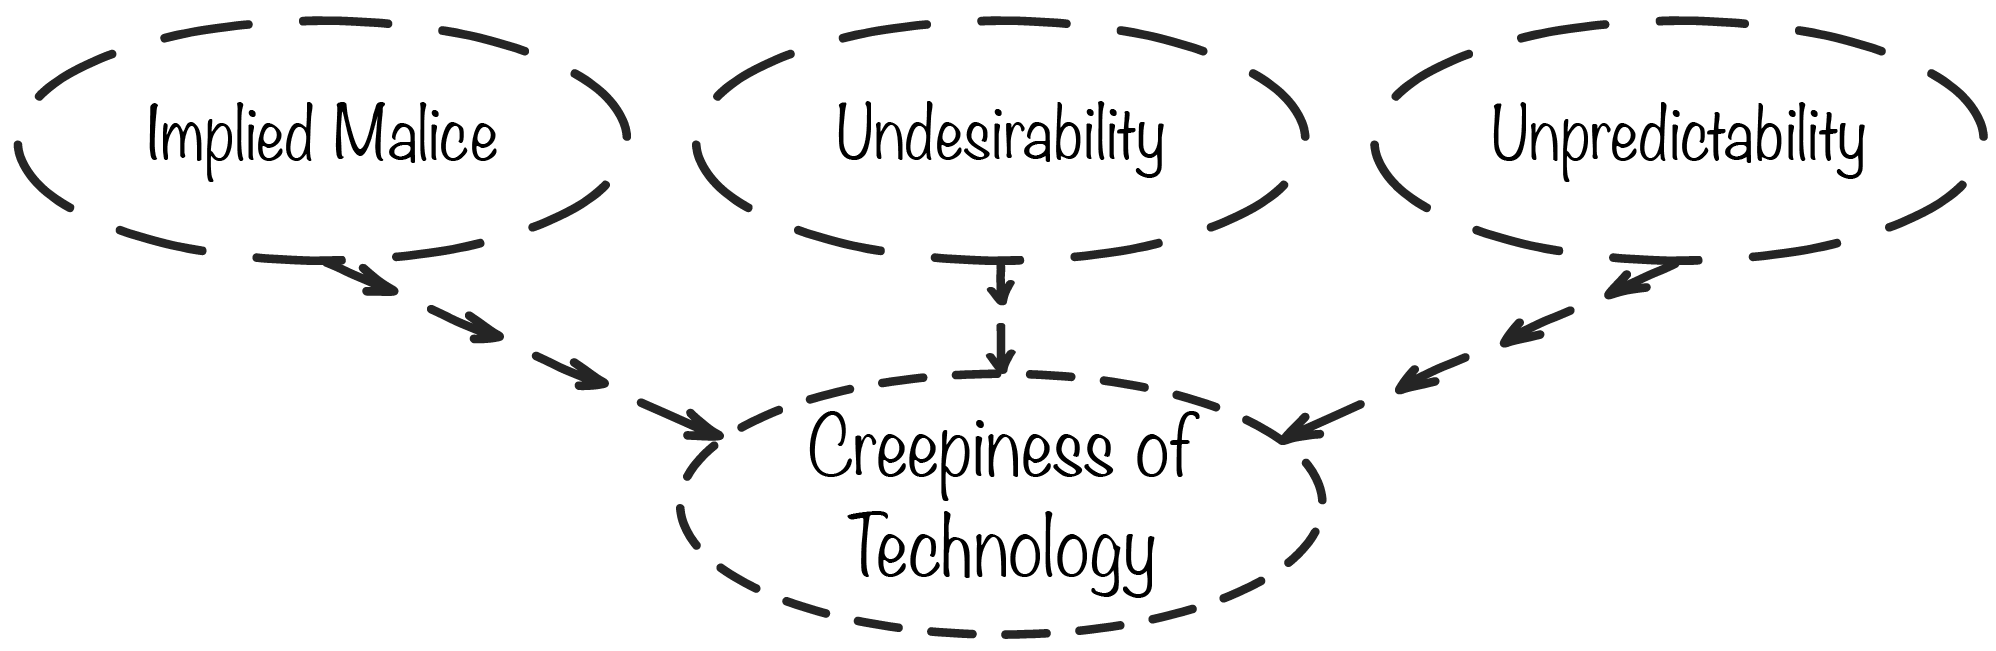
Our model of creepiness consists of three dimensions which describe creepy experiences derived from our observations of previous research and the accounts of creepiness derived from our focus groups. The model consists of three dimensions: implied malice, undesirability and unpredictability. The model is shown in Figure 2.
4.1. Implied Malice
This dimension describes perceived bad intentions communicated through the design of a creepy technology. This represents a generalisation of the understanding of creepy as violating privacy. In our model, ‘implied malice’ (‘intention or desire to do evil or cause injury’ (Online, 2021)) described the perceived potential of an interactive artefact that violates principles, which are important to the user. This dimension is based primarily on reports of creepiness in privacy research and interactions with autonomous systems. Violating the user’s value systems was also discussed in the focus groups:
P8: (…) something completely new. Yes, I’m so scared, okay, somehow it’s too much (…). For example, when Alexa came on the market, I thought it was super creepy. I still think that it is scary and there are friends of mine and I sometimes think that someone is listening in, for example. (…) I wouldn’t buy that myself.
4.2. Undesirability
Undesirability in our model refers to users perceiving the interactive technology as a non sequitur; a feeling of unease caused by the interactive artefact being out of context. The term ‘undesirability’ highlights the feeling of unease inherent to the artefact, which can be due to a variety of factors such as social context or aesthetic appearance. This dimension is based on McAndrew and Koehnke’s (McAndrew and Koehnke, 2016) research, adapted to the creepiness of inanimate objects. Focus group participants reflected on negative social consequences of using the technologies with which they were interacting:
P1: But I find it a bit creepy. Imagine you see a person with it (…). P2: I would mainly be worried.
Undesirability can also imply that the design aesthetic of the artefact does not match the environment in which it is presented to the user. This dimension of creepiness is evident in the provocative technologies discussed above. This was mentioned by one focus group participant who discussed how the aesthetic of the technology did not match its context of use:
P7: Yes. So there must be some serious reason why I have something like that. P9: So when you use something like that; you mentioned suitability for everyday use, [the way this looks] you can’t just walk around with it.
4.3. Unpredictability
In our model, we use the term ‘unpredictability’ to denote the negative feelings connected to users not being able to anticipate the interactive technologies’ actions and/or exhibit a desired level of control. In our model, ‘unpredictability’ refers to the inability of the user to immediately operate and understand the device. Control was a key dimension in Yip et al.’s (Yip et al., 2019) work. Other works demonstrated that a perceived lack of control may lead to a perception of threat (Paredes et al., 2016). This dimension also covers the feelings elicited by users not knowing the intended use of an artefact, as discussed by Oozu et al. (Oozu et al., 2017). Unpredictability was also a concern for the focus group participants:
P12: For example, I always think about the question, okay, what can the device actually do - the devices of today can do more and more. And you can no longer estimate the [functional] range, (…) I don’t even know what it can do.
5. The Perceived Creepiness of Technology Scale
Having proposed an understanding of the creepiness of interactive artefacts, our next goal is to understand how to ascertain how creepy a given system is. To this end, we decided to build a structured questionnaire. A validated questionnaire would allow designers and researchers to compare artefacts in terms of creepiness levels. Furthermore, through choosing scale items, we could gain additional insight into how users understand creepiness.
We used a structured process to develop our scale, based on the methods recommended by Boateng et al. (Boateng et al., 2018). Given the lack of local standards in HCI for developing questionnaires, our method decisions were also influenced by Mejia and Yarosh’s (Mejia and Yarosh, 2017) work on a related questionnaire designed specifically for use in HCI.
5.1. Initial Scale Items
Four researchers participated in generating initial items for the scale. Researchers first worked independently, creating items based on related work in the three dimensions and quotes from focus group participants. We then conducted a coordination meeting where all the generated items were merged and discussed. After removing duplicates and near-duplicates, we obtained an initial list of 47 items.
5.2. Expert Feedback
For the next step, we contacted four experts to provide their feedback on the list of possible scale items. We chose a diverse set of experts to gather broad feedback. The experts were a professor in user modelling, a researcher in machine learning, a researcher in psychology and a user experience lead at a major software company. They provided feedback through commenting on existing items and suggesting new items. Having obtained the feedback, we built a table where we identified problematic items and discussed possible new additions. This process resulted in a final list of 61 items.
5.3. Survey
In the next stage of our process, we designed an online survey using the Qualtrics platform to gather data from participants to perform exploratory factor analysis and item reduction. Boateng et al. (Boateng et al., 2018), referring to Comrey (Comrey, 1988), recommends a sample size of a minimum of 200 participants for studies of this kind and we applied this guideline.
5.3.1. Participants
We recruited a total number of participants, which corresponds to the guidelines proposed by Comrey (Comrey, 1988). The participants were recruited over the Amazon Mechanical Turk Service (MTurk) and reimbursed with 1$444We used the Qualtrics survey duration estimate, rewarded at a rate approved by the institution of the first author. Based on median completion time, the remuneration was provided at a rate of USD 14 per hour.. Out of these participants, 109 resided in the European Economic Area and 100 lived in the USA. We informed all participants that study participation was voluntary and if they felt uncomfortable, they could leave at any point. We also informed them that the data collected would be in anonymised form. The survey was conducted online and could be completed in 15 minutes. The average age of the participants was with 33% identifying as female, 66% as male and one preferring not to fill in their gender. We asked all participants about their demographics and to fill out a technology adaption scale before the survey.
5.3.2. Survey content
In order to evaluate the informative value of our items, we selected four research prototypes in accordance with our model of creepiness. Two prototypes include attaching technology to a user’s skin. While one explores opportunities for crafting on-skin interfacing using woven materials (Sun et al., 2020), the other looks at the user’s hand as a part of an on-skin printed circuit board (Kao et al., 2018). The other works include prototypes from the domain of mobile devices: a Finger-Navi (Tobita, 2017) integrating the smartphone with a physical finger; and hygiene devices: a teleoperated bottom wiper (Hamada et al., 2015).
Each participant in the survey was randomly given a short description and a representative image of exactly one prototype. Afterwards, we asked them how much they agreed with each item of our final list about the presented technology on a 7-item Likert scale (strongly agree to strongly disagree).
5.4. Exploratory Factor Analysis
We conducted factor analysis on the survey data collected, using a varimax rotation, thus replicating the method by Mejia and Yarosh (Mejia and Yarosh, 2017). We expected the factors to be orthogonal in light of the lack of an established model of creepiness. We chose to perform an orthogonal rotation as the qualitative data suggested that creepiness could be a result of different independent qualities. Further, the different sources of creepiness present in related work suggest an independent relationship (DeVellis, 2016). We used parallel analysis and scree plots to determine the optimal number of factors. The examination of the scree plot suggested an optimal solution with three factors. We then began the process of reducing the number of items. First, we removed all loadings below (Boateng et al., 2018). We then removed the items which loaded on multiple factors. This item list was further refined by iteratively removing low loading items and optimising for inter-item reliability. We computed current and theoretical Cronbach’s alpha coefficients. Our goal was to create a final scale to be as short as possible for practical reasons—so that it could be deployed by others—be they in industry, academia, government or other—to be able to rapidly compare interactive technologies. The resulting structure consisted of two items loading on one factor and three items loading on the other two factors. We made the non-obvious decision to only use two items for one of the factors as the items loading on that factor were highly correlated and relatively uncorrelated with other items. Worthington and Whittaker (Worthington and Whittaker, 2006) note that two-item constructs are allowable in such cases. While the uneven number of items is not desirable (due to more complicated scoring), this theoretical scale structure offered the best performance in terms of Cronbach’s alpha for the scale, , and all subscales. The theoretical factor model fit also presented correct parameters at and . The theoretical composition of the scale is shown in Table 2. The percentage of variance explained was 67.7% and item communalities were sufficient according to the guidelines set by Hair et al. [A]. The proposed factor structure matched our conceptual model.
| Subscale/Item | Factor Loading |
|---|---|
| Implied Malice, | |
| Q1: I think that the designer of this system had immoral intentions. | 0.86 |
| Q2: The design of this system is unethical. | 0.72 |
| Undesirability, | |
| Q3: Using this system in public areas will make other people laugh at me. | 0.77 |
| Q4: I would feel uneasy wearing this system in public. | 0.85 |
| Q5: The system looks bizarre to me. | 0.70 |
| Unpredictability, | |
| Q6: This system looks as expected. (R) | 0.55 |
| Q7: I don’t know what the purpose of the system is. | 0.84 |
| Q8: This system has a clear purpose. (R) | 0.78 |
6. Scale evaluation
Having built a proposed scale with a theoretical underlying factor model, we proceeded to evaluate the PCTS. We first conducted Confirmatory Factor Analysis to verify the underlying model. Next, we conducted a series of tests to check the scale’s construct validity and reliability.
6.1. Survey
6.1.1. Participants
We recruited participants over MTurk following the first survey. The reimbursement was 0.8$\@footnotemark and the study was conducted online. The study took 5 minutes to complete. The average age of the participants was , 30% identified as female and 70% as male.
6.1.2. Survey content
In order to evaluate the scale, we created two videos of different methods of logging into a computer. One method was typing a password by hand using a keyboard. For the second method, we used an EEG device and participants were told that the user authenticates with their brain waves. Both methods are shown in Figure 3. We randomly presented each participant with one of the two videos. Afterwards, we asked them how much they agreed with each item of our final list about the presented technology on a 7-item Likert scale (strongly agree to strongly disagree).


6.2. Confirmatory Factor Analysis
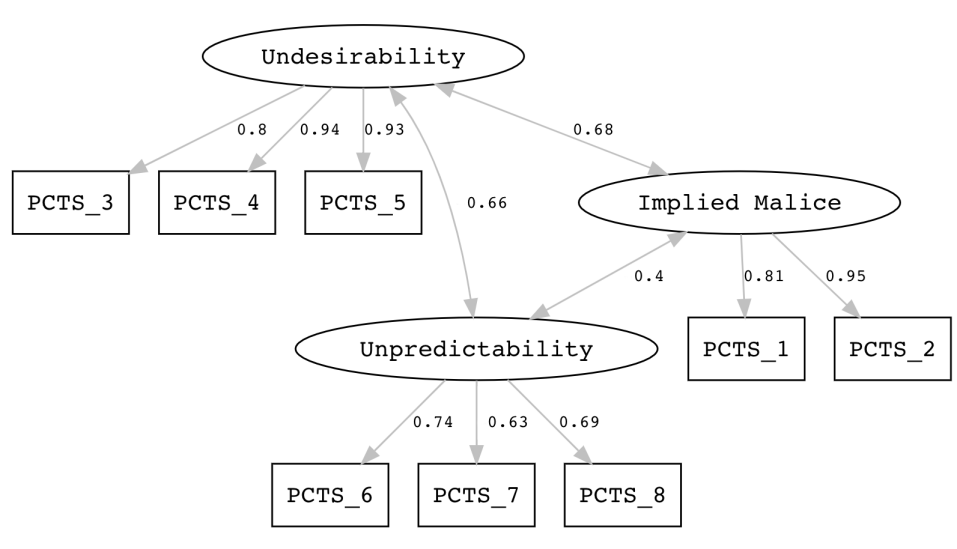
Up to this point, the structure of our scale was only theoretical, i.e. it had not been validated. As a first step in the evaluation of our scale, we conducted Confirmatory Factor Analysis (CFA). This analysis enabled us to conduct a test of dimensionality, which could determine the correctness of our proposed factor model. We used a three-factor model with the latent variables defined as in Table 2. We obtained a fit, which conformed to the required criteria (Boateng et al., 2018) with and . This suggests that the scale was internally consistent. Additionally, the model showed moderate to high correlations between the subscales, showing that the overall construct of creepiness as proposed was valid. The CFA model is shown in Figure 4.
| Scale/Subscale | ||||||
|---|---|---|---|---|---|---|
| PCTS | 22.24 | 13.62 | 35.12 | 7.80 | ||
| PCTS-IM | 7.74 | 5.72 | 9.73 | 4.55 | ||
| PCTS-UD | 7.52 | 5.37 | 14.80 | 4.02 | ||
| PCTS-UP | 6.98 | 3.89 | 10.58 | 3.53 |
6.3. Construct validity
Next, we examine the construct validity of the PCTS. We decided to test the scale in two ways. First, we checked if the scale was effectively differentiating between ‘known groups’, i.e. interactive technologies that differ in creepiness. Second, we investigated if the scale was different from possibly related concepts measured in other questionnaires.
6.3.1. Differentiation by ‘known groups’
Boateng et al. (Boateng et al., 2018) listed comparison between ‘known groups’ as a method of establishing concept validity. Mejia and Yarosh (Mejia and Yarosh, 2017) also used this method. In our work, we conducted a comparison between a system known (albeit qualitatively) to be creepy in the literature (Merrill et al., 2019)—an EEG system, and a conventional solution with which the users were familiar—the keyboard. We hypothesised that logging in with EEG would be significantly more creepy than logging in with only a keyboard. Shapiro-Wilk tests revealed that the samples were not normally distributed. Thus, we applied non parametric statistics. Table 3 shows Mann-Whitney U test results for PCTS and its subscales.
6.3.2. Discriminant validity
Discriminant validity refers to how a scale measures concepts that are different from other scales. Given the conceptual model behind building the PCTS, we wanted to check if creepiness was not simply a reflection of social acceptability or anticipated usability. As such, a comparison is only possible with other validated questionnaires, and so our choice of alternative concepts was limited. So, we decided to investigate if the PCTS provided measures different from the dimensions of the Technology Acceptance Model, as measured by a highly-cited questionnaire by Park (Park, 2009). This questionnaire featured a number of factors which could be potential confounding concepts for the PCTS: perceived ease of use (PE), perceived usefulness (PU), Attitude (AT) and Behavioural intent (BI). Furthermore, we ensured that the PCTS measured properties of the artefact and not the user’s personality in terms of attitudes towards technology. To this end, we compared PCTS scores with McKnight et al.’s Propensity to Trust in General Technology (PTT, (Mcknight et al., 2011)). We computed Spearman correlations between the different scales. The results, shown in Table 4, show at most medium to low correlations between the PCTS or its subscales and the other measurement instruments. The medium correlation suggests that some of the instruments may be measuring contextual factors related to the PCTS. There might also be an overlap between some of the dimensions of the PCTS and the dimensions developed by Park (Park, 2009), which does not impact the overall scores of the PCTS. These results show that the PCTS is a novel concept and validates PCTS’s underlying model.
| PCTS | PCTS-IM | PCTS-UD | PCTS-UP | PTT | PE | PU | AT | |
|---|---|---|---|---|---|---|---|---|
| PCTS-IM | 0.85* | |||||||
| PCTS-UD | 0.89* | 0.66** | ||||||
| PCTS-UP | 0.70* | 0.43** | 0.52* | |||||
| PTT | -0.22* | -0.24* | -0.09 | -0.32* | ||||
| PE | -0.38* | -0.31* | -0.44* | -0.67* | 0.34* | |||
| PU | 0.03 | 0.22* | -0.03 | -0.19 | 0.20* | 0.39* | ||
| AT | -0.38* | -0.30* | -0.48* | -0.59* | 0.31* | 0.72* | 0.55** | |
| BI | -0.42* | -0.24* | -0.45* | -0.50* | 0.29* | 0.70* | 0.54* | 0.86* |
6.4. Test-Retest Reliability
As a final evaluation of the scale, we tested its temporal stability, i.e. whether the scale can produce reliable results at different time points. To this end, we administered the PCTS to a group of participants, aged , 15 male and 5 female, twice, with a minimum 14-day break in between the studies.
There is a lack of consensus in the literature about how long the time between the two surveys should be. We decided to replicate Mejia and Yarosh’s (Mejia and Yarosh, 2017) approach, albeit with a larger participant sample. In an online survey, the participants were asked to rate an artefact previously qualitatively reported to evoke feelings of creepiness—the HEXBUG (Somanath et al., 2013). Contrary to the previous studies, we used snowball sampling and social media posts to recruit the participants. This allowed us to ensure we could reach participants effectively to ask them to conduct the survey for the second time.
Boateng et al. (Boateng et al., 2018) list a number of ways to assess test-retest reliability. We chose to compute the intra-class correlation coefficient (Koo and Li, 2016) to investigate the relationship between the two measurement moments. There was a high reliability with , . The 95% confidence interval ranged from to , indicating that PCTS exhibited moderate to excellent test-retest reliability (Cohen, 2013). The results show that the PCTS is temporally stable and can be administered at different times or used for between-groups or repeated-measures designs.
7. Discussion
In this section, we provide the necessary details for administering the PCTS as well as information on how to analyse the results. In addition, we discuss the limitations of our approach and possibilities for further development.
7.1. Scoring and Analysis
The PCTS is scored on a seven-point Likert scale from Strongly Agree (7) to Strongly Disagree (1). Items 6 and 8 in the scale are reverse-scored. Our scale has a item composition, which makes computing scores less than trivial. One possible solution to optimally balance the items would be extracting the weights from the factor models developed and then assigning those weights to the three subscales. However, the review by Boateng et al. (Boateng et al., 2018) concluded that using weighted averages is unlikely to improve the performance of questionnaires. Consequently, we suggest assigning equal weights to the individual subscales. The PCTS-IM score is thus calculated as the sum of the two items multiplied by . Consequently, the PCTS is scored as (reverse-scored items are marked with the subscript ):
Thus, the lowest score on the scale is 9 and the highest is 63. Higher scores indicate that the interactive artefact evokes stronger feelings of creepiness. This scoring offers a transparent and actionable way for designers and researchers to use the PCTS. The evaluation of the scale presented in this paper suggests that conducting null-hypothesis testing using PCTS scores and its subscales score is permitted. We recommend checking the normality of the data and possibly using non-parametric statistics when conducting experiments using the scale.
7.2. Guidelines for using the PCTS
The robust structure of the PCTS allows using it for different study designs within HCI research as well as for quick assessments of research prototypes. We particularly recommend using the PCTS in early stages of the design process. The scale is relatively short, easy to use and can offer rapid feedback. This can help in identifying artefacts early in the design process which appear creepy to users and help raise awareness of how to steer the design process in a more desirable direction.
We developed the PCTS primarily to capture users’ first impressions of experiencing an artefact. Consequently, the scale is particularly suited to studying initial encounters with technologies, discovering new (physiological) sensing modalities or interacting with previously unknown aesthetic forms. The scale examines an aspect of user experience beyond acceptance and usability, as indicated by our results. We recommend using the PCTS to identify features of artefacts that may be creepy early in the design process. Using the PCTS enables for effectively managing first impressions of technologies and ensuring that the technology does not intimidate the user to a point where they are unwilling to verify its usability. PCTS can facilitate rapid selection of solutions at the prototype generation phase in the user-centred design process.
In this context, future users of the scale should recognise that creepiness is not necessarily a negative aspect of technologies. The provocative or intentionally ambiguous technologies discussed in this paper may use creepiness for the benefit of users. This suggests that creepiness is a highly contextualised concept. Hence, our scale is best used when comparing between different technologies within the same context. Consequently, future users of the PCTS should carefully control the context in which the participants are introduced to the artefacts studied in order to avoid bias.
The psychometric properties of the PCTS indicate that the scale can be used for between- and within-subject studies and for repeated-measures designs. If particular aspects of a given technology are of importance, e.g. its ethical underpinnings, the subscales of the PCTS can also be analysed. However, we recommend that the use of PCTS be accompanied by pre-studies and rich qualitative data gathering. Potential users of the PCTS should be sure that the technology studied may evoke creepiness in the understanding of the PCTS, i.e. an innate, hard to define feeling of unease. Here, the PCTS may be used to help the designer reflect on the potential creepiness. Alternative, more detailed questionnaires can be used if the main concern about ‘creepiness’ is indeed a question of privacy encroachment (Chignell et al., 2003) or social acceptability (Rico and Brewster, 2009). Our results show that the PCTS measures a concept different than usability or social acceptability. Thus, our scale broadens the apparatus available to HCI researchers in quantitatively understanding impressions of new technologies.
7.3. Limitations
We recognise that the development and possible use of the PCTS is prone to certain limitations. First, we made the decision to focus the development of the scale on assessing the initial impressions of technologies. This implies that the usefulness of the PCTS for long-term studies is unknown. We envision that the scale could be used to measure how users gradually get more acquainted with a technology and their perception of it changes. This would be particularly relevant for better understanding interactive technologies with which users develop long-term relationships, e.g. voice assistants (Purington et al., 2017). In future research, we plan to evaluate if the PCTS can be used effectively beyond first impressions.
While we used a number of recruitment strategies and study methods, we recognise that the development of the PCTS is biased by the participant sample used. The focus groups which highly influenced our conceptual model of creepiness were conducted solely among residents of Europe. The majority of the participants in the studies which used MTurk recruitment in our work had a Western cultural background. The term creepy is a modern English word that is difficult to translate to many languages. Consequently, we note that the PCTS is most likely only applicable to users with a selected subset of cultural backgrounds. We hope that future research can develop alternative versions of the scale for other cultural contexts.
8. Conclusion
In this paper, we presented the development and evaluation of the Perceived Creepiness of Technology Scale (PCTS). Based on a literature review and focus groups, we developed a conceptual model for creepiness. We then describe how we constructed, reduced and evaluated the scale. We illustrated the discriminant validity of the scale, its ability to differentiate between known groups and test-retest reliability. Our scale enables designers and researchers to rapidly ascertain possible feelings of unease caused by novel interactive technologies. The PCTS can be used to conduct rapid comparative studies of novel artefacts, especially ones that exhibit elements of autonomy or feature direct contact with the body.
We designed the PCTS with the goal of enabling a broader understanding of how current and future technologies make us feel and how to build technologies that do not cause negative emotions in users. We also note that our scale can help in studying possibly provocative artefacts that could foster engagement. We hope that our scale can foster new research avenues into increasing our understandings of creepiness and to enlighten those designing to avoid (or to promote) creepiness by providing them with a creepiness metric they can easily use to conduct studies of novel technologies.
Acknowledgements.
This work was supported through multiple funding schemes. First, we like to acknowledge the support of the Leibniz ScienceCampus Bremen Digital Public Health (https://www.lsc-digital-public-health.de/), which is jointly funded by the Leibniz Association (W4/2018), the Federal State of Bremen and the Leibniz Institute for Prevention Research and Epidemiology—BIPS. This research is also partially funded by the German Research Foundation (DFG) under Germany´s Excellence Strategy (EXC 2077, University of Bremen) and a Lichtenberg professorship funded by the Volkswagen foundation. This work was financially supported by Utrecht University’s Focus Area: Sports and Society and the European Union’s Horizon 2020 Programme under ERCEA grant no. 683008 AMPLIFY.References
- (1)
- Annett et al. (2016) Michelle Annett, Matthew Lakier, Franklin Li, Daniel Wigdor, Tovi Grossman, and George Fitzmaurice. 2016. The Living Room: Exploring the Haunted and Paranormal to Transform Design and Interaction. In Proceedings of the 2016 ACM Conference on Designing Interactive Systems (DIS ’16). Association for Computing Machinery, New York, NY, USA, 1328–1340. https://doi.org/10.1145/2901790.2901819 event-place: Brisbane, QLD, Australia.
- Barkhuus and Tashiro (2010) Louise Barkhuus and Juliana Tashiro. 2010. Student Socialization in the Age of Facebook. In Proceedings of the SIGCHI Conference on Human Factors in Computing Systems (CHI ’10). Association for Computing Machinery, New York, NY, USA, 133–142. https://doi.org/10.1145/1753326.1753347 event-place: Atlanta, Georgia, USA.
- Blandford et al. (2016) Ann Blandford, Dominic Furniss, and Stephann Makri. 2016. Qualitative HCI research: Going behind the scenes. Synthesis lectures on human-centered informatics 9, 1 (2016), 1–115.
- Boateng et al. (2018) Godfred O. Boateng, Torsten B. Neilands, Edward A. Frongillo, Hugo R. Melgar-Quiñonez, and Sera L. Young. 2018. Best Practices for Developing and Validating Scales for Health, Social, and Behavioral Research: A Primer. Frontiers in Public Health 6 (June 2018). https://doi.org/10.3389/fpubh.2018.00149
- Boem et al. (2017) Alberto Boem, Kai Sasaki, and Shori Kano. 2017. Vital+Morph: A Shape-Changing Interface for Remote Biometric Monitoring. In Proceedings of the Eleventh International Conference on Tangible, Embedded, and Embodied Interaction (TEI ’17). Association for Computing Machinery, New York, NY, USA, 503–509. https://doi.org/10.1145/3024969.3025083 event-place: Yokohama, Japan.
- Brink et al. (2019) Kimberly A. Brink, Kurt Gray, and Henry M. Wellman. 2019. Creepiness Creeps In: Uncanny Valley Feelings Are Acquired in Childhood. Child Development 90, 4 (2019), 1202–1214. https://doi.org/10.1111/cdev.12999 _eprint: https://onlinelibrary.wiley.com/doi/pdf/10.1111/cdev.12999.
- Burgess (2018) Matt Burgess. 2018. Spotify and Tinder need to stop being creepy with customer data. Wired UK (Feb. 2018). https://www.wired.co.uk/article/spotify-tinder-netflix-advertising-customer-information-privacy Section: Privacy.
- Chignell et al. (2003) Mark H. Chignell, Anabel Quan-Haase, and Jacek Gwizdka. 2003. The Privacy Attitudes Questionnaire (PAQ): Initial Development and Validation. Proceedings of the Human Factors and Ergonomics Society Annual Meeting 47, 11 (Oct. 2003), 1326–1330. https://doi.org/10.1177/154193120304701102 Publisher: SAGE Publications Inc.
- Cohen (2013) Jacob Cohen. 2013. Statistical Power Analysis for the Behavioral Sciences. Routledge. https://doi.org/10.4324/9780203771587
- Comrey (1988) Andrew L. Comrey. 1988. Factor-analytic methods of scale development in personality and clinical psychology. Journal of Consulting and Clinical Psychology 56, 5 (1988), 754–761. https://doi.org/10.1037/0022-006X.56.5.754 Place: US Publisher: American Psychological Association.
- DeVellis (2016) Robert F DeVellis. 2016. Scale development: Theory and applications. Vol. 26. Sage publications.
- Doucette et al. (2013) Andre Doucette, Carl Gutwin, Regan L. Mandryk, Miguel Nacenta, and Sunny Sharma. 2013. Sometimes When We Touch: How Arm Embodiments Change Reaching and Collaboration on Digital Tables. In Proceedings of the 2013 Conference on Computer Supported Cooperative Work (CSCW ’13). Association for Computing Machinery, New York, NY, USA, 193–202. https://doi.org/10.1145/2441776.2441799 event-place: San Antonio, Texas, USA.
- Dugan (2018) Kevin Dugan. 2018. Facebook’s creepy new speakers are freaking people out. https://nypost.com/2018/10/08/facebooks-creepy-new-speakers-are-freaking-people-out/
- Gambino and Sundar (2019) Andrew Gambino and S. Shyam Sundar. 2019. Acceptance of Self-Driving Cars: Does Their Posthuman Ability Make Them More Eerie or More Desirable?. In Extended Abstracts of the 2019 CHI Conference on Human Factors in Computing Systems (CHI EA ’19). Association for Computing Machinery, New York, NY, USA, 1–6. https://doi.org/10.1145/3290607.3312870 event-place: Glasgow, Scotland Uk.
- Gaver et al. (2003) William W. Gaver, Jacob Beaver, and Steve Benford. 2003. Ambiguity as a resource for design. In Proceedings of the SIGCHI Conference on Human Factors in Computing Systems (CHI ’03). Association for Computing Machinery, New York, NY, USA, 233–240. https://doi.org/10.1145/642611.642653
- Genaro Motti and Caine (2014) Vivian Genaro Motti and Kelly Caine. 2014. Understanding the Wearability of Head-Mounted Devices from a Human-Centered Perspective. In Proceedings of the 2014 ACM International Symposium on Wearable Computers (ISWC ’14). Association for Computing Machinery, New York, NY, USA, 83–86. https://doi.org/10.1145/2634317.2634340 event-place: Seattle, Washington.
- Gooch and Watts (2012) Daniel Gooch and Leon Watts. 2012. YourGloves, Hothands and Hotmits: Devices to Hold Hands at a Distance. In Proceedings of the 25th Annual ACM Symposium on User Interface Software and Technology (UIST ’12). Association for Computing Machinery, New York, NY, USA, 157–166. https://doi.org/10.1145/2380116.2380138 event-place: Cambridge, Massachusetts, USA.
- Grinter and Woodruff (2002) Rebecca E. Grinter and Allison Woodruff. 2002. Ears and Hair: What Headsets Will People Wear?. In CHI ’02 Extended Abstracts on Human Factors in Computing Systems (CHI EA ’02). Association for Computing Machinery, New York, NY, USA, 680–681. https://doi.org/10.1145/506443.506543 event-place: Minneapolis, Minnesota, USA.
- Gutman (1982) J Gutman. 1982. A Means-End Chain Model on Consumer Categorization Processes. Journal of Marketing 46 (1982), 209–226.
- Hamada et al. (2015) Takeo Hamada, Hironori Mitake, Shoichi Hasegawa, and Makoto Sato. 2015. A Teleoperated Bottom Wiper. In Proceedings of the 6th Augmented Human International Conference (Singapore, Singapore) (AH ’15). Association for Computing Machinery, New York, NY, USA, 145–150. https://doi.org/10.1145/2735711.2735794
- Hanson et al. (2020) Julia Hanson, Miranda Wei, Sophie Veys, Matthew Kugler, Lior Strahilevitz, and Blase Ur. 2020. Taking Data Out of Context to Hyper-Personalize Ads: Crowdworkers’ Privacy Perceptions and Decisions to Disclose Private Information. In Proceedings of the 2020 CHI Conference on Human Factors in Computing Systems (CHI ’20). Association for Computing Machinery, New York, NY, USA, 1–13. https://doi.org/10.1145/3313831.3376415 event-place: Honolulu, HI, USA.
- Harrison et al. (2015) Lane Harrison, Katharina Reinecke, and Remco Chang. 2015. Infographic Aesthetics: Designing for the First Impression. In Proceedings of the 33rd Annual ACM Conference on Human Factors in Computing Systems (CHI ’15). Association for Computing Machinery, New York, NY, USA, 1187–1190. https://doi.org/10.1145/2702123.2702545
- Hill (2020) Kashmir Hill. 2020. The Secretive Company That Might End Privacy as We Know It. The New York Times (Jan. 2020). https://www.nytimes.com/2020/01/18/technology/clearview-privacy-facial-recognition.html
- Ho et al. (2008) Chin-Chang Ho, Karl F. MacDorman, and Z. A. D. Dwi Pramono. 2008. Human emotion and the uncanny valley: a GLM, MDS, and Isomap analysis of robot video ratings. In Proceedings of the 3rd ACM/IEEE international conference on Human robot interaction (HRI ’08). Association for Computing Machinery, New York, NY, USA, 169–176. https://doi.org/10.1145/1349822.1349845
- Israr and Abnousi (2018) Ali Israr and Freddy Abnousi. 2018. Towards Pleasant Touch: Vibrotactile Grids for Social Touch Interactions. In Extended Abstracts of the 2018 CHI Conference on Human Factors in Computing Systems (CHI EA ’18). Association for Computing Machinery, New York, NY, USA, 1–6. https://doi.org/10.1145/3170427.3188546 event-place: Montreal QC, Canada.
- Kalegina et al. (2018) Alisa Kalegina, Grace Schroeder, Aidan Allchin, Keara Berlin, and Maya Cakmak. 2018. Characterizing the Design Space of Rendered Robot Faces. In Proceedings of the 2018 ACM/IEEE International Conference on Human-Robot Interaction (HRI ’18). Association for Computing Machinery, New York, NY, USA, 96–104. https://doi.org/10.1145/3171221.3171286
- Kang et al. (2014) Laewoo Kang, Taezoo Park, and Steven Jackson. 2014. Scale: Human Interactions with Broken and Discarded Technologies. In CHI ’14 Extended Abstracts on Human Factors in Computing Systems (CHI EA ’14). Association for Computing Machinery, New York, NY, USA, 399–402. https://doi.org/10.1145/2559206.2574831 event-place: Toronto, Ontario, Canada.
- Kang et al. (2016) Seokbin Kang, Leyla Norooz, Vanessa Oguamanam, Angelisa C. Plane, Tamara L. Clegg, and Jon E. Froehlich. 2016. SharedPhys: Live Physiological Sensing, Whole-Body Interaction, and Large-Screen Visualizations to Support Shared Inquiry Experiences. In Proceedings of the The 15th International Conference on Interaction Design and Children (IDC ’16). Association for Computing Machinery, New York, NY, USA, 275–287. https://doi.org/10.1145/2930674.2930710 event-place: Manchester, United Kingdom.
- Kang et al. (2020) Seokbin Kang, Ekta Shokeen, Virginia L. Byrne, Leyla Norooz, Elizabeth Bonsignore, Caro Williams-Pierce, and Jon E. Froehlich. 2020. ARMath: Augmenting Everyday Life with Math Learning. In Proceedings of the 2020 CHI Conference on Human Factors in Computing Systems (CHI ’20). Association for Computing Machinery, New York, NY, USA, 1–15. https://doi.org/10.1145/3313831.3376252 event-place: Honolulu, HI, USA.
- Kao et al. (2018) Hsin-Liu Cindy Kao, Abdelkareem Bedri, and Kent Lyons. 2018. SkinWire: Fabricating a Self-Contained On-Skin PCB for the Hand. Proc. ACM Interact. Mob. Wearable Ubiquitous Technol. 2, 3, Article 116 (Sept. 2018), 23 pages. https://doi.org/10.1145/3264926
- Kayali et al. (2017) Fares Kayali, Oliver Hödl, Geraldine Fitzpatrick, Peter Purgathofer, Alexander Filipp, Ruth Mateus-Berr, Ulrich Kühn, Thomas Wagensommerer, Johannes Kretz, and Susanne Kirchmayr. 2017. Playful Technology-Mediated Audience Participation in a Live Music Event. In Extended Abstracts Publication of the Annual Symposium on Computer-Human Interaction in Play (CHI PLAY ’17 Extended Abstracts). Association for Computing Machinery, New York, NY, USA, 437–443. https://doi.org/10.1145/3130859.3131293 event-place: Amsterdam, The Netherlands.
- Kelly and Gilbert (2016) Norene Kelly and Stephen Gilbert. 2016. The WEAR Scale: Developing a Measure of the Social Acceptability of a Wearable Device. In Proceedings of the 2016 CHI Conference Extended Abstracts on Human Factors in Computing Systems (CHI EA ’16). Association for Computing Machinery, New York, NY, USA, 2864–2871. https://doi.org/10.1145/2851581.2892331
- Koelle et al. (2020) Marion Koelle, Swamy Ananthanarayan, and Susanne Boll. 2020. Social Acceptability in HCI: A Survey of Methods, Measures, and Design Strategies. In Proceedings of the 2020 CHI Conference on Human Factors in Computing Systems. ACM, Honolulu HI USA, 1–19. https://doi.org/10.1145/3313831.3376162
- Koo and Li (2016) Terry K. Koo and Mae Y. Li. 2016. A Guideline of Selecting and Reporting Intraclass Correlation Coefficients for Reliability Research. Journal of Chiropractic Medicine 15, 2 (2016), 155 – 163. https://doi.org/10.1016/j.jcm.2016.02.012
- Langer and König (2018) Markus Langer and Cornelius J. König. 2018. Introducing and Testing the Creepiness of Situation Scale (CRoSS). Frontiers in Psychology 9 (2018). https://doi.org/10.3389/fpsyg.2018.02220 Publisher: Frontiers.
- Lee (2017) Young Suk Lee. 2017. Tea with Crows: Experiencing Proactive Ubiquitous Technology by Interactive Art. In Proceedings of the Eleventh International Conference on Tangible, Embedded, and Embodied Interaction (TEI ’17). Association for Computing Machinery, New York, NY, USA, 677–680. https://doi.org/10.1145/3024969.3025058 event-place: Yokohama, Japan.
- Levesque et al. (2011) Vincent Levesque, Louise Oram, Karon MacLean, Andy Cockburn, Nicholas D. Marchuk, Dan Johnson, J. Edward Colgate, and Michael A. Peshkin. 2011. Enhancing Physicality in Touch Interaction with Programmable Friction. In Proceedings of the SIGCHI Conference on Human Factors in Computing Systems (CHI ’11). Association for Computing Machinery, New York, NY, USA, 2481–2490. https://doi.org/10.1145/1978942.1979306 event-place: Vancouver, BC, Canada.
- Lim and Fussell (2017) Hajin Lim and Susan R. Fussell. 2017. Making Sense of Foreign Language Posts in Social Media. Proceedings of the ACM on Human-Computer Interaction 1, CSCW (Dec. 2017), 69:1–69:16. https://doi.org/10.1145/3134704
- Lin et al. (2020) Chaolan Lin, Karl F. MacDorman, Selma Šabanović, Andrew D. Miller, and Erin Brady. 2020. Parental Expectations, Concerns, and Acceptance of Storytelling Robots for Children. In Companion of the 2020 ACM/IEEE International Conference on Human-Robot Interaction (HRI ’20). Association for Computing Machinery, New York, NY, USA, 346–348. https://doi.org/10.1145/3371382.3378376
- LLC (2014) Quantified Toilets LLC. 2014. http://quantifiedtoilets.com/. Critical Making Hackathon at the SIGCHI Conference on Human Factors in Computing Systems (2014).
- Löffler et al. (2020) Diana Löffler, Judith Dörrenbächer, and Marc Hassenzahl. 2020. The Uncanny Valley Effect in Zoomorphic Robots: The U-Shaped Relation Between Animal Likeness and Likeability. In Proceedings of the 2020 ACM/IEEE International Conference on Human-Robot Interaction (HRI ’20). Association for Computing Machinery, New York, NY, USA, 261–270. https://doi.org/10.1145/3319502.3374788
- Matei (2017) Adrienne Matei. 2017. New technology is forcing us to confront the ethics of bringing people back from the dead. https://qz.com/896207/death-technology-will-allow-grieving-people-to-bring-back-their-loved-ones-from-the-dead-digitally/
- McAndrew and Koehnke (2016) Francis T. McAndrew and Sara S. Koehnke. 2016. On the nature of creepiness. New Ideas in Psychology 43 (Dec. 2016), 10–15. https://doi.org/10.1016/j.newideapsych.2016.03.003
- McDonnell and Breidt (2010) Rachel McDonnell and Martin Breidt. 2010. Face reality: investigating the Uncanny Valley for virtual faces. In ACM SIGGRAPH ASIA 2010 Sketches (SA ’10). Association for Computing Machinery, New York, NY, USA, 1–2. https://doi.org/10.1145/1899950.1899991
- Mcknight et al. (2011) D. Harrison Mcknight, Michelle Carter, Jason Bennett Thatcher, and Paul F. Clay. 2011. Trust in a specific technology: An investigation of its components and measures. ACM Transactions on Management Information Systems 2, 2 (July 2011), 12:1–12:25. https://doi.org/10.1145/1985347.1985353
- Mejia and Yarosh (2017) Kenya Mejia and Svetlana Yarosh. 2017. A Nine-Item Questionnaire for Measuring the Social Disfordance of Mediated Social Touch Technologies. Proceedings of the ACM on Human-Computer Interaction 1, CSCW (Dec. 2017), 77:1–77:17. https://doi.org/10.1145/3134712
- Merrill and Chuang (2018) Nick Merrill and John Chuang. 2018. From Scanning Brains to Reading Minds: Talking to Engineers about Brain-Computer Interface. In Proceedings of the 2018 CHI Conference on Human Factors in Computing Systems (CHI ’18). Association for Computing Machinery, New York, NY, USA, 1–11. https://doi.org/10.1145/3173574.3173897 event-place: Montreal QC, Canada.
- Merrill et al. (2019) Nick Merrill, John Chuang, and Coye Cheshire. 2019. Sensing is Believing: What People Think Biosensors Can Reveal About Thoughts and Feelings. In Proceedings of the 2019 on Designing Interactive Systems Conference (DIS ’19). Association for Computing Machinery, New York, NY, USA, 413–420. https://doi.org/10.1145/3322276.3322286 event-place: San Diego, CA, USA.
- Moore et al. (2019a) Dylan Moore, Rebecca Currano, G. Ella Strack, and David Sirkin. 2019a. The Case for Implicit External Human-Machine Interfaces for Autonomous Vehicles. In Proceedings of the 11th International Conference on Automotive User Interfaces and Interactive Vehicular Applications (AutomotiveUI ’19). Association for Computing Machinery, New York, NY, USA, 295–307. https://doi.org/10.1145/3342197.3345320 event-place: Utrecht, Netherlands.
- Moore et al. (2019b) Dylan Moore, G. Ella Strack, Rebecca Currano, and David Sirkin. 2019b. Visualizing Implicit EHMI for Autonomous Vehicles. In Proceedings of the 11th International Conference on Automotive User Interfaces and Interactive Vehicular Applications: Adjunct Proceedings (AutomotiveUI ’19). Association for Computing Machinery, New York, NY, USA, 475–477. https://doi.org/10.1145/3349263.3349603 event-place: Utrecht, Netherlands.
- Murphy et al. (2004) R.R. Murphy, D. Riddle, and E. Rasmussen. 2004. Robot-assisted medical reachback: a survey of how medical personnel expect to interact with rescue robots. In RO-MAN 2004. 13th IEEE International Workshop on Robot and Human Interactive Communication (IEEE Catalog No.04TH8759). 301–306. https://doi.org/10.1109/ROMAN.2004.1374777
- Ni et al. (2011) Tao Ni, Amy K. Karlson, and Daniel Wigdor. 2011. AnatOnMe: Facilitating Doctor-Patient Communication Using a Projection-Based Handheld Device. In Proceedings of the SIGCHI Conference on Human Factors in Computing Systems (CHI ’11). Association for Computing Machinery, New York, NY, USA, 3333–3342. https://doi.org/10.1145/1978942.1979437 event-place: Vancouver, BC, Canada.
- Nourani et al. (2020) Mahsan Nourani, Donald R. Honeycutt, Jeremy E. Block, Chiradeep Roy, Tahrima Rahman, Eric D. Ragan, and Vibhav Gogate. 2020. Investigating the Importance of First Impressions and Explainable AI with Interactive Video Analysis. In Extended Abstracts of the 2020 CHI Conference on Human Factors in Computing Systems (CHI EA ’20). Association for Computing Machinery, New York, NY, USA, 1–8. https://doi.org/10.1145/3334480.3382967
- Online (2021) OED Online. 2021. Oxford English Dictionary. Oxford University Press.
- Oozu et al. (2017) Takeshi Oozu, Aki Yamada, Yuki Enzaki, and Hiroo Iwata. 2017. Escaping Chair: Furniture-Shaped Device Art. In Proceedings of the Eleventh International Conference on Tangible, Embedded, and Embodied Interaction (TEI ’17). Association for Computing Machinery, New York, NY, USA, 403–407. https://doi.org/10.1145/3024969.3025064 event-place: Yokohama, Japan.
- Pallarino et al. (2016) Timothy Pallarino, Aaron Free, Katrina Mutuc, and Svetlana Yarosh. 2016. Feeling Distance: An Investigation of Mediated Social Touch Prototypes. In Proceedings of the 19th ACM Conference on Computer Supported Cooperative Work and Social Computing Companion (CSCW ’16 Companion). Association for Computing Machinery, New York, NY, USA, 361–364. https://doi.org/10.1145/2818052.2869124 event-place: San Francisco, California, USA.
- Paredes et al. (2016) Pablo Paredes, Ryuka Ko, Eduardo Calle-Ortiz, John Canny, Björn Hartmann, and Greg Niemeyer. 2016. Fiat-Lux: Interactive Urban Lights for Combining Positive Emotion and Efficiency. In Proceedings of the 2016 ACM Conference on Designing Interactive Systems (DIS ’16). Association for Computing Machinery, New York, NY, USA, 785–795. https://doi.org/10.1145/2901790.2901832 event-place: Brisbane, QLD, Australia.
- Park (2009) Sung Youl Park. 2009. An Analysis of the Technology Acceptance Model in Understanding University Students’ Behavioral Intention to Use e-Learning. Journal of Educational Technology & Society 12, 3 (2009), 150–162. https://www.jstor.org/stable/jeductechsoci.12.3.150 Publisher: International Forum of Educational Technology & Society.
- Parviainen and Søndergaard (2020) Emmi Parviainen and Marie Louise Juul Søndergaard. 2020. Experiential Qualities of Whispering with Voice Assistants. In Proceedings of the 2020 CHI Conference on Human Factors in Computing Systems (CHI ’20). Association for Computing Machinery, New York, NY, USA, 1–13. https://doi.org/10.1145/3313831.3376187 event-place: Honolulu, HI, USA.
- Phelan et al. (2016) Chanda Phelan, Cliff Lampe, and Paul Resnick. 2016. It’s Creepy, But It Doesn’t Bother Me. In Proceedings of the 2016 CHI Conference on Human Factors in Computing Systems (CHI ’16). Association for Computing Machinery, New York, NY, USA, 5240–5251. https://doi.org/10.1145/2858036.2858381 event-place: San Jose, California, USA.
- Pierce (2019) James Pierce. 2019. Smart Home Security Cameras and Shifting Lines of Creepiness: A Design-Led Inquiry. In Proceedings of the 2019 CHI Conference on Human Factors in Computing Systems (CHI ’19). Association for Computing Machinery, New York, NY, USA, 1–14. https://doi.org/10.1145/3290605.3300275 event-place: Glasgow, Scotland Uk.
- Purington et al. (2017) Amanda Purington, Jessie G. Taft, Shruti Sannon, Natalya N. Bazarova, and Samuel Hardman Taylor. 2017. ”Alexa is my new BFF”: Social Roles, User Satisfaction, and Personification of the Amazon Echo. In Proceedings of the 2017 CHI Conference Extended Abstracts on Human Factors in Computing Systems (CHI EA ’17). Association for Computing Machinery, New York, NY, USA, 2853–2859. https://doi.org/10.1145/3027063.3053246
- Reinecke et al. (2013) Katharina Reinecke, Tom Yeh, Luke Miratrix, Rahmatri Mardiko, Yuechen Zhao, Jenny Liu, and Krzysztof Z. Gajos. 2013. Predicting users’ first impressions of website aesthetics with a quantification of perceived visual complexity and colorfulness. In Proceedings of the SIGCHI Conference on Human Factors in Computing Systems (CHI ’13). Association for Computing Machinery, New York, NY, USA, 2049–2058. https://doi.org/10.1145/2470654.2481281
- Rico and Brewster (2009) Julie Rico and Stephen Brewster. 2009. Gestures all around us: user differences in social acceptability perceptions of gesture based interfaces. In Proceedings of the 11th International Conference on Human-Computer Interaction with Mobile Devices and Services (MobileHCI ’09). Association for Computing Machinery, New York, NY, USA, 1–2. https://doi.org/10.1145/1613858.1613936
- Rogers et al. (2018) Katja Rogers, Giovanni Ribeiro, Rina R. Wehbe, Michael Weber, and Lennart E. Nacke. 2018. Vanishing Importance: Studying Immersive Effects of Game Audio Perception on Player Experiences in Virtual Reality. In Proceedings of the 2018 CHI Conference on Human Factors in Computing Systems (CHI ’18). Association for Computing Machinery, New York, NY, USA, 1–13. https://doi.org/10.1145/3173574.3173902 event-place: Montreal QC, Canada.
- Saldaña (2015) Johnny Saldaña. 2015. The coding manual for qualitative researchers. Sage.
- Schmidt (2017) Albrecht Schmidt. 2017. Augmenting Human Intellect and Amplifying Perception and Cognition. IEEE Pervasive Computing 16, 1 (Jan. 2017), 6–10. https://doi.org/10.1109/MPRV.2017.8 Conference Name: IEEE Pervasive Computing.
- Schwind et al. (2017) Valentin Schwind, Pascal Knierim, Lewis Chuang, and Niels Henze. 2017. ”Where’s Pinky?”: The Effects of a Reduced Number of Fingers in Virtual Reality. In Proceedings of the Annual Symposium on Computer-Human Interaction in Play (CHI PLAY ’17). Association for Computing Machinery, New York, NY, USA, 507–515. https://doi.org/10.1145/3116595.3116596 event-place: Amsterdam, The Netherlands.
- Seymour and Van Kleek (2020) William Seymour and Max Van Kleek. 2020. Does Siri Have a Soul? Exploring Voice Assistants Through Shinto Design Fictions. In Extended Abstracts of the 2020 CHI Conference on Human Factors in Computing Systems (CHI EA ’20). Association for Computing Machinery, New York, NY, USA, 1–12. https://doi.org/10.1145/3334480.3381809 event-place: Honolulu, HI, USA.
- Shklovski et al. (2014) Irina Shklovski, Scott D. Mainwaring, Halla Hrund Skúladóttir, and Höskuldur Borgthorsson. 2014. Leakiness and Creepiness in App Space: Perceptions of Privacy and Mobile App Use. In Proceedings of the SIGCHI Conference on Human Factors in Computing Systems (CHI ’14). Association for Computing Machinery, New York, NY, USA, 2347–2356. https://doi.org/10.1145/2556288.2557421 event-place: Toronto, Ontario, Canada.
- Somanath et al. (2013) Sowmya Somanath, Ehud Sharlin, and Mario Costa Sousa. 2013. Integrating a robot in a tabletop reservoir engineering application. In Proceedings of the 8th ACM/IEEE international conference on Human-robot interaction (HRI ’13). IEEE Press, Tokyo, Japan, 229–230.
- Sun et al. (2020) Ruojia Sun, Ryosuke Onose, Margaret Dunne, Andrea Ling, Amanda Denham, and Hsin-Liu (Cindy) Kao. 2020. Weaving a Second Skin: Exploring Opportunities for Crafting On-Skin Interfaces Through Weaving. In Proceedings of the 2020 ACM Designing Interactive Systems Conference (Eindhoven, Netherlands) (DIS ’20). Association for Computing Machinery, New York, NY, USA, 365–377. https://doi.org/10.1145/3357236.3395548
- Tene and Polonetsky (2014) Omer Tene and Jules Polonetsky. 2014. A Theory of Creepy: Technology, Privacy, and Shifting Social Norms. Yale Journal of Law and Technology 16 (2014), 45.
- Tobita (2017) Hiroaki Tobita. 2017. Finger-Navi: Mobile Navigation Integrated Smartphone with Physical Finger. In Proceedings of the 16th International Conference on Mobile and Ubiquitous Multimedia (Stuttgart, Germany) (MUM ’17). Association for Computing Machinery, New York, NY, USA, 103–106. https://doi.org/10.1145/3152832.3157381
- Toney et al. (2003) Aaron Toney, Barrie Mulley, Bruce H. Thomas, and Wayne Piekarski. 2003. Social weight: designing to minimise the social consequences arising from technology use by the mobile professional. Personal and Ubiquitous Computing 7, 5 (Oct. 2003), 309–320. https://doi.org/10.1007/s00779-003-0245-8
- Toombs et al. (2015) Austin L. Toombs, Shaowen Bardzell, and Jeffrey Bardzell. 2015. The Proper Care and Feeding of Hackerspaces: Care Ethics and Cultures of Making. In Proceedings of the 33rd Annual ACM Conference on Human Factors in Computing Systems (CHI ’15). Association for Computing Machinery, New York, NY, USA, 629–638. https://doi.org/10.1145/2702123.2702522 event-place: Seoul, Republic of Korea.
- Ur et al. (2012) Blase Ur, Pedro Giovanni Leon, Lorrie Faith Cranor, Richard Shay, and Yang Wang. 2012. Smart, Useful, Scary, Creepy: Perceptions of Online Behavioral Advertising. In Proceedings of the Eighth Symposium on Usable Privacy and Security (SOUPS ’12). Association for Computing Machinery, New York, NY, USA. https://doi.org/10.1145/2335356.2335362 event-place: Washington, D.C.
- Waite (2009) Maurice Waite. 2009. Oxford thesaurus of English. Oxford University Press.
- Watt et al. (2017) Margo C. Watt, Rebecca A. Maitland, and Catherine E. Gallagher. 2017. A case of the “heeby jeebies”: An examination of intuitive judgements of “creepiness”. Canadian Journal of Behavioural Science / Revue canadienne des sciences du comportement 49, 1 (Jan. 2017), 58–69. https://doi.org/10.1037/cbs0000066
- Worthington and Whittaker (2006) Roger L Worthington and Tiffany A Whittaker. 2006. Scale development research: A content analysis and recommendations for best practices. The counseling psychologist 34, 6 (2006), 806–838.
- Yip et al. (2019) Jason C. Yip, Kiley Sobel, Xin Gao, Allison Marie Hishikawa, Alexis Lim, Laura Meng, Romaine Flor Ofiana, Justin Park, and Alexis Hiniker. 2019. Laughing is Scary, but Farting is Cute: A Conceptual Model of Children’s Perspectives of Creepy Technologies. In Proceedings of the 2019 CHI Conference on Human Factors in Computing Systems (CHI ’19). Association for Computing Machinery, New York, NY, USA, 1–15. https://doi.org/10.1145/3290605.3300303 event-place: Glasgow, Scotland Uk.
- Zhang et al. (2014) Hui Zhang, Munmun De Choudhury, and Jonathan Grudin. 2014. Creepy but Inevitable? The Evolution of Social Networking. In Proceedings of the 17th ACM Conference on Computer Supported Cooperative Work & Social Computing (CSCW ’14). Association for Computing Machinery, New York, NY, USA, 368–378. https://doi.org/10.1145/2531602.2531685 event-place: Baltimore, Maryland, USA.
- Šimbelis et al. (2014) Vygandas Šimbelis, Anders Lundström, Kristina Höök, Jordi Solsona, and Vincent Lewandowski. 2014. Metaphone: Machine Aesthetics Meets Interaction Design. In Proceedings of the SIGCHI Conference on Human Factors in Computing Systems (CHI ’14). Association for Computing Machinery, New York, NY, USA, 1–10. https://doi.org/10.1145/2556288.2557152 event-place: Toronto, Ontario, Canada.