The Reactivation of Main-Belt Comet 259P/Garradd (P/2008 R1)
Abstract
We present observations of main-belt comet 259P/Garradd from four months prior to its 2017 perihelion passage to five months after perihelion using the Gemini North and South telescopes. The object was confirmed to be active during this period, placing it among seven MBCs confirmed to have recurrent activity. We find an average net pre-perihelion dust production rate for 259P in 2017 of kg s-1 (assuming grain densities of kg m-3 and a mean effective particle size of mm) and a best-fit start date of detectable activity of 2017 April , when the object was at a heliocentric distance of au and a true anomaly of . We estimate the effective active fraction of 259P’s surface area to be from to (corresponding to effective active areas of m2 to m2) at the start of its 2017 active period. A comparison of estimated total dust masses measured for 259P in 2008 and 2017 shows no evidence of changes in activity strength between the two active apparitions. The heliocentric distance of 259P’s activity onset point is much smaller than those of other MBCs, suggesting that its ice reservoirs may be located at greater depths than on MBCs farther from the Sun, increasing the time needed for a solar irradiation-driven thermal wave to reach subsurface ice. We suggest that deeper ice on 259P could be a result of more rapid ice depletion caused by the object’s closer proximity to the Sun compared to other MBCs.
1 Introduction
Comet 259P/Garradd (previously known as P/2008 R1) was discovered on 2008 September 2 (Garradd et al., 2008) when it was at a heliocentric distance of au, a geocentric distance of au, and a true anomaly of . With orbital elements placing it unambiguously in the main asteroid belt (semimajor axis of au, eccentricity of , and inclination of ), it was quickly recognized as a member of the then-newly identified class of main-belt comets (MBCs).
MBCs orbit in the main asteroid belt, yet exhibit comet-like activity consistent with the sublimation of volatile material (Hsieh & Jewitt, 2006; Snodgrass et al., 2017). They are a subset of the class of objects known as active asteroids, which exhibit comet-like mass loss that may be due to any of a number of mechanisms including sublimation, impacts, and rotational destabilization (Jewitt et al., 2015), but have asteroidal orbits as defined by the Tisserand parameter with respect to Jupiter (), which is given by
| (1) |
where au is the semimajor axis of Jupiter. Small solar system bodies in the inner solar system are typically considered dynamically asteroidal if they have , and dynamically cometary if they have (Kresák, 1979), although sometimes a slightly higher threshold is used for classifying orbits as asteroidal (e.g., or ; Tancredi, 2014; Jewitt et al., 2015) in order to account for slight real-world deviations from the idealized restricted three-body problem from which the parameter is derived. 259P has , however, making it unambiguously dynamically asteroidal by this criterion.
| UT Date | Tel.a | b | c | Filter | d | e | f | g | h | i | j | k | l |
| 2013 Jan 25 | Perihelion …………………………. | 0.0 | 1.798 | 2.758 | 5.5 | — | — | — | — | — | |||
| 2013 Aug 16 | Gemini-N | 10 | 1800 | 80.7 | 2.285 | 2.101 | 26.3 | 24.60.1 | — | 19.60.1 | 0.20.3 | 0.00.1 | |
| 2017 Mar 28 | Gemini-S | 1 | 300 | 304.4 | 2.032 | 1.850 | 29.3 | 23.90.2 | — | 19.30.2 | 0.90.6 | 0.20.1 | |
| 2017 Apr 26 | Gemini-S | 7 | 700 | 315.6 | 1.949 | 1.481 | 30.4 | 23.00.1 | — | 18.90.1 | 1.90.6 | 0.40.1 | |
| 2017 Apr 29 | Gemini-S | 7 | 700 | 316.8 | 1.942 | 1.446 | 30.3 | 22.90.1 | — | 18.90.1 | 2.10.6 | 0.50.1 | |
| 2017 Jun 30 | Gemini-S | 3 | 300 | 343.8 | 1.827 | 0.930 | 21.1 | 19.630.05 | 19.210.05 | 16.670.05 | 283 | 6.60.7 | |
| 2017 Jul 01 | Gemini-S | 5 | 500 | 344.3 | 1.826 | 0.925 | 20.9 | 19.540.05 | 19.140.05 | 16.620.05 | 303 | 7.10.7 | |
| 2017 Jul 18 | Gemini-S | 4 | 400 | 352.1 | 1.813 | 0.878 | 18.2 | 19.390.05 | 18.780.05 | 16.510.05 | 333 | 6.80.7 | |
| 2017 Aug 4 | Perihelion …………………………. | 0.0 | 1.809 | 0.877 | 18.4 | — | — | — | — | — | |||
| 2017 Sep 17 | Gemini-S | 1 | 300 | 20.5 | 1.838 | 1.073 | 26.8 | 19.460.05 | 18.650.05 | 15.540.05 | 8310 | 4.81.4 | |
| 2017 Nov 17 | Gemini-S | 2 | 600 | 46.5 | 1.964 | 1.684 | 30.2 | 20.680.05 | 20.140.05 | 15.770.05 | 668 | 7.81.0 | |
| 2017 Dec 22 | Gemini-S | 4 | 1200 | 59.7 | 2.068 | 2.138 | 27.0 | 22.10.1 | 22.00.1 | 17.10.1 | 183 | 2.50.4 | |
| 2022 Feb 08 | Perihelion …………………………. | 0.0 | 1.806 | 2.758 | 6.6 | — | — | — | — | — | |||
| a Telescope used. | |||||||||||||
| b Number of exposures. | |||||||||||||
| c Total integration time, in seconds. | |||||||||||||
| d True anomaly, in degrees. | |||||||||||||
| e Heliocentric distance, in au. | |||||||||||||
| f Geocentric distance, in au. | |||||||||||||
| g Solar phase angle (Sun-object-Earth), in degrees. | |||||||||||||
| h Equivalent mean apparent -band near-nucleus magnitude, measured within photometry apertures with radii of . | |||||||||||||
| i Equivalent total mean apparent -band magnitude, including the entire coma and tail, if present. | |||||||||||||
| j Total absolute -band magnitude, using phase function where . | |||||||||||||
| k Estimated total dust mass, in kg, computed using Equation 5 and assuming kg m3 and mm. | |||||||||||||
| l values, computed using Equation 6 and photometry apertures with radii of , in cm. | |||||||||||||
A series of observations conducted by Jewitt et al. (2009) shortly following 259P’s discovery showed that its intrinsic brightness faded at a mean rate of approximately 0.01 mag day-1 over a period during which the comet ranged from to . Spectroscopic observations by the same authors using the Keck I telescope set an upper limit CN production rate of molecules s-1. Jewitt et al. (2009) also noted that 259P is dynamically unstable on timescales of Myr, suggesting that it may have been recently implanted in its current location from elsewhere in the solar system (e.g., Hsieh & Haghighipour, 2016), unlike many other known MBCs that have been found to be dynamically stable on timescales of 100 Myr and are therefore considered likely to have formed in situ (e.g., Hsieh et al., 2012b, c, 2013). MacLennan & Hsieh (2012) measured 259P’s -band absolute magnitude to be mag, corresponding to an effective nucleus radius of km (assuming an -band albedo of ). They also found a slope parameter value of , and an estimated photometric range (peak to trough) due to rotational variations of mag, although an actual rotation period could not be definitively identified. 259P is not associated with any currently known asteroid families (Hsieh et al., 2018b).
Hsieh & Chavez (2017) reported that observations of 259P showed it to be active again on 2017 April 26 and 29, during which time it ranged in heliocentric distance from au to au, and in true anomaly from to . These observations showing recurrent activity near perihelion after a period of inactivity away from perihelion (MacLennan & Hsieh, 2012) are a strong indication that 259P’s activity is due to sublimation of volatile material, rather than mechanisms such as collisional or rotational disruption which would not be expected to produce repeated activity near perihelion (e.g., Hsieh et al., 2012a), justifying its initial identification as a MBC by Jewitt et al. (2009).
2 Observations
Observations of 259P were obtained on UT 2013 August 16 and several nights between 2017 March 28 and 2017 December 22 with the 8.1 m Gemini North (Gemini-N) telescope on Maunakea in Hawaii and the 8.1 m Gemini South (Gemini-S) telescope on Cerro Pachón in Chile (Gemini Program IDs GN-2013A-Q-102, GS-2017A-LP-11, and GS-2017B-LP-11). The 2013 observations were obtained approximately eight months after the object’s 2013 perihelion passage (the object was unfortunately not observable closer to that perihelion passage), while the 2017 observations covered a period extending approximately four months prior to the object’s 2017 perihelion passage to five months after that perihelion passage.
All observations on both Gemini telescopes were obtained using the telescopes’ respective Gemini Multi-Object Spectrograph instruments (GMOS; Hook et al., 2004; Gimeno et al., 2016) in imaging mode, Sloan -band filters, and non-sidereal tracking. Random dither offsets of up to east or west, and north or south were applied to individual exposures. All observations were conducted at airmasses of . Standard bias subtraction, flat field correction, and cosmic ray removal were performed for all images using Python 3 code utilizing the ccdproc package in Astropy (Astropy Collaboration et al., 2018) and the L.A.Cosmic python module111Written for python by Maltes Tewes (https://obswww.unige.ch/t̃ewes/cosmics_dot_py/) (van Dokkum, 2001; van Dokkum et al., 2012). To maximize signal-to-noise ratios (S/N), we constructed composite images of the object for each night of data by shifting and aligning individual images on the object’s photocenter using linear interpolation and then adding them together.
Photometry measurements of 259P and background reference stars were performed using Image Reduction and Analysis Facility software (IRAF; Tody, 1986, 1993), with absolute photometric calibration performed using field star magnitudes from the refcat all-sky stellar reference catalog (Tonry et al., 2018). Conversion of -band Gemini and Pan-STARRS1 photometry (used in the refcat catalog) to -band was accomplished using transformations derived by (Tonry et al., 2012) and by R. Lupton (http://www.sdss.org/). At least five reference stars were used per image when possible, although due to the much greater image depth of our images compared to the underlying data used to construct the refcat catalog, sometimes only one or two stars in a field were both unsaturated in our data and found in the refcat catalog, and thus available to be used for photometric calibration.
For most of our data, field star photometry was performed using circular apertures with sizes chosen using curve-of-growth analyses of each night of data, where background statistics were measured in an annulus around each star with a radius chosen to be large enough to avoid most of the flux from the star. However, for our 2017 March 28 data, the relatively dense star field and considerable amount of field-star trailing necessitated a modified approach to field star photometry. For these data, each image was first rotated using the IRAF rotate task such that star trails were horizontal in the image, and field star photometry was then performed using rectangular apertures that enclosed star trails that were judged to be relatively isolated. Background statistics of nearby regions of blank sky were measured using manually defined rectangular apertures.
Meanwhile, target photometry when 259P was inactive or only minimally active, and field stars were only minimally trailed (on 2013 August 16, and 2017 March 28 through 2017 April 29) was performed using circular apertures with sizes chosen using curve-of-growth analyses of each night of data. For these data, background statistics were measured in nearby but non-adjacent regions of blank sky to avoid potential dust contamination from the object or nearby field stars. When 259P exhibited stronger activity (2017 June 30 to 2017 December 22), we measured the total flux from each object in our composite images from each night using rectangular photometry apertures with sizes and orientations chosen to enclose as much of the visible dust cloud as possible without introducing significant field star contamination. On these nights, we also performed near-nucleus photometry using circular apertures with radii. In both cases, background sky levels were measured from nearby but non-adjacent regions of blank sky and subtracted to obtain net fluxes. Jewitt et al. (2009) only reported photometry using circular apertures with radii that did not fully enclose the object’s visible dust cloud in their 2008 observations. As such, we used the same methods described here for measuring near-nucleus and total brightnesses for data when 259P was visibly active to reanalyze their only publicly available 2008 observations in order to provide a better basis for comparison with our 2017 data. Those data were originally obtained on 2008 October 22 using the Faint Object Camera And Spectrograph instrument (FOCAS; Yoshida et al., 2000; Kashikawa et al., 2002) at Subaru Observatory and retrieved from Subaru’s Subaru-Mitaka-Okayama-Kiso Archive (SMOKA) system (Baba et al., 2002).
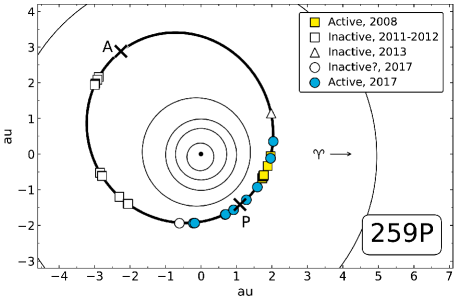
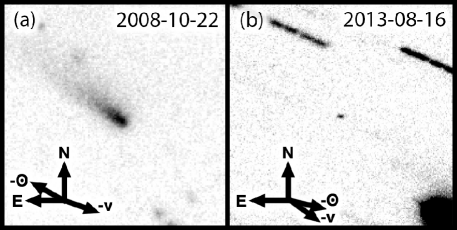
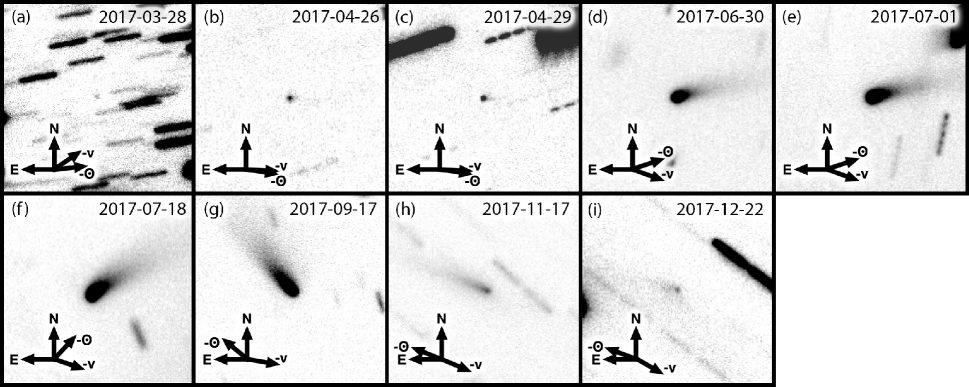
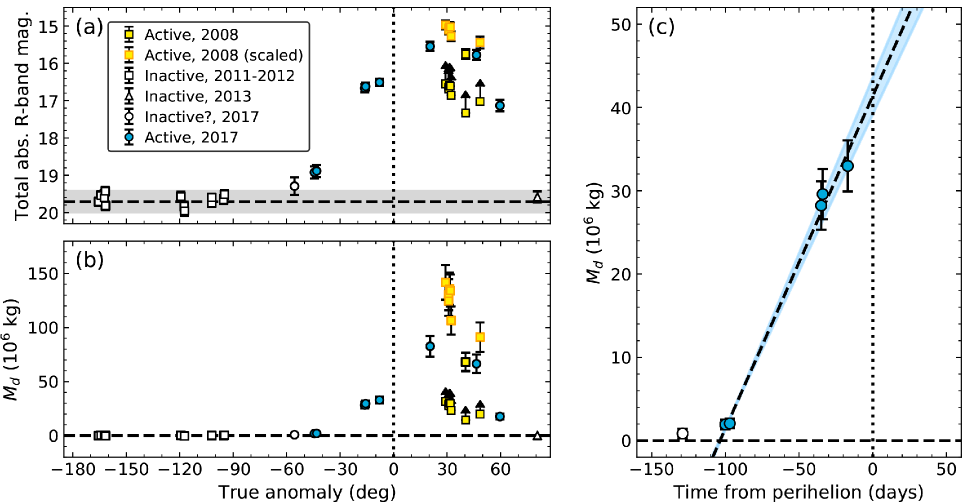
Details of our observations of 259P are listed in Table 1. We also mark the orbit positions of both the observations reported here and observations previously reported in Jewitt et al. (2009) and MacLennan & Hsieh (2012) in Figure 1. Composite images of the object during each night of observations reported in this work are shown in Figures 2 and 3.
| UT Date | Tel.a | b | c | d | e | f | g | h | i | j | k | l |
| Previously reported photometrym | ||||||||||||
| 2008 Sep 26 | UH | 29.2 | 1.853 | 1.090 | 26.4 | 19.690.05 | 18.10.1 | 16.5 | 15.00.1 | 15.8 | 14216 | 17.42.1 |
| 2008 Sep 30 | Keck | 30.9 | 1.861 | 1.122 | 27.1 | 19.880.03 | 18.30.1 | 16.6 | 15.10.1 | 14.5 | 13014 | 15.51.8 |
| 2008 Sep 30 | UH | 30.9 | 1.861 | 1.122 | 27.1 | 19.930.03 | 18.40.1 | 16.7 | 15.10.1 | 13.8 | 12414 | 14.81.7 |
| 2008 Oct 01 | UH | 31.4 | 1.863 | 1.131 | 27.2 | 19.860.02 | 18.30.1 | 16.6 | 15.00.1 | 15.2 | 13615 | 16.11.8 |
| 2008 Oct 02 | UH | 31.8 | 1.865 | 1.139 | 27.4 | 19.900.03 | 18.30.1 | 16.6 | 15.00.1 | 14.9 | 13415 | 15.71.8 |
| 2008 Oct 03 | UH | 32.3 | 1.867 | 1.148 | 27.5 | 20.170.06 | 18.60.1 | 16.9 | 15.30.1 | 11.7 | 10613 | 12.21.6 |
| 2008 Oct 22 | Subaru | 40.4 | 1.909 | 1.331 | 29.4 | 21.090.04 | 19.50.1 | 17.3 | 15.70.1 | 7.3 | 688 | 6.50.9 |
| 2008 Nov 11 | UH | 48.6 | 1.962 | 1.560 | 30.0 | 21.210.10 | 19.60.1 | 17.0 | 15.40.1 | 9.9 | 9114 | 7.61.2 |
| Re-measured photometryn | ||||||||||||
| 2008 Oct 22 | Subaru | 40.4 | 1.909 | 1.331 | 29.4 | 20.260.05 | 19.510.05 | 15.70.1 | — | 689 | — | 8.21.1 |
| a Telescope (UH: University of Hawaii 2.2 m telescope; Keck: 10 m Keck I telescope; Subaru: 8.2 m Subaru Observatory) | ||||||||||||
| b True anomaly, in degrees. | ||||||||||||
| c Heliocentric distance, in au. | ||||||||||||
| d Geocentric distance, in au. | ||||||||||||
| e Solar phase angle (Sun-object-Earth), in degrees. | ||||||||||||
| f Equivalent mean apparent -band nucleus magnitude, measured within a circular photometry aperture, as reported by | ||||||||||||
| Jewitt et al. (2009) for previously reported photometry, or measured as part of this work for re-measured photometry. | ||||||||||||
| g Equivalent total mean apparent -band magnitude, including the entire coma and tail, if present, as estimated from scaling | ||||||||||||
| previously reported photometry (listed in this table as ) as described in Section 3.1, or measured as part of this work, | ||||||||||||
| as applicable. | ||||||||||||
| h Total absolute -band magnitude or upper limit based on previously reported photometry, as applicable, using an | ||||||||||||
| phase function where . | ||||||||||||
| i Total absolute -band magnitude, using an phase function where , as estimated from scaling previously | ||||||||||||
| reported photometry (listed in this table as ) as described in Section 3.1 | ||||||||||||
| j Estimated total dust mass or lower limit based on previously reported photometry, as applicable, in kg, | ||||||||||||
| assuming kg m-3 and mm. | ||||||||||||
| k Estimated total dust mass, in kg, assuming kg m-3 and mm, as estimated from scaling | ||||||||||||
| previously reported photometry (listed in this table as ) as described in Section 3.1 | ||||||||||||
| l values, computed using Equation 6 and photometry apertures with radii of , in cm. | ||||||||||||
| m Computations based on photometry reported by Jewitt et al. (2009). | ||||||||||||
| n Computations based on photometry performed as part of this work, as described in Section 2. | ||||||||||||
3 Results and Analysis
3.1 Photometric Analysis
In order to quantitatively characterize 259P’s 2017 activity evolution and compare it to those of other MBCs, we use photometric measurements made of 259P in this work to estimate the amounts of excess dust present in those observations. First, following Jewitt et al. (2014) and assuming that the maximum dust particle radius, , is much larger than the minimum dust particle radius, (i.e., ), we can compute an approximate mean effective particle radius (by mass), , weighted by size distribution, scattering cross-section, and residence time, using
| (2) |
which applies to power law distributions with .
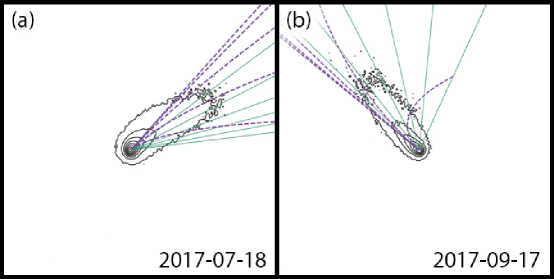
Size distributions and ranges of dust grains have not yet been reported for 259P. As such, for the purposes of our dust mass estimates, we refer to a dust modeling study performed for another MBC, P/2015 X6 (PANSTARRS), whose semimajor axis ( au) is similar to that of 259P ( au). In that analysis, Moreno et al. (2016) found a power-law distribution of particles with minimum and maximum dust grain radii of m and cm, respectively, and a power law index of (which is close to the power law index of assumed for Equation 2) to be consistent with their observations. Overlaying a syndyne-synchrone grid (Finson & Probstein, 1968) on our data for comparison, we find these values to be reasonably plausible for 259P’s activity (Figure 4). Thus, adopting 1 cm for the value of in Equation 2, we compute a mean effective particle radius of mm.
Using this mean effective particle radius and the phase function derived by MacLennan & Hsieh (2012), and assuming that ejected dust exhibits the same phase darkening behavior as the nucleus, we can estimate the amounts of excess dust present in the 2017 observations of 259P reported in this work (Section 2). Following Hsieh (2014), we estimate the total mass, , of visible ejected dust using
| (3) |
where the ratio of the total scattering surface area of dust to that of the nucleus, , is given by
| (4) |
giving
| (5) |
where is the equivalent total absolute magnitude of the active nucleus at au and computed using the phase function and the best-fit parameter determined by MacLennan & Hsieh (2012). We assume dust grain densities of 2500 kg m-3, consistent with CI and CM carbonaceous chondrites, which are associated with primitive C-type objects like the MBCs (Britt et al., 2002). We note that dust masses and certain other parameters derived from computed dust masses (dust production rates, and active areas and fractions) vary proportionally with respect to assumed average grain density and mean particle size (see Equations 5, 7, 8), and so different estimates or assumptions for these values could produce results that differ by a factor of a few or more from those reported here. As such, in the event that improved constraints on the average grain density or mean particle size become available in the future, the values of these derived quantities can and should be revised accordingly.
For reference, we also use our measured near-nucleus photometry to compute values (hereafter, ; A’Hearn et al., 1984), given by
| (6) |
where is in au, is in cm, is the physical radius in cm of the photometry aperture used to measure the magnitude of the comet at the distance of the comet, and is the phase-angle-normalized (to ) -band magnitude of the excess dust mass of the comet (i.e., with the flux contribution of the nucleus subtracted from the measured total flux). We note, however, that this parameter is not always a reliable measurement of the dust contribution to comet photometry in cases of non-spherically symmetric comae (e.g., Fink & Rubin, 2012).
The results of all calculations described above are shown in Table 1 for observations of 259P reported in this work. For observations obtained when 259P did not have a visibly extended appearance (i.e., from 2013 August 16 to 2017 April 29) and therefore a separate procedure was not required to measure the comet’s total brightness, total absolute magnitudes and excess dust masses are computed directly from near-nucleus photometry measurements. In these cases, listed uncertainties do not include the potential photometric variability of the nucleus due to rotation. We also plot total absolute magnitudes and computed excess dust masses as functions of and days relative to perihelion in Figure 5.
For later comparison (see Section 3.2), we also compute estimated excess dust masses for observations previously reported by Jewitt et al. (2009). Specifically, we compute the excess dust mass present on 2008 October 22 with the same methods as we use for our 2017 data (i.e., using a rectangular photometry aperture whose size and orientation is chosen to enclose as much of the visible dust cloud as possible while attempting to avoid significant field star contamination), using the publicly available data from Subaru from that date (see Section 2), and also use Equation 5 to derive lower limit excess dust masses from the reported near-nucleus photometry (assumed to give upper limits to the total magnitudes of the comet at the times of observation).
In order to compare similar quantities from 259P’s 2008 and 2017 active apparitions, however, we wish to estimate the total dust masses for 259P in 2008, instead of just lower limits from near-nucleus photometry. To do this, we compare the reported near-nucleus magnitude of the comet on 2008 October 22 to the total magnitude we measure for the same data (obtained from the Subaru archive), where we find a difference of 1.58 mag between the two measurements. Assuming an approximately constant ratio of near-nucleus fluxes measured by Jewitt et al. (2009) and the total fluxes that would be measured with our methods, we apply the same magnitude offset to all photometry from 2008 to derive adjusted total magnitudes. We then use these adjusted total magnitudes to compute approximate total excess dust masses (Table 2), and plot our results in Figure 5. The ratio of near-nucleus flux and total flux for the comet is of course not expected to remain exactly constant for all 2008 observations, and so the dust masses estimated using the method described here should not be regarded as very accurate. Nonetheless, they provide at least an approximate basis upon which we can compare the strengths of 259P’s activity in 2008 and in 2017.
To estimate 259P’s average net dust production rate, , over the period of time spanned by our pre-perihelion observations (during which the object’s heliocentric distance changes by just 0.136 au, from au to au), and also estimate the approximate onset time of the observed activity, we fit a linear function to excess dust masses computed from data obtained between 2017 April 26 and 2017 July 18, when measured excess dust masses appear to increase approximately linearly. Following the calculations detailed by Hsieh et al. (2015a), we find that the heliocentric distance change over this period corresponds to a 19%38% increase in the water sublimation rate on the object’s surface and an increase in the equilibrium surface temperature of 12 K, depending on whether a subsolar or isothermal approximation is assumed. The resulting average net dust production rate and corresponding activity start date we find are of course subject to numerous sources of uncertainty including variations in the real dust production rate as a function of time and the unknown rotational phases of the object at the times when each photometric point was obtained. We also emphasize that the calculated average dust production rate is a net production rate and not an absolute production rate, given that the rate of dissipation and removal of dust from the visible dust tail by solar radiation pressure over this period is unconstrained and thus not considered as part of this analysis.
We find a best-fit average net dust production rate of kg s-1 over the time period under consideration and a best-fit start date for detectable activity of 2017 April 221 (104 days prior to perihelion), when the object was at au and (where we mark the uncertainty in using to indicate that a positive error in the best-fit start date corresponds to a smaller heliocentric distance, and vice versa, due to the object being inbound at the time in question). Assuming a time-averaged dust-to-gas ratio (by mass) of (cf. Hsieh et al., 2018c), this computed dust production rate corresponds to a water production rate of molecules s-1 (assuming water to be the dominant volatile material, where the mass of one water molecule is kg). We note that this inferred water production rate is smaller than the upper limit water production rate of molecules s-1 derived from spectroscopic observations of 259P when it was active in 2008 (Jewitt et al., 2009). This suggests that those observations may not have been sensitive enough to detect the level of outgassing present, as is suspected for most such attempts to date at detecting sublimation products from MBCs (e.g., Snodgrass et al., 2017), and not that outgassing was necessarily absent.
At the midpoint of the time period covered by this fitting analysis, water production rates are expected to range from kg s-1 m-2 in the isothermal (or “fast rotator”) approximation to kg s-1 m-2 in the subsolar (or “flat slab”) approximation for a sublimating graybody in local thermal equilibrium. Assuming the nucleus to be a spherical body with an effective radius of m (MacLennan & Hsieh, 2012), we can use
| (7) |
and
| (8) |
to determine the effective active area, , and effective active fraction, of the object’s surface, respectively. Assuming as before, we find estimated effective active areas and active fractions ranging from m2 and (in the subsolar approximation) to m2 and (in the isothermal approximation) at the start of 259P’s 2017 active period.
3.2 Comparison with previous activity
A key objective of observing multiple active apparitions of MBCs is to be able to study the evolution of activity over time for these objects. In order to investigate the evolution of 259P’s activity, we focus on data from 2017 September 17 to 2017 December 22, which span a true anomaly range of . These observations cover a similar orbital arc as the 2008 data reported by Jewitt et al. (2009), which span a true anomaly range of . While 259P had another perihelion passage (on 2013 January 25) between its 2008 and 2017 active apparitions, it unfortunately was not observable from the Earth until well after that perihelion passage, and as such, we have no observational coverage of any activity around that time period that can be included in this analysis.
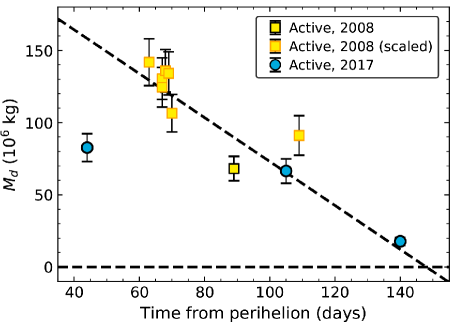
Re-plotting the dust masses inferred from photometry measurements of our 2017 observations (Table 1) and total dust masses estimated from previously reported photometry (Table 2) as a function of time after perihelion (Figure 6), we find that dust mass estimates from data from 2017 November 17 (obtained when 259P was 105 days past perihelion) and 2017 December 22 (140 days past perihelion) are consistent with a linear fading function fit to scaled dust mass estimates for the 2008 observations of 259P. We also see from Figure 6 that the total dust mass estimated for the comet on 2017 September 17 (44 days past perihelion) is substantially smaller than the estimated total dust mass inferred to be present at the start of the 2008 observations. However, if the visible dust mass in 2017 continued its then upward trend past the 2017 September 17 observations, it could reasonably conceivably have reached a level comparable to that inferred to be present at the start of the 2008 observations (63 days past perihelion) before then declining to its observed level on 2017 November 17. We conclude from this analysis that there is no clear evidence of changes in 259P’s activity strength between its 2008 and 2017 active apparitions.
4 DISCUSSION
Multiple active apparitions have now been observed and characterized for seven MBCs (133P/Elst-Pizarro, 238P/Read, 259P, 288P/(300163) 2006 VW139, 313P/Gibbs, 324P/La Sagra, and 358P/PANSTARRS; Hsieh et al., 2004, 2011, 2015b, 2018a; Hsieh & Sheppard, 2015; Agarwal et al., 2016, and this work), although direct comparisons of activity strength measured using methods similar to those performed in this work over similar orbit arcs has only been performed thus far for 238P, 259P, and 288P. Within this group of objects, 259P is the only one with a semimajor axis interior to the 5:2 mean-motion resonance with Jupiter, and a perihelion distance of au. While we find 259P’s activity strength to remain roughly similar between 2008 and 2017 in this work, Hsieh et al. (2018c) found that 238P’s activity appeared to decrease between its 2010-2011 active apparition and its 2016-2017 active apparition, while 288P’s activity appeared to increase between its 2000 active apparition and its 2016 active apparition. In the cases of both 238P and 288P, activity onset times were determined to have remained similar for each active apparition, suggesting that only minimal changes in ice depth (e.g., due to sublimation-driven ice recession or mantling) had occurred between apparitions (Hsieh et al., 2018c). An intensive observing campaign was conducted in 2011 for an eighth MBC, 176P/LINEAR, during the perihelion passage following its first observed active apparition in 2005, but while those 2011 observations overlapped observations of the object’s 2005 active apparition in terms of orbit positions, no evidence of activity was found (Hsieh et al., 2014), suggesting that a decline of detectable activity strength to zero had occurred from the first epoch to the next.
| Objectb | j | Ref.m | |||||||||
| 238P (2010) | 3.162 | 2.361 | 0.4 | 30212 | 2.610.11 | 171190 | 1.40.3 | 2.49 | 6103 1105 | 310-3 710-2 | [1] |
| 238P (2016) | 3.162 | 2.361 | 0.4 | 29721 | 2.660.19 | 170190 | 0.70.3 | 2.39 | 2103 4104 | 110-3 210-2 | [1] |
| 259P (2017) | 2.727 | 1.796 | 0.30 | 313.90.4 | 1.960.03 | 182195 | 4.60.3 | 1.86 | 8103 7104 | 710-3 610-2 | [2] |
| 288P (2010) | 3.047 | 2.434 | 20.80 | 3324 | 2.510.02 | 173191 | 3.50.4 | 2.47 | 1104 3105 | 910-4 210-2 | [1] |
| 288P (2016) | 3.047 | 2.434 | 20.80 | 3334 | 2.480.02 | 174191 | 5.60.7 | 2.44 | 2104 5105 | 110-3 310-2 | [1] |
| 324P (2015) | 3.096 | 2.620 | 0.55 | 300 | 2.80 | 189 | 0.1 | 2.78 | 2105 | 410-2 | [3] |
| 358P (2017) | 3.155 | 2.410 | 0.32 | 3161 | 2.540.01 | 172190 | 2.00.6 | 2.50 | 4104 1106 | 310-2 810-1 | [4] |
| a Activity parameters measured for MBCs using the methods described in Section 3.1. | |||||||||||
| b Object designations with the perihelion year corresponding to the analyzed apparition in parentheses. | |||||||||||
| c Semimajor axis, in au. | |||||||||||
| d Perihelion distance, in au. | |||||||||||
| e Nucleus radius, in km. | |||||||||||
| f True anomaly, in degrees, at time of estimated activity onset. | |||||||||||
| g Heliocentric distance, in au, at time of estimated activity onset. | |||||||||||
| h Estimated equilibrium surface temperature, in K, at time of estimated activity onset. | |||||||||||
| i Estimated average net dust production rate early in activity period, in kg s-1. | |||||||||||
| j Heliocentric distance, in au, at the midpoint of the time period to which the indicated average dust production rate corresponds. | |||||||||||
| k Estimated effective active surface area, in m2, corresponding to the indicated average dust production rate. | |||||||||||
| l Estimated effective active fractional surface area corresponding to the indicated average dust production rate. | |||||||||||
| m References: [1] Hsieh et al. (2018c); [2] MacLennan & Hsieh (2012), This work; [3] Hsieh (2014), Hsieh & Sheppard (2015); | |||||||||||
| [4] Hsieh et al. (2018a) | |||||||||||
The diversity of activity evolution behavior observed for just four objects suggests that there could be competing processes modulating activity strength on MBCs. For example, while volatile depletion and mantling would be expected to cause overall declines in activity strength over time (e.g., Kossacki & Szutowicz, 2012; Hsieh et al., 2015a), processes such as sinkhole collapses and expansion of active areas via sublimation-driven erosion, as observed on 67P/Churyumov-Gerasimenko by the Rosetta spacecraft (e.g., Vincent et al., 2015), could conceivably produce occasional increases in activity strength. If active sites are localized (e.g., Hsieh et al., 2004; Yu et al., 2020), variable global or local seasonal effects due to rotational axis precession or topographical surface evolution between active apparitions (e.g., Gutiérrez et al., 2016; El-Maarry et al., 2019; Lai et al., 2019; Marschall et al., 2020) could also conceivably alter MBC activity strength from orbit to orbit. Continued investigation of activity evolution in MBCs to ascertain the relative frequencies of different evolutionary trends will be extremely valuable for illuminating the significance of different processes in driving the evolution of MBC surfaces.
The heliocentric distance of 259P’s activity onset point ( au) is significantly smaller than those of other MBCs, whose estimated activity onset points measured thus far have consistently had heliocentric distances of au (Table 3). Once activated, however, 259P’s average net pre-perihelion dust production rate appears to be comparable to those of other MBCs (Table 3). The much smaller heliocentric distance of 259P’s activity onset point relative to other MBCs suggest that its ice reservoirs may be located at greater depths than on MBCs farther from the Sun, increasing the time needed for a solar irradiation-driven thermal wave to reach subsurface ice, even after the object has reached a heliocentric distance at which sublimation-driven activity on other MBCs would normally begin (which for 259P would correspond to as it approaches perihelion, rather than at which its activity is actually estimated to begin). Deeper ice on 259P could be a result of more rapid ice depletion caused by the object’s closer proximity to the Sun (and therefore greater total solar flux and higher surface temperatures) compared to other MBCs. Alternatively, 259P’s activity could instead be primarily modulated by other mechanisms, such as seasonal effects (e.g., Bertini et al., 2012; Li et al., 2016; Eisner et al., 2017). Detailed characterization of the activity of other MBCs in the middle main belt (i.e., with semimajor axes between the 3:1 and 5:2 mean-motion resonances with Jupiter at au and au, respectively), such as P/2015 X6 ( au; au), will provide an important point of comparison for assessing how typical the activity characteristics we measure for 259P are of this MBC sub-group.
5 Conclusions
In this work, we present analyses of observations using the Gemini North and South telescopes prior to and following MBC 259P/Garradd’s 2017 perihelion passage showing its reactivation (previously reported by Hsieh & Chavez, 2017). We report the following key results:
-
•
We confirm the reactivation of 259P, previously reported by Hsieh & Chavez (2017), and present monitoring data following the evolution of the object’s activity for nine months spanning its 2017 perihelion passage on UT 2017 August 4, covering a true anomaly range of to . These observations place 259P among seven MBCs in total that have been confirmed to have recurrent activity, where 259P is the only one among those with a semimajor axis interior to the 5:2 mean-motion resonance with Jupiter, and a perihelion distance of au.
-
•
Using an estimated mean effective dust grain radius of mm and assuming a dust grain density of kg m-3, we find a best-fit average net pre-perihelion dust production rate for 259P during its 2017 active period of kg s-1 and a best-fit start date of activity of 2017 April ( days prior to perihelion), when 259P was at au and . From this calculated average dust production rate, we estimate the effective active fraction of the object’s surface to be from to (corresponding to effective active areas of m2 to m2) at the start of its 2017 active period.
-
•
A comparison of estimated total dust masses measured for 259P in 2008 and 2017 shows no clear evidence of changes in the object’s activity strength between those two active apparitions.
Acknowledgments
We are grateful to two anonymous reviewers who helped to improve this manuscript. HHH, MMK, NAM, and SSS acknowledge support from the NASA Solar System Observations program (Grants NNX16AD68G and 80NSSC19K0869). We are grateful to J. Chavez, J. Fuentes, M. Gomez, A. Lopez, L. Magill, E. Marin, K. Roth, D. Sanmartim, A. Shugart, K. Silva, A. Smith, and E. Wenderoth for assistance in obtaining observations. This research made use of astropy, a community-developed core python package for astronomy, and uncertainties (version 3.0.2), a python package for calculations with uncertainties by E. O. Lebigot. This work benefited from support by the International Space Science Institute in Bern, Switzerland, through the hosting and provision of financial support for an international team, which was led by C. Snodgrass and included HHH and MMK, to discuss the science of MBCs. This work is based on observations obtained at the Gemini Observatory (Program IDs GN-2013A-Q-102, GS-2017A-LP-11, and GS-2017B-LP-11), which is operated by the Association of Universities for Research in Astronomy, Inc., under a cooperative agreement with the NSF on behalf of the Gemini partnership: the National Science Foundation (United States), the National Research Council (Canada), CONICYT (Chile), Ministerio de Ciencia, Tecnología e Innovación Productiva (Argentina), and Ministério da Ciência, Tecnologia e Inovação (Brazil). This work is also based in part on data collected at Subaru Telescope and obtained from the SMOKA, which is operated by the Astronomy Data Center, National Astronomical Observatory of Japan. We wish to recognize and acknowledge the very significant cultural role and reverence that the summit of Maunakea has always had within the indigenous Hawaiian community. We are fortunate to have the opportunity to conduct observations from this mountain.
References
- Agarwal et al. (2016) Agarwal, A., Jewitt, D., Weaver, H., Mutchler, M., & Larson, S. 2016, Central Bureau Electronic Telegrams, 4306
- A’Hearn et al. (1984) A’Hearn, M. F., Schleicher, D. G., Millis, R. L., Feldman, P. D., & Thompson, D. T. 1984, AJ, 89, 579, doi: 10.1086/113552
- Astropy Collaboration et al. (2018) Astropy Collaboration, Price-Whelan, A. M., Sipőcz, B. M., et al. 2018, AJ, 156, 123, doi: 10.3847/1538-3881/aabc4f
- Baba et al. (2002) Baba, H., Yasuda, N., Ichikawa, S.-I., et al. 2002, in Astronomical Society of the Pacific Conference Series, Vol. 281, Astronomical Data Analysis Software and Systems XI, 298
- Bertini et al. (2012) Bertini, I., Barbieri, C., Ho, T. M., et al. 2012, A&A, 541, A159, doi: 10.1051/0004-6361/201118004
- Britt et al. (2002) Britt, D. T., Yeomans, D., Housen, K., & Consolmagno, G. 2002, Asteroids III (Tucson, University of Arizona Press), 485–500
- Eisner et al. (2017) Eisner, N., Knight, M. M., & Schleicher, D. G. 2017, AJ, 154, 196, doi: 10.3847/1538-3881/aa8b0b
- El-Maarry et al. (2019) El-Maarry, M. R., Groussin, O., Keller, H. U., et al. 2019, Space Sci. Rev., 215, 36, doi: 10.1007/s11214-019-0602-1
- Fink & Rubin (2012) Fink, U., & Rubin, M. 2012, Icarus, 221, 721, doi: 10.1016/j.icarus.2012.09.001
- Finson & Probstein (1968) Finson, M. J., & Probstein, R. F. 1968, ApJ, 154, 327, doi: 10.1086/149761
- Garradd et al. (2008) Garradd, G. J., Sostero, G., Camilleri, P., et al. 2008, IAU Circ., 8969, 1
- Gimeno et al. (2016) Gimeno, G., Roth, K., Chiboucas, K., et al. 2016, in Proc. SPIE, Vol. 9908, Ground-based and Airborne Instrumentation for Astronomy VI, 99082S, doi: 10.1117/12.2233883
- Ginsburg et al. (2019) Ginsburg, A., Sipőcz, B. M., Brasseur, C. E., et al. 2019, AJ, 157, 98, doi: 10.3847/1538-3881/aafc33
- Gutiérrez et al. (2016) Gutiérrez, P. J., Jorda, L., Gaskell, R. W., et al. 2016, A&A, 590, A46, doi: 10.1051/0004-6361/201528029
- Hook et al. (2004) Hook, I. M., Jørgensen, I., Allington-Smith, J. R., et al. 2004, PASP, 116, 425, doi: 10.1086/383624
- Hsieh (2014) Hsieh, H. H. 2014, Icarus, 243, 16, doi: 10.1016/j.icarus.2014.08.033
- Hsieh & Chavez (2017) Hsieh, H. H., & Chavez, J. 2017, Central Bureau Electronic Telegrams, 4388
- Hsieh & Haghighipour (2016) Hsieh, H. H., & Haghighipour, N. 2016, Icarus, 277, 19, doi: 10.1016/j.icarus.2016.04.043
- Hsieh et al. (2018a) Hsieh, H. H., Ishiguro, M., Knight, M. M., et al. 2018a, AJ, 156, 39, doi: 10.3847/1538-3881/aac81c
- Hsieh & Jewitt (2006) Hsieh, H. H., & Jewitt, D. 2006, Science, 312, 561, doi: 10.1126/science.1125150
- Hsieh et al. (2004) Hsieh, H. H., Jewitt, D. C., & Fernández, Y. R. 2004, AJ, 127, 2997, doi: 10.1086/383208
- Hsieh et al. (2011) Hsieh, H. H., Meech, K. J., & Pittichová, J. 2011, ApJ, 736, L18, doi: 10.1088/2041-8205/736/1/L18
- Hsieh et al. (2018b) Hsieh, H. H., Novaković, B., Kim, Y., & Brasser, R. 2018b, AJ, 155, 96, doi: 10.3847/1538-3881/aaa5a2
- Hsieh & Sheppard (2015) Hsieh, H. H., & Sheppard, S. S. 2015, MNRAS, 454, L81, doi: 10.1093/mnrasl/slv125
- Hsieh et al. (2012a) Hsieh, H. H., Yang, B., & Haghighipour, N. 2012a, ApJ, 744, 9, doi: 10.1088/0004-637X/744/1/9
- Hsieh et al. (2012b) Hsieh, H. H., Yang, B., Haghighipour, N., et al. 2012b, ApJ, 748, L15, doi: 10.1088/2041-8205/748/1/L15
- Hsieh et al. (2012c) —. 2012c, AJ, 143, 104, doi: 10.1088/0004-6256/143/5/104
- Hsieh et al. (2013) Hsieh, H. H., Kaluna, H. M., Novaković, B., et al. 2013, ApJ, 771, L1, doi: 10.1088/2041-8205/771/1/L1
- Hsieh et al. (2014) Hsieh, H. H., Denneau, L., Fitzsimmons, A., et al. 2014, AJ, 147, 89, doi: 10.1088/0004-6256/147/4/89
- Hsieh et al. (2015a) Hsieh, H. H., Denneau, L., Wainscoat, R. J., et al. 2015a, Icarus, 248, 289, doi: 10.1016/j.icarus.2014.10.031
- Hsieh et al. (2015b) Hsieh, H. H., Hainaut, O., Novaković, B., et al. 2015b, ApJ, 800, L16, doi: 10.1088/2041-8205/800/1/L16
- Hsieh et al. (2018c) Hsieh, H. H., Ishiguro, M., Kim, Y., et al. 2018c, AJ, 156, 223, doi: 10.3847/1538-3881/aae528
- Jewitt et al. (2015) Jewitt, D., Hsieh, H., & Agarwal, J. 2015, Asteroids IV (Tucson, University of Arizona Press), 221–241, doi: 10.2458/azu_uapress_9780816532131-ch012
- Jewitt et al. (2014) Jewitt, D., Ishiguro, M., Weaver, H., et al. 2014, AJ, 147, 117, doi: 10.1088/0004-6256/147/5/117
- Jewitt et al. (2009) Jewitt, D., Yang, B., & Haghighipour, N. 2009, AJ, 137, 4313, doi: 10.1088/0004-6256/137/5/4313
- Kashikawa et al. (2002) Kashikawa, N., Aoki, K., Asai, R., et al. 2002, PASJ, 54, 819, doi: 10.1093/pasj/54.6.819
- Kossacki & Szutowicz (2012) Kossacki, K. J., & Szutowicz, S. 2012, Icarus, 217, 66, doi: 10.1016/j.icarus.2011.10.005
- Kresák (1979) Kresák, L. 1979, Asteroids (Tucson, University of Arizona Press), 289–309
- Lai et al. (2019) Lai, I. L., Ip, W. H., Lee, J. C., et al. 2019, A&A, 630, A17, doi: 10.1051/0004-6361/201732094
- Li et al. (2016) Li, J.-Y., Samarasinha, N. H., Kelley, M. S. P., et al. 2016, ApJ, 817, L23, doi: 10.3847/2041-8205/817/2/L23
- MacLennan & Hsieh (2012) MacLennan, E. M., & Hsieh, H. H. 2012, ApJ, 758, L3, doi: 10.1088/2041-8205/758/1/L3
- Marschall et al. (2020) Marschall, R., Skorov, Y., Zakharov, V., et al. 2020, Space Sci. Rev., 216, 130, doi: 10.1007/s11214-020-00744-0
- Moreno et al. (2016) Moreno, F., Licandro, J., Cabrera-Lavers, A., & Pozuelos, F. J. 2016, ApJ, 826, 137, doi: 10.3847/0004-637X/826/2/137
- Snodgrass et al. (2017) Snodgrass, C., Agarwal, J., Combi, M., et al. 2017, A&A Rev., 25, 5, doi: 10.1007/s00159-017-0104-7
- Tancredi (2014) Tancredi, G. 2014, Icarus, 234, 66, doi: 10.1016/j.icarus.2014.02.013
- Tody (1986) Tody, D. 1986, in Proc. SPIE, Vol. 627, Instrumentation in Astronomy VI, 733, doi: 10.1117/12.968154
- Tody (1993) Tody, D. 1993, in Astronomical Society of the Pacific Conference Series, Vol. 52, Astronomical Data Analysis Software and Systems II, 173
- Tonry et al. (2012) Tonry, J. L., Stubbs, C. W., Lykke, K. R., et al. 2012, ApJ, 750, 99, doi: 10.1088/0004-637X/750/2/99
- Tonry et al. (2018) Tonry, J. L., Denneau, L., Flewelling, H., et al. 2018, ApJ, 867, 105, doi: 10.3847/1538-4357/aae386
- van Dokkum (2001) van Dokkum, P. G. 2001, PASP, 113, 1420, doi: 10.1086/323894
- van Dokkum et al. (2012) van Dokkum, P. G., Bloom, J., & Tewes, M. 2012, L.A.Cosmic: Laplacian Cosmic Ray Identification. http://ascl.net/1207.005
- Vincent et al. (2015) Vincent, J.-B., Bodewits, D., Besse, S., et al. 2015, Nature, 523, 63, doi: 10.1038/nature14564
- Yoshida et al. (2000) Yoshida, M., Shimizu, Y., Sasaki, T., et al. 2000, Proc. SPIE, 4009, 240, doi: 10.1117/12.388394
- Yu et al. (2020) Yu, L. L., Hsia, C. H., & Ip, W.-H. 2020, AJ, 159, 66, doi: 10.3847/1538-3881/ab61f7