Probing within the Bondi radius of the ultramassive black hole in NGC 1600
Abstract
We present deep (250 ks) Chandra observations of the nearby galaxy group NGC 1600, which has at its centre an ultramassive black hole (171.5 billion ). The exceptionally large mass of the black hole coupled with its low redshift makes it one of only a handful of black holes for which spatially resolved temperature and density profiles can be obtained within the Bondi radius with the high spatial resolution of Chandra. We analyzed the hot gas properties within the Bondi accretion radius R. Within a kpc radius, we find two temperature components with statistical significance. Both the single temperature and two temperature models show only a very slight rise in temperature towards the centre, and are consistent with being flat. This is in contrast with the expectation from Bondi accretion for a temperature profile which increases towards the centre, and appears to indicate that the dynamics of the gas are not being determined by the central black hole. The density profile follows a relatively shallow relationship within the Bondi radius, which suggests that the true accretion rate on to the black hole may be lower than the classical Bondi accretion rate.
keywords:
galaxies: clusters: intracluster medium - intergalactic medium - X-rays: galaxies: clusters1 Introduction
Thomas et al. (2016) have recently reported the discovery of a 171.5 billion solar mass ultramassive black hole (UMBH) at the centre of the group galaxy NGC 1600. The black hole’s colossal mass, and relatively close proximity (z=0.0156) mean that it is one of only a handful of black holes whose Bondi radius is large enough to be spatially resolved by Chandra (RBondi=0.54 kpc=1.7 arcsec), and the only ultramassive (M10 billion ) black hole for which this is the case. Inside the Bondi radius (R = 2GMBH /c ) the gravitational potential of the black hole of mass MBH is dominant over the thermal energy of the surrounding gas (whose sound speed is cs), and the gas inside this radius is expected to be accreted by the black hole.
At present only three other black holes have been probed within the Bondi radius with Chandra: Sgr A∗ at the centre of our galaxy (Wang et al. 2013), and the central black holes in the galaxies NGC 3115 (Wong et al. 2011, 2014: hereafter W14) and M87 (Russell et al. 2015, 2018: hereafter R15 and R18 respectively), with each exhibiting different behaviour. Such observations are extremely challenging, requiring the central black hole to be massive, nearby, and its X-ray emission to not be piled up.
NGC 1600 has a very similar environment to M87: both lie at the centres of galaxy groups with total masses around M⊙ (Walker et al. 2013, Thomas et al. 2016). However NGC 1600 has several advantageous characteristics. Firstly, the central AGN emission is extremely faint; a study of the orginal 45ks Chandra observation by Sivakoff et al. (2004) did not find any point source associated with the central black hole, and in this work we find an upper limit of erg s-1 in the 0.5-6.0 keV band. This avoids the complication found for M87, whose central AGN is very bright and is piled up in many observations taken with Chandra (Russell et al. 2015, 2018), making it difficult to measure temperatures and densities inside its Bondi radius. The orbit superposition method used in Thomas et al. (2016) provides a very precise black hole mass value (171.5 billion ) for NGC 1600. This is far more precise than the black hole mass for M87, where the estimates range from 3.5-6.6 billion (Walsh et al. 2013; Gebhardt et al. 2011; EHT Collaboration et al. 2019), leading to a factor of 2 uncertainty in the Bondi radius of M87.
NGC 1600 holds several advantages over NGC 3115 as well. Similar to M87, the Bondi radius value is highly uncertain for NGC 3115 (where Kormendy et al. 1996 and Emsellem et al. 1999 only roughly constrain the black hole mass to be 1-2 billion ). The much greater mass of NGC 1600 (which lies in the centre of a galaxy group) compared to NGC 3115 (which is a field lenticular galaxy) means that the X-ray luminosity of the gas in NGC 1600 is much higher (by a factor of ). Therefore the fraction of contaminating emission from low mass X-ray binaries (LMXBs) is much smaller (like it is for M87) and can be easily removed through spectral modelling.
The low AGN luminosity gives the black hole an extremely low Eddington fraction (LX/L), similar to NGC 3115. Were the UMBH to be powered by Bondi accretion, with a standard radiative efficiency of 10 percent, the resulting luminosity would be erg s-1 (i.e. the level of a quasar), over eight orders of magnitude higher than is observed. This means that the accretion onto the black hole is extremely inefficient. We would therefore expect the black hole to be in a hot, radiatively inefficient accretion flow (RIAF) mode, instead of a thin accretion disk, with the gas temperature rising inwards (, Narayan & McClintock 2008). The low efficiency is consistent with an advection dominated accretion flow (ADAF), where the advection of energy dominates as the gas cannot radiate energy efficiently due to its low density. Alternate models predict that the gas is prevented from reaching the black hole and instead is blown out of its sphere of influence through winds (ADIOS, e.g. Blandford & Begelman 2004), while others predict the gas to form convective eddies (CDAF, e.g. Narayan et al. 2000), again reducing the accretion rate. Our new observations and subsequent analysis hope to reveal some insights into the accretion mechanics at work within NGC 1600.
| Obs. ID | Date | Exposure (ks) |
|---|---|---|
| 4283 | 9/18/02 | 28.5 |
| 4371 | 9/20/02 | 28.5 |
| 21374 | 12/3/18 | 26 |
| 21375 | 11/28/19 | 42 |
| 21998 | 12/3/18 | 14 |
| 22878 | 11/25/19 | 46 |
| 22911 | 11/1/19 | 31 |
| 22912 | 11/2/19 | 36 |
| Stack | 252 |
In this paper, we use 252 ks of Chandra X-ray observations of NGC 1600 in order to determine the temperature and density profiles within the Bondi radius of the central black hole. Section 2 details the observations, data reduction, and spectral analysis procedure. In Section 3, we present the radial profiles for temperature, density, entropy, and the cooling time within the Bondi radius. Section 4 discusses the implications of our findings and how they compare to similar studies done at this scale. Throughout the paper, we assume a CDM cosmology with , , and km s-1 Mpc-1. At the redshift of NGC 1600, 1 arcsecond corresponds to 0.32 kpc. All errors are 1- unless otherwise noted.
2 Data
2.1 Data Reduction
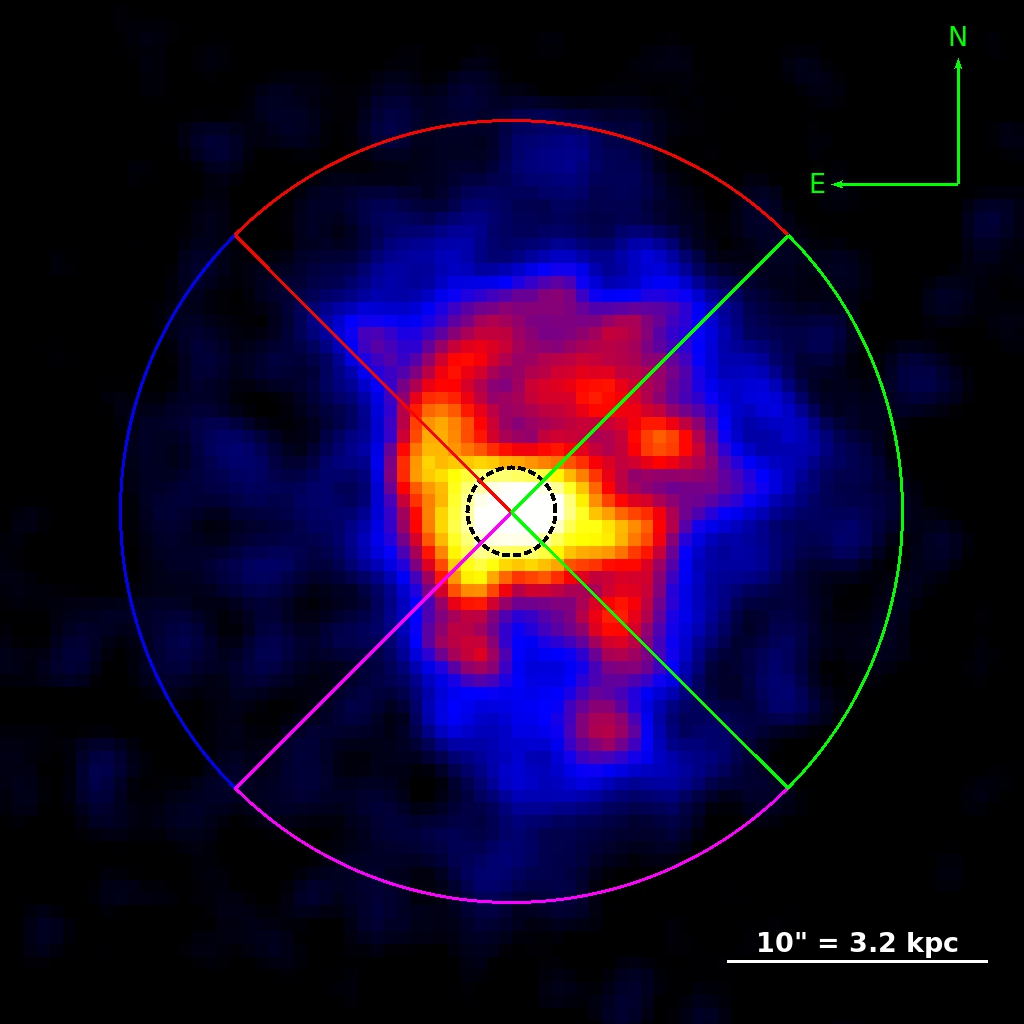
For this study of NGC 1600 (Figure 1), we use a total of eight Chandra observations (Table 1): Six of our own observations totalling 195ks taken between 2018 and 2019 (ObsIDs 21374, 21375, 21998, 22878, 22911, and 22912; PI Walker) and two archival observations from 2002 (ObsIDs 4283 and 4371; PI Sarazin) for a total of 252 ks. All data were reprocessed using the chandra_repro script of CIAO 4.12 and CALDB 4.9.1. Background light curves were analyzed to filter out any time periods affected by flares. In order to properly analyze the diffuse X-ray emission, point sources needed to be removed. These sources were detected using CIAO wavdetect on the merged broad energy image and excluded from the analysis. There was no detection of a central point source indicative of AGN activity. To put a limit on the X-ray luminosity of the central AGN, we follow the method of W14 of fitting the surface brightness profile shape while including a point source component in the surface brightness model. We measure an X-ray luminosity of the central AGN of erg s-1 in the 0.5-6.0 keV band.
2.2 Surface Brightness Profile
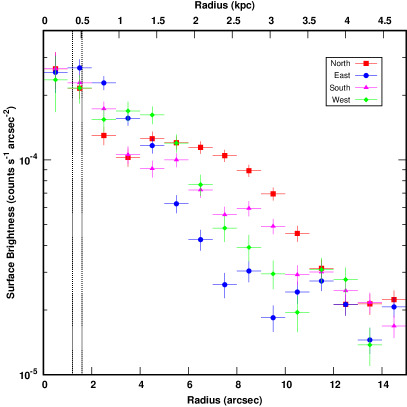
NGC 1600 has an asymmetrical morphology; extending further North and South than East or West. Examining the surface brightness profile in these four quadrants (Figure 1), we see a number of things. Firstly, there is little scatter among the profiles within 3″(1 kpc), indicating that any AGN inflated cavities are not significantly affecting the distribution of the ICM on these scales. Secondly, there is greater variability between 3″and 12″(1-4 kpc) where we see what appear to be the inner rims of cavities to the north and south. Russell et al. (2015) find similar behavior for M87 when dividing their analysis into sectors, with the radial scatter in the surface brightness being relatively small in the central 0.3 kpc, and so like Russell et al. (2015) we proceed with azimuthally averaged temperature and density profiles.
2.3 Spectral Analysis
We extracted spectra in circular annuli centered on the optical peak from archival HST images (ra: 67.9161163 dec: -5.0862464). It is separated from the X-ray emission peak by , and we find no difference in our results if we centre our analysis on the X-ray peak instead. The spectra were analyzed using the X-ray Spectral Fitting Package (XSPEC).
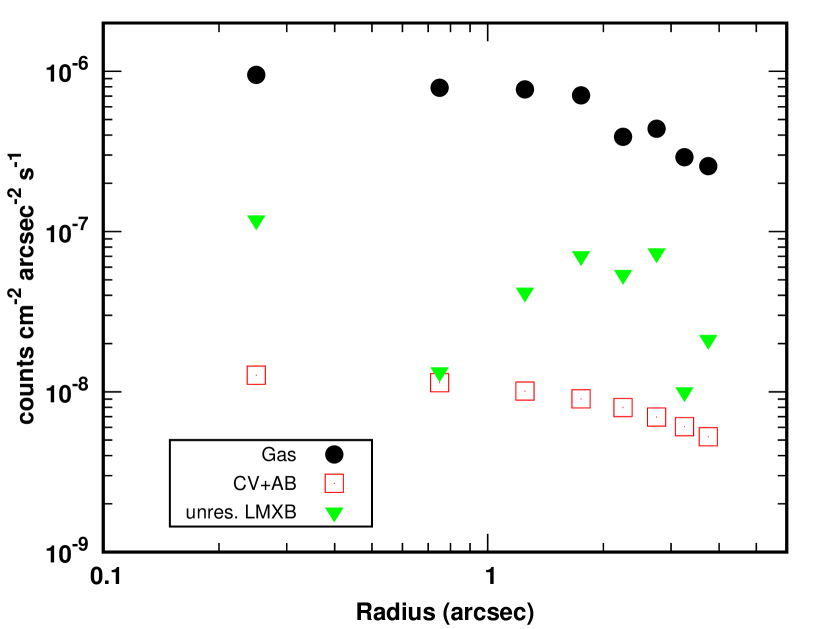
As outlined in W14, the X-ray emission has three main contributions: the diffuse hot gas component, unresolved low-mass X-ray binaries (LMXBs), and stellar emission from cataclysmic variables and coronally active binaries (CV/ABs). We follow a similar process as outlined by W14 in order to estimate the CV/AB contribution. Taking the K-band luminosity found by 2MASS, and assuming that the K-band surface brightness profile shape follows that from an archival HST WFC3 F475X image, we estimated the K-band surface brightness profile. Using the scaling relation derived for M32 (Revnivtsev et al. 2007), the CV/AB normalizations for 05 annuli were determined. Owing to the much higher mass and X-ray surface brightness of NGC 1600 compared to NGC 3115, we find that (as is also the case with M87), such a component is negligible () when compared to the gas component (Figure 2), and that including such a background component in the spectral modelling has no effect on our spectral fits. Therefore, we only consider contributions from the hot gas and LMXBs in this paper.
For each observation, spectra were extracted from 05 annuli using CIAO specextract, which creates the source and background spectra along with the associated ARF and RMF response files. Background was extracted locally from a region far away from the center of NGC 1600 where the surface brightness profile was flat. We then merged with the spectra from the other observations using CIAO combine_spectra, which sums the multiple spectra and combines the background spectra as well as the response files. The merged spectra in the 0.5-7.0 keV range were fitted with a two component absorbed (PHABS) model: a thermal (APEC) model for the gas, and a power law (POWERLAW) with a fixed slope of 1.6 for the LMXBs (consistent with the value of 1.56 we obtain from the combined spectrum of all of the point sources we identify in NGC 1600). As shown in Fig. 2, the contribution to the total emission from LMXBs in small. Varying the powerlaw index through the range 1.3-1.9 in our spectral fits has no affect on our results. The Galactic column density was fixed at a value of cm-2 (Dickey & Lockman 1990). We used the wilm abundance table (Wilms et al. 2000). All spectra were fitted using the modified C-statistic (Cash 1979).
3 Results
3.1 Temperature Profile
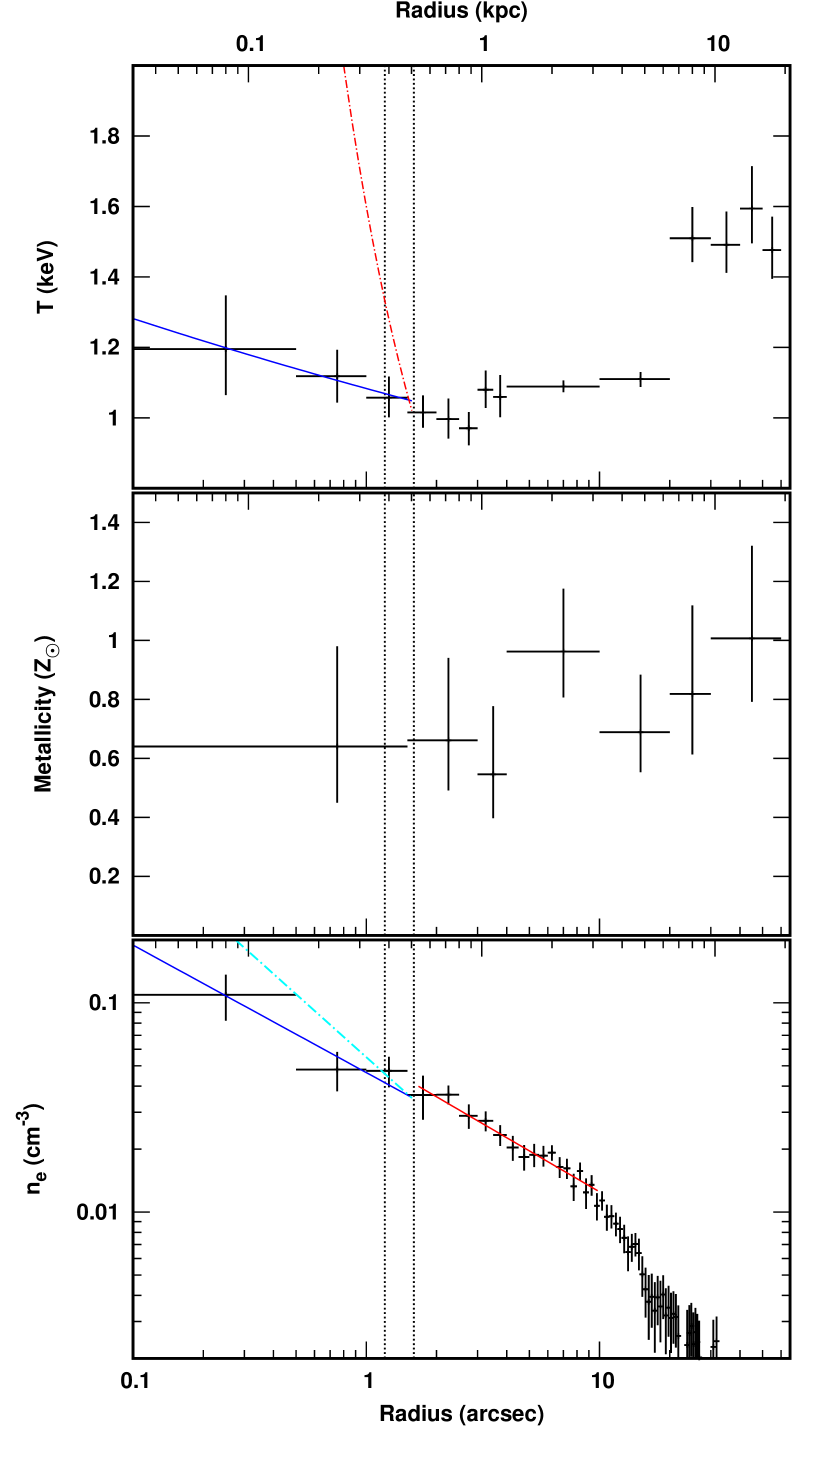
Figure 3 (top panel) shows the projected temperature profile using 0.5″wide radial bins for the inner 4″(1.28 kpc) and 6-10″wide bins out to 60″(19.2 kpc). Within the Bondi radius, the temperature profile demonstrates a mild increase towards the core, consistent with a power law of (shown by the solid blue line in the top panel of Fig. 3).
In W14’s study of NGC 3115 it is found that the hotter gas component within the Bondi radius gives a power law relation of . This value is steeper than what we find, but both are still shallower than the relation expected for classic Bondi accretion (shown as the red dot dashed line for comparison in the top panel of Figure 3) or the lower limit of the powerlaw index of 0.6 found for Sgr A∗ (Wang et al. 2013).
If metallicity is set to a free parameter, we find that it stays relatively constant (Figure 3, middle panel). While it is possible that there is Fe bias due to using a single temperature model (Buote 2000), it does not result in extremely, sub-solar metallicity abundances.
3.1.1 Two Temperature Model
In order to check for a possible multiphase system, we fit a two-temperature model to annuli within the inner 10″. Larger annuli were used than for the single temperature fits to achieve measurements with sufficient statistical accuracy. The metallicity was frozen to its best fit value from the single temperature fits while the temperature and normalization for the two APEC models were allowed to vary. For the inner kpc, an F-test reveals a probability that this secondary component is detected by chance. This probability increases to for the outermost annuli (5 - 10″). Figure 4 shows the hot and cold gas components from the two-temperature model. The temperature of both components still rises slightly towards the center as previously seen in the single temperature profile, though the significance of this increase is limited by the large error bars.
| Object | (r ) | (r ) |
|---|---|---|
| NGC 3115 | ||
| M87 | ||
| NGC 1600 |
3.2 Deprojected Density Profile
Using circular radial bins of 05 out to 60″and excluding point sources, we were able to obtain the deprojected density profile using the DSDEPROJ deprojection routine method (Russell et al. 2008). The deprojected electron density profile for NGC 1600 is shown in the bottom panel of Figure 3. Fitting a power law to the density profile within the Bondi radius () gives , shown by the solid blue line in Fig. 3, bottom panel.
In Table 2 we compare the density profile powerlaw indices for fitting inside and outside the Bondi radius with the equivalent values obtained for NGC3115 in W14 and for M87 in R15. We compare to R15 rather than R18 as the former presents an azimuthally averaged analysis which more closely matches the analysis we perform, as we lack the data quality needed to perform the azimuthally resolved analysis in sectors that is presented in R18. We find that the power law index for the density for NGC 1600 inside the Bondi radius is consistent with that which W14 finds for their single-temperature model for NGC 3115 but shallower than the R15 estimate for M87 (see Table 2 for a comparison).
If we look at the density profile outside the Bondi radius (), the power law index is consistent with being the same as inside the Bondi radius, . This contrasts with M87, where the density profile is flatter outside the Bondi radius, and with NGC 3115, where the density profile is steeper outside the Bondi radius. As is discussed in R15, the X-ray emission around the M87 system is highly disturbed due to multiple generations of cavities created by AGN feedback, which has more greatly affected the shape of the surface brightness profile compared to NGC1600 (which has only one pair of cavities). This greater amount of AGN feedback in M87 appears to have pushed more gas outwards, thus causing the density gradient to be flatter outside the Bondi radius. NGC 3115, on the other hand, shows little to no AGN feedback activity, resulting in a steeper density gradient outside the Bondi radius. While NGC 1600 does show some evidence of AGN feedback (i.e. possible cavities), it is nowhere to the extent of M87; therefore it is not unsurprising that we observe a density profile outside the Bondi radius with a power law index between the values found for M87 and NGC 3115.

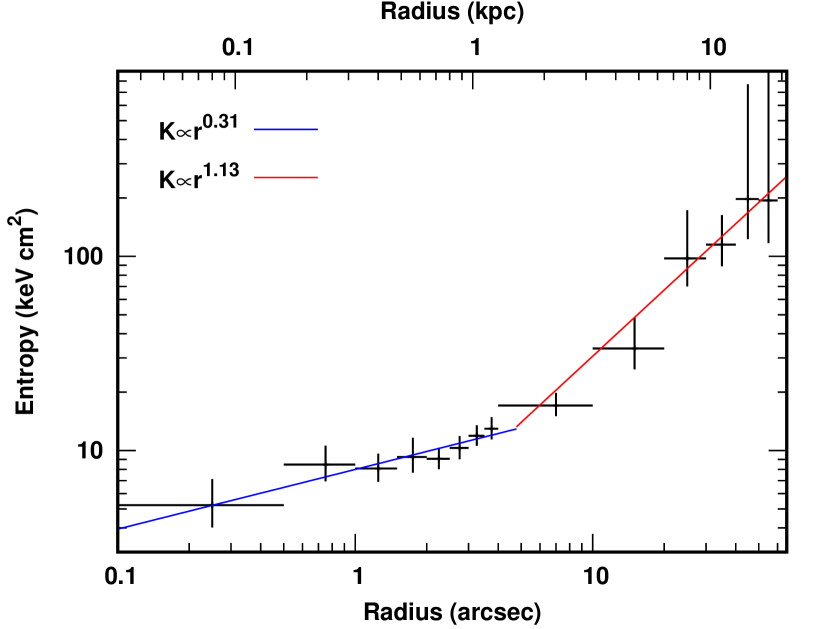
3.3 Entropy
It has been shown that thermal instabilities are prevalent in systems whose central entropy is (Cavagnolo et al. 2008; Rafferty et al. 2008; Voit et al. 2008). We find the entropy profile () using the temperature and deprojected density profiles (Fig. 5). The entropy is below the threshold out to kpc. Outside 1kpc, the profile follows a relation, which is in agreement with that Babyk et al. (2018) found for a sample of 40 early type galaxies and 110 galaxy clusters. Like previous studies have shown (Donahue et al. 2006; Cavagnolo et al. 2009; Voit et al. 2017), the entropy profile flattens in the central region, and can be fit with a broken powerlaw. For kpc, the entropy profile becomes ; shallower than the average relationship of found for samples of systems (Panagoulia et al. 2014; Babyk et al. 2018), but within the scatter of the sample of systems explored in Babyk et al. (2018). It should be noted that we are working on a smaller scale compared to that of Babyk et al. (2018) and Panagoulia et al. (2014), who work on scales from 1 to 1000 kpc, with a majority of data points above 10 kpc. For instance in Babyk et al. (2018) the central slope of is found by fitting a powerlaw to a much larger radial range, namely the central 15 kpc. If we fit a powerlaw to the same radial range as Babyk et al. (2018) (the central 15 kpc) we do indeed obtain a powerlaw index consistent with .
3.4 Cooling time and dynamical time
Multi-temperature structure may also appear when the cooling time becomes sufficiently short with respect to the dynamical free-fall time. Therefore, we have calculated the cooling time and the free-fall time. The radiative cooling time, , was calculated from the temperature and density profiles. The free-fall time was calculated using a best fit mass profile. We assume the mass density follows a Navarro-Frenk-White (NFW) profile (Navarro et al. 1997; Schmidt & Allen 2007)
| (1) |
| (2) |
where is the critical density of the universe, and . Temperatures are calculated in each annulus with the deprojected density profile and NFW mass profile. By comparing these calculated temperatures to the measured temperatures, we find the best fit NFW mass profile which has the lowest statistic, defined as
| (3) |
Figure 6 shows the cooling time, free-fall time, and the profile calculated for NGC 1600. The ratio reaches a minimum of at 0.72 kpc. Akin to what Russell et al. (2015) observed for M87, we see an increase of in the central region.

3.5 Bondi radius and mass accretion rate
The radius at which the SMBH’s gravitational potential becomes dominant is determined by its central gas temperature (Bondi 1952). Assuming spherical symmetry, the Bondi radius is given by the following:
| (4) |
where T is the gas temperature, and is the mass of the black hole. If we neglect angular momentum and assume an adiabatic index of , the rate at which the SMBH should accrete the surrounding hot gas at the Bondi radius may be found using:
| (5) |
where is the gas density.
Through the use of orbit superposition models, Thomas et al. (2016) determined the black hole mass for NGC 1600 to be . The central temperature found from the single temperature profile is keV. These values give a Bondi radius of R. The temperature and density values for this range of Bondi radius gives a Bondi accretion rate of . Furthermore, the Bondi accretion power, given by:
| (6) |
where is the efficiency, may be found assuming the conventional efficiency. Therefore, the Bondi accretion power is .
There appear to be a pair of cavities to the north and south of NGC 1600 (Left side of Fig. 1), each with a radius of around 1kpc. We therefore can calculate the power needed to create these cavities. The energy needed to create the bubble is given by (see e.g. Bîrzan et al. 2004; Walker et al. 2014), where P is the pressure of the surrounding ICM and V is the volume of the bubble. The power needed to inflate such a bubble is given by
| (7) |
where is the age of the cavity. Following for example Bîrzan et al. (2004) and Vantyghem et al. (2014), we take to be the average of the sound crossing time, the buoyancy rise time, and the refill time. We calculate and assume a cavity with kpc, which gives a cavity power of ergs/s. The Bondi accretion power is therefore significantly higher than the power needed to inflate the cavities (as is also found for M87 in R15).
4 Discussion

NGC 1600 is one of a small number of systems where the Bondi radius can be resolved using Chandra observations, due in part to its unusually massive, central black hole. As Thomas et al. (2016) pointed out, NGC 1600 is an outlier in that it is not part of a rich galaxy cluster yet contains a black hole with mass on the order of . The progenitors of such massive black holes are luminous quasars, and it has been shown at higher redshifts that the most luminous quasars are not biased when it comes to environment (Trainor & Steidel 2012; Fanidakis et al. 2013). Therefore, it is possible that NGC 1600 is a descendent of a luminous quasar outside a rich environment. We have calculated the temperature and density profile within the Bondi radius along with other important measurements, such as entropy and cooling time. Using these observations, a number of important characteristics of NGC 1600 can be discussed.
Both the single and two temperature model profiles reveal that the central temperature increases slightly within the Bondi radius, however this increase (a powerlaw of for the 1 temperature fits) is much smaller than the behavior expected from classical Bondi accretion models. This would appear to indicate that the dynamics of the hot gas are not determined by the ultramassive black hole, and that therefore the the Bondi accretion rate may not be an accurate estimate of the true accretion rate. A similar lack of a significant increase in temperature has also been found for M87 in Russell et al. (2015). It is of course possible that there could be a temperature increase on scales smaller than the 0.1kpc scales that we can resolve with the current Chandra observations.
This contrasts with NGC 3115, also probed by Chandra, where W14 find that there is an increase in temperature within the Bondi radius for the hotter gas component of the two temperature model (). Similar temperature increases have also been found in observations made of several elliptical galaxies (Machacek et al. 2006; Humphrey et al. 2008; Pellegrini et al. 2012).
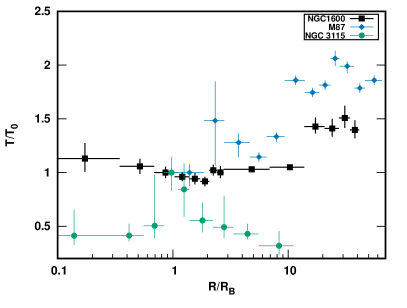
In Fig. 7 (left panel) we compare the temperature profiles found from the single temperature fits to NGC 1600 with the equivalent profiles for M87 and NGC 3115. To aid comparison (since the Bondi radii are different for all of these systems), we have scaled the radial axis by the Bondi radius and the temperature/density profiles by their values at the Bondi radius. In the right hand panel of Fig. 7 we compare the temperature profiles, but this time we use for the central multiphase regions the temperature of the high temperature component, which is interpreted by W14 and R15 as the volume filling component. As the right panel of Figure 7 shows, the shape of the temperature profile of NGC 1600 more closely follows that of M87, and only in NGC 3115 is there a steeply rising temperature gradient.
We find the density profile follows a relation within the Bondi radius, which is very similar to the behavior found in NGC 3115, (), and slightly shallower than the case for M87 (). In a classical Bondi accretion flow (Bondi, 1952) the density is expected to vary more steeply for as . Our observed, flatter central density profile is consistent with several analytical models and numerical simulations where the accretion rate decreases with radial distance (Stone & Pringle 2001; Hawley & Balbus 2002; Yuan & Bu 2010; Begelman 2012). Simulations by Yuan et al. (2012) predict a density profile of , which supports the ADIOS model where the inflow of mass at the Bondi radius is ejected from the black hole’s sphere of influence, never reaching the event horizon (Blandford & Begelman 1999, 2004).
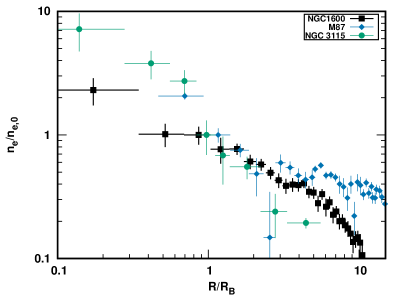
To allow a visual comparison of the shapes of the density profiles in the different systems, in Fig. 8 we compare the deprojected density profiles found from the single temperature fits to NGC 1600 with the equivalent profiles for M87 and NGC 3115, again scaling the radial axis by the Bondi radius, and the density by its value at the Bondi radius.
4.1 Multiphase gas
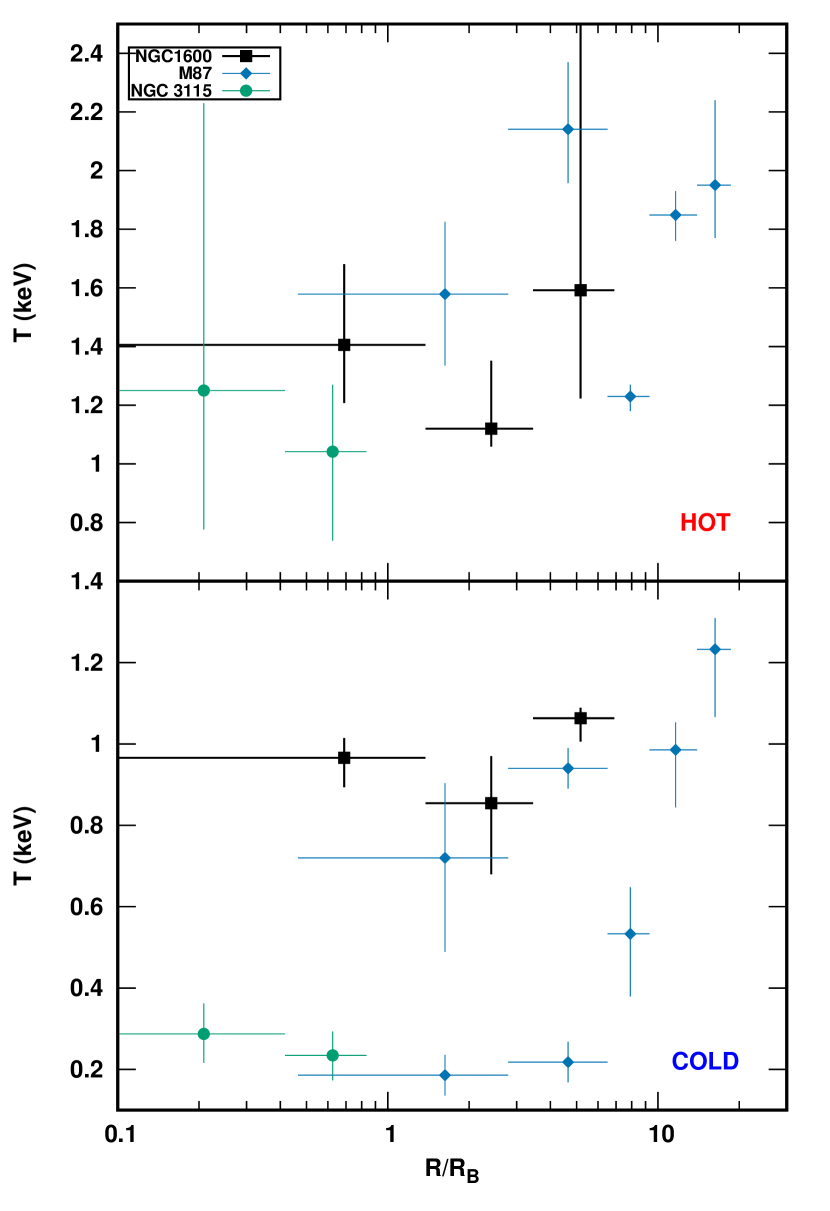
Like W14 and Russell et al. (2015), a two-temperature model was found to be statistically significant when fitting the spectra. With further deep observations of M87, Russell et al. (2018) also found an additional third very low temperature component (0.19keV) that could not be detected in the shallower observations studied in R15. In Figure 9 we compare the temperatures of the hot and cold components found for NGC 1600 with those found for NGC 3115 and M87, scaling the radial axis by the Bondi radius. For NGC 3115, the gas only becomes multi-phase within the Bondi radius, whereas for NGC 1600 and M87 it is multiphase out to much larger radius, out to around 10-20 times the Bondi radius. For the high temperature component (top panel of Fig. 9) all three are in relative agreement, with the innermost temperatures around the Bondi radius for all 3 systems in the range of 1-1.6keV.
The lower temperature component we find for NGC 1600 (Fig. 9, bottom panel) is similar in temperature to the intermediate temperature component found in R18 for M87, in the range 0.6-1.1keV. The very low temperature component found by R18 for M87 at around 0.19 keV is not found in the shallower observations studied in R15, and we do not detect such a low temperature component for NGC 1600. As with M87, it is possible that with much deeper observations of NGC 1600 it will be possible to identify a low, 0.2keV component.
Systems with low cooling time and central entropy generally have H emission, another indication of multiphase gas (Cavagnolo et al. 2008; Rafferty et al. 2008; Voit et al. 2015). For NGC 1600, Trinchieri & di Serego Alighieri (1991), have reported an H detection that extends out to or, kpc, in good agreement with the regions we have found to be best fit with a two temperature model.
The onset of thermal instability has been shown to present itself in systems where the central entropy reaches a threshold of (Rafferty et al. 2008; Cavagnolo et al. 2008; Voit et al. 2008). The entropy values for NGC 1600 fall below this value within of kpc from the center, in agreement with where with find the gas to become multi-phase. Additionally, theoretical studies and observations have shown that systems where the ratio of the cooling time to free-fall time falls below , thermal instabilities are present (McCourt et al. 2012; Sharma et al. 2012; Gaspari et al. 2012; Voit et al. 2015; Voit & Donahue 2015; Loubser et al. 2016). The lowest value for NGC 1600 is , not reaching the required ratio, but Voit et al. (2017) show that this value may vary between . However, McNamara et al. (2016) argue that it is the cooling time that overwhelmingly governs this property, where is the criteria. Looking at Figure 6, the cooling time measured for NGC 1600 falls below this value at kpc, coincident with where the entropy falls below its threshold.
5 Conclusions
Using new deep Chandra observations in conjunction with archival Chandra data of NGC 1600, we have determined the temperature and density profiles within the Bondi accretion radius, down to a radius of kpc from the central ultramassive black hole. We detect two, statistically significant temperature components within 3 kpc. The temperature profile increases very mildly within the Bondi radius, and is consistent with being flat. This contrasts with the expected increase in temperature towards the centre one would expect from classical Bondi accretion, suggesting the dynamics of the gas are not being determined by the central black hole. It is however, possible that the temperature increases on scales smaller than those that we can probe. This is similar to what is found for M87 in R15.
Based upon the temperature and density profiles, we calculate a mass accretion rate of at the Bondi radius of R. Inside the Bondi radius, the density profile follows a power law of , which is flatter than one would expect for classical Bondi accretion. This is consistent with observations of M87, NGC 3115, and SgrA∗ (Russell et al. 2015; Wong et al. 2014; Wang et al. 2013) and the numerical simulations of Yuan et al. (2012) where . Such an agreement favors models such as the ADIOS model where the mass inflow is ejected from the black hole’s sphere of influence before reaching the event horizon.
Both the calculated entropy and cooling time profile support the multi-temperature model. The entropy drops below a critical value of within 3 kpc, which has been shown to be a common characteristic in systems with thermal instabilities. The cooling time reaches a threshold value for multiphase systems of at the same radius. Additionally, there is H detection coincident with this low entropy, rapidly cooling gas, supporting our findings.
In our studies of the thermodynamic profiles within the Bondi radius, we have been limited to exploring azimuthally averaged values, similar to the initial study of M87 by Russell et al. (2015). Future deeper observations of NGC1600 are necessary to explore the asymmetry of the density profile within the Bondi radius.
Our results highlight the need for a next generation X-ray observatory with both high effective area and sub-arcsecond spatial resolution, such as the Lynx (Gaskin et al., 2019) and AXIS (Mushotzky et al., 2019) concepts, which will allow detailed, azimuthally resolved studies of the accretion flows within the Bondi radius.
Acknowledgements
We thank the referee for their helpful report. JR and SAW acknowledge support from Chandra grant GO9-20073X. This work is based on observations obtained with the Chandra observatory, a NASA mission.
Data Availability
The Chandra Data Archive stores the data used in this paper. The Chandra data were processed using the Chandra Interactive Analysis of Observations (CIAO) software. The software packages heasoft and xspec were used, and these can be downloaded from the High Energy Astrophysics Science Archive Research Centre (HEASARC) software web page.
References
- Babyk et al. (2018) Babyk I. V., McNamara B. R., Nulsen P. E. J., Russell H. R., et al. 2018, ApJ, 862, 39
- Begelman (2012) Begelman M. C., 2012, MNRAS, 420, 2912
- Bîrzan et al. (2004) Bîrzan L., Rafferty D. A., McNamara B. R., Wise M. W., Nulsen P. E. J., 2004, ApJ, 607, 800
- Blandford & Begelman (1999) Blandford R. D., Begelman M. C., 1999, MNRAS, 303, L1
- Blandford & Begelman (2004) Blandford R. D., Begelman M. C., 2004, MNRAS, 349, 68
- Bondi (1952) Bondi H., 1952, MNRAS, 112, 195
- Buote (2000) Buote D. A., 2000, MNRAS, 311, 176
- Cash (1979) Cash W., 1979, ApJ, 228, 939
- Cavagnolo et al. (2008) Cavagnolo K. W., Donahue M., Voit G. M., Sun M., 2008, ApJ, 683, L107
- Cavagnolo et al. (2009) Cavagnolo K. W., Donahue M., Voit G. M., Sun M., 2009, ApJS, 182, 12
- Dickey & Lockman (1990) Dickey J. M., Lockman F. J., 1990, ARA&A, 28, 215
- Donahue et al. (2006) Donahue M., Horner D. J., Cavagnolo K. W., Voit G. M., 2006, ApJ, 643, 730
- EHT Collaboration et al. (2019) EHT Collaboration Akiyama K., Alberdi A., et al., 2019, ApJ, 875, L1
- Emsellem et al. (1999) Emsellem E., Dejonghe H., Bacon R., 1999, MNRAS, 303, 495
- Fanidakis et al. (2013) Fanidakis N., Macciò A. V., Baugh C. M., Lacey C. G., Frenk C. S., 2013, MNRAS, 436, 315
- Gaskin et al. (2019) Gaskin J. A., Swartz D. A., Vikhlinin A., Özel F., Gelmis K. E., et al. 2019, Journal of Astronomical Telescopes, Instruments, and Systems, 5, 021001
- Gaspari et al. (2012) Gaspari M., Ruszkowski M., Sharma P., 2012, ApJ, 746, 94
- Gebhardt et al. (2011) Gebhardt K., Adams J., Richstone D., Lauer T. R., et al. 2011, ApJ, 729, 119
- Hawley & Balbus (2002) Hawley J. F., Balbus S. A., 2002, ApJ, 573, 738
- Humphrey et al. (2008) Humphrey P. J., Buote D. A., Brighenti F., Gebhardt K., Mathews W. G., 2008, ApJ, 683, 161
- Kormendy et al. (1996) Kormendy J., Bender R., Richstone D., Ajhar E. A., et al. 1996, ApJ, 459, L57
- Loubser et al. (2016) Loubser S. I., Babul A., Hoekstra H., Mahdavi A., et al. 2016, MNRAS, 456, 1565
- Machacek et al. (2006) Machacek M., Nulsen P. E. J., Jones C., Forman W. R., 2006, ApJ, 648, 947
- McCourt et al. (2012) McCourt M., Sharma P., Quataert E., Parrish I. J., 2012, MNRAS, 419, 3319
- McNamara et al. (2016) McNamara B. R., Russell H. R., Nulsen P. E. J., Hogan M. T., et al. 2016, ApJ, 830, 79
- Mushotzky et al. (2019) Mushotzky R., Aird J., Barger A. J., Cappelluti N., et al. 2019, arXiv e-prints, p. arXiv:1903.04083
- Narayan et al. (2000) Narayan R., Igumenshchev I. V., Abramowicz M. A., 2000, ApJ, 539, 798
- Narayan & McClintock (2008) Narayan R., McClintock J. E., 2008, NewAR, 51, 733
- Navarro et al. (1997) Navarro J. F., Frenk C. S., White S. D. M., 1997, ApJ, 490, 493
- Panagoulia et al. (2014) Panagoulia E. K., Fabian A. C., Sanders J. S., 2014, MNRAS, 438, 2341
- Pellegrini et al. (2012) Pellegrini S., Wang J., Fabbiano G., Kim D.-W., et al. 2012, ApJ, 758, 94
- Rafferty et al. (2008) Rafferty D. A., McNamara B. R., Nulsen P. E. J., 2008, ApJ, 687, 899
- Revnivtsev et al. (2007) Revnivtsev M., Churazov E., Sazonov S., Forman W., Jones C., 2007, A&A, 473, 783
- Russell et al. (2015) Russell H. R., Fabian A. C., McNamara B. R., Broderick A. E., 2015, MNRAS, 451, 588
- Russell et al. (2018) Russell H. R., Fabian A. C., McNamara B. R., Miller J. M., et al. 2018, MNRAS, 477, 3583
- Russell et al. (2008) Russell H. R., Sanders J. S., Fabian A. C., 2008, MNRAS, 390, 1207
- Schmidt & Allen (2007) Schmidt R. W., Allen S. W., 2007, MNRAS, 379, 209
- Sharma et al. (2012) Sharma P., McCourt M., Quataert E., Parrish I. J., 2012, MNRAS, 420, 3174
- Sivakoff et al. (2004) Sivakoff G. R., Sarazin C. L., Carlin J. L., 2004, ApJ, 617, 262
- Stone & Pringle (2001) Stone J. M., Pringle J. E., 2001, MNRAS, 322, 461
- Thomas et al. (2016) Thomas J., Ma C.-P., McConnell N. J., Greene J. E., et al. 2016, Nat, 532, 340
- Trainor & Steidel (2012) Trainor R. F., Steidel C. C., 2012, ApJ, 752, 39
- Trinchieri & di Serego Alighieri (1991) Trinchieri G., di Serego Alighieri S., 1991, AJ, 101, 1647
- Vantyghem et al. (2014) Vantyghem A. N., McNamara B. R., Russell H. R., Main R. A., et al. 2014, MNRAS, 442, 3192
- Voit et al. (2008) Voit G. M., Cavagnolo K. W., Donahue M., Rafferty D. A., et al. 2008, ApJ, 681, L5
- Voit & Donahue (2015) Voit G. M., Donahue M., 2015, ApJ, 799, L1
- Voit et al. (2015) Voit G. M., Donahue M., Bryan G. L., McDonald M., 2015, Nat, 519, 203
- Voit et al. (2017) Voit G. M., Meece G., Li Y., O’Shea B. W., Bryan G. L., Donahue M., 2017, ApJ, 845, 80
- Walker et al. (2014) Walker S. A., Fabian A. C., Kosec P., 2014, MNRAS, 445, 3444
- Walker et al. (2013) Walker S. A., Fabian A. C., Sanders J. S., Simionescu A., Tawara Y., 2013, MNRAS, 432, 554
- Walsh et al. (2013) Walsh J. L., Barth A. J., Ho L. C., Sarzi M., 2013, ApJ, 770, 86
- Wang et al. (2013) Wang Q. D., Nowak M. A., Markoff S. B., Baganoff F. K., et al. 2013, Science, 341, 981
- Wilms et al. (2000) Wilms J., Allen A., McCray R., 2000, ApJ, 542, 914
- Wong et al. (2014) Wong K.-W., Irwin J. A., Shcherbakov R. V., Yukita M., et al. 2014, ApJ, 780, 9
- Wong et al. (2011) Wong K.-W., Irwin J. A., Yukita M., Million E. T., et al. 2011, ApJ, 736, L23
- Yuan & Bu (2010) Yuan F., Bu D.-F., 2010, MNRAS, 408, 1051
- Yuan et al. (2012) Yuan F., Wu M., Bu D., 2012, ApJ, 761, 129