Vol.0 (20xx) No.0, 000–000
22institutetext: School of Astronomy and Space Science, University of Chinese Academy of Sciences, Beijing 100049, China
\vs\noReceived 20xx month day; accepted 20xx month day
High--Metal-Rich Stars in the LAMOST-MRS Survey and Its Connection with the Galactic Bulge
Abstract
We report the detection of a large sample of high--metal-rich stars on the low giant branch with dex in the LAMOST-MRS survey. This special group corresponds to an intermediate-age population of Gyr based on the [Fe/H]-[C/N] diagram and age-[C/N] calibration. A comparison group is selected to have solar ratio at super metallicity, which is young and has a narrow age range around 3 Gyr. Both groups have thin-disk like kinematics but the former shows slightly large velocity dispersions. The special group shows a larger extension in vertical distance toward 1.2 kpc, a second peak at smaller Galactic radius and a larger fraction of super metal rich stars with than the comparison group. These properties strongly indicate its connection with the outer bar/bulge region at kpc. A tentative interpretation of this special group is that its stars were formed in the X-shaped bar/bulge region, close to its corotation radius, where radial migration is the most intense, and brings them to present locations at 9 kpc and beyond. Low eccentricities and slightly outward radial excursions of its stars are consistent with this scenario. Its kinematics (cold) and chemistry () further support the formation of the instability-driven X-shaped bar/bulge from the thin disk.
keywords:
stars: late type — stars: abundances — stars: fundamental parameters — Galaxy: disk — Galaxy: evolution — Galaxy:structure1 Introduction
Stars with super metallicity of in the solar neighborhood and beyond are interesting targets to investigate the role of radial migration in the Galactic disk. Based on large spectroscopic surveys, several works (Kordopatis et al. 2015; Anders et al. 2017; Chen et al. 2019) detected hundreds of super metallicity stars in the solar neighborhood. It has been suggested that these stars originate from the inner Galaxy and have moved to present locations by radial migration first introduced by Sellwood & Binney (2002). The Galactic bulge has its main component with super metallicity (Ness et al. 2013) and thus becomes the natural origin of these stars. This connection is also suggested by theoretical chemo-dynamical models of Minchev, Chiappini & Martig (2013) and other simulation works. In this respect, the observational properties of stars with super metallicity will provide important information on the Galactic bulge.
The formation of the Galactic bulge is, however, complicated and has raised hot debates in recent years. As stated in the review paper by Barbuy (2018), the bulge is previously thought to be a collapsed and rapidly-formed spheroidal old component due to early mergers in the Galaxy (Zoccali et al. 2008), while it has been recently recognized to be a bar formed from dynamical instabilities in the disk (Di Matteo et al. 2016). The color-magnitude diagrams (CMD) in the bulge region (Zoccali et al. 2008; Clarkson et al. 2008) would favor an old population of 10 Gyr and the narrow sequence at the turn off region of the CMD allows little room for the existence of young stars with ages of less than 8 Gyr. By adopting an evolving age-metallicity relation for stars in the bulge, Haywood et al. (2016) reanalyzed the bulge CMD of Clarkson et al. (2008) by isochrones with a spread of ages, and found that all stars with are younger than 8 Gyr, which would make up 50% of all the stars in the bulge. With the release of the infrared spectroscopic data of the APOGEE survey, more works (Sit & Ness 2020; Bovy et al. 2019) favor a secular evolution of the bulge with a mixing population and thus young and old stars co-exist in the inner region of the Galaxy. In particular, Bovy et al. (2019) presented unprecedented detailed maps of the kinematics, elemental abundances, and ages from the bulge region to the outer disk. They found a long bar formed at 8 Gyr ago with a size of 5 kpc, and in the bulge region of kpc different metallicity and kinematics are shown between stars inside and outside the bar, indicating a complicate history of the bulge region.
In this paper, we investigate metal rich stars in the LAMOST mid-resolution spectroscopic survey, which provides us with an extraordinary database of radial velocities, stellar parameters and elemental abundances for a large number of disk stars. In particular, we aim to derive their ages based on age-sensitive abundances, which is not available in the study of super metallicity stars from the LAMOST low resolution spectroscopic survey by Chen et al. (2019). As compared with stellar position and kinematics, age, metallicity and elemental abundances of metal rich stars bear important signatures of the bar/bulge population taking into account the fact that they are not altered by secular evolution, such as radial migration and blurring. Old metal rich stars could be picked out and become the most interesting targets to investigate radial migration process of the Galactic disk and provide new constraints on the bar/bulge’s formation.
2 Data
In 2018, the LAMOST Galactic spectroscopic survey (Zhao et al. 2006, 2012; Cui et al. 2012; Deng et al. 2012) finished its first five-year regular survey with the low resolution mode (R1800), and started a new five-year medium resolution () survey (MRS) at two wavelength ranges of (Blue band) and (Red band). The LAMOST-MRS survey is designed for achieving several scientific goals, e.g., Galactic archaeology, stellar physics, star formation, Galactic nebulae, etc (Liu et al. 2020). A large fraction of target stars has multiple observations over three times, which provide good resulting spectra in order to detect variation in radial velocity to exclude binary stars and to select high-quality spectra in deriving reliable abundances of the sample stars. The LAMOST-MRS DR7 has released that 2 426 237 spectra have signal-to-noise (S/N) higher than 10 for both blue and red bands. Recently, Wang et al. (2020) provided radial velocities, stellar parameters (, , [Fe/H]) and abundances of 12 elements (C, N, O, Mg, Al, Si, Ca, Ti, S, Ni, Cr, Cu) by using the SPCANet neutral network (hereafter LAMOST-MRS-SPCANet DR7).
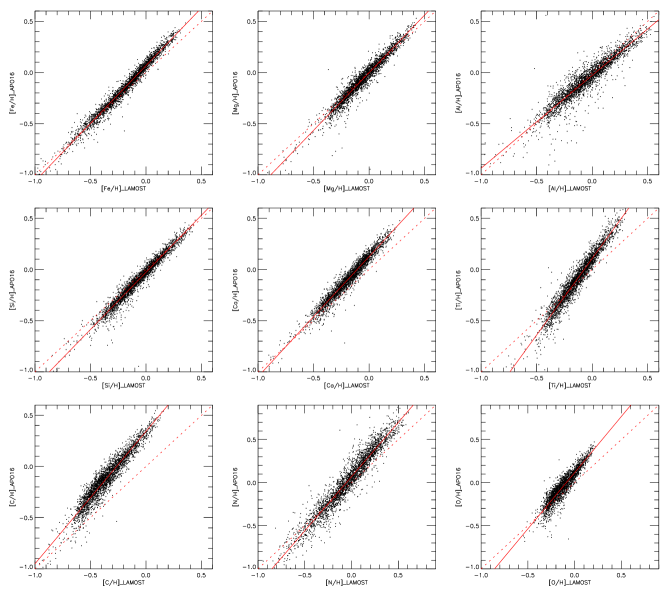
Based on this database, we select our sample stars in the following steps. First, stars on the low giant branch (LGB) with are picked out because reliable ages can be estimated from [C/N] ratios for these stars as shown in Hasselquist et al. (2019). Then we limit stars with since we focus on the study of metal rich stars in the Galactic disk. With the above two criteria, the sample has a temperature range of . Note that Wang et al. (2020) derived abundances for LAMOST-MRS DR7 sample based on stars in common with the APOGEE-Payne DR14 database by Ting et al. (2019). With the release of APOGEE DR16, we compare these abundances with this more reliable dataset for stars with and derive the abundance calibrations for Fe, Mg, Al, Si, Ca, Ti, C, N, O elements based on stars in common by linear fits to the data, which are shown in red lines of Fig. 1. With these calibrations, we obtain abundances in the same scale with the APOGEE DR16 dataset.
For the selected sample of stars, we calculate stellar positions, spatial velocities and orbital parameters based on radial velocities from the LAMOST-MRS-SPCANet data, distances and proper motions from Gaia DR2 (Gaia Collaboration 2018). The distance of from Gaia DR2 is adopted and we limit stars with relative error in parallax to be less than 10%. Orbital parameters are calculated from spatial velocity with the help of Galactic potential MWPotential2014 in by Bovy (2015). Details on the calculations are presented in Chen et al. (2019) for super metal rich stars in the LAMOST low resolution survey. The solar radius is of 8.34 kpc, the solar circular velocity of (Reid 2014) and the solar motion of (11.1, 12.24, 7.25) (Schönrich & Binney 2009).
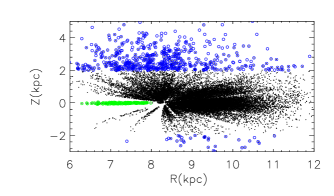
Fig. 2 shows the distributions of the sample stars in the plane. Here we pick out two specific regions for later comparisons with blue circles corresponding to stars with kpc as a representation of the thick disk population and green circles being stars at the very low Galactic-plane inner solar circle ( kpc and kpc) in the LAMOST-MRS-SPCANet DR7 dataset.
3 A special group of stars detected in the [Fe/H] versus [Mg/Fe] diagram
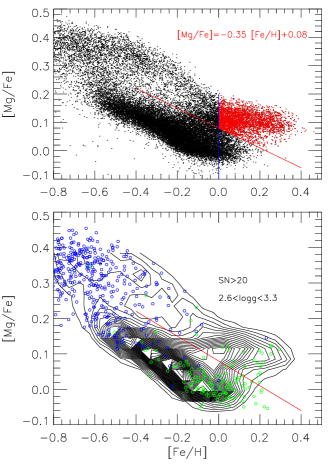
Fig. 3 shows the [Fe/H] versus [Mg/Fe] diagram and its contour mapping for our sample stars. Two sequences, the thin disk on the low [Mg/Fe] branch and the thick disk on the high [Mg/Fe] branch, are well separated by the red line of , which is drawn by passing through the sparse region between the two branches at . Interestingly, a special feature with and is shown in the contour map (lower panel) and its stars are marked in red dots (upper panel). We note that this special group is similar as the high--metal-rich (hmr) stars detected in the solar neighborhood by Adibekyan et al. (2012). Meanwhile, it could be the same feature as the upturn trend of [Si/Fe] for the most metal rich stars in the APOGEE survey by Haywood et al. (2013). The feature in the present work is clearer than that of the APOGEE data probably because we limit the sample stars within the LGB stage of dex so that stars have internally consistent abundances to show distinguished features. Based on 27 135 red clump stars in the APOGEE survey, this group is clearly picked out as a separated feature by Ratcliffe et al. (2020) (Group 3, their Fig. 11). This supports the reality of this special group in the LAMOST-MRS survey.
We over-plot stars from the two selected regions (blue and green circles) on the contour map in the [Fe/H] versus [Mg/Fe] diagram. It shows that this special group forms an extension of the thick disk, since both of them are located above the red line. However, only one star from the selected thick disk (blue circles) is found in this region, while quite a few stars from the very low- inner solar circle (marked by green circles) belong to this special group. We have 3293 stars in the special group, and we select a comparison group, which includes 1565 metal rich stars with and (below the red line). In the following section, we investigate the similarities and differences of age, chemical and kinematical properties between the two groups.
Stars from the low- inner disk at kpc and kpc (green circles) and the thick disk at kpc (blue circles) are overplotted.
4 The special group versus the comparison group
4.1 Ages estimated from [C/N] ratios
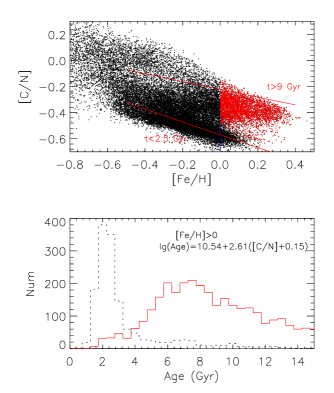
Based on masses and ages derived by Martig et al. (2016) and abundances from APOGEE DR14, Hasselquist et al. (2019) interpreted the [C/N] versus [Fe/H] distributions as the age versus [Fe/H] trends, and found that LGB stars with dex have the most reliable ages derived from [C/N] ratios. Fig. 4 shows the [Fe/H] versus [C/N] diagram for our sample stars with red dots corresponding to hmr stars in the special group. Two red lines indicate the locations of the old population of Gyr and the young population of Gyr, which are derived from open clusters in APOGEE DR14 by Hasselquist et al. (2019). The special group lies below the upper red line of Gyr but far above the lower red one of Gyr, indicating an intermediate-age population of Gyr. The comparison group lies around the lower red line with its main part of Gyr, slightly above the Gyr line.
We estimate ages for our sample stars based on the age calibration of by Casali et al. (2019), which was derived from open clusters in the Gaia-ESO and APOGEE surveys. This calibration is valid for stars with , and our sample stars () fits this requirement. However, the comparison group shows a peak at 1 Gyr by using this age calibration, which indicates a systematic deviation in the [C/N] ratio between Casali et al. (2019) and the present work from the dataset by Wang et al. (2020). Therefore, we shift the [C/N] term upward by 0.15 dex in the age calibration in order to fit the peak of Gyr of the age distribution for the comparison group. That is, we adopt a revised age calibration of . Note that there is no deviation in the [C/N] ratio between Hasselquist et al. (2019) and our work because both are based on the APOGEE DR14 dataset. Wang et al. (2020) derived abundances for the LAMOST-MRS DR7 sample based on stars in common with the APOGEE-Payne DR14 database by Ting et al. (2019), and thus it is also based on the APOGEE DR14 dataset. This consistency seems to persist when we correct abundances to the same system of APOGEE DR16 via calibrations in Fig. 1.
Based on the revised age calibration, the special group shows a wide age range of Gyr with a peak at Gyr. Since the age calibration of Casali et al. (2019) does not take into account the metallicity dependence, which is clearly seen in open clusters of Hasselquist et al. (2019), we expect that the old end of the age distribution is overestimated at the solar metallicity where the highest [C/N] is found in the special group. In view of this, we suggest that this special group has an upper age limit of 9 Gyr, rather than the Gyr from the revised age calibration.
The significant deviation of age by Gyr between the special and the comparison groups is consistent with the result of Sit & Ness (2020) that stars in the bulge are about twice as old (8 Gyr) as those in the solar neighborhood (4 Gyr) for low- stars, corresponding to a 4-Gyr-old difference. The age peaking at 7 Gyr of this special group is exactly the same as Gyr of Bovy et al. (2019) (their Fig. 7) for the bar region based on APOGEE DR16, and is consistent with an age of Gyr by Sit & Ness (2020) for bulge stars within kpc in APOGEE DR14. Thus, the age distribution of the special group indicates its connection with the bar/bulge, rather than the local-born young disk in the solar neighborhood.
4.2 The age-sensitive abundances
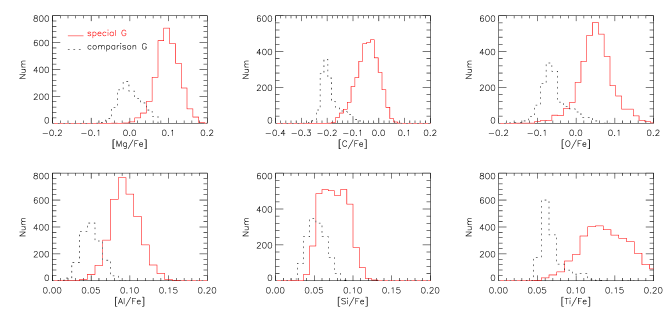
Fig. 5 shows histograms of abundance ratios for six elements (Mg, C, O, Al, Si, Ti) between the special and the comparison groups. Besides [Mg/Fe], other -related elements, [O/Fe] and [Ti/Fe], as well as [Al/Fe] in the former are overabundant. Since these ratios are all age sensitive (Delgado Mena et al. 2019), it further confirms the age separation between the two groups. Meanwhile, the special group has wider abundance distributions than the comparison group for all age-sensitive elements, indicating a larger age range than the comparison group. Note that [Si/Fe] distribution of the special group overlaps significantly with the comparison group probably due to the uncertainty of Si abundances in both the LAMOST-MRS-SPCANet DR7 and APOGEE DR14 dataset. Actually, Zasowski et al. (2019) revealed the presence of abundance trends with temperature for Si and Ca elements. We do not include [Ca/Fe] in the comparison not only because it has large uncertainties but also because it is not age-sensitive (Delgado Mena et al. 2019).
The deviations in the peak of these histograms between the two groups are 0.10 dex for [Mg/Fe], 0.16 dex for [C/Fe] and 0.12 dex for [O/Fe]. The overabundant [Mg/Fe] of 0.10 dex is similar as that of the metal rich component in the bulge region with kpc by Rojas-Arriagada et al. (2019). The overabundant [O/Fe] of dex with respect to the comparison group is close to the average value of bar/bulge by Bovy et al. (2019) (their Fig. 5.).
4.3 The , and [Fe/H] histograms
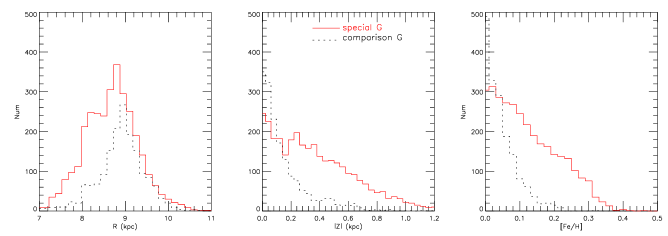
The R, and [Fe/H] histograms between the special and the comparison groups are presented in Fig. 6. It shows that both groups locate around 9 kpc with the former extending towards lower values until 7 kpc. The comparison group has kpc and in consistency with the origin of the young thin disk population, while the special group has main contributions from stars with kpc and with more extending metallicity towards dex.
If the comparison group represents the local-born thin disk population as indicated by young age and low kpc, then the local ISM in the solar neighborhood is enriched to at 3 Gyr ago. The local ISM metallicity should be significantly lower at 7 Gyr ago when stars of the special group were born. The fact that this intermediate-old special group has even higher metallicity than the young comparison group highly suggests that it does not belong to the local region but comes from a high-SFR region, e.g. the bulge. According to Rojas-Arriagada et al. (2019), the bulge region does show a high [Mg/Fe] sequence extending to super solar metallicity. Interestingly, they found that this metal rich component has an upper limit of kpc, similar as the distribution of the special group (until 1.2 kpc) in our sample. In addition, the X-shaped structure of the bulge has a vertically extended feature to kpc (Barbuy 2018). It seems that this special group with similar extension is related with the X-shaped structure of the bulge region.
4.4 The kinematic and orbital parameters
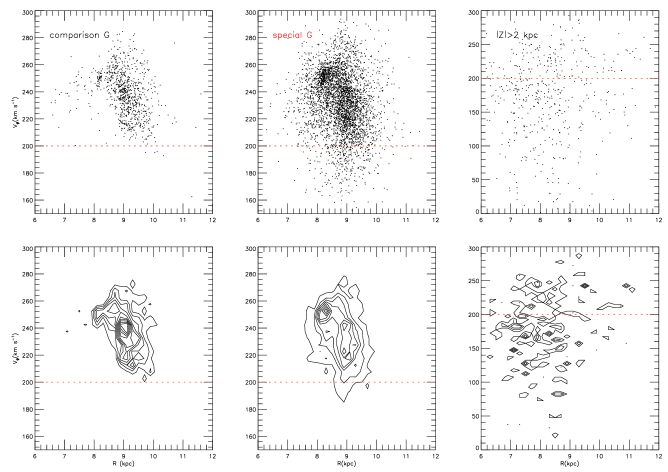
Fig. 7 presents the versus diagrams for the comparison and the special groups as well as the thick disk represented by stars with kpc. Two dense clumps are clear for the former and they become slightly sparse for the latter, while there is almost no clump for stars with kpc. The velocity of the special group is more like the thin disk as most stars distributing above the red dash line of . Stars from the selected thick disk at kpc show a wide distribution and more stars have than stars with . The and velocities have the same features as . The low dispersion of this special group indicates its kinematic colder than the group of high thick disk. This is consistent with the metal-rich component (mean ) of the bulge in Ness et al. (2013) who found this component is kinematically cold and has the thin-disk characteristics, typical for the outer bar/bulge as shown in Bovy et al. (2019).
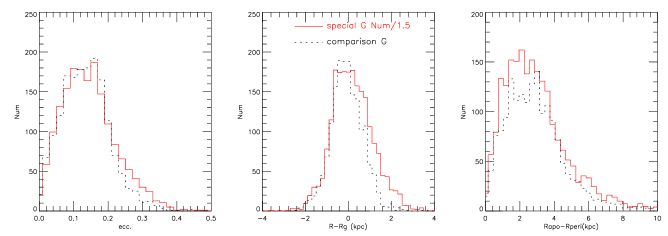
The distributions of eccentricity, and are similar for both groups as presented in Fig. 8. There is a low eccentricity distribution of , kpc but quite a broad distribution of radial excursion distance of (from 1 to 5 kpc). Again, a small fraction of stars of the special group extend to higher values in these histograms, which indicates a outward displacement due to secular evolution. In short, the special group is kinematically cold, similar as the thin disk population, and has the same distribution as the metal-rich component of the outer bulge and the X-shaped bar.
5 A tentative interpretation on the origin of the special group
Based on the above properties (age, Galactic location, kinematics and chemistry), we propose a tentative interpretation on the origin of the special group by investigating how it connects with the bulge, where it comes from (the inner or outer region of the bulge), and how its stars stray from their birth sites to present locations.
In the past few years, some observational and theoretical works have discussed the connection between these special stars and the inner disk. Using the Gaia ESO survey, Kordopatis et al. (2015) pointed out that the metallicity of high- stars in the solar neighborhood probably up to dex, and discussed that these stars may be formed in the inner most region of the Milky Way. However, due to the lack of reliable ages of these stars, they could not draw reliable conclusions. Minchev, Chiappini & Martig (2013) showed that most of the stars with super solar metallicity were born in the inner disk according to the chemodynamical simulation, and almost all the stars with metallicity of dex in the solar neighbourhood came from kpc. Minchev et al. (2018) estimated the birth radius of field stars by a semi-empirical approach, and calculated that the birth radius of high--metal-rich stars in their samples taken by the HARPS instrument is basically less than kpc (see their Fig. 9).
According to Fragkoudi et al. (2018), the bulge is slightly metal-poor with dex (see their Fig. 13) in the innermost regions ( kpc), while the most metal rich component has the mean metallicity of dex in the outer bulge where the bar is strong. However, Wegg et al. (2019) suggested that stars in the central bar (also the central bulge) are more metal-rich than their surrounding region and thus suggested an opposite metallicity structure of the bulge. Based on APOGEE and Gaia surveys, Bovy et al. (2019) presented unprecedented detailed maps of the kinematics, elemental abundances, and age of the bulge region, and found that the central bar tend to be slightly metal poor than the bulge region outside the bar, which is consistent with the result of Fragkoudi et al. (2018). In particular, they suggested that the highest metallicity region is in the outermost region of the bar/bulge, i.e. kpc, where the age has a peak of 7 Gyr and an enhancement dex (with respect to solar radius) as shown in their figure 5. All these properties are found for the special group in our sample, and thus we suggest that it may originate from kpc, rather than the central bar/bulge ( kpc).
The bar/bulge shows an X-shape (or boxy/peanut shape) structure in the X-Z diagram (Barbuy 2018), which has an extension to kpc in the direction. According to Di Matteo et al. (2016), the X-shape structure is found to be more prominent in the metal-rich population than other components. In other words, stars in the most metal rich component of the bulge have a large extension in vertical distance, reaching 1.2 kpc at the outer region of kpc. The similar extension to 1.2 kpc for the special group in our work supports the suggestion that its stars come from the outer bar/bulge region at kpc and kpc.
Finally, it is interesting to investigate how stars in this special group move from their birth sites of kpc to present locations peaking at kpc (see Fig. 6). The low eccentricity (peaking at ), small ( kpc) and kinematical cold (small velocity dispersion) all indicate that it is unlikely that blurring alone could cause a distance displacement of kpc in the radial direction without inducing significant velocity dispersions. Churning (i.e. radial migration) is, however, a promising mechanism to bring these stars to present locations in the sense that their birth sites of kpc are close to the corotation radius (CR) of the Galactic bar, which is located at 4.7 kpc (Minchev, Chiappini & Martig 2013) or 5.5 kpc (Bovy et al. 2019), where radial migration is most intense. According to Minchev, Chiappini & Martig (2013), the incorporating spiral arms and bar structure could provide a very powerful stellar radial migration, leading to the migration distance as large as 5 kpc. Moreover, radial excursions between peri-center and apo-center distances () are of kpc (Fig. 8), which allows for a radial displacement of these stars outwards to larger distances. The low eccentricity of the special group is consistent with the scenario that these stars stray from the outer bar/bulge at kpc and moved outwards by radial migration, which alters the guiding radius without changing the eccentricity. If this is the case, its thin-disk characteristics, i.e. kinematic-cold, intermediate-age and mildly-enhanced [Mg/Fe] ratio, would provide a support for the bar/bulge formation from the thin disk (Di Matteo et al. 2016).
6 Result
Based on LAMOST-MRS-SPCANet DR7 data, we selected a sample of stars with and stellar parameters in the ranges of , and dex. In the [Fe/H] versus [Mg/Fe] diagram, two distinct groups are detected at super solar metallicity, a special group with enhanced [Mg/Fe] of 0.1 dex and a comparison group with solar [Mg/Fe] ratios.
Stellar ages are estimated from [C/N] ratios, and this special group corresponds to an intermediate-age population of Gyr, while the comparison group is a young population peaking at Gyr. The special group shows wide distributions with significant extension towards small , large (until 1.2 kpc) and high [Fe/H] as compared with the comparison group. The age-sensitive elements, [O/Fe], [C/Fe], [Al/Fe] and [Ti/Fe] in the special group are also overabundant as well as the enhanced [Mg/Fe] and [C/N] ratios. Both groups are thin-disk like in the versus diagrams and are kinematic cold as indicated by low velocity dispersions. We connect this special group with the outer bar/bulge region based on similar properties, i.e. the extending distributions of high and high [Fe/H], slightly overabundant [/Fe] ratios, thin-disk like kinematics and low velocity dispersions.
By combining the above properties, we propose a tentative interpretation on the origin of the special group. It was born at the outer bar/bulge of kpc, where it is the most metal-rich component with an extending distribution to 1.2 kpc, typical for the X-shape structure at the outer bar/bulge. Radial migration induced by the coupling between the bar and the spiral arms (Minchev, Chiappini & Martig 2013) could bring its stars from the birth sites of kpc to present locations. If the bulge origin of this special group is true, its kinematic-cold, intermediate-age and mildly-enhanced [Mg/Fe] would provide a support for the scenario that the bar/bulge is formed from the thin disk population as suggested by Di Matteo et al. (2016). The future 2-m Chinese Space Survey Telescope (CSST) project (Zhan et al. 2011) will provide a good opportunity to investigate the properties of the bulge and the mechanism of radial migration by finding a large amount of super solar metallicity stars in the inner disk. The preparation of the usage of data from the CSST project for this investigation is desirable, as already started for the study of the merging history by Zhao & Chen (2021) via the chemical abundances of halo stars.
Acknowledgements.
This study is supported by the National Natural Science Foundation of China under grants No. 11988101, 11625313, 11890694, 11973048, 11927804, the 2-m Chinese Space Survey Telescope project and the National Key R&D Program of China No. 2019YFA0405502. This work is also supported by the Astronomical Big Data Joint Research Center, co-founded by the National Astronomical Observatories, Chinese Academy of Sciences and the Alibaba Cloud. The Guo Shou Jing Telescope (the Large Sky Area Multi-Object Fiber Spectroscopic Telescope LAMOST) is a National Major Scientific Project built by the Chinese Academy of Sciences. Funding for the project has been provided by the National Development and Reform Commission. The LAMOST is operated and managed by the National Astronomical Observatories, Chinese Academy of Sciences. This work has made use of data from the European Space Agency (ESA) mission Gaia (https://www.cosmos.esa. int/gaia), processed by the Gaia Data Processing and Analysis Consortium (DPAC, https://www.cosmos.esa.int/ web/gaia/dpac/consortium). Funding for the DPAC has been provided by national institutions, in particular the institutions participating in the Gaia Multilateral Agreement.References
- Adibekyan et al. (2012) Adibekyan, V. Z., Sousa, S. G., Santos, N. C., et al. 2012, A&A, 545, A32
- Anders et al. (2017) Anders, F., et al., 2017, A&A, 597, A30
- Barbuy (2018) Barbuy B, Chiappini C. & Gerhard O, 2018, Ann. Rev. Astro. & Astroph. 56, 223
- Bovy (2015) Bovy, J. 2015, ApJS, 216, 29
- Bovy et al. (2019) Bovy, J., Leung, H. W., Hunt, J. A. S., et al. 2019, MNRAS, 490, 4740
- Casali et al. (2019) Casali G., Magrini L., Tognelli E. et al., 2019, A&A, 629, A62
- Chen et al. (2019) Chen Y Q, Zhao G, Zhao J K, et al. 2019, AJ, 158, 249
- Clarkson et al. (2008) Clarkson W., et al., 2008, ApJ, 684, 1110
- Cui et al. (2012) Cui X.-Q. et al., 2012, RAA, 12, 735
- Delgado Mena et al. (2019) Delgado Mena, E., Moya, A., Adibekyan, V. et al. 2019, A&A, 624, 78
- Deng et al. (2012) Deng L.-C. et al., 2012, RAA, 12, 1197
- Di Matteo et al. (2016) Di Matteo P. 2016. Publ. Astron. Soc. Aust. 33, e027
- Fragkoudi et al. (2018) Fragkoudi, F., Di Matteo, P., Haywood, M., et al. 2018, A&A, 616, A180
- Gaia Collaboration (2018) Gaia Collaboration, (Brown, A. G. A., et al.) 2018, A&A, 616, A1
- Hasselquist et al. (2019) Hasselquist, S., Holtzman, J. A., Shetrone, M., et al. 2019, ApJ, 871, 181
- Haywood et al. (2013) Haywood, M., Di Matteo, P., Lehnert, M., Katz, D., Gómez, A. 2013, A&A, 560, A109
- Haywood et al. (2016) Haywood M., Lehnert M. D., Di Matteo P., Snaith O., Schultheis M., Katz D., Gomez A., 2016a, A&A, 589, A66
- Kordopatis et al. (2015) Kordopatis, G., Wyse, R. F. G., Gilmore, G., et al. 2015, A&A, 582, A122
- Liu et al. (2020) Liu, C., Fu, J.N., Shi, J.R. et al. 2020, RAA, (arXiv:2005.07210)
- Martig et al. (2016) Martig, M., Fouesneau, M., Rix, H.-W., et al. 2016, MNRAS, 456, 3655
- Minchev, Chiappini & Martig (2013) Minchev, I., Chiappini, C., & Martig, M. 2013, A&A, 558, A9
- Minchev et al. (2018) Minchev, I., Anders, F., Recio-Blanco, A., Chiappini, C., et al. 2018, MNRAS, 481, 1645
- Ness et al. (2013) Ness M., Freeman K.,Athanassoula E. et al. 2013, MNRAS, 430, 836
- Ratcliffe et al. (2020) Ratcliffe, B.L., Ness, M.K., Johnston, K.V., Sen, B., 2020, ApJ, 990, 165
- Reid (2014) Reid M. J., Menten, K. M., Brunthaler, A., et al. 2014, ApJ, 783, 130
- Rojas-Arriagada et al. (2019) Rojas-Arriagada A.,Zoccali1 M., Schultheis M. et al. 2019, A&A, 626, A16
- Schönrich & Binney (2009) Schönrich, R., Binney, J., 2009, MNRAS, 396, 203
- Sellwood & Binney (2002) Sellwood, J. A., Binney J. J., 2002, MNRAS, 336, 785
- Sit & Ness (2020) Sit, T. & Ness M. K., 2020, ApJ, 990, 4
- Ting et al. (2019) Ting, Y.-S., Conroy, C., Rix, H.-W., & Cargile, P. 2019, ApJ, 879, 69
- Wegg et al. (2019) Wegg, C., Rojas-Arriagada, A., Schultheis, M., Gerhard, O. 2019, A&A, 632, 121
- Wang et al. (2020) Wang, R., Luo, A.L., Chen, J. J., et al. 2020, ApJ, 891, 23
- Zasowski et al. (2019) Zasowski, G., Schultheis, M., Hasselquist, S., et al. 2019, ApJ, 870, 138
- Zhan et al. (2011) Zhan H., 2011, Scientia Sinica Physica, Mechanica & Astronomica, 41, 1441
- Zhao et al. (2006) Zhao, G., Chen, Y.Q., Shi, J.R., et al., 2006, RAA, 6, 265
- Zhao et al. (2012) Zhao, G., Zhao Y.H., Chu, Y.Q., Jing, Y.P., Deng L.C., 2012, RAA, 12, 723
- Zhao & Chen (2021) Zhao, G. & Chen, Y.Q. 2021, SCIENCE CHINA Physics, Mechanics & Astronomy, 64, 239562
- Zoccali et al. (2008) Zoccali, M., Hill, V., Lecureur, A., et al. 2008, A&A, 486, 177