A possible blazar spectral irregularity case caused by photon–axionlike-particle oscillations
Abstract
We report detection of a line-like feature in the -ray spectrum of the blazar B0516621, for which the data obtained with the Large Area Telescope onboard Fermi Gamma-Ray Space Telescope (Fermi) are analyzed. The feature is at 7 GeV and different analyses are conducted to check its real presence. We determine that it has a significance of 2.5–3.0, and cautiously note the presence of possible systematics in the data which could reduce the significance. This putative feature is too narrow to be explained with radiation processes generally considered for jet emission of blazars. Instead, it could be a signal due to the oscillations between photons and axion-like particles (ALPs) in the source’s jet. We investigate this possibility by fitting the spectrum with the photon-ALP oscillation model, and find that the parameter space of ALP mass eV and the coupling constant (between photons and ALPs) =1.16–1.48 GeV-1 can provide a fit to the line-like feature, while the magnetic field at the emission site of -rays is fixed at 0.7 G. The ranges for and are in tension with those previously obtained from several experiments or methods, but on the other hand in line with some of the others. This spectral-feature case and its possible indication for ALP existence could be checked from similar studies of other blazar systems and also suggest a direction of effort for building future high-energy facilities that would have high sensitivities and spectral resolutions for searching for similar features.
1 Introduction
It has been widely discussed that axion-like particles (ALPs), as a plausible cold dark matter candidate, may reveal their existence with different signatures in astrophysical objects [1, 2]. These hypothetical very light particles would interact with photons when pass through external magnetic fields due to a two-photon coupling [3, 4]. For example, pulsars, the fast-rotating neutron stars with strong surface magnetic fields, might show a differential delay in their pulsed emission signals from the magnetospheres [5] or -ray spectral modulation because of high-energy photons going through the Galactic magnetic fields [6]. In a core-collapse supernova (SN), significant amount of ALPs could be produced, and they would be converted to high-energy -ray photons in the Galactic magnetic fields [7]. This scenario led to the search for -ray emission from SN1987A, a nearby SN event in the Large Magellanic Cloud. Blazars, as subclass sources of Active Galactic Nuclei (AGN), contain a jet pointing close to our line of sight. The relativistic beaming effect makes the jets’ emission bright and highly variable. Because the magnetic field in a blazar jet can be of the order of 1 G, its emitted high-energy photons could be converted to ALPs and thus a non-thermal smooth spectrum would be distorted [8, 9]. In addition, very-high energy (VHE) -ray photons from distant blazars are severely absorbed because of the interaction with the extragalactic background light (EBL). However, as they pass through magnetic fields of different strengths at galactic, intra-galactic, and intra-cluster regions, the conversion between the photons and ALPs could reduce the absorption effect as ALPs would travel freely, increasing the detectability of distant blazars at VHE bands [10, 11, 12].
Considering an external magnetic field with component transverse to the propagation direction of photons, it can be shown that there is a critical energy for photons of energy ,
| (1.1) |
where is the ALP mass, is the plasma frequency (determined by the electron density , ), and is the coupling constant between photons and ALPs (e.g., ref. [8, 13, 12]). Around , significant photon-ALP mixing is expected. Specifically for blazars, high-energy photons are emitted from a blob region 0.01–0.1 pc away from the central supermassive black hole and the photons travel through a jet with a length of kpc and nearly pointing to the Earth. The magnetic field and electron density of the jet decrease as a function of the distance from the blob along the jet (often assumed to be for the former and for the latter). Adding photon-ALP oscillations within this jet, the observed high-energy spectrum would appear distorted (e.g., [14]). Previously, pieces of possible evidence for such photon-ALP oscillations were seen in spectra of the jets at GeV energies (e.g., [15, 16, 17])
Since the launch of Fermi Gamma-ray Space Telescope (Fermi) in 2008, the Large Area Telescope (LAT) onboard it has been scanning the whole sky for detecting -ray sources at GeV energies and collecting data for different types of detected sources. From 10-yr data collected with LAT, more than 3000 blazars (the dominant sources in the sky) have been found. The details of the sources were reported in Fermi LAT Fourth Source Catalog (4FGL) [18] and Data Release 2 (4FGL-DR2) [19]. A rich amount of spectral data are available for searching for possible photon-ALP oscillation signals. In this paper, we report a line-like feature found in the spectrum of a blazar, QSO B0516621 (e.g., ref. [20]). Standard radiation processes considered for jets’ emission cannot explain this feature. After our thorough searches for possible explanations, we realized that it can be considered as a photon-ALP oscillation signal. Detailed studies of this case was conducted. In the following section 2, we describe the analysis of the Fermi LAT data to establish detection of the line-like feature. We introduce the photon-ALP oscillation model we used to fit the spectrum of B0516621 and present the fitting results in section 3. In section 4, the results are discussed.
2 -ray data analysis for B0516621
2.1 Fermi LAT data and source model
LAT has been scanning the whole sky at energies from 20 MeV to 300 GeV. We used the data in the energy range of 0.1–300 GeV from 2008 August 4 to 2018 August 4 (10 yrs) in our analysis. The events of Pass 8 ‘SOURCE’ class (evclass=128, evtype=3) within a region of interest (RoI) were selected, which is centered at the target B0516621 (the Fermi LAT counterpart is named as 4FGL J0516.76207). To avoid contamination from the Earth’s limb contamination, we excluded the events with zenith angles . The latest instrument response function (IRF) P8R3_SOURCE_V3 and analysis tool Fermitools 2.0.8 were used.
We constructed a source model using the recently released 4FGL-DR2 [19]. Sources listed in 4FGL-DR2 within the RoI were included in the source model, whose spectral models given in the catalog were used. Spectral parameters of the sources were basically fixed at the catalog values, but for the variable sources or those within 5 degrees away from our target, their normalizations were set free in our analysis. The background Galactic and extragalactic diffuse spectral models (gll_iem_v07.fits and iso_P8R3_SOURCE_V3_v1.txt respectively) were also included in the source model. Their normalizations were set as free parameters.
In the binned likelihood analysis presented in the following sections, energy dispersion was enabled, although without which the spectral distortion is limited to less than 5% in the 1–100 GeV energy range222https://fermi.gsfc.nasa.gov/ssc/data/analysis/documentation/Pass8_edisp_usage.html. The controlling parameter edisp_bins=2 was set for the implementation of the energy dispersion correction. (For comparison, the analysis without energy dispersion enabled gave a slightly higher significance () for the line-like feature we found.)
2.2 Spectral analysis
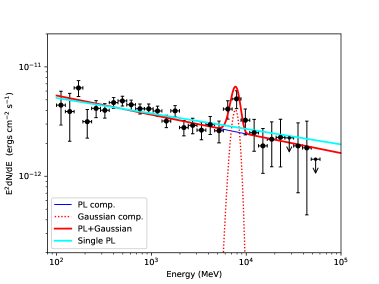
We obtained the spectrum of B0516621 by performing the maximum likelihood analysis of the LAT data in evenly divided energy bins in logarithm. There were few photons above 60 GeV, and we found 30 bins between 0.1–60 GeV allow to show the spectrum relatively well without having many flux upper limits at the high-energy end. The obtained spectrum is shown in Figure 1, and a line-like feature is seen near GeV.
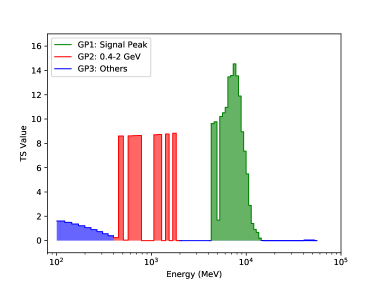
By assuming a power law for the source, where is photon energy and is photon spectral index, the likelihood analysis to the whole data in 0.1–60 GeV resulted in . This power law does not fit the part around 7 GeV in the spectrum. In order to check if the addition of a narrow feature can improve the fit, we added a Gaussian component to the power law, , where and are the peak energy and width of the component. The improvement of having the Gaussian component can be estimated from the test statistic (TS) , where and are the maximum likelihood values modeled with a power law and a power law plus a Gauss, respectively (e.g., ref. [21]). We found TS, which corresponds to 2.50 significance for including the Gaussian component, as the TS value is considered to be distributed as with 3 degrees of freedom. In this fitting, we obtained and GeV (see the left panel of Figure 1).
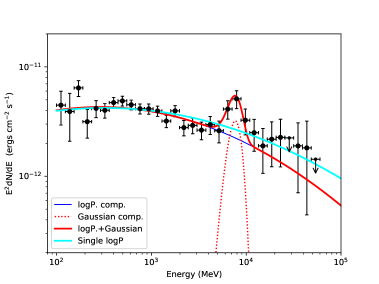
Since more data have been collected with LAT for different sources, it has been found that blazars’ emission may be more generally described with a LogParabola function [22, 23], , where is the spectral slope and describes the curvature of a spectrum. Using this function, we repeated the above analysis but with a LogParabola function. We obtained and . Then adding a Gaussian function, we found TS, which corresponds to 2.97 significance, in which , , GeV, GeV (see the right panel of Figure 1).
We conducted other analyses to check if this line-like feature would be due to uncertainties in the IRF or have an instrumental origin. We obtained the source spectrum using the ‘CLEAN’ event class (evclass=256), which has a 1.3–2 times lower background rate above 3 GeV than the SOURCE event class. The spectrum is nearly the same as that obtained above, with no discernible differences. We also obtained the spectra of the -ray bright and stable pulsars, the Crab, Vela, and Geminga, from the same time period of the data and with the same analysis settings as those in the above analysis for B0516621. Their spectra appear as smooth curves with no similar line-like features seen. From these analyses, we conclude that we have found a line-like feature at GeV in the spectrum of B0516621 and this feature is significant at a level (also see Section 2.4).
2.3 Temporal analysis
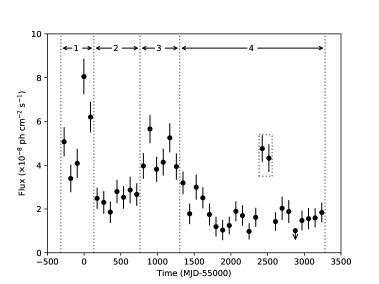
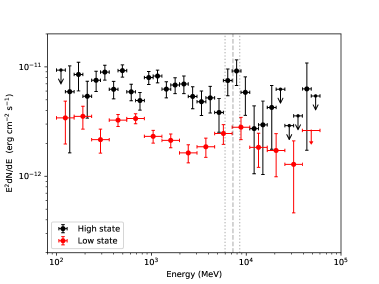
Blazars are highly variable sources, and B0516621 exhibited strong flux variations at -rays as well. In the left panel of Figure 2, a 90-day binned light curve is shown, for which we obtained the fluxes by performing the binned likelihood analysis to the LAT data in each of 90-day time bins. In this analysis, the catalog sources within 5 degrees from the target were set to have free prefactors. Based on the light curve, we approximately divided it into four time periods. We considered that time periods 1 & 3, and plus two data points around MJD 57500 (marked in a dotted box in Figure 2), are in a high state, and the remaining time periods (mainly 2 & 4) are in a low state.
We then obtained spectra from the data in each of the two states, which was for the purpose of checking if the line-like feature was only related to any brightening activity of the source [24] or due to addition of different spectral forms in different states. Note that because the source was not sufficiently bright, we could only obtain decent spectra from such two sets of the data. The spectra are shown in the right panel of Figure 2. For the spectrum in the low state, we only divided the energy range into 15 bins, to maximize the number of spectral data points (i.e., avoid to have too many flux upper limits). The two spectra show main differences in the 1–4 GeV energy range, but at the position of the line-like feature, both have upward data points deviating from a single power law or LogParabola. Given these and the relatively large flux uncertainties, no evidence is seen for the non-presence of the line-like feature in the low state. We tentatively conclude that the feature is present in emission of the source all the time and not due to the addition of different spectral shapes in different states.
2.4 Spectral feature analysis
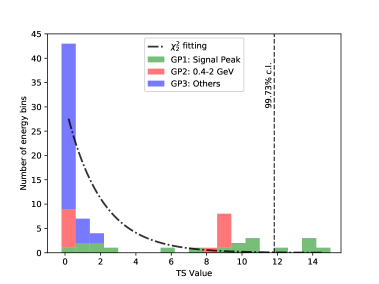
As the spectrum of B0516621 (Figure 1) generally appears to deviate from a smooth curve, for example a possible weak feature also seen at MeV, we further conducted analysis for searching for other possible line-like features. Similar to the above analysis in section 2.2, we used a LogParabola to represent the continuum component and a Gauss to represent a possible line-like feature. The peak energy of the Gauss was moved over the energy range of 0.1–60 GeV, with the moving step being the energy resolution at the energy considered (similar to the sliding energy analysis; e.g., ref. [25]). The energy resolution was set as the 68% containment half width of the reconstructed incoming photon energy. The TS value for having an additional Gaussian component at a given energy compared with a single LogParabola was calculated (cf., section 2.2).
The obtained TS values are shown in the left panel of Figure 3. There are a few TS–9 data points between 0.4–2 GeV, suggesting low-significant (; estimated from a distribution with 2 degrees of freedom) Gaussian features. Then a group of slightly higher TS values are present around 7 GeV, with the maximum value of 14.54 at 7.5 GeV (corresponding to a significance of ). This group of the data points are presumbly caused by the line-like feature. We show the distribution of the TS values in the right panel of Figure 3, and note that a distribution cannot well fit the TS distribution. The possible reason for the poor fit is that nearly half of the data points in 0.4–2 GeV do not have low TS values (e.g., 0–6), in addition to the group of the data points around the line-like feature. The deviation between the two distributions likely indicates the presence of systematic uncertainties in the analyzed data, which would thus reduce the significance of the observed feature.
In any case, this analysis indicates that there are no other similarly significant features in emission of the source, and points to the same energy location where the line-like feature was identified.
3 Photon-ALP oscillation model and spectral fitting
As discussed below in the following section 4, it is hardly to have a mechanism in the generally considered frameworks of the blazar radiation processes (for a recent review focusing on their -ray emission, see, e.g., ref. [26]). Instead, the line-like feature is a possible piece of evidence that indicates photon-ALP oscillations in jets of AGN. We thus conducted detailed study for fitting the spectrum of B0516621 with photon-ALP oscillations included.
We used the photon-ALP oscillation model in blazar jets described in the ref. [27]333https://gammaalps.readthedocs.io/en/latest/. Along a jet launched from a supermassive black hole in the center of a galaxy, its transverse magnetic field and electron density decrease as functions of distance (from the black hole) following , , where is the distance of the emission site of -rays from the black hole. Following ref. [27], we set and .
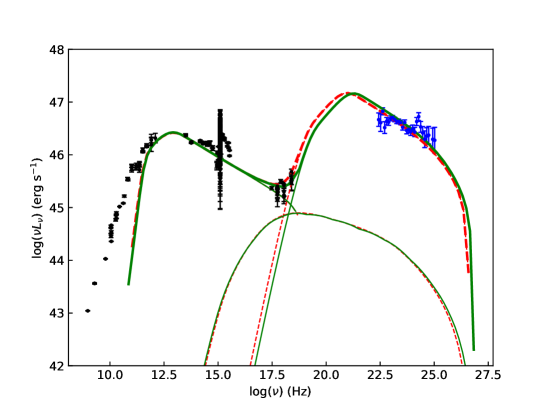
By fitting the broadband spectrum energy distribution (SED) of B0516621 [28] with the typical blazar radiation processes [29] (i.e., synchrotron for radio–optical/X-ray emission and inverse Compton scattering for X-ray–-ray emission), the parameters of G, the Doppler beaming factor , and the size of the emission region cm (radius of a homogeneous sphere) were required (see Figure 4; the redshift ; [20]). We assumed the bulk Lorentz factor and the viewing angle . The distance of the emission site was estimated to be cm (or 0.4 pc; e.g., ref. [30]). For the electron density at , we assumed cm-3 (see, e.g., ref. [14]). The jet ended at 1 kpc from the black hole.
To fit the observed -ray spectrum, we input spectra of a LogParabola form, the presumed intrinsic emission at the -ray emission site. The emission went through the jet and was oscillated due to the photon-ALP coupling. Each output spectrum was compared to the observed -ray spectrum. A test was used to find the best-fit output spectrum. In this fitting process, the magnetic field was fixed, while the spectral parameters (, , and prefactor) of the input spectra were set to have a large range (i.e., treated to be freely varied). The best-fit output spectra were searched in the space of versus .
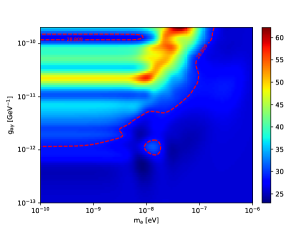
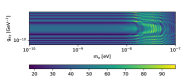
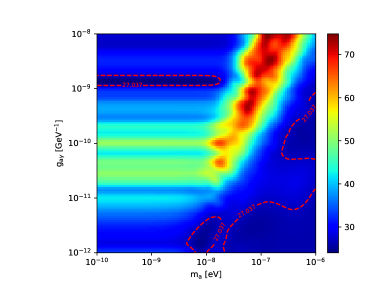
On the basis of previous different searches for ALP signals and their constraints on and (e.g., ref. [31, 32, 16, 33]), we considered a region of eV and GeV-1. A key factor limited the size of this region was the large amount of computing time required. The resulting values for the searched and region are shown in the left panel of Figure 5. The minimum value is 19.6 (26 degrees of freedom), and the 2 confidence areas () are marked with red-dashed curves, helping locate the areas that provide good fits. There are basically two areas: (1) the lower right part and (2) the small narrow part in the range of eV in the upper left corner. However, by checking the model spectra in the areas, we found that in area (1) the model spectra do not contain any line-like structures. The ‘good’ results in the area are because of good fitting to the continuum part of the observed spectrum. We note that if we use a LogParabola function to fit the observed spectrum, the best-fit .
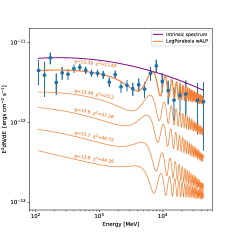
On the other side, model spectra in area (2) generally contain a line-like structure. We thus re-did fitting for the area on much fine grids. The results are shown in the middle panel of Figure 5. The best-fit , and an example of the model spectrum is shown in the right panel of Figure 5. However the good-fit areas are a few narrow lines along a given value. In other words, for a given value, determines the position and shape of the line-like structure around 7 GeV and thus whether a good fit can be provided to the observed spectrum. We show a set of model spectra with eV and a set of step values of in our fitting in Figure 5. As increases, the line-like structure shifts towards the low energy and turns to be comparably broad and shallow, causing the fits to be worse. Therefore even in area (2), there are only a few set of values can provide good fits to the observed spectrum.
As different combinations of the parameters can also provide fits to the SED of B0516621, G is also an acceptable value (Figure 4). For this value, and cm, and thus , , and cm. Setting these parameters, we re-did the spectrum fitting calculations. The results are shown in Figure 6. We found that the distribution results in the versus space have a similar pattern to those when G, but are generally upshifted to larger values. In particular, the area that can provide acceptable fits is shifted to values slightly greater than 10-9 GeV-1.
4 Discussion
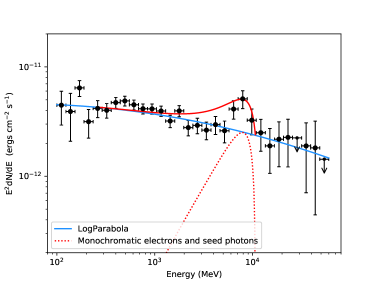
From analysis of 10-year Fermi LAT data, we have found a line-like feature in the -ray spectrum of B0516621. This feature has a significance of 2–3, and likely appears in the source’s emission all the time. Previously, a 4 narrow spectral feature was seen in blazar Markarian 501 at VHE 3 TeV, but only appeared in one of short observations (1.5 hrs) covering a flaring event [24]. Because this TeV feature is relatively wide (FWHM1.4 TeV) and at the high end of the observed spectrum, an extra component arising from electrons of a narrow energy distribution can provide the explanation (see ref. [24] for details). For comparison, the line-like feature of B0516621 is narrower and appears in nearly the middle of a continuum. As a result, we found that even the most extreme case, electrons with a monochromatic energy distribution upper-scattering seed photons with a monochromatic distribution (i.e., the inverse Compton scattering process), would only provide a poor fit to the line-like feature (Figure 7; however, see discussion for the deep Klein-Nishina regime scenario; ref. [34]). Therefore the radiation processes generally considered in the frameworks for blazar high-energy emission can hardly explain the line-like feature.
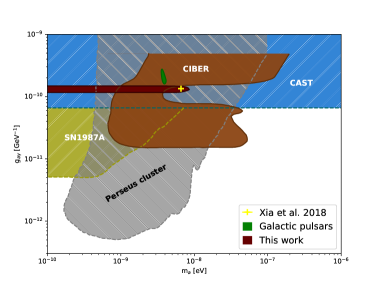
Instead, the line-like feature could be a signal due to photon-ALP oscillations. We investigated this possibility by considering a jet case previously in-detail discussed [33]. Large amount of the calculations were conducted to search in the versus parameter space that could give rise to a line-like feature at 7 GeV. We found that in order to be able to fit the line-like feature as well as the continuum of the observed -ray spectrum, a small region of eV and GeV-1 is preferred when G. If considering a larger (=1 G), the region is shifted to even higher values, greater than GeV-1. The regions are in tension with constraints (Figure 8) obtained from other methods or experiments, in particular the CERN Axion Solar Telescope (CAST; ref. [31]). However on the other hand, we note that the region we found with G partly overlaps with that derived from the CIBER experiment (Figure 8; ref. [35]). Also, it is interesting to note that our results are close to a couple of other preferred and ranges from studies of fine structures of the Fermi LAT spectra, those of the bright supernova remnants [36] and pulsars [6]. The latter studies investigated photon-ALP oscillations in the Galactic magnetic field.
In any case, our studies of the -ray spectrum of the blazar B0516621 present another intriguing possibility for detecting ALP signals. It would be worth finding similar features, thus allowing us to determine how common or rare such features would appear. Once other cases are found, the same studies could be conducted, which helps identify reliable constraints on and . Based on our studies, we note that the spectral resolution and sensitivity of LAT limit the searches for similar features; sources need to be sufficiently bright (for which we may take B0516621 as a standard) in order to have a high-quality spectrum showing identifiable features. In this respect, this B0516621 case points a direction of effort for future high-energy facilities that would have high sensitivities and spectral resolutions for searching for similar features and thus establishing more confident cases for detection of ALP signals.
Acknowledgments
We thank anonymous referee for helpful suggestions and M. Meyer for helping with the photon-ALP conversion code setting. This research made use of the High Performance Computing Resource in the Core Facility for Advanced Research Computing at Shanghai Astronomical Observatory. This research was supported by the National Program on Key Research and Development Project (Grant No. 2016YFA0400804) and the National Natural Science Foundation of China (11633007, 11890692, U1931114, U1531130, U1831138). Z.W. acknowledges the support by the Original Innovation Program of the Chinese Academy of Sciences (E085021002).
References
- [1] J. Jaeckel and A. Ringwald, The Low-Energy Frontier of Particle Physics, Annual Review of Nuclear and Particle Science 60 (2010) 405 [1002.0329].
- [2] A. Ringwald, Exploring the role of axions and other WISPs in the dark universe, Physics of the Dark Universe 1 (2012) 116 [1210.5081].
- [3] P. Sikivie, Experimental Tests of the “Invisible” Axion, Phys. Rev. Lett. 51 (1983) 1415.
- [4] G. Raffelt and L. Stodolsky, Mixing of the photon with low-mass particles, Phys. Rev. D 37 (1988) 1237.
- [5] S. Mohanty and S. N. Nayak, Determination of pseudo-Goldstone-boson-photon coupling by the differential time delay of pulsar signals, Phys. Rev. Lett. 70 (1993) 4038 [hep-ph/9303310].
- [6] J. Majumdar, F. Calore and D. Horns, Search for gamma-ray spectral modulations in Galactic pulsars, JCAP 2018 (2018) 048 [1801.08813].
- [7] A. Payez, C. Evoli, T. Fischer, M. Giannotti, A. Mirizzi and A. Ringwald, Revisiting the SN1987A gamma-ray limit on ultralight axion-like particles, JCAP 2015 (2015) 006 [1410.3747].
- [8] D. Hooper and P. D. Serpico, Detecting Axionlike Particles with Gamma Ray Telescopes, Phys. Rev. Lett. 99 (2007) 231102 [0706.3203].
- [9] K. A. Hochmuth and G. Sigl, Effects of axion-photon mixing on gamma-ray spectra from magnetized astrophysical sources, Phys. Rev. D 76 (2007) 123011 [0708.1144].
- [10] A. de Angelis, M. Roncadelli and O. Mansutti, Evidence for a new light spin-zero boson from cosmological gamma-ray propagation?, Phys. Rev. D 76 (2007) 121301 [0707.4312].
- [11] A. de Angelis, G. Galanti and M. Roncadelli, Relevance of axionlike particles for very-high-energy astrophysics, Phys. Rev. D 84 (2011) 105030 [1106.1132].
- [12] D. Horns, L. Maccione, M. Meyer, A. Mirizzi, D. Montanino and M. Roncadelli, Hardening of TeV gamma spectrum of active galactic nuclei in galaxy clusters by conversions of photons into axionlike particles, Phys. Rev. D 86 (2012) 075024 [1207.0776].
- [13] A. de Angelis, O. Mansutti and M. Roncadelli, Axion-like particles, cosmic magnetic fields and gamma-ray astrophysics, Physics Letters B 659 (2008) 847 [0707.2695].
- [14] F. Tavecchio, M. Roncadelli and G. Galanti, Photons to axion-like particles conversion in Active Galactic Nuclei, Physics Letters B 744 (2015) 375 [1406.2303].
- [15] O. Mena and S. Razzaque, Hints of an axion-like particle mixing in the GeV gamma-ray blazar data?, JCAP 2013 (2013) 023 [1306.5865].
- [16] M. Ajello, A. Albert, B. Anderson, L. Baldini, G. Barbiellini, D. Bastieri et al., Search for Spectral Irregularities due to Photon-Axionlike-Particle Oscillations with the Fermi Large Area Telescope, Phys. Rev. Lett. 116 (2016) 161101 [1603.06978].
- [17] D. Malyshev, A. Neronov, D. Semikoz, A. Santangelo and J. Jochum, Improved limit on axion-like particles from gamma-ray data on Perseus cluster, arXiv e-prints (2018) arXiv:1805.04388 [1805.04388].
- [18] S. Abdollahi, F. Acero, M. Ackermann, M. Ajello, W. B. Atwood, M. Axelsson et al., Fermi Large Area Telescope Fourth Source Catalog, ApJS 247 (2020) 33 [1902.10045].
- [19] J. Ballet, T. H. Burnett, S. W. Digel and B. Lott, Fermi Large Area Telescope Fourth Source Catalog Data Release 2, arXiv e-prints (2020) arXiv:2005.11208 [2005.11208].
- [20] M. S. Shaw, R. W. Romani, G. Cotter, S. E. Healey, P. F. Michelson, A. C. S. Readhead et al., Spectroscopy of Broad-line Blazars from 1LAC, ApJ 748 (2012) 49 [1201.0999].
- [21] P. L. Nolan, A. A. Abdo, M. Ackermann, M. Ajello, A. Allafort, E. Antolini et al., Fermi Large Area Telescope Second Source Catalog, ApJS 199 (2012) 31 [1108.1435].
- [22] L. Chen, Curvature of the Spectral Energy Distributions of Blazars, ApJ 788 (2014) 179 [1405.1140].
- [23] M. Ajello, R. Angioni, M. Axelsson, J. Ballet, G. Barbiellini, D. Bastieri et al., The Fourth Catalog of Active Galactic Nuclei Detected by the Fermi Large Area Telescope, ApJ 892 (2020) 105 [1905.10771].
- [24] MAGIC Collaboration, V. A. Acciari, S. Ansoldi, L. A. Antonelli, A. Babić, B. Banerjee et al., Study of the variable broadband emission of Markarian 501 during the most extreme Swift X-ray activity, A&A 637 (2020) A86 [2001.07729].
- [25] T. Bringmann, F. Calore, G. Vertongen, C. Weniger, Relevance of sharp gamma-ray features for indirect dark matter searches, Phys. Rev. D 84 (2011) 103525 [1106.1874].
- [26] G. G. Madejski and M. Sikora, Gamma-Ray Observations of Active Galactic Nuclei, Annual Review of Astronomy and Astrophysics 54 (2016) 725.
- [27] M. Meyer, D. Montanino and J. Conrad, On detecting oscillations of gamma rays into axion-like particles in turbulent and coherent magnetic fields, JCAP 2014 (2014) 003 [1406.5972].
- [28] A. A. Abdo, M. Ackermann, I. Agudo, M. Ajello, H. D. Aller, M. F. Aller et al., The Spectral Energy Distribution of Fermi Bright Blazars, ApJ 716 (2010) 30 [0912.2040].
- [29] L. Chen, On the Jet Properties of -Ray-loud Active Galactic Nuclei, ApJS 235 (2018) 39 [1803.05715].
- [30] L. Chen and B. Zhang, Analytical Solution of Magnetically Dominated Astrophysical Jets and Winds: Jet Launching, Acceleration, and Collimation, ApJ 906 (2021) 105 [2010.14470].
- [31] V. Anastassopoulos, S. Aune, K. Barth, A. Belov, H. Bräuninger, G. Cantatore et al., New CAST limit on the axion-photon interaction, Nature Physics 13 (2017) 584 [1705.02290].
- [32] M. C. D. Marsh, H. R. Russell, A. C. Fabian, B. R. McNamara, P. Nulsen and C. S. Reynolds, A new bound on axion-like particles, JCAP 2017 (2017) 036 [1703.07354].
- [33] J. Davies, M. Meyer and G. Cotter, Relevance of jet magnetic field structure for blazar axionlike particle searches, Phys. Rev. D 103 (2021) 023008 [2011.08123].
- [34] F. Aharonian, D. Khangulyan and D. Malyshev, Cold ultrarelativistic pulsar winds as potential sources of galactic gamma-ray lines above 100 GeV,[A&A 547 (2012) A114 [1207.04589].
- [35] K. Kohri and H. Kodama, Axion-like particles and recent observations of the cosmic infrared background radiation, Phys. Rev. D 96 (2017) 051701 [1704.05189].
- [36] Z.-Q. Xia, C. Zhang, Y.-F. Liang, L. Feng, Q. Yuan, Y.-Z. Fan et al., Searching for spectral oscillations due to photon-axionlike particle conversion using the Fermi-LAT observations of bright supernova remnants, Phys. Rev. D 97 (2018) 063003 [1801.01646].