Electropolishing of single crystal and polycrystalline aluminum to achieve high optical and mechanical surfaces
Abstract
Electropolishing has found wide application as the final surface treatment of metal products in mechanical engineering and instrumentation, medicine and reflective concentrators for PV cells. It was found that electropolishing (EP) not only reduces the surface roughness and changes its appearance, but improves many operational characteristics as well, such as corrosion resistance, endurance, tensile strength, and many others, and also changes the physicochemical properties, for example, reflectivity, electromagnetic permeability and electronic emission of some ferro-magnetic metals. This fact greatly expands the possibility of using this method in various fields of science and technology. This work is part of a study, examining electro polishing for reducing the crystalline defects adjacent to the surface, thus improving its physical properties, contributing to higher optical efficiency, when used in PV generation and storage devices. Five compositions were examined using different temperature and current density parameters. The polished samples were evaluated using reflectance spectrometry. The solution which was composed of Phosphoric acid - 85%, Acetic acid - 10%, Nitric acid - 5% was found to provide the best results. Another result obtained was that reflectance increased as the current density increased up to 25 A/dm2. Further increasing the current density resulted in deterioration of the surface and reduced reflectance. It was shown that careful lapping and polishing followed by electropolishing using the suggested solution may consist of an adequate treatment for preparing reflective concentrators for PV cells.
Ariel University, Science Park, Ariel 40700, Israel
Keywords: Electropolishing, Single crystal, Aluminum single crystal, Reflectace spectroscopy.
Introduction
Electropolishing (EP) is a process of leveling a metal surface by anodic dissolution and is used to improve the surface quality of metals in addition to mechanical grinding and polishing. EP is a specific type of electrolysis that involves a direct electric current passing through an electrolyte in an electrolytic cell [1, 2]. During machining (cutting, grinding) of a metal, the material structure adjacent to the surface is deformed. In this layer there is a distortion of the crystal structure, concentration of stresses, inclusion of foreign materials, defects, which adversely affect the properties of the material. In thin samples, where the damaged layers contribute more to the physical properties of the material compared to the undamaged volume, the effect is pronounced. It is impossible to eliminate this layer mechanically. Etching is also not acceptable, since it is accompanied by uneven dissolution of the metal and often leads to its hydrogenation. EP is the most effective way to remove the thickness-regulated damaged metal layer and the formation of a new surface layer, devoid of these disadvantages. EP has a number of advantages compared to mechanical polishing: short process times, low-cost equipment and consumables, versatility, and the ability to machine small parts and parts of complex shapes. EP has worked well for soft metals such as aluminum [3]. In addition to a well-polished surface, it enhances the materials characteristics - increases endurance, long-term strength, fatigue resistance, elastic limit, electromagnetic properties, corrosion resistance and reduced friction coefficient [4, 5, 6, 7]. The study of the optical characteristics of soft metal samples puts forward stringent requirements for the preparation of their surface. EP has been demonstrated to be the preferred and successful method to obtain the required optical surface [8, 9]. Successful removal of the damaged surface layer is associated with improvement of the optical, electromagnetic, and some other physical properties of the material. The classical theories of the EP process is based on the forming of a viscous liquid layer. In the process of EP, the transition of a metal into a solution occurs under conditions of partial passivity, which is associated with the formation of a viscous liquid layer at the liquid-metal interface which results from the reaction between the metal and the electrolyte. This high resistance layer provides non uniform resistance paths with the ridges created during the mechanical preparation providing lower resistance resulting in higher currents through them. The higher currents lead to faster dissolution of the ridges and smoothing of rough surface, which gradually acquires a wavy relief. Hryniewicz [10] extending Hoar’s work [11] concludes that the oxide film created on the anode surface supplemented by oxygen introduced by water decomposition is the only factor in the electropolishing process. According to this model the metal is dissolved by tunneling the metal ions via dislocation sites and vacancies of the oxide. As the thickness of the oxide on the ridges is lower, they dissolve faster. The effect is a decrease in scattered light and an increase in specular reflection of light, which manifests itself in the appearance of a shine on the metal surface. The electropolishing method is used to prepare samples for studying the microstructure of metals by electron microscopy [12] and transmission electron microscopy [12, 13]. Revealing grain boundaries on high-purity aluminum is a challenging at times only to be solved using the EP method. In practice, the use of this method requires adjusting process parameters depending on the electrolyte, material, and taking into account the size and shape of the sample. The EP process parameters that need to be adjusted include: current density, temperature, time, electrolyte composition and such additional factors as the method of fastening parts, the material of the cathode and suspension, the method of isolating the suspension device, the geometric shape and ratio of the anode and cathode area, and much more, therefore, for solving a specific research problem, it is necessary to conduct a series of experiments finding the optimal process parameters. In this study we have examined the process for removing the damaged layer, analyzing the surface layer damage using x-ray and specular reflection.
Experimental procedures
1 Materials and methods
Tests were conducted on four types of samples available from different sources. The first type with dimensions of 30x10x0.3 mm was obtained from aluminum tape with a minimum purity of 99.99%. The second and third samples consisted of commercially available aluminum for sputtering targets with a minimum purity of 99.99%, the second with dimensions of 10 × 12 mm and a thickness of 2 mm, the third with 20 x 10 mm and a thickness of 3 mm. Samples were prepared using electrical discharge machining. The fourth sample was cut from a single crystal of aluminum grown in our laboratory, prepared as a 3 mm thick disk. Sample dimensions were of no significance and were based on available material or comfort. In a non traditional manner, samples no. 1 and 4 were cut using a 0.3 mm thick diamond cut-off wheel. The first sample was not lapped since it was manufactured with semi optical surfaces. Random scratches were present on its surfaces. The second and third samples were ground and lapped using abrasive paper according to the following protocol: #600, #1000, #1200, # 2500, #4000 grits, on a polishing/lapping machine. We followed four cleaning protocols depending on the fabrication stage and the state of the sample. Using the first protocol, samples were cleaned by immersing the sample into acetone for 3 minutes in order to degrease it. This was followed by washing the sample in distilled water and drying it using warm air. If deeper cleaning was needed, the second protocol consisted of the samples immersed for 10 minutes in a 10% solution of acetone and water in an ultrasonic cleaner, after which they were washed with running water, followed by washing the samples in ethanol and distilled water. The process was completed by drying the samples with warm air. The third protocol was reserved for samples after the EP process. Samples were washed in ethanol, followed by distilled water, and dried in warm air. For film removal we developed a fourth protocol in which the sample was immersed in a 10% solution of nitric acid, followed by washing in cold running water, then drying in warm dry air. The schematic of the electropolishing cell is shown in Figure 2. The anode is a sample of aluminum, and plates of various materials (lead, graphite, stainless steel) were used as a cathode. The cathode and anode were immersed in a container with electrolyte; the container was placed on a heating plate with a magnetic stirrer. The electrolyte temperature was measured using a mercury thermometer. Voltage was applied to the electrodes using a high current regulated power supply.
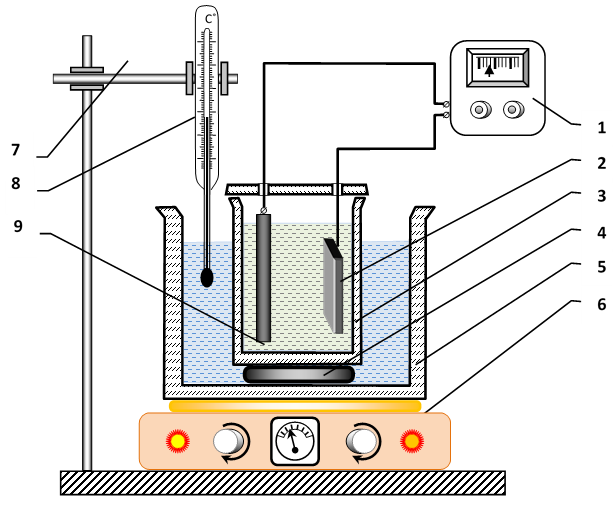 Figure 1: Schematic of the experimental setup:
1. Power supply; 2. Anode (Aluminum sample); 3. Electrolytic bath;
4. Ceramic stand; 5. Water tank; 6. Magnetic plate; 7. Tripod; 8.
Thermometer; 9. Cathode.
Results and discussion
Figure 1: Schematic of the experimental setup:
1. Power supply; 2. Anode (Aluminum sample); 3. Electrolytic bath;
4. Ceramic stand; 5. Water tank; 6. Magnetic plate; 7. Tripod; 8.
Thermometer; 9. Cathode.
Results and discussion
1 Electrolyte compositions
Various electrolytes were used for EP of aluminum. They can be divided into alkaline and acidic groups.
Alkaline electrolytes
From the alkaline group, we chose electrolytes with low toxicity - compositions A and B in Table 1. The first type of samples were cleaned according to the first protocol, while the other samples were cleaned more thoroughly using the second protocol. The cathode consisted of a 12x30x3 mm graphite plate. The main parameters of the processes are shown in Table 2.
Some experiment failures were: 1 - points of erosion, deep etching at point locations; 2 – An uneven surface finish was obtained. Preferred etching at the contacts with the sample; 3 – significant hydrogen generation at the cathode; 4 - the sample reacts to the electrolyte, process begins before the voltage is turned on. Some reasons for the failures are as follows: incorrectly selected electrical parameters, incorrect estimates of the cathode and anode areas and / or the distance between them, an unclean surface, poor electrical contact between the part and the sample holder. Following the above described failures, the samples were cleaned according to the second deep cleaning protocol, the design of the sample holder and electrical contact was improved, the cathode area was increased, and an optimal current density was selected from the volt-ampere curves for each process.
| Electrolyte composition | Temperature | Current Density range, | Voltage range, | Time, | ||
| A | Sodium Phosphate 5-10% | |||||
| Soda ash 15-30% | 85-90 | 3-6 | 4-10 | 1-5 | ||
| Water-60-80% | ||||||
| B | Sodium phosphate - 320-350 g/l | |||||
| Sodium carbonate - 230-250 g/l | 80-85 | 2-6 | 5-20 | 10-20 | ||
| Water - 450- 400 g/l |
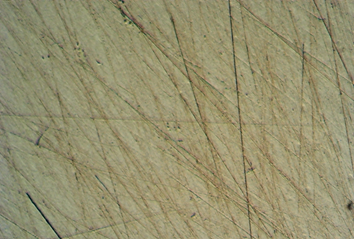
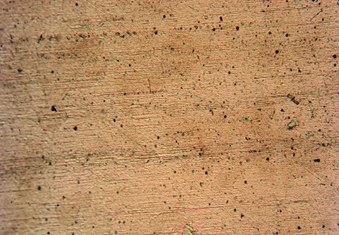
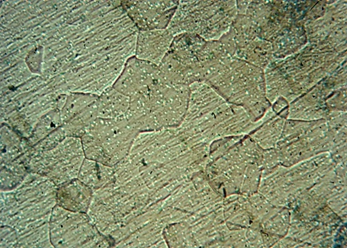
Subject to the above conditions, we received a satisfactory result: defects and scratches left after lapping were removed. Figure 3 illustrates the microstructure of the aluminum surface before EP (Fig.3a) and after (Fig.3b) at x100 magnification. The polishing quality of samples from pure aluminum and single crystals is higher than that of aluminum alloy. The advantages of this method are simplicity, speed and low toxicity. The disadvantages include insufficient improvement of the surface quality, very high process speed complicating its control.
| a | b | |
 |
 |
Acidic electrolytes
Acidic electrolytes are used more often in world practice than alkaline ones. Their advantages include: obtaining better reflective surface properties, increased ability to smooth the microrelief and increase roughness by 2-3 grades, the possibility of increasing the efficiency of the process due to the introduction of inhibitors and other additives. The disadvantage of these electrolytes is the high toxicity of the reagents. For aluminum and its alloys, electrolytes based on phosphoric, sulfuric and chromic acids or with chromium anhydride instead of chromic acid are widely used, as well as electrolytes from a mixture of phosphoric acid with nitric, acetic or sulfuric acid. The ratio of their components (mass fraction) fluctuates over a fairly wide range. In experiments, the influence of various proportions of components on the quality of electro-polishing was investigated. The compositions of the studied acidic electrolytes and the parameters of the processes are shown in Table 2. For example, a mixture of phosphoric and sulfuric acids with their maximum concentration of compositions (C and E) leads to the appearance of a dull film consisting of phosphate salts. This film disappears when the concentration of chromic anhydride increases from 1% (electrolyte E) and nitric acid from 5% (composition C). An increase in the chromic anhydride content is accompanied by an increase in the gloss of the metal surface. An increase in chromic anhydride above 11% leads to surface etching. The optimum sulfuric acid content is 26-30%. In each group of electrolytes, the optimal ratio of components and process parameters were determined. They are shown in Table 2.
| Electrolyte composition | Temperature | Current Density range, | Voltage range, | Time, | |
| C | Phosphoric acid - | ||||
| Sulfuric acid - | 100-115 | 30 | 10-30 | 1-2 | |
| Nitric acid - | |||||
| D | Phosphoric acid - | ||||
| Acetic acid - | 100 | 30 | 10-30 | 0.5-1 | |
| Nitric acid - | |||||
| E | Phosphoric acid - | ||||
| Sulfuric acid - | 60-90 | 20-50 | 12-18 | 2-8 | |
| Chromic anhydride - | |||||
| Water - |
2 Processing parameters
Current density
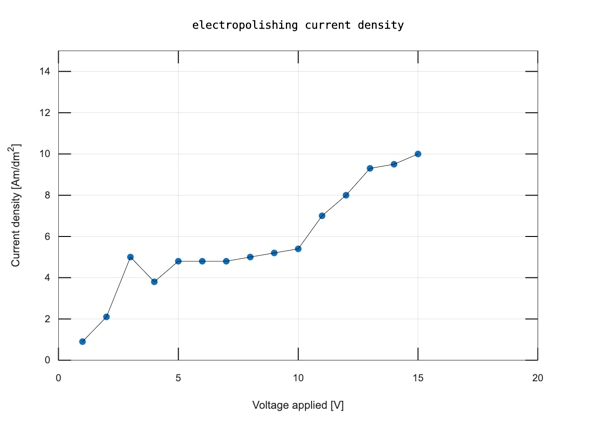
For each one of the electrolytes, the current-voltage relations were measured. An example of such a curve is illustrated in Figure 4. Both alkaline and acids display curves which are similar in form. The horizontal section of the curve between 4 and 10 volts corresponds to the process of stabilization of the passivating layer and diffusion of anions through the passive layer, that is, in this interval, the polishing process takes place.
Temperature
Different authors recommend different optimal temperatures for the same electrolyte compositions [14, 15]. To find out the influence of the temperature factor, samples of the third type were processed in electrolyte A in the temperature range 80–100°C in increments of 5°C; other process parameters were the same. The quality of processing was evaluated visually by the presence of gloss and a comparison of changes in surface topography (the presence of scratches, and pits) using a microscope at a magnification of x100 times. The amount of metal removed was evaluated by weighing the sample on an analytical balance. There is a noticeable increase in surface gloss with the increase of temperature up to 95°C, increasing it to 100°C a decrease in brightness is observed. At the same time the temperature increase in the above range does not have a noticeable effect on the metal removal rate or surface relief. To reduce the generation of hydrogen on the cathode surface, its surface was tripled.
Mixing speed of the solution
To uniformly heat the electrolyte and improve the separation of gas bubbles from the surfaces of the electrodes, we applied forced convection using a magnetic stirrer. The processes was carried out without stirring, with a low speed, medium, high and maximum. Acceptable results were obtained when the rotational velocity of the 5 cm magnet was in the range of 120 to approximately 250 rpm. Without mixing and with a low mixing speed of the electrolyte, an increase in the number of dot patterns on the surface is observed. This can be explained by the fact that the diffusion of matter from the surface of the anode is difficult and the electrolyte near the sample overheats. A very high speed leads to displacement of the sample relative to the cathode and to the deterioration of the contact of the sample holder and the sample.
The ratio of the surface areas of the anode and cathode and other additional process characteristics
EP was carried out with different volumes of electrolyte, with cathodes of various materials (stainless steel, lead, graphite), and with different ratios of the areas of the cathode and anode (1: 1; 2: 1; 5: 1). The best results were obtained by keeping the ratio of the cathode to the anode at 5: 1, with graphite or lead as the cathode material. Furthermore, the solution volume should be at least 300 ml for parts with a surface area of up to 1 and 400 ml for parts with a surface area of 6 , the distance between the anode to the cathode should be at least 5 cm, and from the sample to the walls and the bottom of the bath should be at least 3.5 cm.
[ph] Elyctrolyte Sample type Current density range, Voltage range, V Temperature, Time, Cathode / anode (ratio) Mixing speed RPM Examples A 1 5 10 80 0.5 1:1 0 Sample 1,2: Sodium Phosphate - 10g Soda ash - 22,5g, Water -100ml 2 10 85 1 1:2 50 Temperature - Time 2min; Current density range - 5; 3 20 90 2 1:5 100 Voltage - 6-9V; Mixing speed - 2-3 95 3 150 Sample 3: Temperature - ; Time - 1 min; Current density range 4 200 , other parameters are the same B 1 5 10-30 80 5 1:2 100 Sample 1: Sodium Phosphate - 350 g/l Sodium carbonate - 250 g/l, Water 400 g/l. 3 10 85 10 1:5 150 Temperature - , Time 5 min, Current density range Voltage -6-9V 30 15 200 mixing speed 2-3. Sample 3: Temperature - Time - 8 min, Current density range - 15 , all the other parameters are as stated above C 1 25 90 1 1:2 100 Electrolyte: Phosphoric acid 50%, Sulfuric acid - 40%, Nitric acid - 10% 2 30 100 2 1:5 150 Temperature - , Time 2 min, Current density range - , 3 115 3 200 Voltage - 12-15 V, Mixing speed - 4 4 Sample 3: Time - 1 min, all the other parameters are as stated above D 1 25 90 05 1:2 100 Electrolyte: Phosphoric acid - 85%, Acetic acid - 10%, Nitric acid - 5%, 2 30 95 1 1:5 150 Temperature - 100%, Time - 2 min, Current density range - , 3 35 100 2 200 Voltage - 12-15V, Mixing speed - 4 40 E 1 20 12-15 60 2 1:5 100 Electrolyte: Phosphoric acid 45%, Sulfuric acid - 35%, Chromic anhydride - 5% 30 70 4 150 water - 15% Temperature - , Time 3 min, 40 80 6 200 Current density range - , Voltage - 12-15 V, Mixing speed - 4 50 90 8 250
Parameters of the electropolishing process
3 Electrochemical etching
Our studies have shown the possibility of developing electrolytes in which it is possible to conduct simultaneous electropolishing and electro-etching of aluminum to produce a thin oxide layer on it. The thickness of this layer is minimal, which is necessary to achieve surface gloss (high reflectivity), but at the same time sufficient to obtain adsorption staining. The basis of such an electrolyte is a mixture of sulfuric, phosphoric and acetic acids. For aluminum with a high degree of frequency, good results are obtained in an aqueous solution of sodium orthophosphate and sodium carbonate (Figure 5).
| a | b | |
 |
 |
results
As one of the primary goals in the current work is reflective concentrators for PV, it is natural to examine the reflectance in the UV-VIS-IR range. The measurement system consisted of a reflectance spectrometer with Deuterium and Tungsten Halogen lamps as sources. Calibration was conducted using a gold calibration standard thus limiting the spectral range of the measurement to 600-1600nm. Its strength is the standards inertness and stability compared to aluminum or silver standards resulting in improved measurement repeatability. Figure 6 Compares the reflectance of the various compositions in the tested range. From the figure it is apparent that in this research, composition D was superior to the other compositions. The chosen current density and temperature were found to be optimal in most cases.
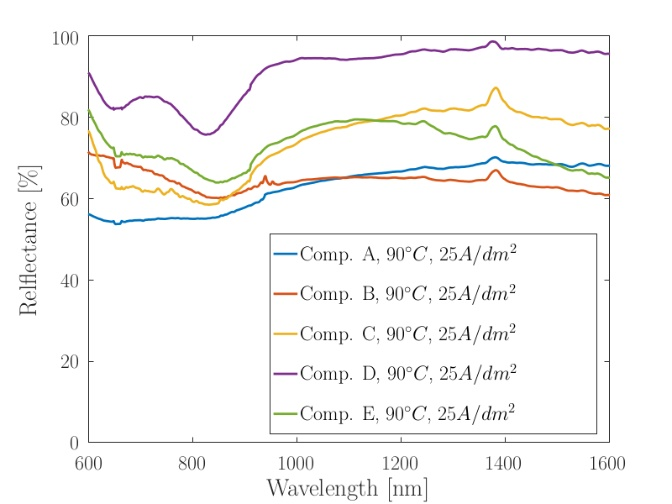
Figure 7 Illustrates reflectance measurements of polished crystal samples at several current densities.
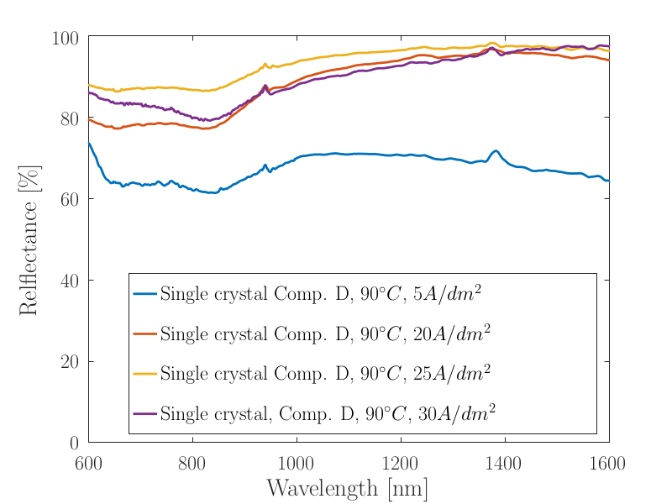
It can be seen from the plots that best results were obtained at . Increasing the current from up to displays an increase in reflectance in the formentioned spectral range. Increasing the current density above displays reduced reflectance and visual deterioration of the surface. Adelkhani et al. [16] reached similar conclusions though demonstrated lower reflectance at the lower and higher currents. The difference probably stems from the preliminary processing, i.e. multi stage mechanical lapping and polishing.
Conclusions
-
•
Electropolishing of aluminum is effective for obtaining a high quality surface and eliminating machining defects. The best result of electropolishing of an aluminum surface in terms of its quality, as well as the duration and complexity of the process is provided by a combination of preliminary mechanical grinding and polishing followed by EP in an acid electrolyte composition: Phosphoric acid - 85%, Acetic acid - 10%, Nitric acid - 5% (mode D)
-
•
We managed to obtain a polished surface of good quality due to the correct choice of all factors affecting the EP process, such as pretreatment of the metal surface, orientation of the workpiece in the electrolyzer, choice of cathode material, distance between electrodes, process time, solution circulation rate, anode area ratio, and cathode, bath age. This was confirmed using spectral reflectance analysis.
-
•
The tested electrolytes, especially acidic ones, have a narrow range of current density, at which the polishing process takes place. This limits the ability to control the process: removal of material to a given depth and obtaining specified roughness parameters.
-
•
The uniformity of surface treatment is strongly influenced by the design and material of the suspension, the ratio of the anode to cathode surface areas and the location of the sample in the cell. In our experiments, the optimal suspension material is aluminum and the anode-to-cathode area ratio is 1: 5.
-
•
The use of electrochemical etching to determine the structure of pure aluminum gives good results. This is an effective and simple method, since the process is carried out in the same electrolyzer and with the same electrolytes as the EP. For high purity aluminum, good results are obtained in an aqueous solution of sodium orthophosphate and sodium carbonate.
This work was conducted as part of a larger project trying to improve the aluminum surfaces physical properties in storage devices. As this article is limited in scope, in a following article we will demonstrate the improved results obtained in aluminum single crystals prior and after being processed using the various EP methods discussed in this article. As shall be demonstrated in future articles, X-ray analysis indicates that there is a considerable improvement after treating the surface using the above methods.
References
- [1] D Landolt. Fundamental aspects of electropolishing. Electrochimica Acta, 32(1):1–11, 1987.
- [2] Wei Han and Fengzhou Fang. Fundamental aspects and recent developments in electropolishing. International Journal of Machine Tools and Manufacture, 139:1–23, 2019.
- [3] George F Vander Voort. Metallography, principles and practice. ASM international, 1999.
- [4] M Inman, EJ Taylor, A Lozano-Morales, and L Zardiackas. Electropolishing and throughmask electroetching of nitinol stents and other materials in an aqueous electrolyte. In Medical Device Materials VI: Proceedings from the Materials and Processes for Medical Devices Conference:(MPMD 2011), page 31. ASM International, 2013.
- [5] Carl Wagner. Contribution to the theory of electropolishing. Journal of the electrochemical society, 101(5):225, 1954.
- [6] M Datta and D Landolt. Fundamental aspects and applications of electrochemical microfabrication. Electrochimica acta, 45(15-16):2535–2558, 2000.
- [7] Boniface Mutua Muthoka, Alex Awuor Ogacho, Benard Odhiambo Aduda, Charles Opiyo Ayieko, Robinson Juma Musembi, and Pushpendra K Jain. Controlled texturing of aluminum sheet for solar energy applications. 2015.
- [8] AI Golovashkin, IE Leksina, GP Motulevich, and AA Shubin. Optical properties of niobium. SOV PHYS JETP, 29(1):27–34, 1969.
- [9] Katie Shanks, Sundaram Senthilarasu, and Tapas K Mallick. Optics for concentrating photovoltaics: Trends, limits and opportunities for materials and design. Renewable and Sustainable Energy Reviews, 60:394–407, 2016.
- [10] Ryszard Rokicki and Tadeusz Hryniewicz. Enhanced oxidation–dissolution theory of electropolishing. Transactions of the IMF, 90(4):188–196, 2012.
- [11] TP Hoar and JAS Mowat. The electropolishing of nickel in urea-ammonium chloride melts. Transactions of the IMF, 26(1):7–25, 1950.
- [12] Charles E Lyman, Dale E Newbury, Joseph Goldstein, David B Williams, Alton D Romig Jr, John Armstrong, Patrick Echlin, Charles Fiori, David C Joy, Eric Lifshin, et al. Scanning electron microscopy, X-ray microanalysis, and analytical electron microscopy: a laboratory workbook. Springer Science & Business Media, 2012.
- [13] Jeanne Ayache, Luc Beaunier, Jacqueline Boumendil, Gabrielle Ehret, and Danièle Laub. Sample preparation handbook for transmission electron microscopy: techniques, volume 2. Springer Science & Business Media, 2010.
- [14] Heather M Tomlinson. An electro-polishing technique for the preparation of metal specimens for transmission electron microscopy. Philosophical Magazine, 3(32):867–871, 1958.
- [15] G Yang, B Wang, K Tawfiq, H Wei, S Zhou, and G Chen. Electropolishing of surfaces: theory and applications. Surface Engineering, 33(2):149–166, 2017.