Limits on the presence of planets in systems with debris disks: HD 92945 and HD 107146
Abstract
Recent observations of resolved cold debris disks at tens of au have revealed that gaps could be a common feature in these Kuiper belt analogues. Such gaps could be evidence for the presence of planets within the gaps or closer-in near the edges of the disk. We present SPHERE observations of HD 92945 and HD 107146, two systems with detected gaps. We constrained the mass of possible companions responsible for the gap to 1-2 MJup for planets located inside the gap and to less than 5 MJup for separations down to 20 au from the host star. These limits allow us to exclude some of the possible configurations of the planetary systems proposed to explain the shape of the disks around these two stars. In order to put tighter limits on the mass at very short separations from the star, where direct imaging data are less effective, we also combined our data with astrometric measurements from Hipparcos and Gaia and radial velocity measurements. We were able to limit the separation and the mass of the companion potentially responsible for the proper motion anomaly of HD 107146 to values of 2-7 au and 2-5 MJup, respectively.
keywords:
Instrumentation: spectrographs - Methods: data analysis - Techniques: imaging spectroscopy - Stars: planetary systems,1 Introduction
Protoplanetary disks around young (few Myr) stars are nowadays considered the formation environments for planetary systems (Chen et al. 2012; Marshall et al. 2014). In recent years, a growing number of structures, like e.g. rings, gaps and asymmetries, have been identified into these disks (e.g. ALMA Partnership et al. 2015; van Boekel et al. 2017; Fedele et al. 2018; Pinilla et al. 2018; Isella et al. 2018). While different mechanisms have been proposed to explain these structures, one of the most promising is the one implying the presence of planetary mass objects still in their formation process. However, at the moment, the detection of planets associated to these structures has been confirmed for just a handful of cases. The most striking of these detections is certainly the PDS 70 system, in which two planetary companions have been detected through direct imaging in the gap of the disk (Keppler et al. 2018; Müller et al. 2018; Haffert et al. 2019; Mesa et al. 2019b).
At older ages (from tens to hundreds Myr), debris disks are expected to have lost a large part of their gaseous component, while their dust component is continuously replenished by collisions of small bodies orbiting within Kuiper belt analogues. The presence of planets can shape these disks as demonstrated by well known cases like Pic (Lagrange et al. 2009), HR 8799 (Marois et al. 2008; Marois et al. 2010; Booth et al. 2016; Read et al. 2018) and HD 95086 (Rameau et al. 2013; Su et al. 2015; Rameau et al. 2016). This is why asymmetries detected in the debris disk are often considered hints for the presence of planetary companions (see e.g. Kalas et al. 2005; Dent et al. 2014; Boccaletti et al. 2015). Similarly, the existence of wide cavities interior to cold debris belts or in between warm asteroid belt analogues and cold outer belts has been used to argue the presence of multiple planets clearing those wide regions of debris, in analogy to the Solar System architecture (Apai et al. 2008; Meshkat et al. 2015; Shannon et al. 2016; Lazzoni et al. 2018; Matthews et al. 2018; Lombart et al. 2020). Perhaps the most convincing and constraining evidence for planets at tens of au is the presence of gaps in broad cold debris disks. There is a growing number of gapped debris disks, e.g HD 107146 (Ricci et al. 2015; Marino et al. 2018), HD 92945 (Golimowski et al. 2011; Marino et al. 2019), HD 15115 (MacGregor et al. 2019; Engler et al. 2019) and HD 206893 (Marino et al. 2020, Nederlander et al., submitted) seen with ALMA tracing the distribution of mm-sized grains. Scattered light images have also revealed the presence of gaps in a few systems, e.g. HD 131835 (Feldt et al. 2017), HD 141569 (Perrot et al. 2016), HD 120326 (Bonnefoy et al. 2017) and NZ Lup (Boccaletti et al. 2019), but these observations trace small m-sized dust which not always is a good tracer of the true mass distribution in the disk (e.g. Wyatt 2006).
One of the simplest interpretations for those gaps is that they are caused by single planets orbiting in those gaps. It is well known that a planet embedded in a debris disk will carve a gap around its orbit, where particles become unstable and are scattered away by the planet. This is the so-called chaotic zone (Wisdom 1980) and its size has been studied extensively both exterior to a planet’s orbit (Quillen & Faber 2006; Nesvold & Kuchner 2015) and interior to it (Morrison & Malhotra 2015). Roughly speaking, we expect that the gap size will have a radial width proportional to , where is the mass ratio between the planet and the star. Therefore the width of a given gap can be directly linked to the mass of the putative planet carving it.
However, gaps can also be carved by planets interior to the disk inner edges. As shown by Pearce & Wyatt (2015) the secular interaction and scattering between a planet on an eccentric orbit and a disk with a similar mass further out, can open an asymmetric and wide gap in the disk. Another possibility is that two or multiple planets closer-in could place a secular resonance within the disk span creating a gap in the disk as well (Marino et al. 2018). Moreover, as shown more recently by Sefilian et al. (2020), if we consider the non-negligible mass of debris disks and its self-gravity, the secular interaction between the disk and single eccentric planet closer-in can also place a secular resonance within the disk opening an asymmetric gap (see also Zheng et al. 2017). Although HD 107146’s gap is very symmetric and thus unlikely to be carved by the alternative scenarios described above (Marino et al. 2018), these could potentially explain the gaps around HD 92945, HD 15115 and HD 206893. In fact HD 206893 is known to host a brown dwarf orbiting at 11 au, and Sefilian et al. (2020) showed that this could explain the gap location given the estimated disk mass for that system. Another possible scenario to explain gaps in the distribution of m-sized grains involves planet migration and resonant trapping as proposed by Wyatt (2006). This scenario was used by Golimowski et al. (2011) to explain the structure of the HD 92945 debris ring. However, this scenario only works for m-sized grains seen in scattered light and the gap seen also at mm-wavelengths rules it out as possible mechanism.
Tight upper limits on the mass of possible companions, both inside and outside the gap in the disk, could then allow to constrain these possible scenarios. This would help understanding the evolutive processes behind the formation of these structures. While present high-contrast imager like e.g. SPHERE (Beuzit et al. 2019) or GPI (Macintosh et al. 2006) are only able to detect planets more massive than 1 MJup, their data can still place meaningful upper limits on the masses of the companion carving the gaps. In this work we present SPHERE observations of two stars hosting debris disks with gaps, HD 92945 and HD 107146, and we use them to put mass limits for companions within few tens of au from the stars.
Furthermore, to complement at shorter separations the limits obtained through direct imaging, we exploited measurements of the proper motion anomaly (PMa) obtained by Kervella et al. (2019) and radial velocity (RV) data for these stars.
2 Target properties
2.1 HD92945
HD 92945 is a K1V (Torres et al. 2006) star at a distance from the Sun of 21.540.02 pc (Gaia Collaboration et al. 2016, 2018).
2.1.1 Spectroscopic analysis
In order to constrain the stellar properties, we analyzed a FEROS (Kaufer et al. 1999) spectrum from the ESO archive taken on 2018-04-21 under open time program 0101.A-9012(A) (P.I. R. Launhardt). The spectrum covers a wavelength range between 3600 and 9000 Åwith a nominal resolution of R=48000; the median signal-to-noise ratio (SNR) per pixel is 260. We carried out continuum normalization and rest-frame correction using the 2020 version of (Blanco-Cuaresma et al. 2014; 2019); equivalent width (EW) have been measured with ARESv2 (Sousa et al. 2015). Atmospheric parameters and metallicity ([Fe/H]) have been obtained through EW measurements of iron lines with the python wrapper of MOOG (Sneden 1973, 2017 version), developed and maintened by I. Ramirez (Ramírez et al. 2014). We used the ODFNEW ATLAS9 set of model atmopsheres by Castelli & Kurucz (2003) and the line list published in D’Orazi et al. (2020). Our analysis results in the following parameters: =514740 K, dex, microturbulent velocity km/s and [Fe/H]=0.03 dex. Broad band colors (B-V, V-I, Bp-Rp, and V-K) are consistent with the spectroscopic estimate of about 5200 K from the tables in Pecaut & Mamajek (2013).
2.1.2 Stellar age
There are various recent estimates of the age of the star, typically, between 100 and 300 Myr (e.g. Song et al. 2004; Plavchan et al. 2009; Vigan et al. 2017). Nielsen et al. (2019) quote membership to the AB Dor with an estimated age of Myr (Vigan et al. 2017; Bell et al. 2015). We reconsidered the available age indicators.
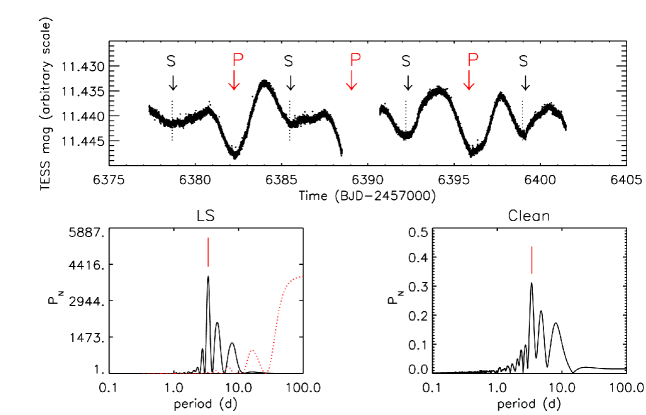
We searched for the stellar rotation period by exploiting the photometric variability in the TESS data (Ricker et al. 2015). We considered the TESS pre-search data conditioning simple aperture photometry (PDCSAP) time series, removing data in the time interval 1555–1557 (BJD-2457000), where residual instrumental effects were significant. The period search was carried out computing the Lomb-Scargle periodogram (Press et al. 2002; Scargle 1982) and the Clean (Roberts et al. 1987) periodogram, which has the capability of effectively removing possible beat frequencies arising from the data sampling. As shown in the bottom panels of Figure 1, the Lomb-Scargle (LS) periodogram revealed a major power peak at days (while the Clean procedure shows P = 3.390.24 days), with a False Alarm Probability (FAP) of the order of 10-6. However, a visual inspection of the top panel of Figure 1 shows the lightcurve to be double dip, owing to spots on opposite hemispheres. Therefore, the rotation period is likely P = 6.80.34 days. This value is in agreement with the P = 7.176 d derived using the period-activity relation from Noyes et al. (1984). We marked with red and black downward arrows the epochs of the primary (P) and secondary (S) minima computed according to a rotation period P = 6.8 d. We note a significant evolution of the secondary spot, which produces progressively deeper minima from one rotation cycle to the next, as well as it shows a slight migration towards earlier epochs, as shown by the position of the vertical dotted lines with respect to black downward arrows. A photometric period which is roughly two times our value was published by Strassmeier et al. (2000). We also note that our rotation period is fully compatible with the other age indicators and with the observed projected rotational velocity, at odds with a 1/2 or 2 period. The FAP associated with our detected period, which is the probability that a peak of given height in the periodogram is caused simply by statistical variations, i.e., Gaussian noise, was computed through Monte Carlo simulations, i.e., by generating 1000 artificial light curves obtained from the real light curve, keeping the date but permuting the magnitude values (see, e.g., Herbst et al. 2002). We followed the method used by Lamm et al. (2004) to compute the errors associated with the period determination.
We found that the rotation period falls close but slightly above the sequence of the Pleiades (Rebull et al. 2016), and between the rotation period distributions of similar color stars of M35 and M34 open clusters (ages 150 and 220 Myr, respectively, Meibom et al. 2009; Meibom et al. 2011).
The chromospheric emission (; Wright et al. 2004) is within the distribution of the Pleiades, while the X-ray emission () is below the Pleiades locus. The corresponding ages using Mamajek & Hillenbrand (2008) calibrations are 160 and 310 Myr, respectively.
The equivalent width of the Li 6708Å doublet measured on the FEROS spectrum is 153.21.2 mÅ, within the observed distribution of Pleiades members but sligthly below the mean values for the cluster.
Kinematic analysis using the BANYAN111http://www.exoplanetes.umontreal.ca/banyan/banyansigma.php online tool (Gagné et al. 2018) yield null membership probability for AB Dor and other young moving groups.
All these finding are compatible with an object with age close but sligthly older than the Pleiades. From a weighted combination of the available indicators (Desidera et al. 2015), we adopt 170 Myr with age limits 120 to 250 Myr.
2.1.3 Mass, radius, and inclination
The stellar mass derived using the PARAM222http://stev.oapd.inaf.it/cgi-bin/param_1.3 interface (da Silva et al. 2006), adopting the spectroscopic effective temperature and metallicity, and considering only the age range for the indirect methods as in Desidera et al. (2015), is 0.860.01 M⊙. A stellar radius of R⊙ is also derived in the fit. Coupling it with the observed rotation period and the projected rotational velocity km/s (Nordström et al. 2004; Valenti & Fischer 2005), we infer an inclination of deg. This is compatible with the inclination of the disk (see below), although the uncertainties also allow a significant misalignment.
2.1.4 The debris disk
The presence of a debris disk around this star was first inferred by Silverstone (2000) based on the excess at 60 m measured by IRAS. Mid-infrared and submillimiter data obtained using Spitzer and the Caltech Submillimiter Observatory revealed excess also at 70 m and 350 m consistent with a a disk optically thin with an inner radius of 15-23 au and a temperature of 40-46 K (Chen et al. 2005; Plavchan et al. 2009). The disk was resolved for the first time by Golimowski et al. (2011) using Hubble space telescope (HST) images in the V and I bands. They also estimated the fractional infrared luminosity of the disk to be . Recently, Marino et al. (2019) observed its disk using ALMA at 0.86 mm and detected, into the disk of planetesimals that extends from 50 to 140 au, a wide ( au) gap at a separation of 733 au from the star. They also found for the disk an inclination of and a position angle of . They concluded that if the gap was caused by a planet on a circular orbit, the planet would need to be less massive than 0.6 MJup. Based on a possible asymmetry in the disk, they also proposed that the gap could have been carved due to secular resonance caused by two planets interior to the disk. In this context, they also defined different possible masses for these two objects.
Because this system has a bright debris disk, it has been target of a large number of direct imaging surveys (e.g. Janson et al. 2013; Biller et al. 2013; Vigan et al. 2017). In particular, Biller et al. (2013), adopting an age of 100 Myr and exploiting NICI near-infrared observations and the AMES-COND (Allard et al. 2003) evolutionary models, were able to put a mass limit of 10 MJup at a separation of 0.5′′ (10.8 au), of 4 MJup at a separation of 1′′ (21.5 au) and less than 2 MJup at separation larger than 2′′ (43 au).
2.2 HD 107146
HD 107146 is a G2V (Harlan & Taylor 1970) star at a distance from the Sun of 27.470.03 pc (Gaia Collaboration et al. 2016, 2018).
2.2.1 Spectroscopic analysis
We exploited one FEROS spectrum (with a median SNR per pixel of 183) available from the ESO archive and obtained on 2018-04-30 under open time program 0101.A-9012(A) (P.I. R. Launhardt). Following the same approach described in Section 2.1.1, we obtained K, dex, microturbulent velocity km/s and [Fe/H]=+0.010.03 dex.
Broad band colors (B-V, V-I, Bp-Rp, and V-K) are consistent with the spectroscopic estimate of about 5900 K obtained from Pecaut & Mamajek (2013) tables.
2.2.2 Stellar age
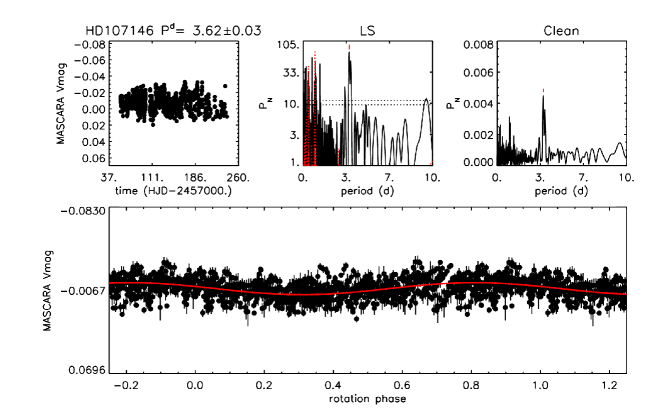
HD 107146 was observed as target of the MASCARA (The Multi-site All-Sky CAmeRA; Burggraaff et al. 2018) project. Observations were collected from February 2015 until April 2016, in two consecutive seasons for a total of 7188 magnitude measurements, with a cadence of about 1 measurement every 10 minutes. After removal of outliers at 3 level, we binned the data with a bin width of 1h and we were left for the subsequent analysis with 1716 average magnitudes with an average precision of =0.0045 mag. Both Lomb-Scargle and Clean periodogram analyses revealed the same rotation period within the uncertainties in the complete time series as well as in the single observation seasons. In Figure 2, we summarize the results for the first observation season whose monitoring turned out to be more homogeneous with no intra-season gaps. We found a rotation period of P=3.620.03 days with a False Alarm Probability (FAP) 1% and an amplitude of the magnitude rotational modulation V=0.01 mag.
A comparison with the rotation period distribution of Pleiades members from Rebull et al. (2016) shows the HD107146 period to fit very well into a 125 Myr period distribution (assuming V=7.04 mag and K=5.54 mag V-K=1.5 mag and P=3.62 days). Adopting the rotation-age relations by Mamajek & Hillenbrand (2008) we derive for HD 107146 an age of 156 Myr.
The activity indicators yield consistent results: the chromospheric emission (; Wright et al. 2004) is within the distribution of the Pleiades, while the X-ray emission () is slightly below the Pleiades locus. The corresponding ages using the Mamajek & Hillenbrand (2008) calibrations are 189 and 226 Myr, respectively.
We measured on the FEROS spectrum a Li equivalent width of mÅ basically identical to the determination by Wichmann et al. (2003) (125 mÅ). This collocates HD 107146 within the lower envelope of the Pleiades distribution.
Moreover, the search for an association between HD 107146 and young moving groups did not give any result. We also searched on Gaia DR2 archive to identify possible comoving objects within from the star without identifying any.
On the basis of rotation period, level of chromospheric and coronal activity, and Lithium content, the age of HD107146 appears to be comparable to or slightly older than the Pleiades age. Also in this case we calculated a weighted combination of the available indicators following Desidera et al. (2015), and adopted an age of 150 Myr with limits between 120 to 200 Myr.
2.2.3 Mass, radius, and inclination
The stellar mass derived using the same method used for HD 92945 as described in Section 2.1.3 is 1.060.01 M⊙. A stellar radius of R⊙ is also derived in the fit. Coupling it with the observed rotation period and the projected rotational velocity km/s (Nordström et al. 2004; Valenti & Fischer 2005), we infer an inclination of . This inclination is well aligned with the inclination estimated for the disk (see below) within the error bars.
2.2.4 The debris disk
The debris disk was first discovered by Silverstone (2000) using IRAS observations at 60 m while observations at sub-millimeter wavelenghts confirmed the presence of dust (Williams et al. 2004). Later, the disk was resolved thanks to HST observations (Ardila et al. 2004; Ertel et al. 2011) revealing a disk extending up to a separation of 160 au and with a brightness peak at 120 au. The infrared fractional luminosity of the disk was estimated to be (Ertel et al. 2011). Spitzer observations at 24 m and 70 m allowed to determine the presence of a warm dust belt in the system with a temperature of 120 K and located at a separation of 5-15 au from the star (Morales et al. 2011; Kennedy & Wyatt 2014). Using ALMA data at 1.25 mm, Ricci et al. (2015) found that the disk extends from 30 to 150 au from the star but with a decrease of brightness at intermediate radii that, in their interpretation, could be due to the presence of an earth mass planet orbiting at 80 au from the star. Finally, Marino et al. (2018) observed HD 107146 with ALMA at 0.86 and 1.1 mm and found that the planetesimal belt extends from 40 to 140 au and identified a circular gap at separations from 60 to 100 au with a drop in emission by 50%. Finally, they were able to constrain the disk inclination to and the position angle to and concluded that either multiple low mass planets or a single planet migrating through the disk were needed to make a wide gap that is only 50% empty.
3 Observations and data reduction
3.1 Direct imaging data
| Date | Target | OBs. Mode | Coronagraph | Obs. IFS | Obs. IRDIS | FOV rot. | seeing | wind | |
|---|---|---|---|---|---|---|---|---|---|
| (∘) | (′′) | (ms) | (m/s) | ||||||
| 2018-01-27 | HD 92945 | IRDIFS | N_ALC_YJH_S | 166;48 | 166;48 | 121.3 | 0.80 | 5.6 | 6.63 |
| 2015-04-09 | HD 107146 | IRDIFS | N_ALC_YJH_S | 165;32 | 1610;16 | 14.9 | 1.66 | 3.8 | 0.80 |
| 2016-03-19 | HD 107146 | IRDIFS | N_ALC_YJH_S | 165;32 | 1610;16 | 15.7 | 1.00 | 2.1 | 4.35 |
HD 92945 was observed during the 2018-01-27 night in the context of the SHINE survey (Chauvin et al. 2017; Vigan et al. 2020) with SPHERE operating in IRDIFS observing mode, that is with IFS (Claudi et al. 2008) observing in Y and J spectral bands between 0.95 and 1.35 m while IRDIS (Dohlen et al. 2008) observed in the H spectral band with the H23 filter pair (wavelenght H2=1.593 m; wavelength H3=1.667 m; Vigan et al. 2010).
HD 107146 was observed in two different epochs in the context of the open time program 095.C-0374(A) (P.I. L. Ricci). The two epochs were acquired on 2015-04-09 and 2016-03-19, respectively. In both cases the observations were carried on with SPHERE operating in the IRDIFS observing mode. The observations for both targets were performed in pupil stabilized mode to be able to implement angular differential imaging (ADI; Marois et al. 2006). The main characteristics of all the observing nights are listed in Table 1.
For all the observations, frames with satellite spots symmetric with respect to the central star were obtained before and after the coronagraphic sequences. This allowed to determine the position of the star behind the coronagraphic focal plane mask and accurately recenter the data. Furthermore, to allow to correctly calibrate the flux of companions, images with the star not behind the coronagraph were taken. In these cases, the use of an appropriate neutral density filter was mandatory to avoid saturation of the detector.
The data were reduced through the SPHERE data center (Delorme et al. 2017) that perform the requested calibrations, both for IFS and IRDIS, using the data reduction and handling (DRH; Pavlov et al. 2008) pipeline. On the reduced data we then applied speckle subtraction algorithms using both TLOCI (Marois et al. 2014) and principal components analysis (PCA; Soummer et al. 2012) as implemented in the SPHERE consortium pipeline called SpeCal (Spectral Calibration; Galicher et al. 2018).
3.2 Radial velocity data
To complement the direct imaging mass limits at lower separations from the star we retrieved archival RV data for both stars. For HD 92945 we retrieved from the ESO archive data obtained using the HARPS spectrograph (Lovis et al. 2006) operating at the 3.6 m telescope at La Silla. These data were obtained in the context of the open time programs 074.C-0037(A)(P.I. E. Guenther), 075.C-0202(A) (P.I. E. Guenther) and 192.C-0224(B) (P.I. A.-M. Lagrange). The data were reduced using the official HARPS pipeline (DRS v. 3.5), that delivers the RV and full width at half maximum (FWHM) measured on each Cross-Correlation Function (CCF). The mask used is G2. We gathered a total of 28 RVs, ten of them being taken in 2005, the remaining ones in 2016-17. Part of the data was then taken after an instrument upgrade in June 2015 (Lo Curto et al. 2015) and display an offset toward larger RVs with respect to the pre-upgrade data. This offset was applied before combining data. The typical precision for these observations was of the order of 1 m/s.
RVs data for HD 107146 covering the epochs from 2007 to 2015 were obtained using the SOPHIE high-resolution echelle spectrograph fiber-fed from the Cassegrain focus of the 1.93 m telescope at the Haute-Provence Observatory (OHP) in France (Bouchy & Sophie Team 2006). SOPHIE is installed in a temperature-stabilized environment, and the dispersive elements are kept at constant pressure to provide high-precision radial velocities (Perruchot et al. 2008). Since June 2011, a new fiber scrambler has provided a significant improvement of the spectrograph illumination stability, leading to a precision gain of a factor 6 (Perruchot et al. 2011; Bouchy et al. 2013). The spectra were reduced and extracted using the SOPHIE pipeline (Bouchy et al. 2009), and the resulting wavelength calibrated 2D spectra were correlated using a numerical binary mask corresponding to spectral type G2 to obtain the radial velocity measurement (Baranne et al. 1996). In this case the typical precision was of the order of 2 m/s.
3.3 Proper motion data
The presence of a companion can be inferred studying the anomalies of the proper motion of the host star. These anomalies are obtained comparing the long-term proper motion vector derived comparing data from the Hipparcos (van Leeuwen 2007) and the Gaia DR2 catalogues and the instantaneous proper motion values both at the Hipparcos and Gaia DR2 epochs. Deviations between these vectors at S/N levels higher than 3 are indication of the presence of a companion. Even in the case of no evidence of a low mass companion, these data can however be used to define constraints on the mass of a companion especially at low separations from the host star where the limits from direct imaging are less effective or totally absent due to the presence of the coronagraph. In a recent work, Kervella et al. (2019) calculated the PMa for a sample of 6741 stars at a distance less than 50 pc from the Sun. Both HD 92945 and HD 107146 were part of this sample and we can then exploit these results in combination with the limits from direct imaging and from RV to constrain the presence of companions around these systems. While for the case of HD 92945 they did not find any evidence of a companion, for HD 107146 they found a signal to noise (S/N) of 3.42 on the PMa strongly indicative of the presence of a companion. We will discuss in Section 5 the implications of this result.
4 Results
4.1 HD 92945
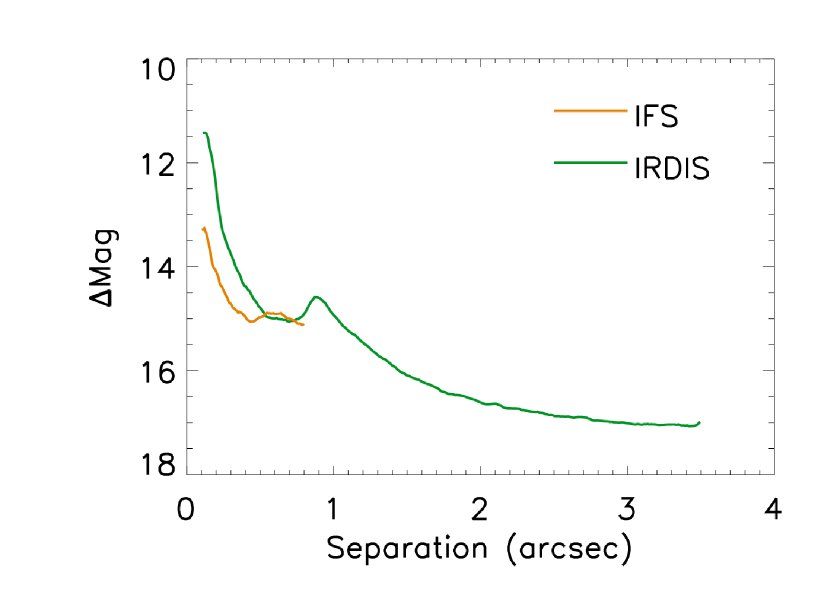
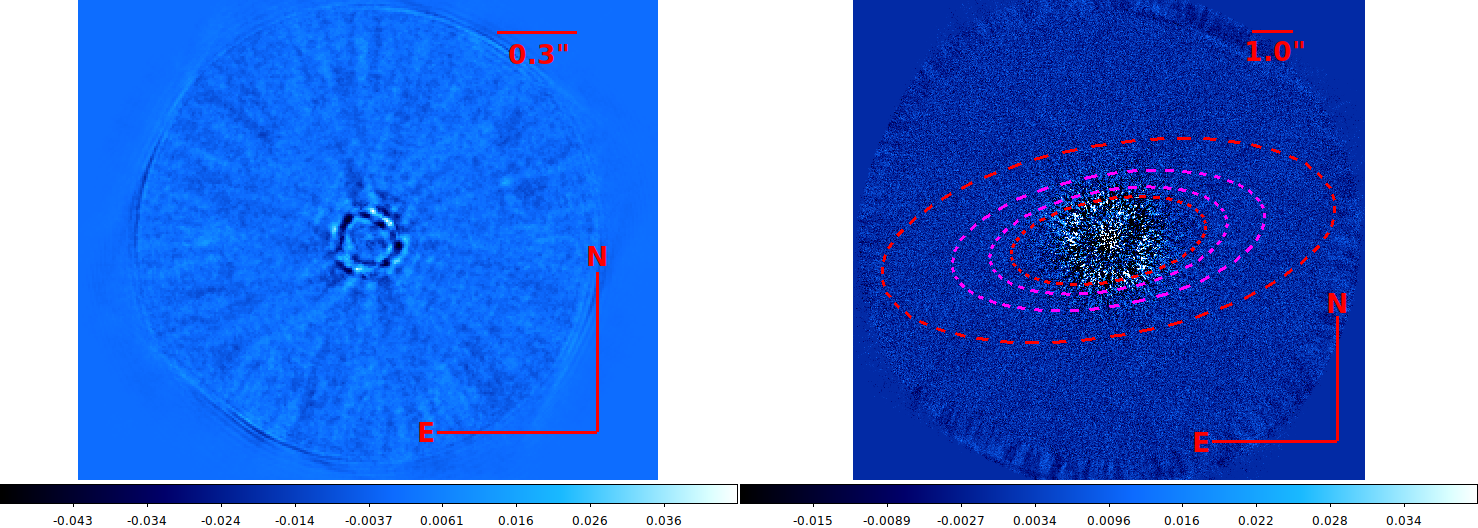
In Figure 3 we display the final images obtained for HD 92945 using both IFS (left panel) and IRDIS (right panel). We overplotted on the IRDIS image dashed red line to indicate the position of the disk and dashed magenta lines to indicate the position of the gap as indicated by Marino et al. (2019). The same positions were however outside the field of view (FOV) of IFS. No clear detection of possible candidate companions is in the FOV of both instruments. Also, the disk is undetected as expected due its low surface brightness typical for 100 Myr old debris disk and ADI self-cancellation effects (Milli et al. 2012). We then calculated the luminosity contrast as a function of the separation from the star adopting the technique presented in Mesa et al. (2015) and corrected for the small sample statistic following the method described by Mawet et al. (2014). The contrast in magnitude derived with this method both for IFS and IRDIS is displayed in Figure 5. With IFS, we obtain a contrast of the order of 15 magnitudes at separations larger than 0.5′′, while IRDIS allows to obtain contrasts better than 16 magnitudes at separations larger than 1.5′′. These contrast estimates assume that the disk is optically thin which is true for this system and for debris disks in general.
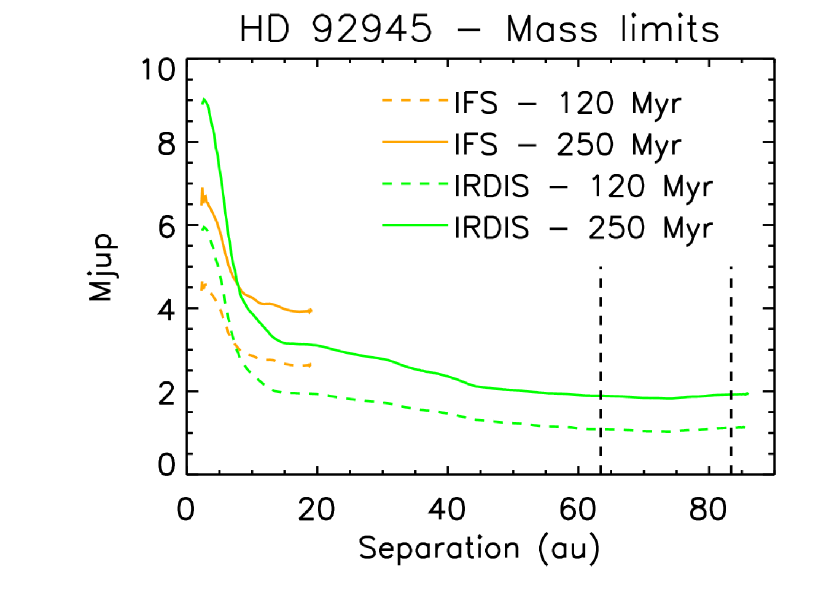
Adopting this contrast and exploiting the AMES-COND evolutionary models, we defined the mass limits for possible companions around HD 92945 adopting both the minimum (120 Myr) and the maximum (250 Myr) age proposed for this system. The separation on the disk plane was considered in this case adopting an inclination of and a position angle of (Marino et al. 2019). Using these informations we calculated for each position in the image both the mass limits and the deprojected separation from the star. The median value of the mass for positions at the same separation from the star was assumed as the mass limit at that separation. The results obtained from this procedure are displayed in Figure 6 where the dashed lines represent the mass limits obtained for the 120 Myr age case while the solid lines represent the 250 Myr case. Also, in this Figure we distinguish between the IFS case, represented with the two orange lines, and the IRDIS case, represented with the two green lines. The two dashed vertical lines, finally, represent the expected position of the gap in the disk. From our results, we can see that at this position the mass limits are between 1 and 2 MJup depending from the age of the system. These limits are still higher than the maximum mass of 0.6 MJup evaluated for a single planet carving the gap proposed by Marino et al. (2019). Nevertheless, these limits are useful to rule out the presence of massive companions interior or exterior to the disk. As for the solution with two inner planets proposed by Marino et al. (2019) to explain the gap (see e.g. Figure 8 in their paper), our data are able in this case to further constrain the possible configurations proposed in that paper.
4.2 HD 107146
| Obs. date | (mas) | Dec (mas) | Separation (mas) | PA (deg) |
|---|---|---|---|---|
| 2015-04-09 | -2948.584.00 | -4487.174.00 | 5369.255.66 | 213.30.5 |
| 2016-03-19 | -2811.684.00 | -4315.674.00 | 5150.785.66 | 213.10.5 |
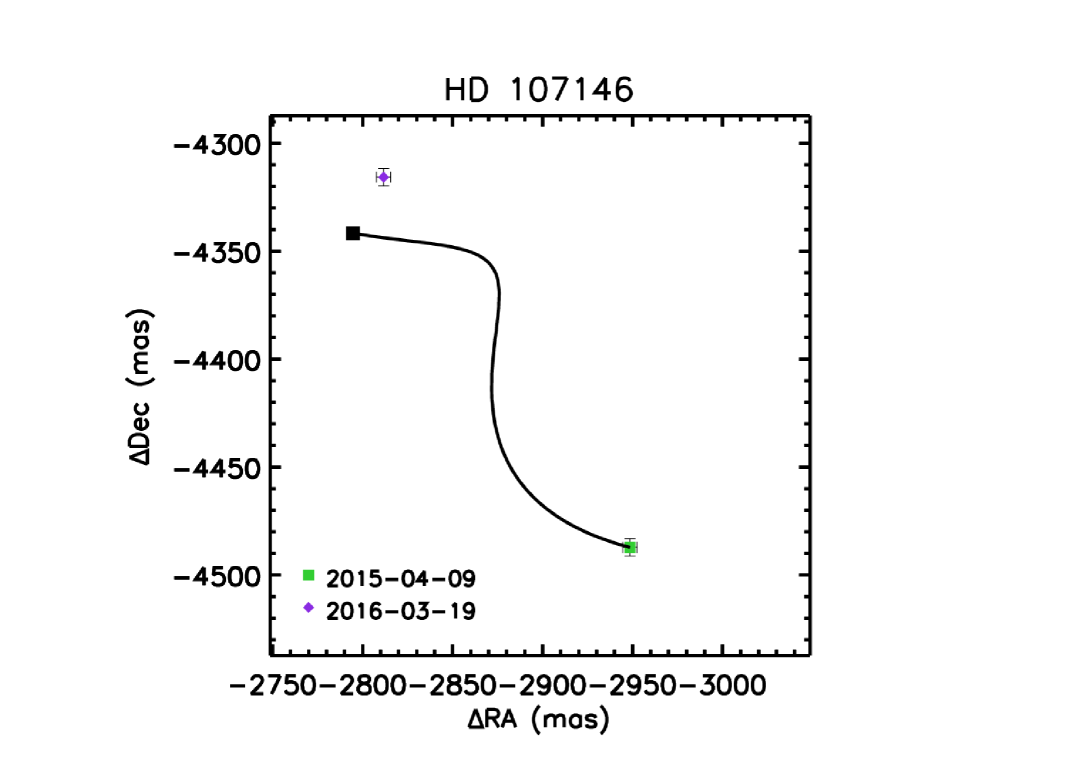
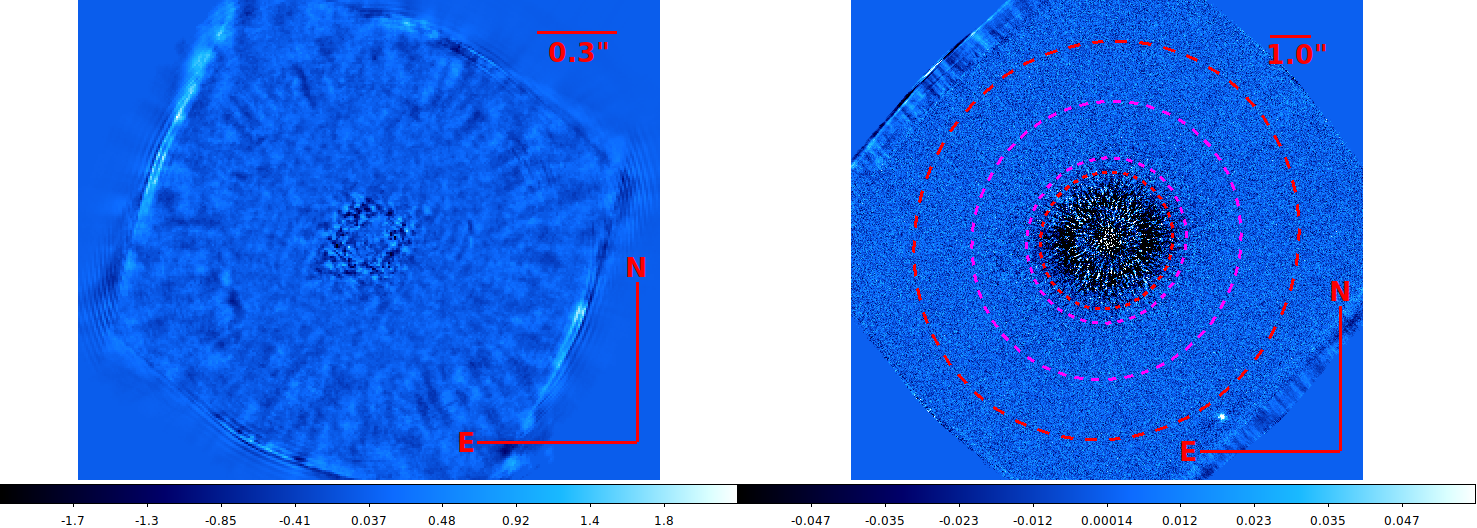
In Figure 4 we display the final images obtained both for IFS (left panel) and for (IRDIS) for the HD 107146 data obtained during the night of 2016-03-19. We also overplotted on the IRDIS image red dashed lines to indicate the position of the disk and magenta dashed lines to indicate the position of the gap using the values obtained by Marino et al. (2018). These lines are outside the IFS FOV. Like for the case of HD 92945 we are not able to retrieve any signal from the disk. Also in this case, this is expected due to the low luminosity at estimated age of the system and to the moderately low inclination of the disk with respect to line of sight. In this case, however, a point source is clearly detected at a separation larger than 5′′ and position angle of 213∘ at south west of the star in both the observing epochs (see Table 2 for precise astrometric data). In Figure 7 we display the comparison of the relative astrometric positions in the two epochs listed in Table 2. The relative position of the candidate in the second epoch (violet diamond), is very similar to its expected position if it was a background object (black squares) while we would expect a reduced shift from the relative position of the first epoch (green square) if it were a bound object. From this analysis we then conclude that the candidate is very likely a background object.
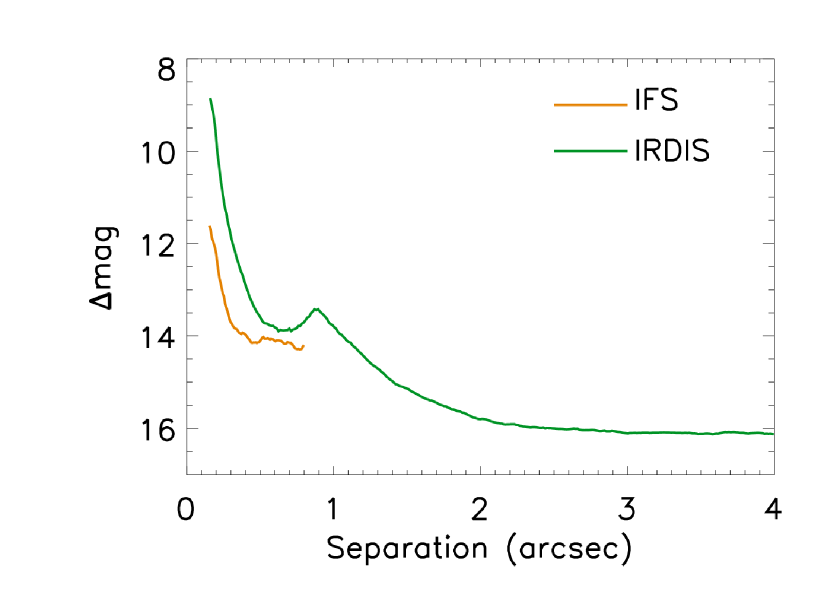
Following the same method described in Section 4.1 for HD 92945 we calculated the luminosity contrast in the region around HD 107146. The results of this procedure are shown in Figure 8 both for IFS (orange line) and IRDIS (green line). From IFS we obtain a contrast better than 14 magnitudes at separations larger than 0.5′′ while IRDIS allows to obtain a contrast better than 16 magnitudes at separations larger than 2′′.
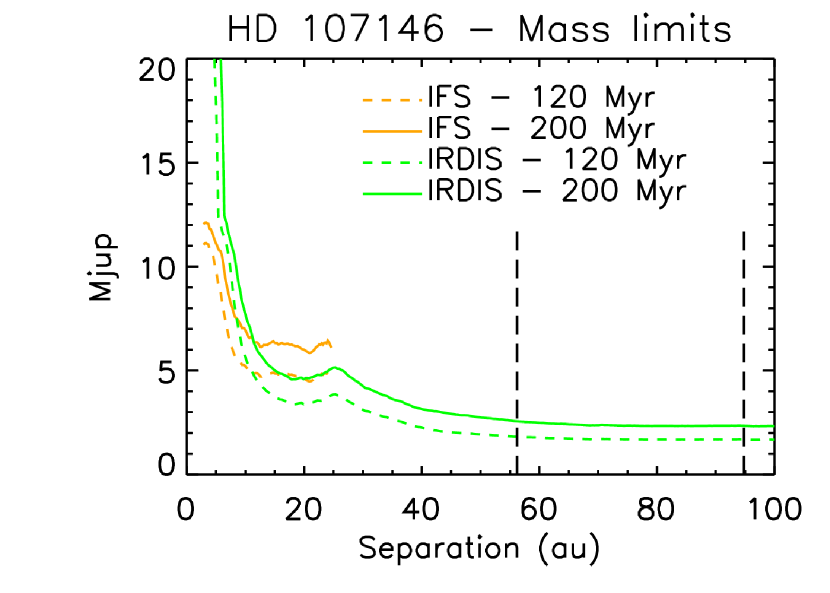
In Figure 9 we display the results of the procedure that, using the AMES-COND evolutionary models and assuming for the disk an inclination of and a position angle of (Marino et al. 2018), converts these contrast limits into mass limits adopting both a minimum age of 120 Myr (dashed lines) and a maximum age of 200 Myr (solid lines). The two dashed vertical lines represent the expected position for the gap in the disk. In the gap the mass limits that we obtain from our data are between 1 and 2.5 MJup. At lower separations, we reach limits slightly lower than 5 MJup in between 20-50 au. Interior to 20 au the mass limits are typically larger than 5 MJup.
5 Discussion
5.1 Comparison with dynamical models
To further check how the limits we obtained can help to constrain the structures of these systems we compared them with the results of dynamical models following the method devised in Lazzoni et al. (2018). This method derives analytical tools to link the extension of gaps detected in debris disks with the masses, semi-major axes and eccentricities of putative planets responsible for the gaps. The main assumption underneath this formulation is that a planet sweeps dust particles from a region around its orbit called chaotic zone. The width of the chaotic zone is directly proportional to the mass, the semi-major axis and the eccentricity of the planet. When more than one planet is present in the gap, not only the planet-disk interaction has to be taken into account but also the planet-planet interaction must be treated. Since a stable system is needed to preserve the debris disk, we included this condition in deriving the multi-planetary architecture. Moreover, to avoid further degeneracies in masses and semi-major axes, we assumed the planets with equal mass and as close as possible to have still a marginally stable system. We will refer to this last assumption as max packing condition.
For what regards the circular orbit case, the planet-disk interaction is ruled by the equation derived in Morrison & Malhotra (2015). See Equations 3 and 4 in Lazzoni et al. (2018) for more details. Moreover, for two planets on circular orbits the stability criterium was derived from Gladman (1993) setting the eccentricities to zero and assuming equal masses to simplify the calculation as shown by Equation 23 in Lazzoni et al. (2018). We also considered the case of three equal mass planets. In this case the stability of the system is guaranteed by the the Hill criterium coupled with K-parametrization curves derived by Marzari (2014) and are also reported in Equation 25 in Lazzoni et al. (2018).
We decided to not consider the case of eccentric orbit because the disk eccentricity for both the system is very low with an upper limit of 0.097 for HD 92945 (Marino et al. 2018) and of 0.03 for HD 107146 (Marino et al. 2019). This should exclude the presence of high-eccentricity embedded planets (Pearce & Wyatt 2014, 2015). For all the considered cases we assumed that the gap was completely devoid from dust particles. Other studies (e.g. Shannon et al. 2016) consider the gap as only marginally cleared. In such cases, the masses derived for the planets will be lower with respect to the ones derived in our analysis. We can then consider our solutions as upper limits for each architecture considered.
Thanks to the procedure described above, we estimated that, in the case of HD 92945, a single planet on a circular orbit should have a mass of at most MJup to carve the gap. This is slightly lower but however in good agreement with the upper limit of 0.6 MJup found by Marino et al. (2019). If the gap was carved by multiple planets, their mass could be even lower. Clearly, all these planets have masses well below the detection limit of around 1 MJup reachable with SPHERE or with any other present planet imager.
In the case of HD 107146 the gap could be caused by a single planet with a mass of at most 3.3 MJup. This would allow the detection according to the mass limit we obtained for this system. We have however to stress that, as explained above, this value has to be regarded just an upper limit. Considering two or three planets would require a mass of 0.47 MJup and 0.03 MJup, respectively, for all the considered planets. This is well outside the detection capability of our observations.
5.2 Comparison with limits from RV and PMa
5.2.1 SPHERE detection probability
The Exoplanet Detection Map Calculator (Exo-DMC Bonavita 2020) is the latest (and for the first time in Python) rendition of the MESS (Multi-purpose Exoplanet Simulation System Bonavita et al. 2012), a Monte Carlo tool for the statistical analysis of direct imaging survey results. In a similar fashion to its predecessors, the DMC combines the information on the target stars with the instrument detection limits to estimate the probability of detection of a given synthetic planet population, ultimately generating detection probability maps.
For each star in the sample the DMC produces a grid of masses and physical separations of synthetic companions, then estimates the probability of detection given the provided detection limits. The default setup uses a flat distributions in log space for both the mass and semi-major axis but, in a similar fashion to its predecessors, the DMC allows for a high level of flexibility in terms of possible assumptions on the synthetic planet population to be used for the determination of the detection probability.
For each point in the mass/semi-major axis grid the DMC generates a fixed number of sets of orbital parameters. By default all the orbital parameters are uniformly distributed except for the eccentricity, which is generated using a Gaussian eccentricity distribution with and , following the approach by Hogg et al. (2010) (see Bonavita et al. 2013, for details). For this reason we were able to properly take into account the effects of projection when estimating the detection probability using the contrast limits in Fig. 5 and Fig. 8. The DMC in fact calculates the projected separations corresponding to each orbital set for all the values of the semi-major axis in the grid (see Bonavita et al. 2012, for a detailed description of the method used for the projection). This allows to estimate the probability of each synthetic companion to truly be in the instrument FoV and therefore to be detected, if the value of the mass is higher than the limit.
In this specific case we chose to restrict the inclination and the longitude of the node of each orbital set to make sure that all companions in the population would lie in the same orbital plane as the disk. This is equivalent to assuming there would be no strong misalignments () between the disks and possible embedded planets. A massive misaligned planet would in fact reorient the disk through secular interactions and the new mid plane would be aligned with the planet. This would occur typically in timescales shorter than the age of these systems (Pearce &
Wyatt 2014).
Moreover, since in both cases the disk does not appear to be particularly
eccentric (Marino
et al. 2018, 2019), which would be the
case if the orbit of the embedded planets were (Pearce &
Wyatt 2014, 2015), we assumed a sigma of 0.1 for the eccentricity
distribution.
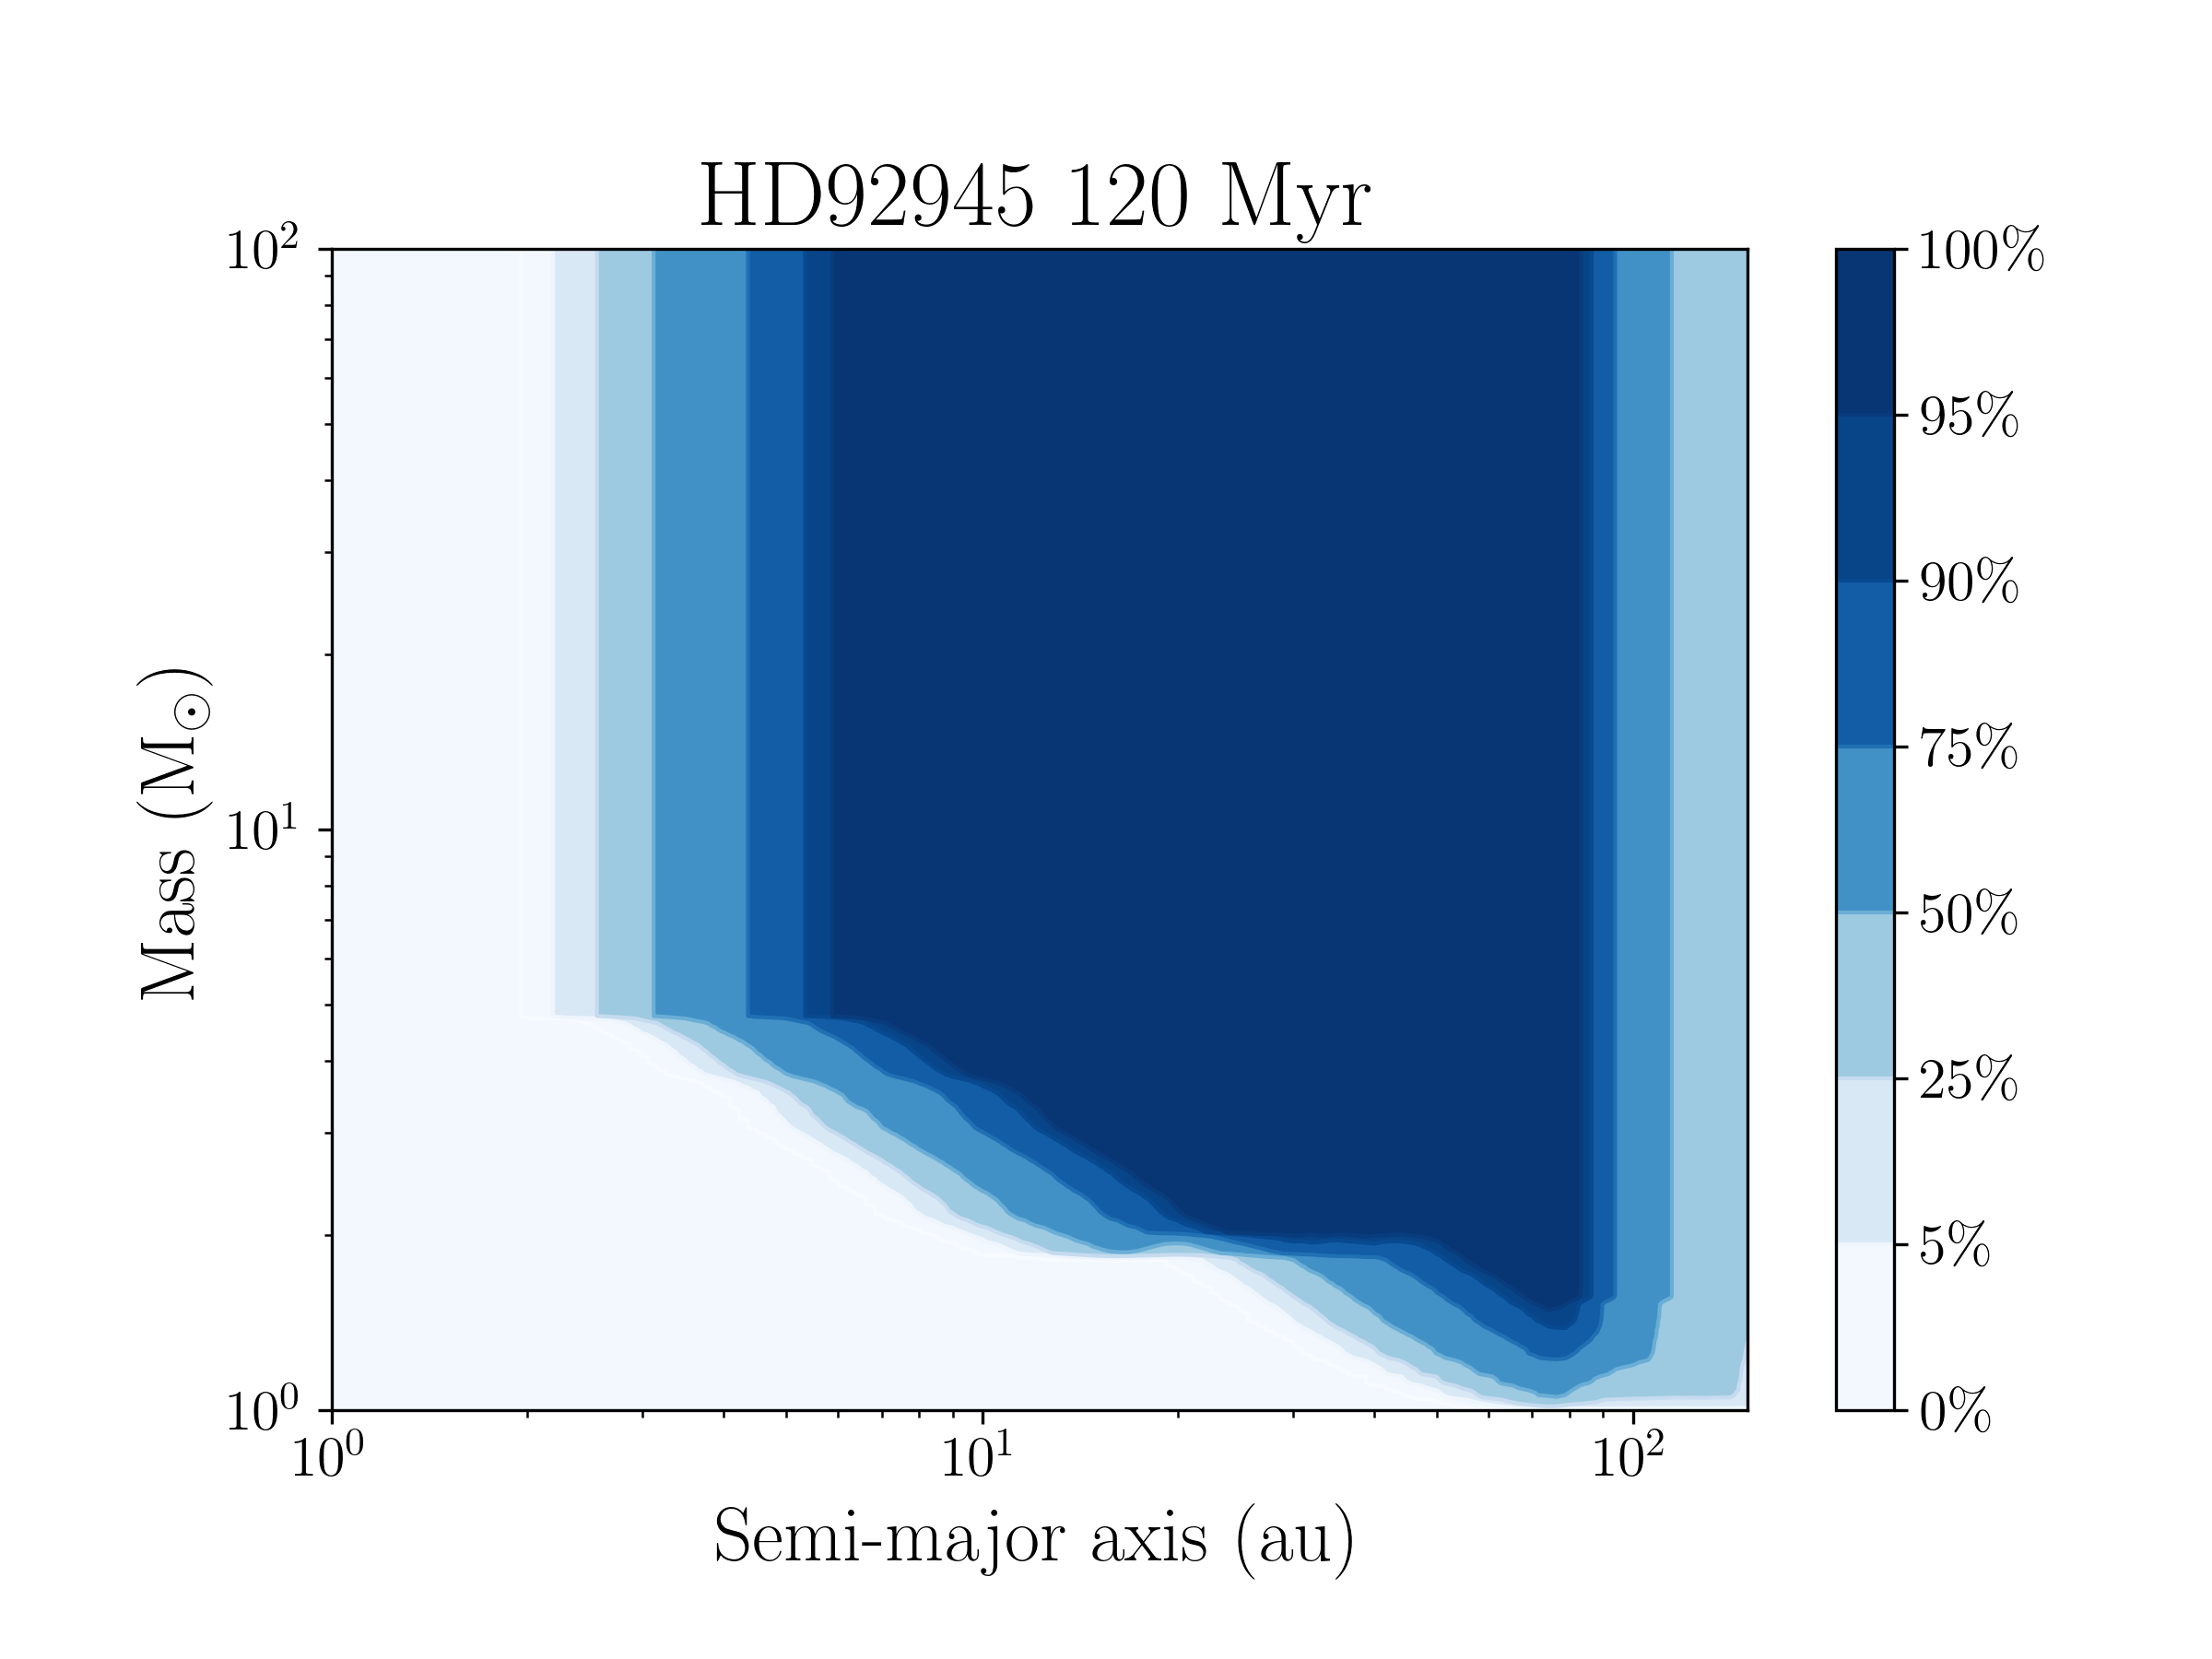
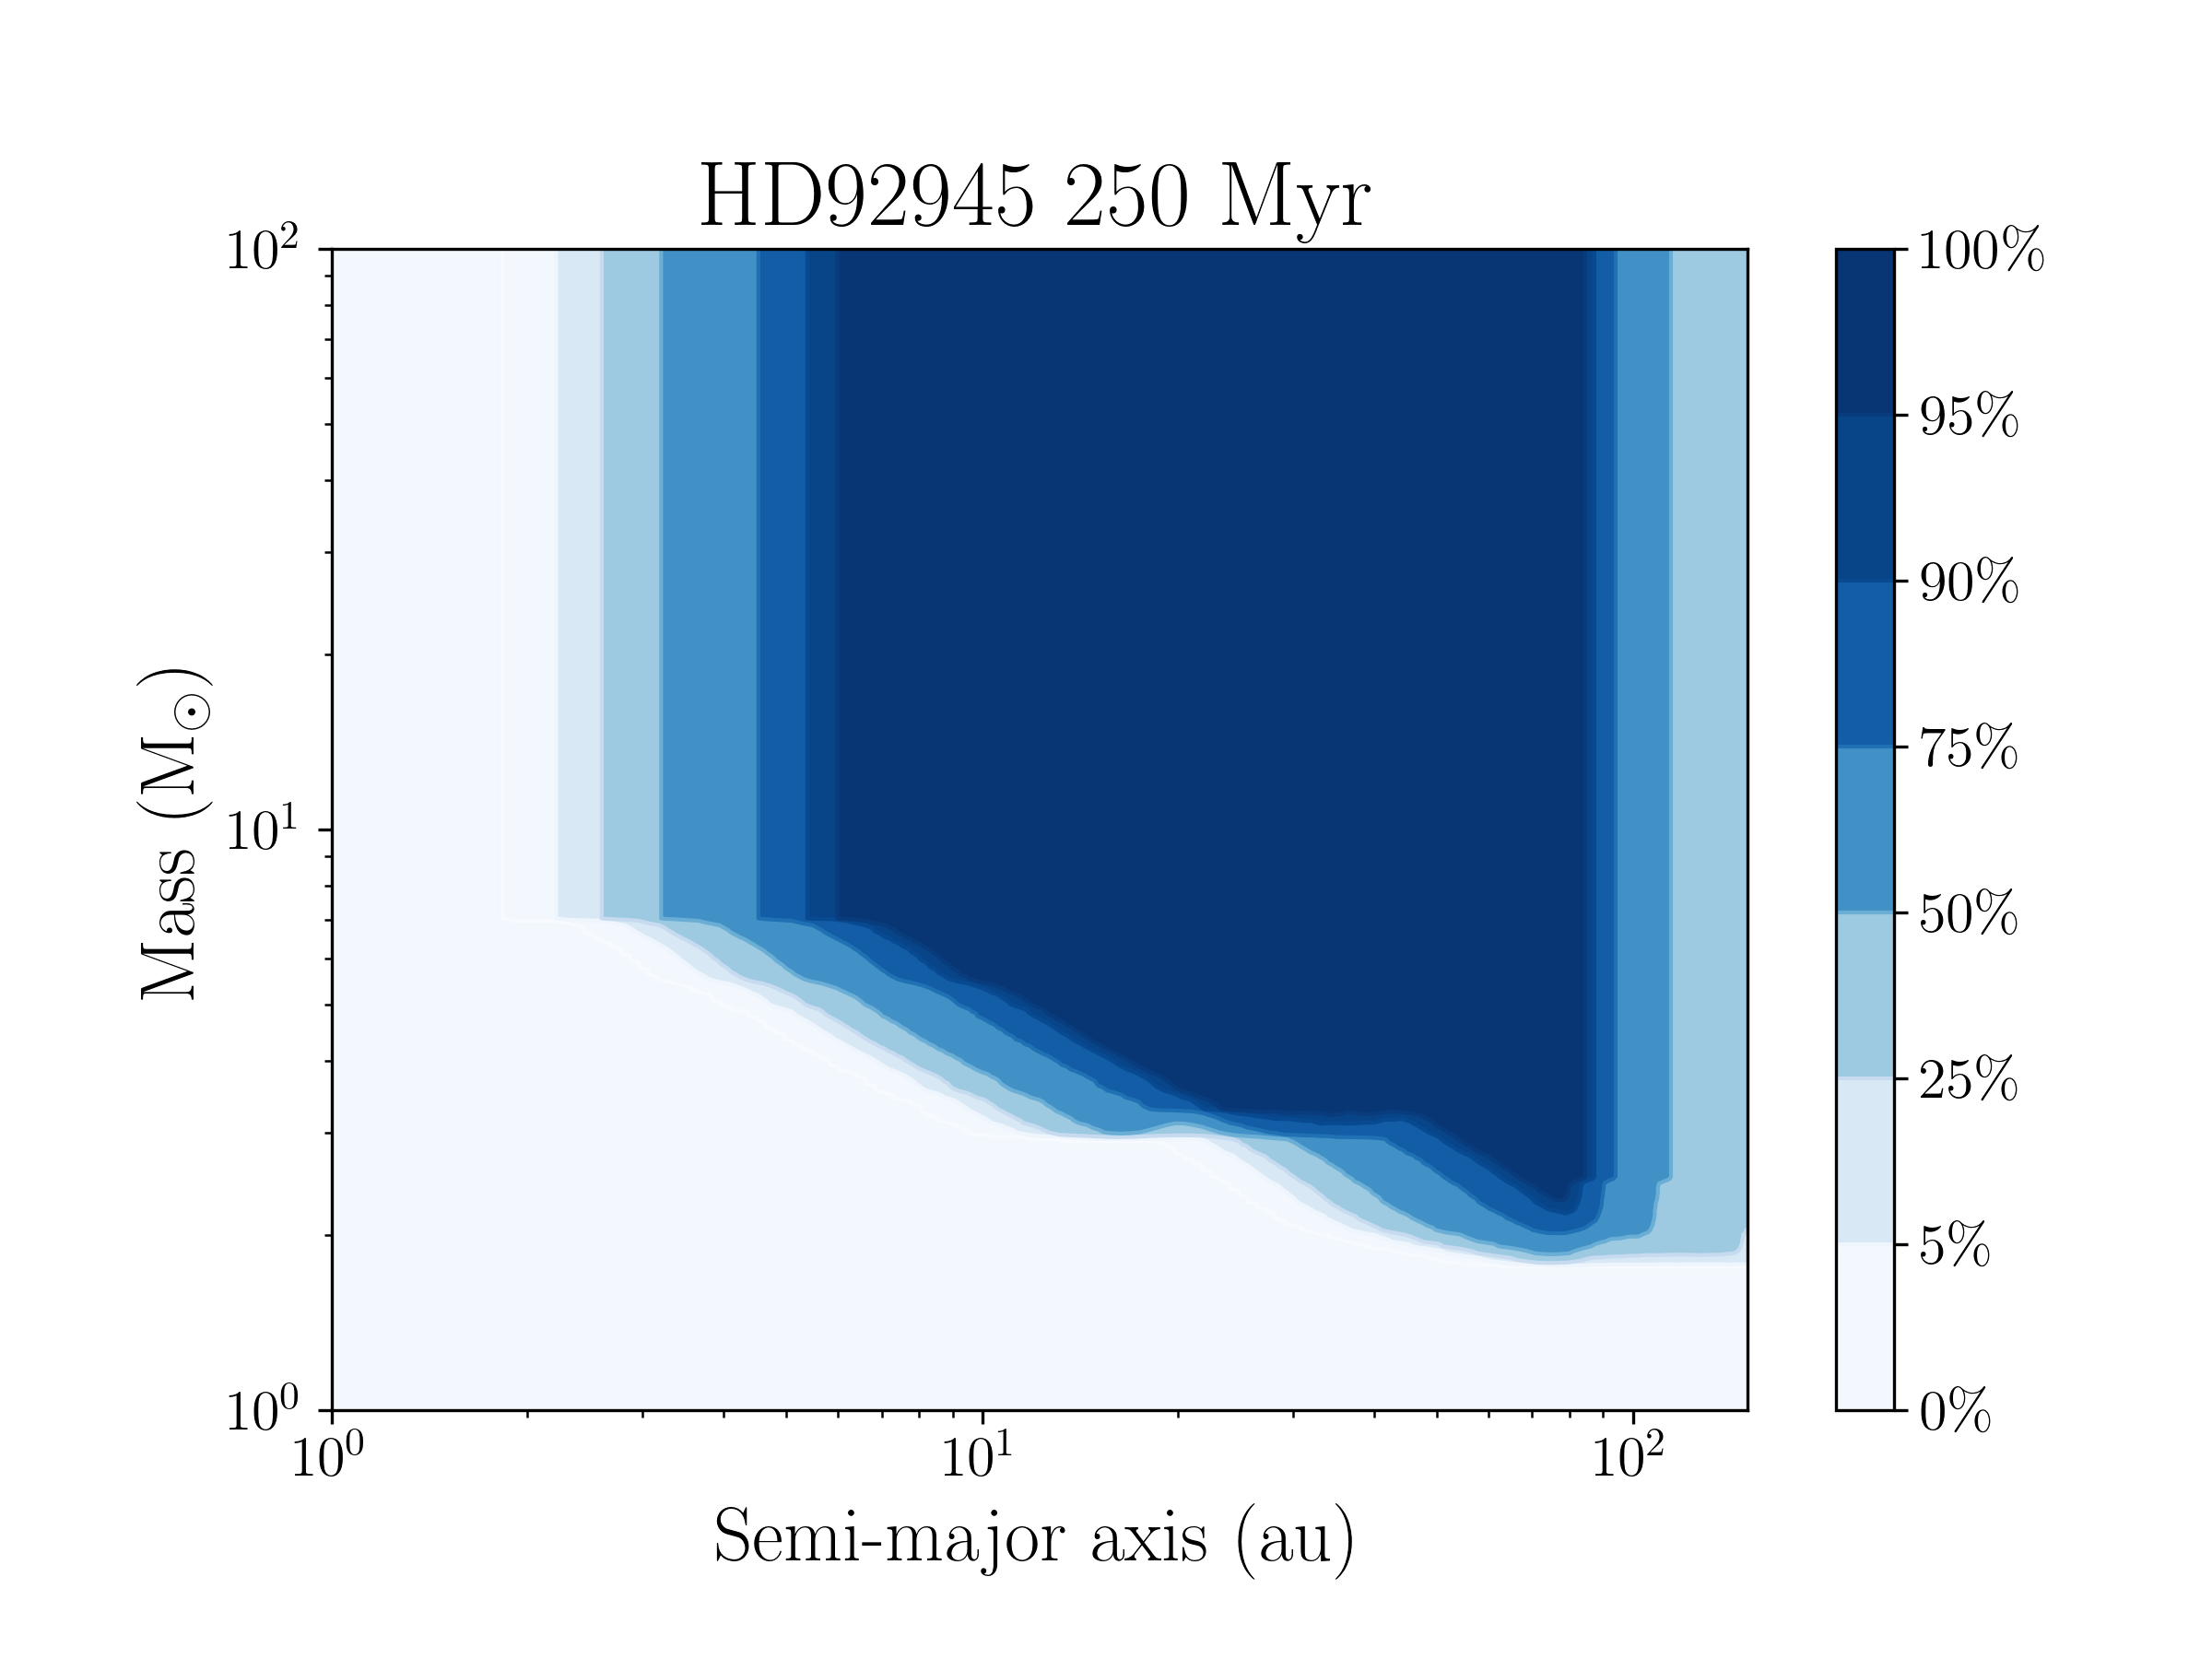
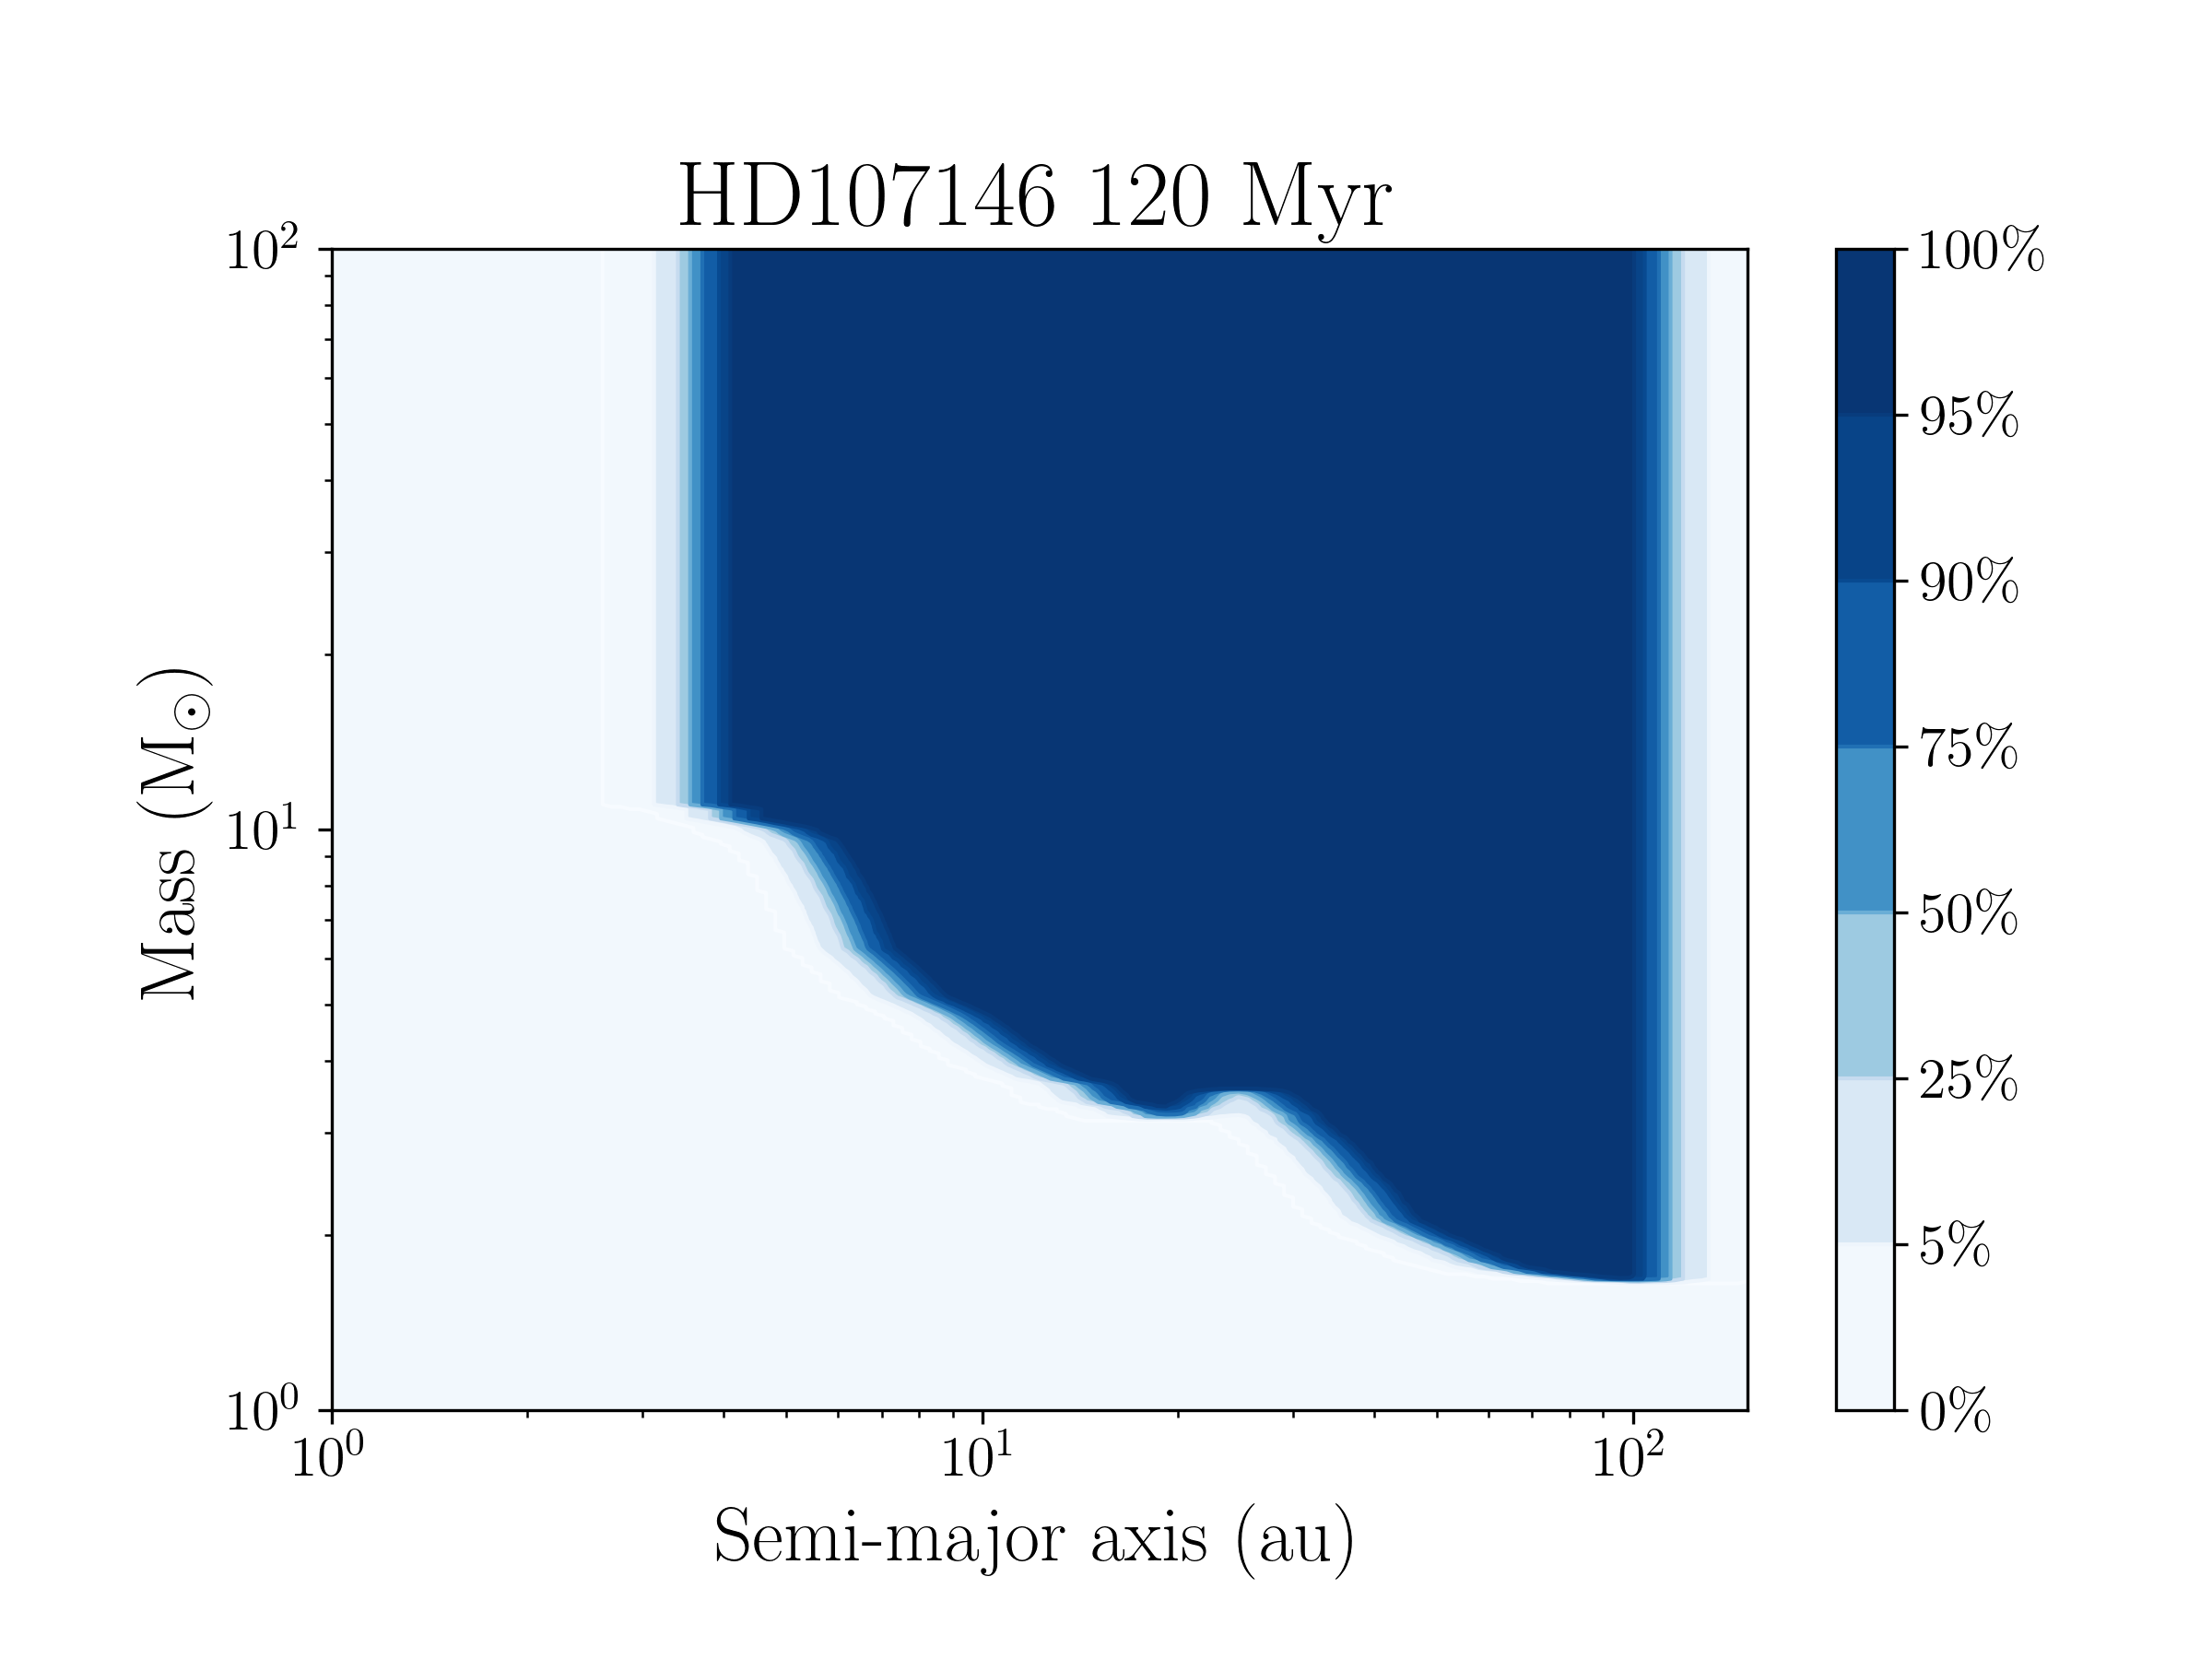
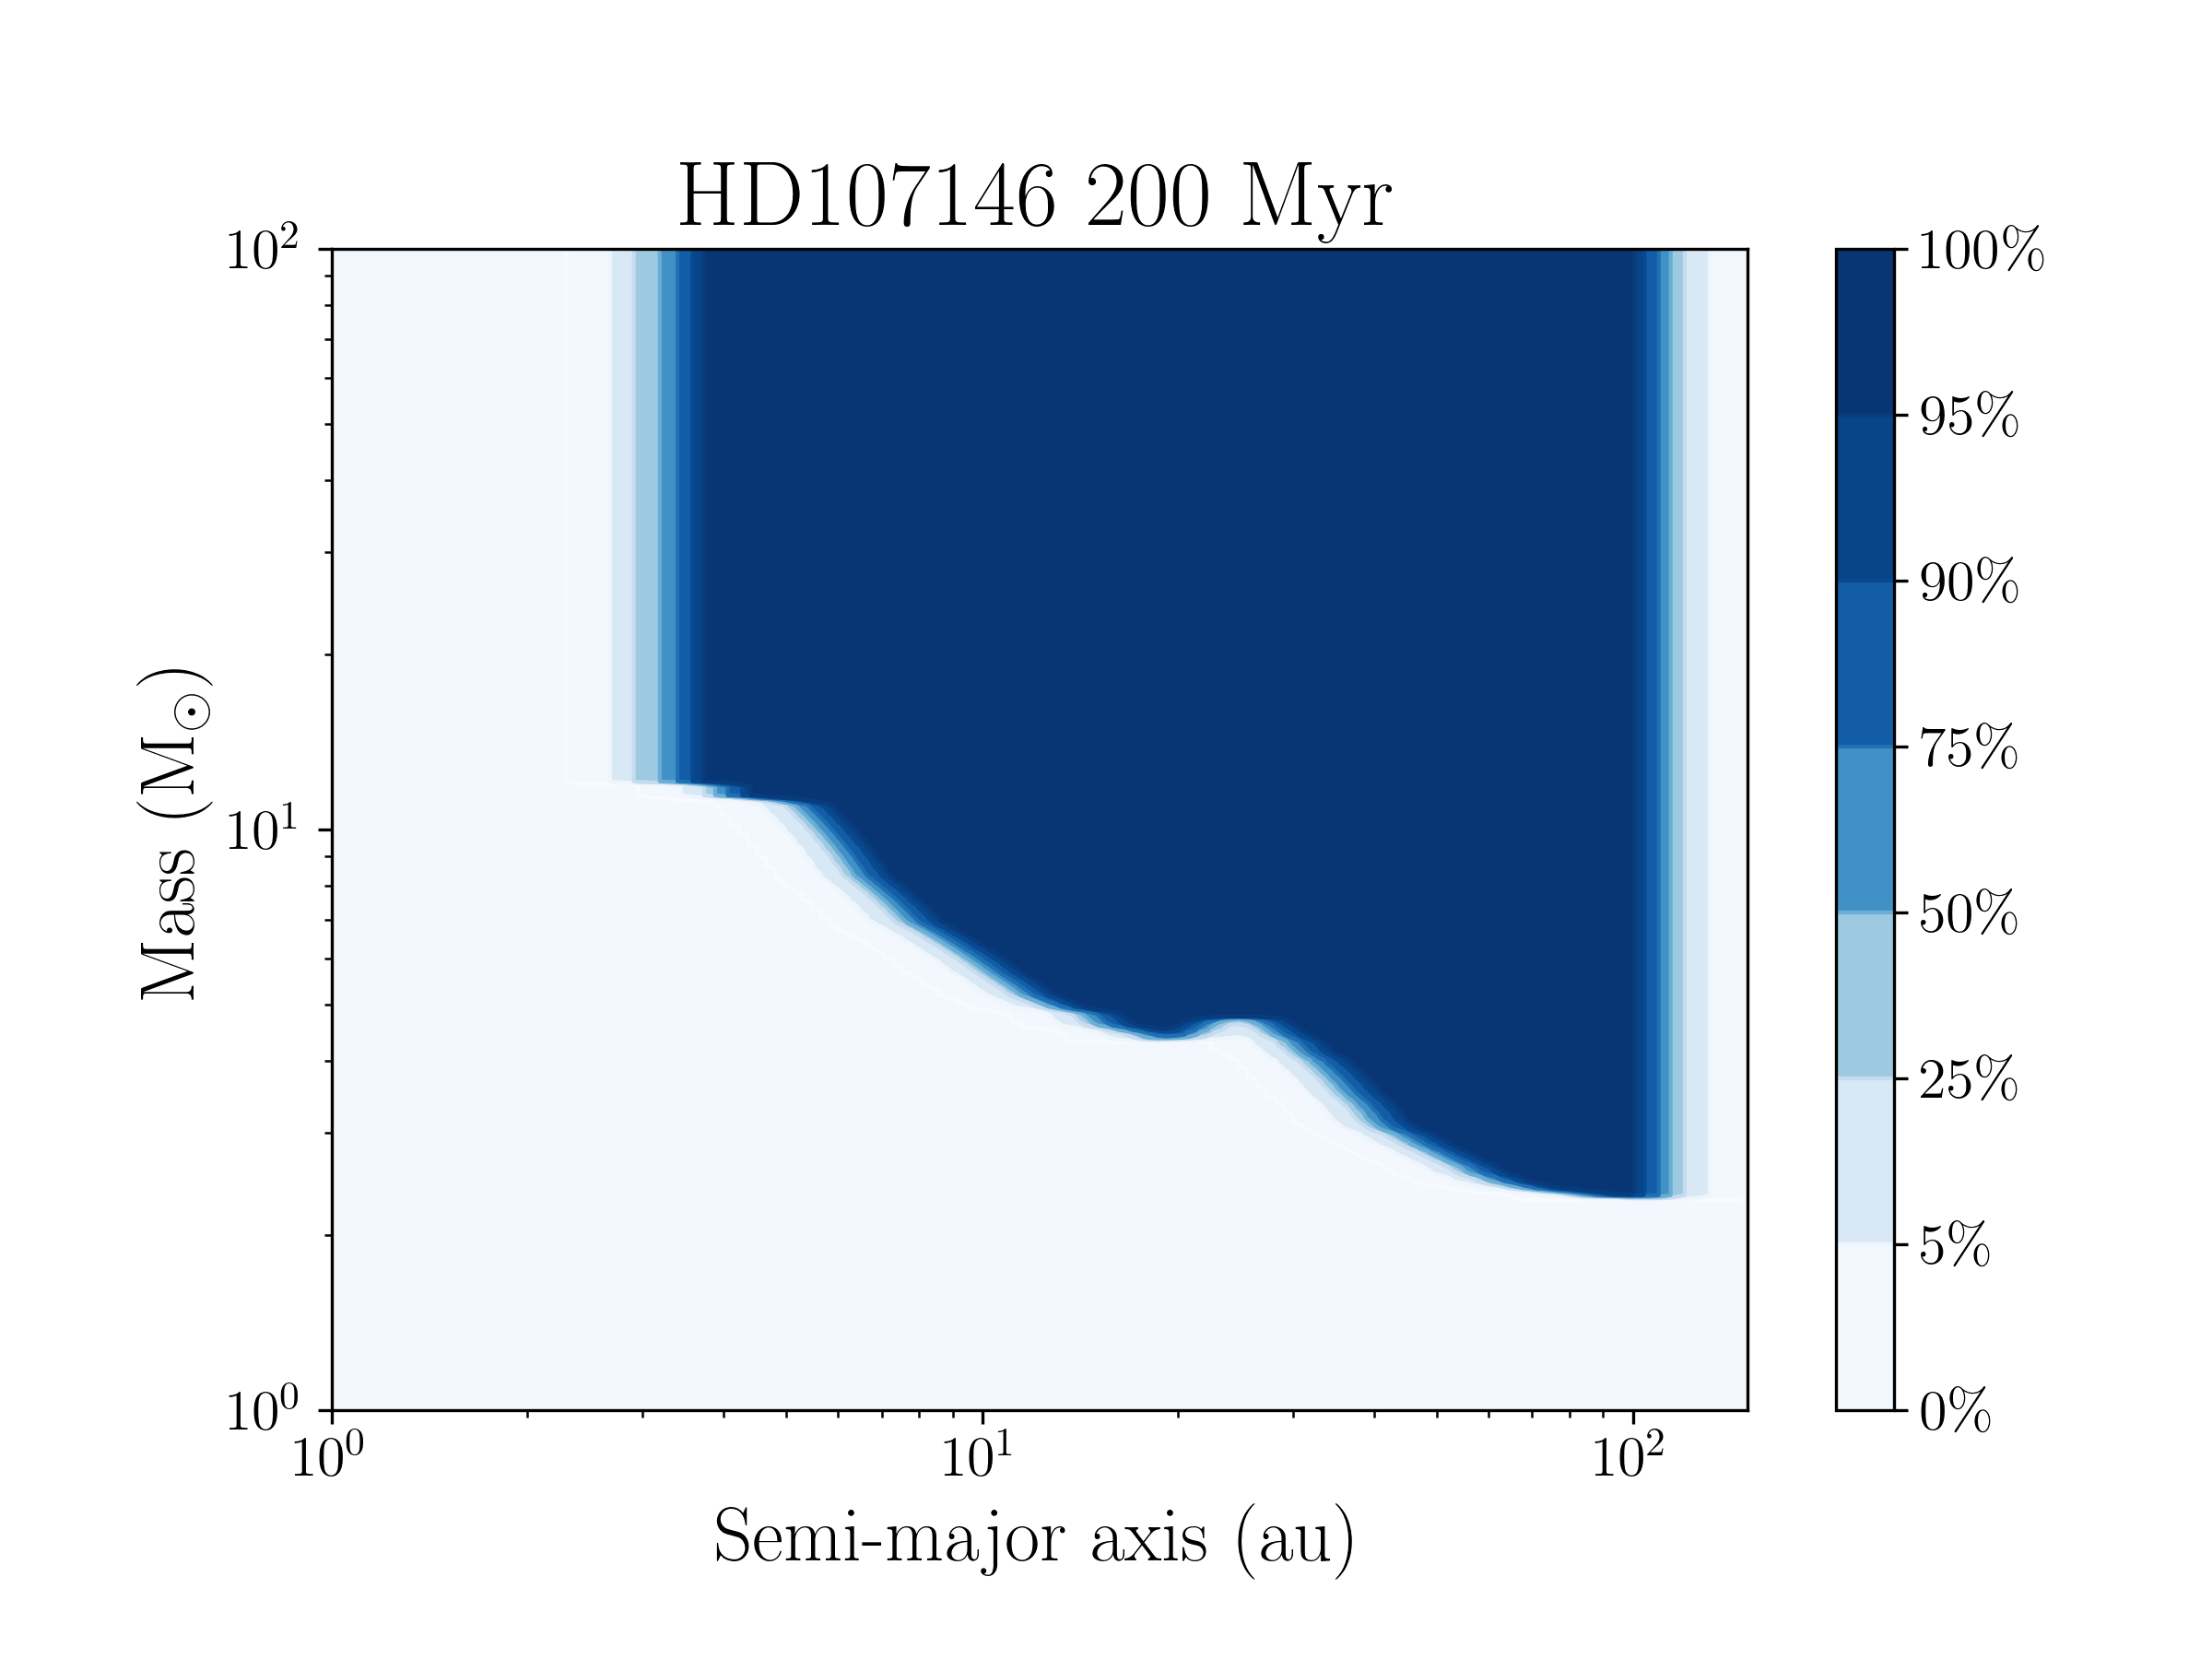
In Figure 11 we show the results for both targets. In order to
take into account the uncertainty on the age values, two different DMC runs were
performed for each target, using the minimum and maximum values of the mass
limits, respectively.
5.2.2 Comparison with available radial velocity measurements
While MESS was limited in its use to Direct Imaging data333With the exception of its MESS2 incarnation, which was designed to produce combined RV+DI detection probability maps (see Lannier et al. 2017, for details), the DMC can also be used to draw similar constraints using other kind of data sets, including radial velocity (RV) ones. Given the provided RV time series, the DMC uses the Local Power Analysis (LPA) approach described by Meunier et al. (2012) to estimate, for each mass and separation in the grid, for what fraction of the generated orbital sets the signal generated by the companion would be compatible with the data.
Once the computation is completed, the code outputs a 2D detection probability map analogous to the ones produced with the DI module as well as a 1D detection limit showing the minimum value of the companion mass detectable with a given confidence level. The latter, which is roughly equivalent to extracting a specific detection probability contour from the 2D map, is the standard approach used to obtain RV detection limits in the past. The advantage of retaining the 2D information is that the resulting RV probability map can then be easily combined with the output of the DI module444One should note that the current version of DMC does not allow for a truly accurate estimate of the sensitivity achieved combining the two data sets, like the one performed in Lannier et al. (2017). The method used only allows for a rough estimate of the combined probability. A new module analogous to the MESS2 will be available in the future..
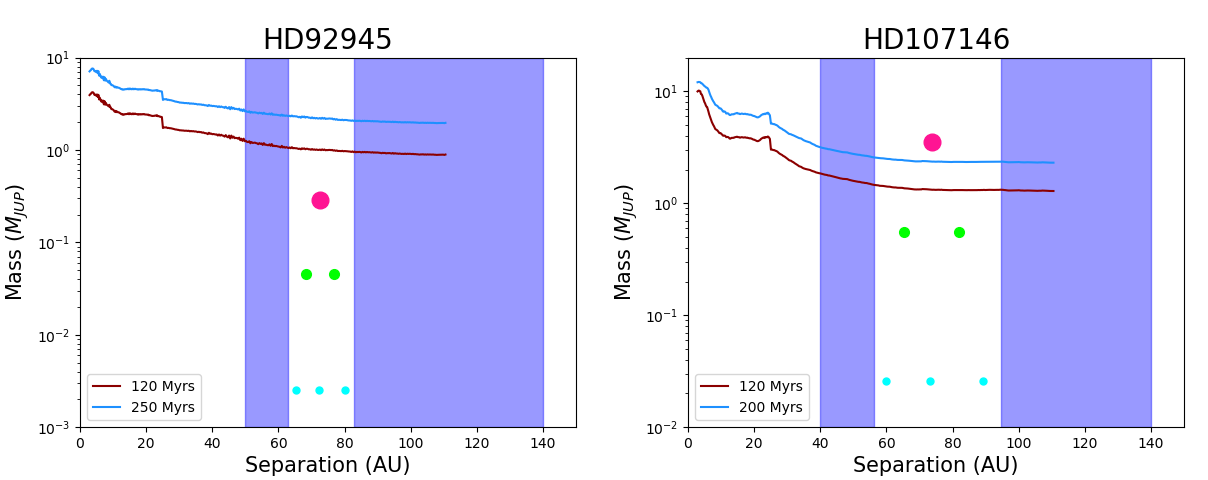
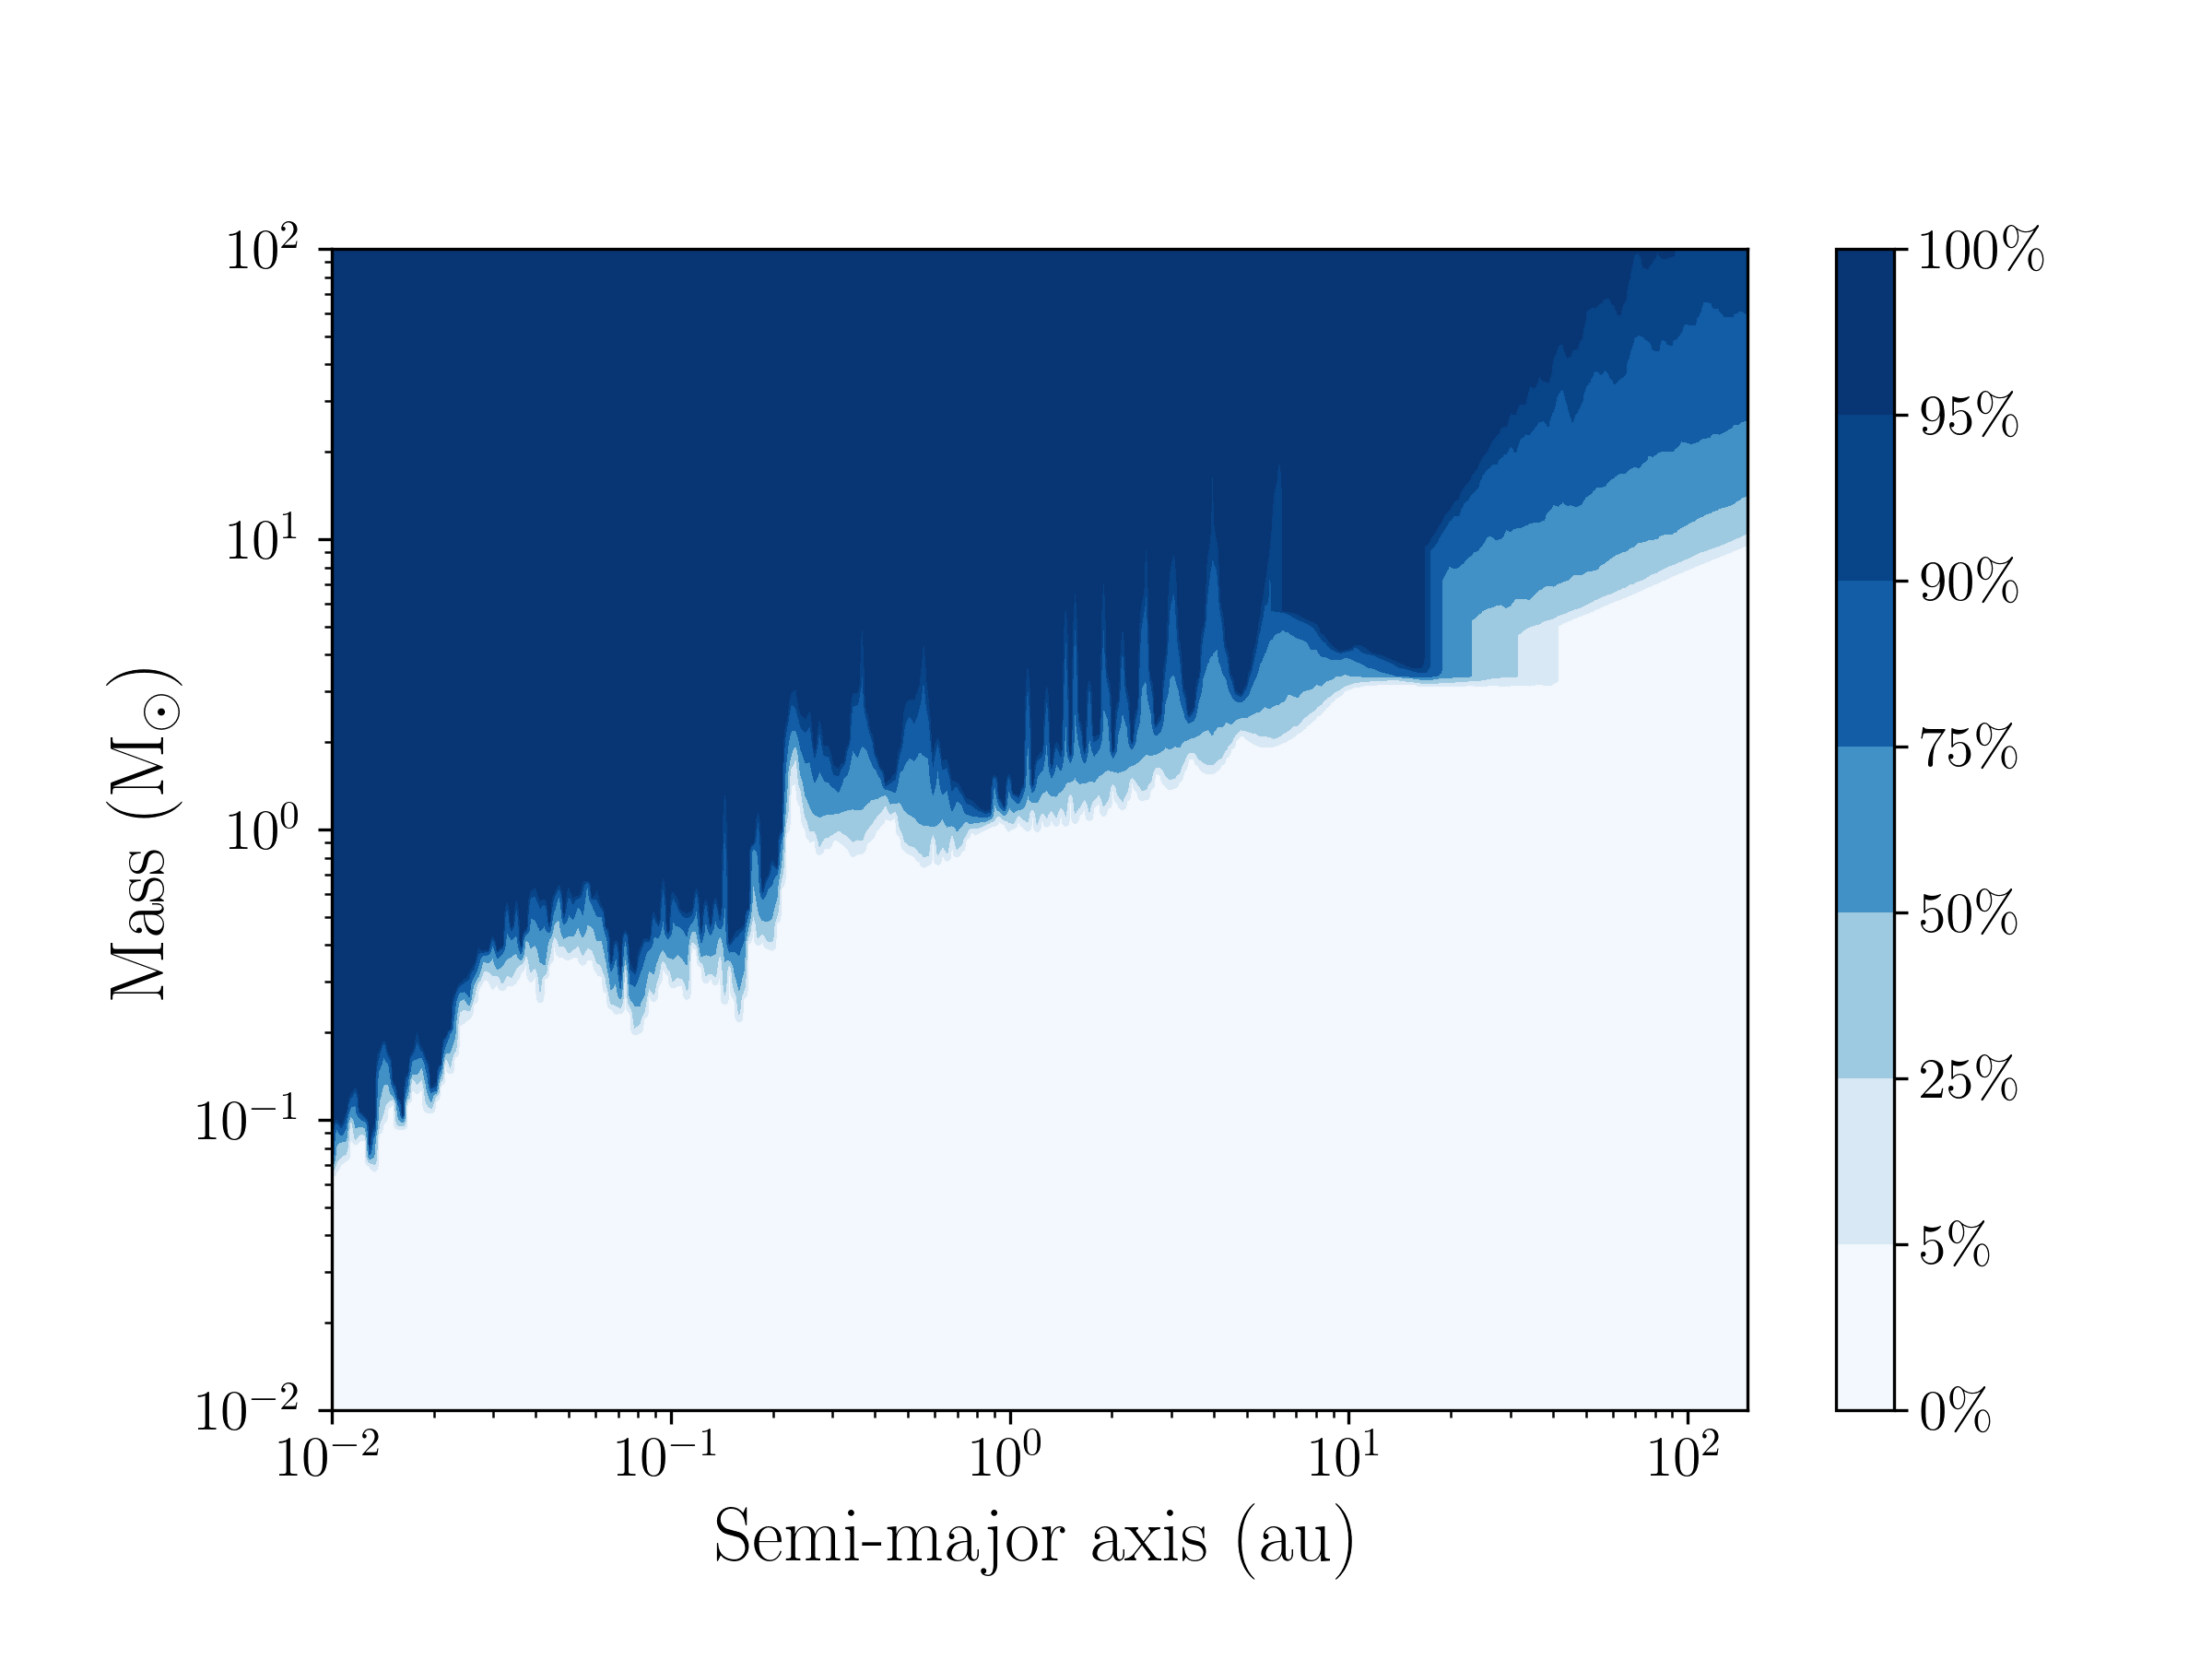
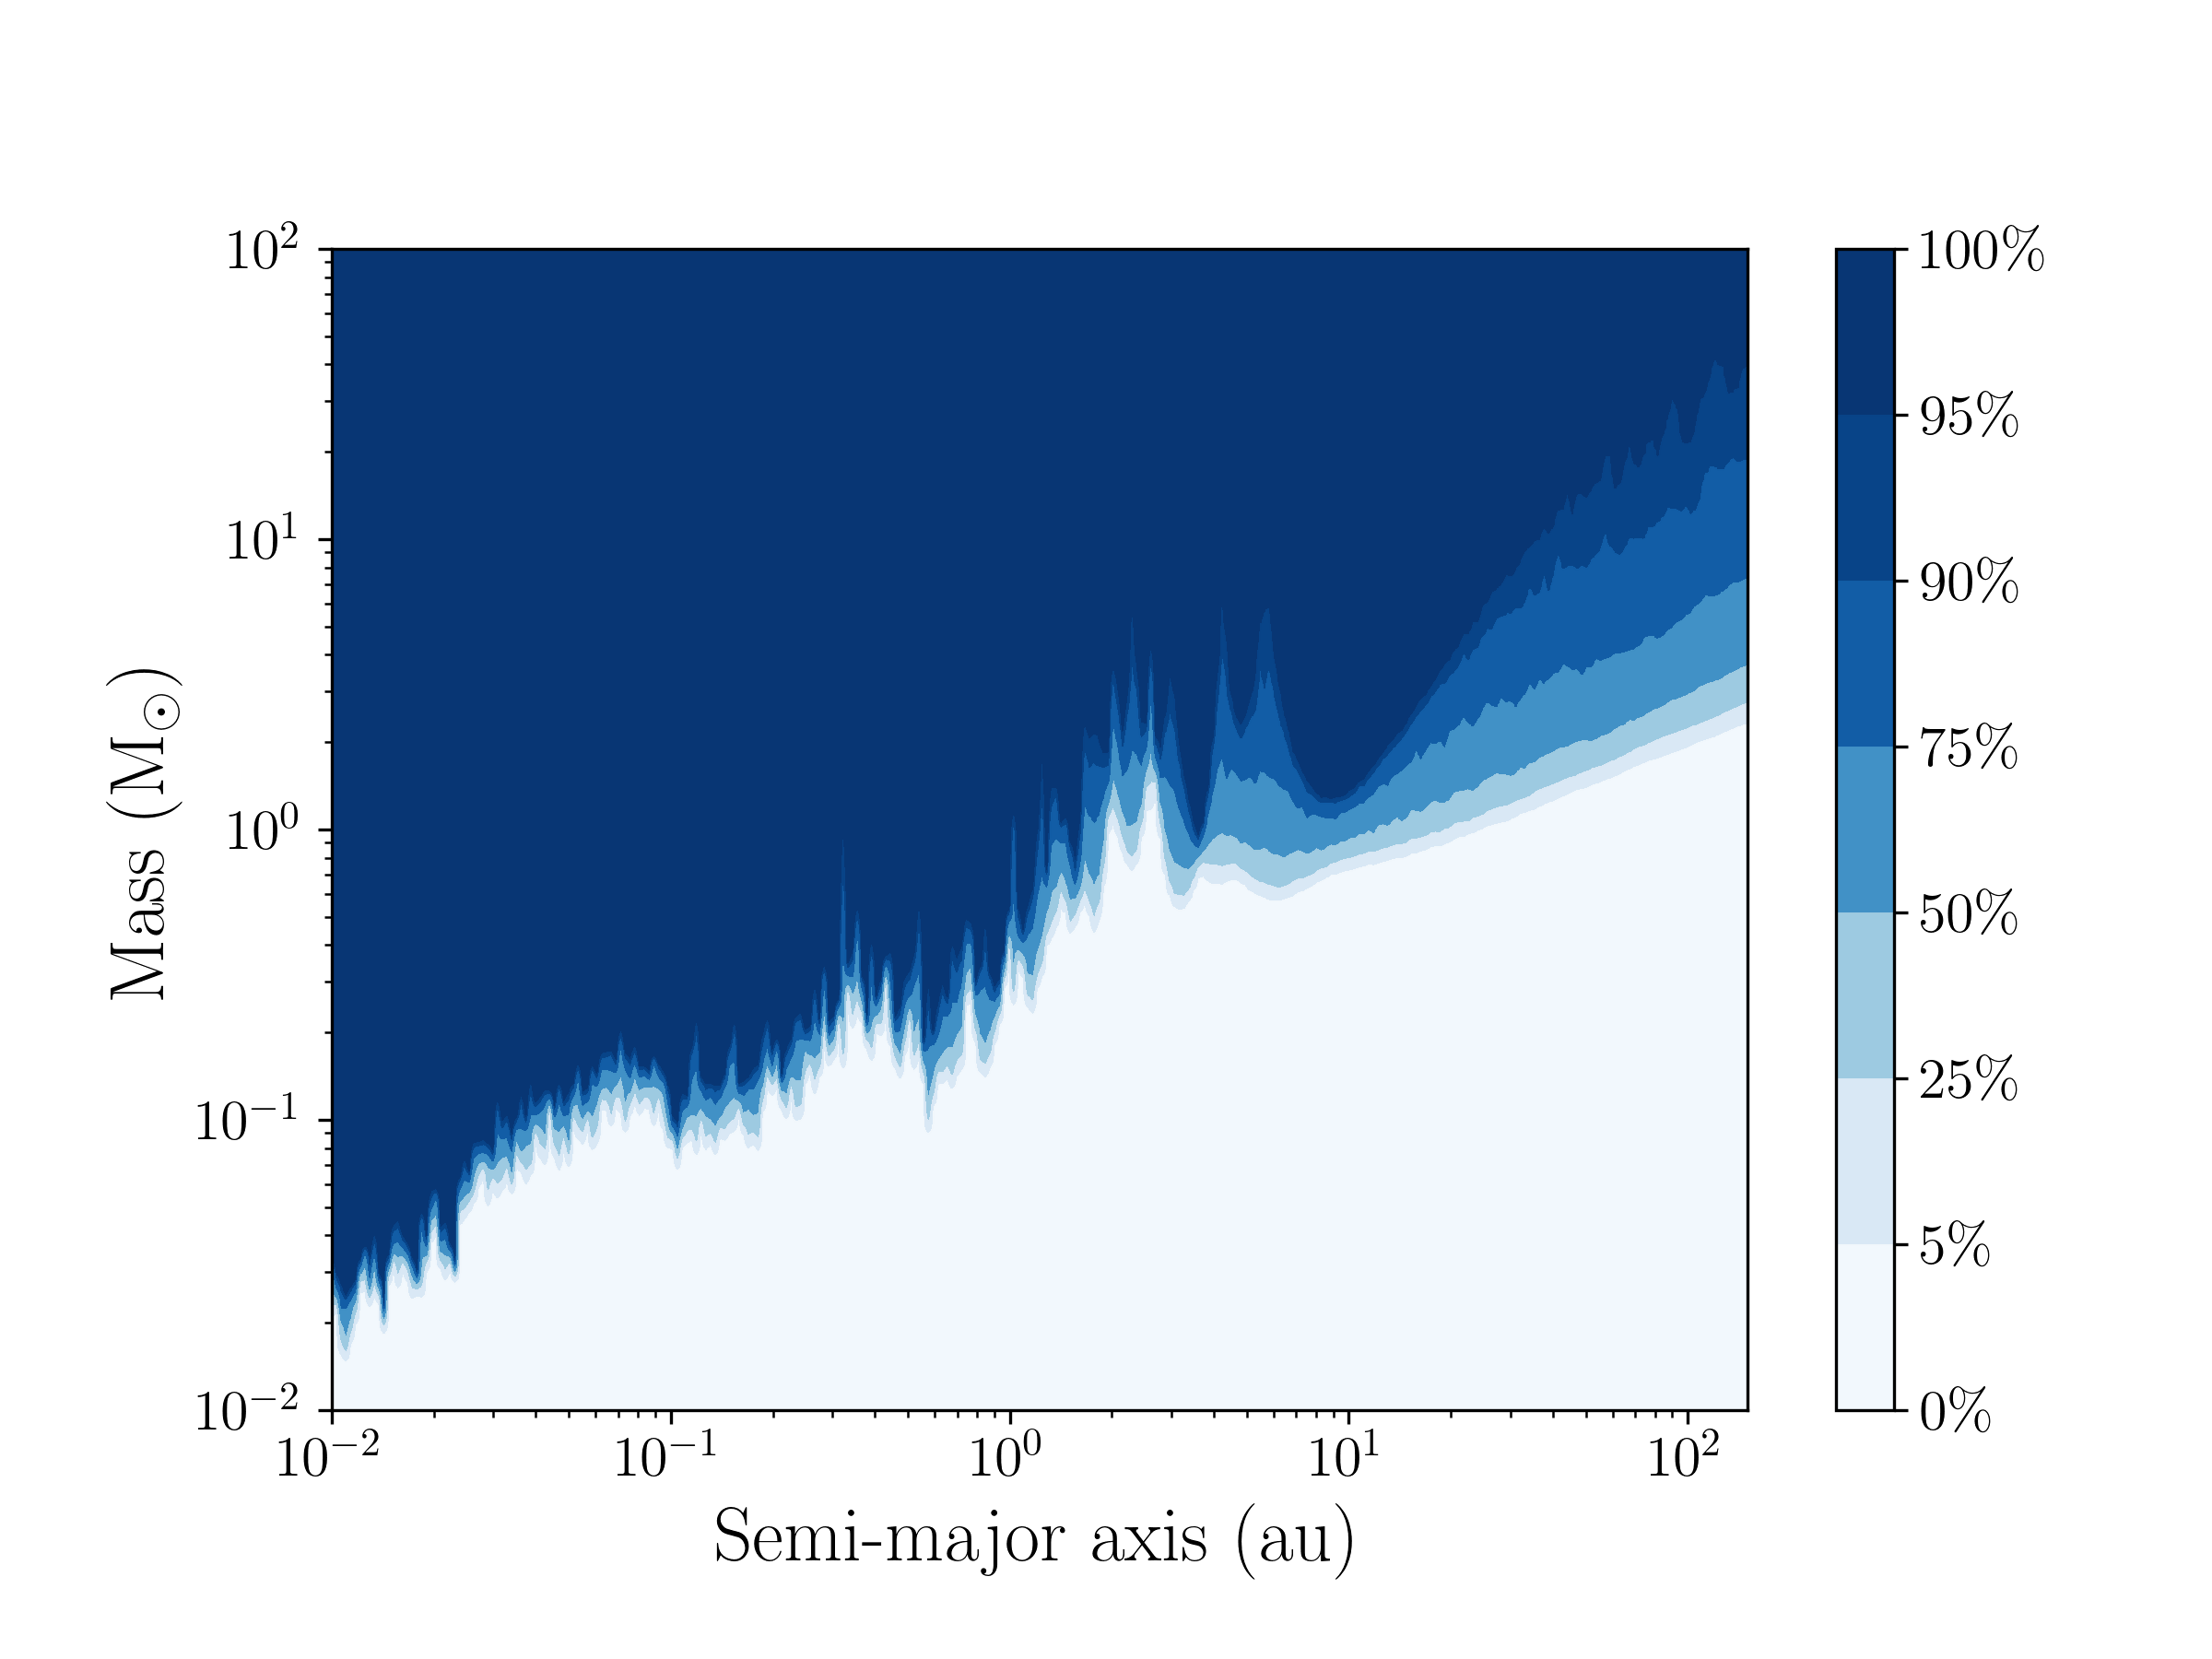
We therefore run the RV-DMC on the available data for our two targets, using the same mass/semi-major axis grid as well as the same assumptions for the orbital parameter generation. The two sets of maps were then combined by considering, for each point in the grid, the best value of the probability. The resulting combined map, shown in Figure 12, then contains the probability that a companion at a given mass and semi-major axis is detected using at least one of the two methods.
5.2.3 Comparison with PMa results
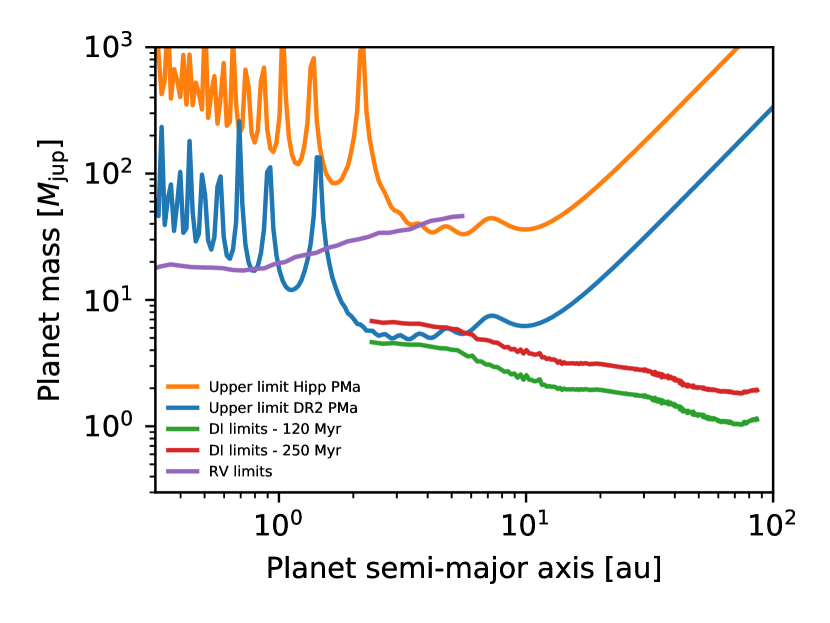
As explained in Section 3.3 PMa data are available for both targets and they can be used to calculate the mass of a possible object that cause the anomaly as function of the separation from the host star exploiting Equation 15 in (Kervella et al. 2019). For HD 92945 no clear evidence of the presence of a companion emerges from these data. We can then use these data just to put upper limits on the masses of possible companions. They are however comparable with those obtained through RV and DI only at separations between 1 and 10 au while they are clearly worse at lower and larger separations. This can be easily seen in Figure 13 where the upper limits from the PMa measurements obtained using data from the Hipparcos and the Gaia DR2 epochs (orange and blue lines; labeled as upper limit Hipp PMa and upper limit DR2 PMa) are compared with mass limits from RV data (violet line) and from DI data (red and green lines).
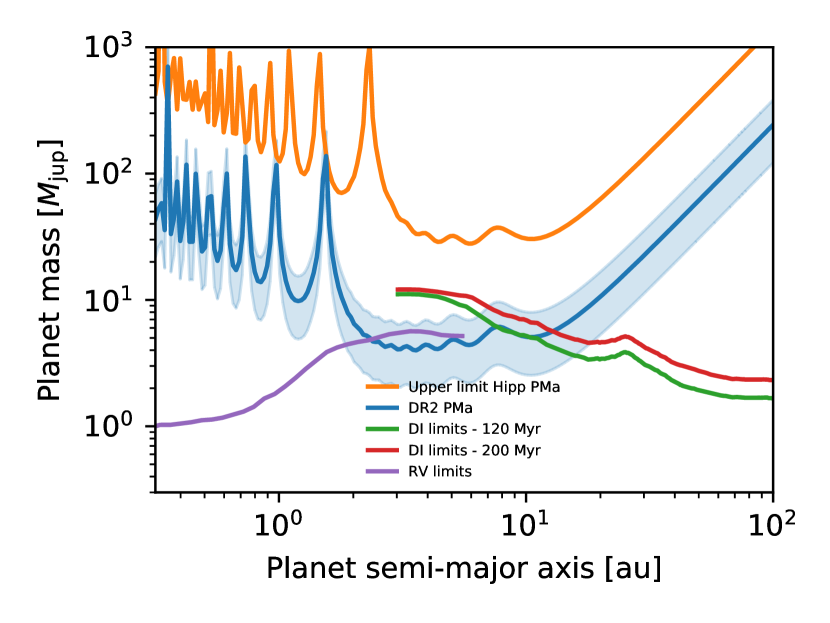
Different is the situation for HD 107146 where a 3.4 PMa obtained at the Gaia DR2 epoch strongly suggests the presence of a companion. Using Equation 15 in Kervella et al. (2019) and a Monte-Carlo approach as in Marino et al. (2020) we can estimate the mass of the companion responsible for the PMa, as a function of the semi-major axis. This is represented by the blue line in Figure 14 and is labeled as DR2 PMa while the shaded blue area surrounding this line is the 99.7% confidence interval. The 95% 1D mass limits obtained with the RV module of Exo-DMC (violet line) combined with the mass limits from the DI data (red and green lines) allow to exclude large part of the possible masses and separations for this putative object. In this way, if it exists, it can just be at separations between 2-7 au and with a mass of 2-5 MJup. Future imaging instruments operating at extremely large telescopes (ELT) should be able to image such a planet that will also be clearly detected through the next Gaia data releases. It has to be noted that the presence of an asteroid belt at a separation between 5 and 15 au has been inferred thanks to Spitzer data (Morales et al. 2011; Kennedy & Wyatt 2014). If confirmed, the proposed companion would lay just inside the position of this belt and its presence could explain the formation of the belt with the pressure bump due to the presence of such massive planet.
6 Conclusion
We presented the results of the SPHERE observations of the stars HD 92945 and HD 107146. Both these stars are known to host a debris disk with an outer planetesimals belt containing a wide gap. Moreover, they share similar ages. Given the morphology of these gaps, it was proposed that these could have been carved by one or more planetary mass companion, residing inside the gap for both systems (Ricci et al. 2015; Marino et al. 2018) or possibly interior to the disk for HD 92945 since its gap appears marginally asymmetric (Marino et al. 2019). The capability to put strong constraints on the mass of possible companions around these objects can help to better understand the formation mechanisms of these structures. Moreover, due to the paucity of gas in these disks (Marino et al. 2018, 2019), the problem of strong absorption that can be experienced for younger and gas-rich disks (like e.g. the case of HD 163296; Mesa et al. 2019a) should be less important making more reliable the limits obtained around these objects. On the other hand, the older ages of these objects with respect to systems hosting protoplanetary disks makes harder to detect low mass planets.
In any case, the mass limits that we obtain from our observations are much lower than obtained before with previous DI observations. Indeed, for both the systems considered here, we were able to put very tight mass limits of 1-2 MJup according to the age considered for the system. For what concerns the inner region with respect to the planetesimal belt, we can reach for both systems mass limits lower than 4-5 MJup for the range of possible age considered. These limits are enough to exclude some of the proposed configurations of inner planets that could explain the structure of the gap.
While the contrast obtained with SPHERE is still not enough to confirm or to exclude large part of the range of possible companion masses that could explain the shape of the planetesimal belt around HD 92945 and HD 107146, the mass limits much tighter than those obtained in past survey, can help in limiting the possible configurations of these planetary systems. This data demonstrate the potentiality of the direct imaging in the understanding of the structure of planetary systems. To fully exploit this potentiality, however, we will probably need to wait for future instrumentation reaching higher contrasts and larger spatial resolution. As an example the external planets responsible of carving the gap should be recoverable using the JWST NirCAM operating in coronagraphic observing mode in the wavelength range 3-5 m as at separations of some tens of au it should be able to image companions down to the Saturn mass (Beichman et al. 2012).
At low separations from the star, DI observations are not able to put tight mass limits. Moreover, the presence of the coronagraph hides the inner region of the planetary system. We then used both PMa and RV data to obtain informations on the inner regions of these systems. As for HD 92945, no clear signal is obtained from PMa and we can just put upper limits that are however comparable to those obtained through RV data (some tens of MJup) and through DI at higher separations. Much more interesting is the situation for HD 107146 where there is a tentative 3.4 PMa indicative of the presence of a companion. Coupling this result with the limits coming from RV and DI we are able to constrain both the separation (2-6 au) and the mass (2-5 MJup) of such object. We note here that future ELT coronagraphic instruments will possess the angular resolution requested to detect such an object while the next Gaia releases should be able to further confirm its existence.
Acknowledgments
Based on observations collected at the European Organisation for Astronomical Research in the Southern Hemisphere under ESO programme 095.C-0374(A), 1100.C-0481(D), 074.C-0037(A), 075.C-0202(A) and 192.C-0224(B).Partly Based on observations collected with the SOPHIE spectrograph on the 1.93 m telescope at Observatoire de Haute-Provence (CNRS), France under program 07A.PNP.CONS, 08A.PNP.CONS, 12A.DISC.WATS, 13A.PNP.DELF, 14A.PNP.LAGR, 14B.PNP.LAGR. SPHERE is an instrument designed and built by a consortium consisting of IPAG (Grenoble, France), MPIA (Heidelberg, Germany), LAM (Marseille, France), LESIA (Paris, France), Laboratoire Lagrange (Nice, France), INAF–Osservatorio di Padova (Italy), Observatoire de Genève (Switzerland), ETH Zurich (Switzerland), NOVA (Netherlands), ONERA (France) and ASTRON (Netherlands) in collaboration with ESO. SPHERE was funded by ESO, with additional contributions from CNRS (France), MPIA (Germany), INAF (Italy), FINES (Switzerland) and NOVA (Netherlands). SPHERE also received funding from the European Commission Sixth and Seventh Framework Programmes as part of the Optical Infrared Coordination Network for Astronomy (OPTICON) under grant number RII3-Ct-2004-001566 for FP6 (2004–2008), grant number 226604 for FP7 (2009–2012) and grant number 312430 for FP7 (2013–2016). We also acknowledge financial support from the Programme National de Planétologie (PNP) and the Programme National de Physique Stellaire (PNPS) of CNRS-INSU in France. This work has also been supported by a grant from the French Labex OSUG@2020 (Investissements d’avenir – ANR10 LABX56). The project is supported by CNRS, by the Agence Nationale de la Recherche (ANR-14-CE33-0018). It has also been carried out within the frame of the National Centre for Competence in Research PlanetS supported by the Swiss National Science Foundation (SNSF).
This work has made use of data from the European Space Agency (ESA) mission Gaia (https://www.cosmos.esa.int/gaia), processed by the Gaia Data Processing and Analysis Consortium (DPAC, https://www.cosmos.esa.int/web/gaia/dpac/consortium). Funding for the DPAC has been provided by national institutions, in particular the institutions participating in the Gaia Multilateral Agreement. This research has made use of the SIMBAD database, operated at CDS, Strasbourg, France.
D.M., V.D.O., R.G., S.D. acknowledge support from the “Progetti Premiali” funding scheme of the Italian Ministry of Education, University, and Research and from the ASI-INAF agreement n.2018-16-HH.0. S.M. is supported by a research fellowship from Jesus College, University of Cambridge. M.B. acknowledges funding by the UK Science and Technology Facilities Council (STFC) grant no. ST/M001229/1. T.H. acknowledges support from the European Research Council under the Horizon 2020 Framework Program via the ERC Advanced Grant Origins 83 24 28.
Data Availability
The data underlying this article will be shared on reasonable request to the corresponding author.
References
- ALMA Partnership et al. (2015) ALMA Partnership et al., 2015, ApJ, 808, L3
- Allard et al. (2003) Allard F., Guillot T., Ludwig H.-G., Hauschildt P. H., Schweitzer A., Alexand er D. R., Ferguson J. W., 2003, in Martín E., ed., IAU Symposium Vol. 211, Brown Dwarfs. p. 325
- Apai et al. (2008) Apai D., et al., 2008, ApJ, 672, 1196
- Ardila et al. (2004) Ardila D. R., et al., 2004, in American Astronomical Society Meeting Abstracts. p. 127.08
- Baranne et al. (1996) Baranne A., et al., 1996, A&AS, 119, 373
- Beichman et al. (2012) Beichman C. A., Rieke M., Eisenstein D., Greene T. P., Krist J., McCarthy D., Meyer M., Stansberry J., 2012, in Space Telescopes and Instrumentation 2012: Optical, Infrared, and Millimeter Wave. p. 84422N, doi:10.1117/12.925447
- Bell et al. (2015) Bell C. P. M., Mamajek E. E., Naylor T., 2015, MNRAS, 454, 593
- Beuzit et al. (2019) Beuzit J. L., et al., 2019, A&A, 631, A155
- Biller et al. (2013) Biller B. A., et al., 2013, ApJ, 777, 160
- Blanco-Cuaresma (2019) Blanco-Cuaresma S., 2019, MNRAS, 486, 2075
- Blanco-Cuaresma et al. (2014) Blanco-Cuaresma S., Soubiran C., Heiter U., Jofré P., 2014, A&A, 569, A111
- Boccaletti et al. (2015) Boccaletti A., et al., 2015, Nature, 526, 230
- Boccaletti et al. (2019) Boccaletti A., et al., 2019, A&A, 625, A21
- Bonavita (2020) Bonavita M., 2020, Exo-DMC: Exoplanet Detection Map Calculator (ascl:2010.008)
- Bonavita et al. (2012) Bonavita M., Chauvin G., Desidera S., Gratton R., Janson M., Beuzit J. L., Kasper M., Mordasini C., 2012, A&A, 537, A67
- Bonavita et al. (2013) Bonavita M., de Mooij E. J. W., Jayawardhana R., 2013, PASP, 125, 849
- Bonnefoy et al. (2017) Bonnefoy M., et al., 2017, A&A, 597, L7
- Booth et al. (2016) Booth M., et al., 2016, MNRAS, 460, L10
- Bouchy & Sophie Team (2006) Bouchy F., Sophie Team 2006, in Arnold L., Bouchy F., Moutou C., eds, Tenth Anniversary of 51 Peg-b: Status of and prospects for hot Jupiter studies. pp 319–325
- Bouchy et al. (2009) Bouchy F., et al., 2009, A&A, 505, 853
- Bouchy et al. (2013) Bouchy F., Díaz R. F., Hébrard G., Arnold L., Boisse I., Delfosse X., Perruchot S., Santerne A., 2013, A&A, 549, A49
- Burggraaff et al. (2018) Burggraaff O., et al., 2018, A&A, 617, A32
- Castelli & Kurucz (2003) Castelli F., Kurucz R. L., 2003, in Piskunov N., Weiss W. W., Gray D. F., eds, IAU Symposium Vol. 210, Modelling of Stellar Atmospheres. p. A20 (arXiv:astro-ph/0405087)
- Chauvin et al. (2017) Chauvin G., et al., 2017, in Reylé C., Di Matteo P., Herpin F., Lagadec E., Lançon A., Meliani Z., Royer F., eds, SF2A-2017: Proceedings of the Annual meeting of the French Society of Astronomy and Astrophysics. p. Di
- Chen et al. (2005) Chen C. H., et al., 2005, ApJ, 634, 1372
- Chen et al. (2012) Chen C. H., Pecaut M., Mamajek E. E., Su K. Y. L., Bitner M., 2012, ApJ, 756, 133
- Claudi et al. (2008) Claudi R. U., et al., 2008, in Proc. SPIE. p. 70143E, doi:10.1117/12.788366
- D’Orazi et al. (2020) D’Orazi V., et al., 2020, A&A, 633, A38
- Delorme et al. (2017) Delorme P., et al., 2017, in Reylé C., Di Matteo P., Herpin F., Lagadec E., Lançon A., Meliani Z., Royer F., eds, SF2A-2017: Proceedings of the Annual meeting of the French Society of Astronomy and Astrophysics. p. Di (arXiv:1712.06948)
- Dent et al. (2014) Dent W. R. F., et al., 2014, Science, 343, 1490
- Desidera et al. (2015) Desidera S., et al., 2015, A&A, 573, A126
- Dohlen et al. (2008) Dohlen K., et al., 2008, in Proc. SPIE. p. 70143L, doi:10.1117/12.789786
- Engler et al. (2019) Engler N., et al., 2019, A&A, 622, A192
- Ertel et al. (2011) Ertel S., Wolf S., Metchev S., Schneider G., Carpenter J. M., Meyer M. R., Hillenbrand L. A., Silverstone M. D., 2011, A&A, 533, A132
- Fedele et al. (2018) Fedele D., et al., 2018, A&A, 610, A24
- Feldt et al. (2017) Feldt M., et al., 2017, A&A, 601, A7
- Gagné et al. (2018) Gagné J., et al., 2018, ApJ, 856, 23
- Gaia Collaboration et al. (2016) Gaia Collaboration et al., 2016, A&A, 595, A1
- Gaia Collaboration et al. (2018) Gaia Collaboration et al., 2018, A&A, 616, A1
- Galicher et al. (2018) Galicher R., et al., 2018, A&A, 615, A92
- Gladman (1993) Gladman B., 1993, Icarus, 106, 247
- Golimowski et al. (2011) Golimowski D. A., et al., 2011, AJ, 142, 30
- Haffert et al. (2019) Haffert S. Y., Bohn A. J., de Boer J., Snellen I. A. G., Brinchmann J., Girard J. H., Keller C. U., Bacon R., 2019, Nature Astronomy, 3, 749
- Harlan & Taylor (1970) Harlan E. A., Taylor D. C., 1970, AJ, 75, 507
- Herbst et al. (2002) Herbst W., Bailer-Jones C. A. L., Mundt R., Meisenheimer K., Wackermann R., 2002, A&A, 396, 513
- Hogg et al. (2010) Hogg D. W., Myers A. D., Bovy J., 2010, ApJ, 725, 2166
- Isella et al. (2018) Isella A., et al., 2018, ApJ, 869, L49
- Janson et al. (2013) Janson M., et al., 2013, ApJ, 773, 73
- Kalas et al. (2005) Kalas P., Graham J. R., Clampin M., 2005, Nature, 435, 1067
- Kaufer et al. (1999) Kaufer A., Stahl O., Tubbesing S., Nørregaard P., Avila G., Francois P., Pasquini L., Pizzella A., 1999, The Messenger, 95, 8
- Kennedy & Wyatt (2014) Kennedy G. M., Wyatt M. C., 2014, MNRAS, 444, 3164
- Keppler et al. (2018) Keppler M., et al., 2018, A&A, 617, A44
- Kervella et al. (2019) Kervella P., Arenou F., Mignard F., Thévenin F., 2019, A&A, 623, A72
- Lagrange et al. (2009) Lagrange A. M., et al., 2009, A&A, 493, L21
- Lamm et al. (2004) Lamm M. H., Bailer-Jones C. A. L., Mundt R., Herbst W., Scholz A., 2004, A&A, 417, 557
- Lannier et al. (2017) Lannier J., et al., 2017, A&A, 603, A54
- Lazzoni et al. (2018) Lazzoni C., et al., 2018, A&A, 611, A43
- Lo Curto et al. (2015) Lo Curto G., et al., 2015, The Messenger, 162, 9
- Lombart et al. (2020) Lombart M., et al., 2020, A&A, 639, A54
- Lovis et al. (2006) Lovis C., et al., 2006, in Society of Photo-Optical Instrumentation Engineers (SPIE) Conference Series. p. 62690P, doi:10.1117/12.669991
- MacGregor et al. (2019) MacGregor M. A., et al., 2019, ApJ, 877, L32
- Macintosh et al. (2006) Macintosh B., et al., 2006, in Proc. SPIE. p. 62720L, doi:10.1117/12.672430
- Mamajek & Hillenbrand (2008) Mamajek E. E., Hillenbrand L. A., 2008, ApJ, 687, 1264
- Marino et al. (2018) Marino S., et al., 2018, MNRAS, 479, 5423
- Marino et al. (2019) Marino S., Yelverton B., Booth M., Faramaz V., Kennedy G. M., Matrà L., Wyatt M. C., 2019, MNRAS, 484, 1257
- Marino et al. (2020) Marino S., et al., 2020, MNRAS, 498, 1319
- Marois et al. (2006) Marois C., Lafrenière D., Doyon R., et al. 2006, ApJ, 641, 556
- Marois et al. (2008) Marois C., Macintosh B., Barman T., Zuckerman B., Song I., Patience J., Lafrenière D., Doyon R., 2008, Science, 322, 1348
- Marois et al. (2010) Marois C., Zuckerman B., Konopacky Q. M., Macintosh B., Barman T., 2010, Nature, 468, 1080
- Marois et al. (2014) Marois C., Correia C., Galicher R., Ingraham P., Macintosh B., Currie T., De Rosa R., 2014, in Proc. SPIE. p. 91480U (arXiv:1407.2555), doi:10.1117/12.2055245
- Marshall et al. (2014) Marshall J. P., et al., 2014, A&A, 565, A15
- Marzari (2014) Marzari F., 2014, MNRAS, 442, 1110
- Matthews et al. (2018) Matthews E., et al., 2018, MNRAS, 480, 2757
- Mawet et al. (2014) Mawet D., et al., 2014, ApJ, 792, 97
- Meibom et al. (2009) Meibom S., Mathieu R. D., Stassun K. G., 2009, ApJ, 695, 679
- Meibom et al. (2011) Meibom S., Mathieu R. D., Stassun K. G., Liebesny P., Saar S. H., 2011, ApJ, 733, 115
- Mesa et al. (2015) Mesa D., et al., 2015, A&A, 576, A121
- Mesa et al. (2019a) Mesa D., et al., 2019a, MNRAS, 488, 37
- Mesa et al. (2019b) Mesa D., et al., 2019b, A&A, 632, A25
- Meshkat et al. (2015) Meshkat T., Bailey V. P., Su K. Y. L., Kenworthy M. A., Mamajek E. E., Hinz P. M., Smith P. S., 2015, ApJ, 800, 5
- Meunier et al. (2012) Meunier N., Lagrange A. M., De Bondt K., 2012, A&A, 545, A87
- Milli et al. (2012) Milli J., Mouillet D., Lagrange A. M., Boccaletti A., Mawet D., Chauvin G., Bonnefoy M., 2012, A&A, 545, A111
- Morales et al. (2011) Morales F. Y., Rieke G. H., Werner M. W., Bryden G., Stapelfeldt K. R., Su K. Y. L., 2011, ApJ, 730, L29
- Morrison & Malhotra (2015) Morrison S., Malhotra R., 2015, ApJ, 799, 41
- Müller et al. (2018) Müller A., et al., 2018, A&A, 617, L2
- Nesvold & Kuchner (2015) Nesvold E. R., Kuchner M. J., 2015, ApJ, 798, 83
- Nielsen et al. (2019) Nielsen E. L., et al., 2019, AJ, 158, 13
- Nordström et al. (2004) Nordström B., et al., 2004, A&A, 418, 989
- Noyes et al. (1984) Noyes R. W., Hartmann L. W., Baliunas S. L., Duncan D. K., Vaughan A. H., 1984, ApJ, 279, 763
- Pavlov et al. (2008) Pavlov A., Feldt M., Henning T., 2008, in Argyle R. W., Bunclark P. S., Lewis J. R., eds, Astronomical Society of the Pacific Conference Series Vol. 394, Astronomical Data Analysis Software and Systems XVII. p. 581
- Pearce & Wyatt (2014) Pearce T. D., Wyatt M. C., 2014, MNRAS, 443, 2541
- Pearce & Wyatt (2015) Pearce T. D., Wyatt M. C., 2015, MNRAS, 453, 3329
- Pecaut & Mamajek (2013) Pecaut M. J., Mamajek E. E., 2013, ApJS, 208, 9
- Perrot et al. (2016) Perrot C., et al., 2016, A&A, 590, L7
- Perruchot et al. (2008) Perruchot S., et al., 2008, in Ground-based and Airborne Instrumentation for Astronomy II. p. 70140J, doi:10.1117/12.787379
- Perruchot et al. (2011) Perruchot S., et al., 2011, in Techniques and Instrumentation for Detection of Exoplanets V. p. 815115 (arXiv:1110.2256), doi:10.1117/12.892466
- Pinilla et al. (2018) Pinilla P., et al., 2018, ApJ, 859, 32
- Plavchan et al. (2009) Plavchan P., Werner M. W., Chen C. H., Stapelfeldt K. R., Su K. Y. L., Stauffer J. R., Song I., 2009, ApJ, 698, 1068
- Press et al. (2002) Press W. H., Teukolsky S. A., Vetterling W. T., Flannery B. P., 2002, Numerical recipes in C++ : the art of scientific computing
- Quillen & Faber (2006) Quillen A. C., Faber P., 2006, MNRAS, 373, 1245
- Rameau et al. (2013) Rameau J., et al., 2013, ApJ, 779, L26
- Rameau et al. (2016) Rameau J., et al., 2016, ApJ, 822, L29
- Ramírez et al. (2014) Ramírez I., et al., 2014, A&A, 572, A48
- Read et al. (2018) Read M. J., Wyatt M. C., Marino S., Kennedy G. M., 2018, MNRAS, 475, 4953
- Rebull et al. (2016) Rebull L. M., et al., 2016, AJ, 152, 113
- Ricci et al. (2015) Ricci L., Carpenter J. M., Fu B., Hughes A. M., Corder S., Isella A., 2015, ApJ, 798, 124
- Ricker et al. (2015) Ricker G. R., et al., 2015, Journal of Astronomical Telescopes, Instruments, and Systems, 1, 014003
- Roberts et al. (1987) Roberts D. H., Lehar J., Dreher J. W., 1987, AJ, 93, 968
- Scargle (1982) Scargle J. D., 1982, ApJ, 263, 835
- Sefilian et al. (2020) Sefilian A. A., Rafikov R. R., Wyatt M. C., 2020, arXiv e-prints, p. arXiv:2010.15617
- Shannon et al. (2016) Shannon A., Bonsor A., Kral Q., Matthews E., 2016, MNRAS, 462, L116
- Silverstone (2000) Silverstone M. D., 2000, PhD thesis, UNIVERSITY OF CALIFORNIA, LOS ANGELES
- Sneden (1973) Sneden C. A., 1973, PhD thesis, THE UNIVERSITY OF TEXAS AT AUSTIN.
- Song et al. (2004) Song I., Zuckerman B., Bessell M. S., 2004, ApJ, 614, L125
- Soummer et al. (2012) Soummer R., Pueyo L., Larkin J., 2012, ApJ, 755, L28
- Sousa et al. (2015) Sousa S. G., Santos N. C., Adibekyan V., Delgado-Mena E., Israelian G., 2015, A&A, 577, A67
- Strassmeier et al. (2000) Strassmeier K., Washuettl A., Granzer T., Scheck M., Weber M., 2000, A&AS, 142, 275
- Su et al. (2015) Su K. Y. L., Morrison S., Malhotra R., Smith P. S., Balog Z., Rieke G. H., 2015, ApJ, 799, 146
- Torres et al. (2006) Torres C. A. O., Quast G. R., da Silva L., de La Reza R., Melo C. H. F., Sterzik M., 2006, A&A, 460, 695
- Valenti & Fischer (2005) Valenti J. A., Fischer D. A., 2005, ApJS, 159, 141
- Vigan et al. (2010) Vigan A., Moutou C., Langlois M., Allard F., Boccaletti A., Carbillet M., Mouillet D., Smith I., 2010, MNRAS, 407, 71
- Vigan et al. (2017) Vigan A., et al., 2017, A&A, 603, A3
- Vigan et al. (2020) Vigan A., et al., 2020, arXiv e-prints, p. arXiv:2007.06573
- Wichmann et al. (2003) Wichmann R., Schmitt J. H. M. M., Hubrig S., 2003, A&A, 399, 983
- Williams et al. (2004) Williams J. P., Najita J., Liu M. C., Bottinelli S., Carpenter J. M., Hillenbrand L. A., Meyer M. R., Soderblom D. R., 2004, ApJ, 604, 414
- Wisdom (1980) Wisdom J., 1980, AJ, 85, 1122
- Wright et al. (2004) Wright J. T., Marcy G. W., Butler R. P., Vogt S. S., 2004, ApJS, 152, 261
- Wyatt (2006) Wyatt M. C., 2006, ApJ, 639, 1153
- Zheng et al. (2017) Zheng X., Lin D. N. C., Kouwenhoven M. B. N., Mao S., Zhang X., 2017, ApJ, 849, 98
- da Silva et al. (2006) da Silva L., et al., 2006, A&A, 458, 609
- van Boekel et al. (2017) van Boekel R., et al., 2017, ApJ, 837, 132
- van Leeuwen (2007) van Leeuwen F., 2007, A&A, 474, 653
1INAF-Osservatorio Astronomico di Padova, Vicolo dell’Osservatorio 5, Padova, Italy, 35122-I
2Max Planck Institute for Astronomy, Königstuhl 17, 69117 Heidelberg, Germany
3Institute of Astronomy, University of Cambridge, Madingley Road, Cambridge CB3 0HA, UK
4SUPA, Institute for Astronomy, University of Edinburgh, Blackford Hill, Edinburgh EH9 3HJ, UK
5Centre for Exoplanet Science, University of Edinburgh, Edinburgh EH9 3HJ, UK
6Dipartimento di Fisica a Astronomia ”G. Galilei”, Universit’a di Padova, Via Marzolo, 8, 35121 Padova, Italy
7Center for Space and Habitability, University of Bern, Gesellschaftsstrasse 6, 3012 Bern, Switzerland
8Universidad de Santiago de Chile, Av. Libertador Bernardo O’Higgins 3363, Estacion Central, Santiago, Chile
9School of Physics and Astronomy, Monash University, Clayton campus, VIC 3800, Australia
10ETH Zurich, Institute for Particle Physics and Astrophysics, Wolfgang-Pauli-Strasse 27, CH-8093 Zurich, Switzerland
11Department of Astronomy, Stockholm University, Stockholm, Sweden
12LESIA, Observatoire de Paris, Université PSL, CNRS, Sorbonne Université, Univ. Paris Diderot, Sorbonne Paris Cité,
5 place Jules Janssen, 92195 Meudon, France
13Univ. Lyon, Univ. Lyon 1, ENS de Lyon, CNRS, CRAL UMR 5574, 69230 Saint-Genis-Laval, France
14Aix Marseille Univ., CNRS, CNES, LAM, Marseille, France
15INAF-Catania Astrophysical Observatory, Via S. Sofia, 78, 95123 Catania, Italy
16Univ. Grenoble Alpes, CNRS, IPAG, 38000 Grenoble, France
17Konkoly Observatory, Research Centre for Astronomy and Earth Sciences, Konkoly-Thege Miklós út 15-17, H-1121 Budapest, Hungary
18Instituto de Física y Astronomía, Facultad de Ciencias, Universidad de Valparaíso, Av. Gran Bretaña 1111, Playa Ancha, Valparaíso, Chile
19Núcleo Milenio Formación Planetaria - NPF, Universidad de Valparaíso, Av. Gran Bretana 1111, Playa Ancha, Valparaíso, Chile
20Geneva Observatory, University of Geneva, Chemin des Maillettes 51, CH-1290 Sauverny, Switzerland
21European Space Agency (ESA), ESA Office, Space Telescope Science Institute, 3700 San Martin Drive, Baltimore, MD 21218, USA
22European Southern Observatory, Alonso de Còrdova 3107, Vitacura, Casilla 19001, Santiago, Chile
23Nucleo de Astronomia, Facultad de Ingenieria y Ciencias, Universidad Diego Portales, Av. Ejercito 441, Santiago, Chile
24Escuela de Ingenieria Industrial, Facultad de Ingenieria y Ciencias, Universidad Diego Portales, Av. Ejercito 441, Santiago, Chile
25Departamento de Astronomía, Universidad de Chile, Casilla 36-D, Santiago
26INAF - Osservatorio Astronomico di Capodimonte, Via Salita Moiariello 16, 80131 Napoli, Italy
27STAR Institute, Université de Liege, Allee du Six Août 19c, 4000 Liege, Belgium
28University of Michigan, Astronomy Department, USA