Benchmarking Deep Graph Generative Models for Optimizing New Drug Molecules for COVID-19
Abstract.
Design of new drug compounds with target properties is a key area of research in generative modeling. We present a small drug molecule design pipeline based on graph-generative models and a comparison study of two state-of-the-art graph generative models for designing COVID-19 targeted drug candidates: 1) a variational autoencoder-based approach (VAE) that uses prior knowledge of molecules that have been shown to be effective for earlier coronavirus treatments and 2) a deep Q-learning method (DQN) that generates optimized molecules without any proximity constraints. We evaluate the novelty of the automated molecule generation approaches by validating the candidate molecules with drug-protein binding affinity models. The VAE method produced two novel molecules with similar structures to the antiretroviral protease inhibitor Indinavir that show potential binding affinity for the SARS-CoV-2 protein target 3-chymotrypsin-like protease (3CL-protease).
1. Introduction
Deep learning has demonstrated the potential to revolutionize drug design by reducing the initial search space in the early stages of discovery (You et al., 2018; Li et al., 2018; Huang et al., 2020; Zhou et al., 2020). By applying the appropriate algorithm trained on the appropriate data, novel molecules can be generated with target properties (Horwood and Noutahi, 2020; Khemchandani et al., 2020; Chenthamarakshan et al., 2020; Sivaraman et al., 2020). Here, we evaluate methods for the high-performance intelligent design of small-molecule drug candidates with anti-SARS activity, with a specific focus on SARS-CoV-2, otherwise known as COVID-19. However, discovering potential lead candidates for COVID-19 presents a challenge to the scientific community due to the long timescale of the drug development process. There is a need to accelerate the design process through AI-driven workflows for effective drug compound development.
The potential drug space is composed of over compounds, and candidates with suitable activity against specific proteins only narrows the search space to structures. Machine learning (ML) methods are actively used in this search-and-screen process. Candidate molecules generated by ML methods are passed to downstream verification via virtual high-throughput drug-protein binding techniques, drug synthesis, biological assay, and finally clinical trials (Dror et al., 2012; Batra et al., 2020; Smith and Smith, 2020).
Heterogeneous graphs provide a natural representation for small-molecule organic compounds, with nodes representing atoms in the molecular structure and edges representing bonds between the atoms (Weininger, 1990). This approach motivated the exploration of graph-generative models such as graph convolutional policy networks (You et al., 2018), variational autoencoders (Jin et al., 2018; Samanta et al., 2019; Jin et al., 2020), and variants of deep reinforcement learning (Zhou et al., 2019; Ståhl et al., 2019) for the target-driven optimization of drug molecules. The drug-molecule design task is defined as generating a set of graphs such that for each graph , , where is a property optimization function and is a user-specified threshold. Most methods optimize target molecules for properties that can be derived from the molecular structure, such as the octanol-water partition coefficient (logP) (Avdeef et al., 1998) and quantitative estimate of druglikeness (QED) (Bickerton et al., 2012a).
The focus of our work is two-fold to generate compounds for drug discovery, specifically for SARS-CoV-2. In the first similarity approach, a junction-tree based variational autoencoder (JT-VAE) (Jin et al., 2018) is trained on a database of known drug molecules that has pIC50 activity (de Wit et al., 2016). The trained VAE is used to generate novel molecules optimized towards specific properties using Bayesian optimization (BO). The second approach extends a graph-based deep reinforcement learning (DQN) method (Zhou et al., 2019) to generate molecules that are not constrained by their proximity to past anti-SARS compounds. For comparison, we use the same set of property scoring functions () as the respective optimization and reward functions for benchmarking the JT-VAE and DQN approaches.
Contributions. 1) The goal of our study is to perform multi-objective optimization for generating molecular structures by considering critical bioactivity properties that are typically not considered in structure-activity relationship approaches. Specifically, we focus on pIC50 (Sebaugh, 2011), which captures the potency of the drug towards a protease target and cannot be accurately estimated from the chemical structure (Bag and Ghorai, 2016). 2) In this context, we assembled a new protease dataset with molecules that are active against various enzymatic assays. This is considered to be one of the key properties while generating new drug molecules. These molecules are filtered from experimental pharmacology data in CheMBL, BindingDB, and ToxCat (Bento et al., 2014). 3) Finally, we validate all top-ranking molecules against a Drug Target Binding Affinity (DBTA) classifier (Huang et al., 2020) to asses potential anti-SARS-CoV-2 activity. Full details of our implementation and source code are available at https://github.com/exalearn/covid-drug-design.
2. Background and Related Work
In response to the COVID-19 global pandemic, researchers have pushed to identify marketed drugs that can be repurposed for SARS-CoV-2 treatment (Lu, 2020; Zhou et al., 2020; Fan et al., 2020; Smith and Smith, 2020; Gordon et al., 2020). Born et al. amended their PaccMann RL approach, originally intended to generate anticancer drugs, to generate molecules with affinity to viral target proteins and controlled toxicity (Born et al., [n.d.]). Batra et al. applied an ML-based screening approach to find known compounds with binding affinity to either the isolated SARS-CoV-2 S-protein at its host receptor region or to the S-protein-human ACE2 interface complex (Batra et al., 2020). Huang et al. developed a deep learning toolkit for drug repurposing, called DeepPurpose, with the goal of recommending candidates with high binding affinity to target amino acid sequences from known drugs (Huang et al., 2020). These approaches screen large databases of known compounds, which have the potential to miss novel molecules with anti-SARS activity. Chenthamarakshan et al. developed the generative modeling framework CogMol to design drug candidates specific to a given target protein (Chenthamarakshan et al., 2020).
Here we discuss which properties should be considered during lead optimization (Copeland et al., 2006). LogP is a measure of lipophilicity, which provides an understanding of the behavior of a drug in the body. Compounds intended for oral administration should have a logP no greater than 5, according to Lipinski’s Rule of 5 (Lipinski, 2004). Further analysis has shown that logP values between 1 and 3 may be more appropriate considering the effect of logP on absorption, distribution, metabolism, elimination, and toxicology (ADMET) properties (Waring, 2010). Though oral bioavailability is an important factor, a sole focus on logP has the potential to screen out otherwise useful compounds (Zhang and Wilkinson, 2007). QED has been proposed as a more holistic druglikeness metric (Bickerton et al., 2012b), from 0 (low) to 1 (high). Druglikeness provides a general metric for ADMET properties, but does not indicate the activity or effectiveness of a drug towards a specific target. The half maximal inhibitory concentration (IC50), on the other hand, provides a quantitative measure of the potency of a compound to inhibit a specific biological process. IC50 is obtained by measurement, and no universal ab initio method of computing its value exists. A number of methods have been developed to approximate IC50, many based on QSPR and recently some based on machine learning (Patankar and Jurs, 2000; Bag and Ghorai, 2016; Armutlu et al., 2008; Bjerrum, 2017). Similarity to known drugs is also an important factor in drug discovery (Maggiora et al., 2014; Kumar and Zhang, 2018), as is the ability to synthesize the molecule, which can be estimated by the synthetic accessibility (SA) score [from 1 (easy) to 10 (difficult)] (Ertl and Schuffenhauer, 2009).
3. Method
3.1. Surrogate Model for pIC50 Prediction
We trained a message-passing neural network (MPNN) (Scarselli et al., 2008; Gilmer et al., 2017) to predict pIC50 (the inverse log of IC50) for a given molecular structure. Following the formalism of Gilmer et al. (Gilmer et al., 2017), our network is composed of message, update and readout operations (eqns. 1-3) and our choices for these functions are based on networks developed by St. John et al. for polymer property prediction. (John et al., 2019)
The original state of each atom () and bond () in our molecule () is a 256-length vector with values defined by an embedding table based on the atomic number and bond type (e.g., single, double, aromatic). The states of these atoms are modified by eight successive “message” layers. Each message layer uses a two-layer multi-layer perceptron (MLP) with sigmoid activations to compute a message that uses the state of an atom (), the state of the neighboring atom () and the bond which joins them (). The atom and bond states are updated according to the following equations:
| (1) |
| (2) |
| (3) |
The atom states output from the last layer () are used to predict the of the molecule using a ”readout” function ().
| (4) |
We use several variants of the readout function in our study. We tested both “molecular fingerprints,” where the states of each node are combined before using a multi-layer perceptron (MLP) to reduce to compute pIC50, and an “atomic contribution,” where we combine the nodes after MLP to compute a per-node contribution to pIC50. We experimented with the use of five different functions to reduce the atomic state/contributions to a single value for each graph: summation, mean, maximum, softmax, and attention. The attention functions are created by learning an attention map by passing the node states through a MPNN. We tested all combinations of “molecular fingerprint” vs. “atomic contribution” and the five readout functions, for a total of 10 networks, training each on network the same 90% of our pIC50 dataset and comparing its performance on the withheld 10% of the data. We used an MPNN that uses attention maps to reduce contributions from each atom to a single pIC50 of a molecule in all subsequent experiments.
3.2. Junction Tree Variational Autoencoder
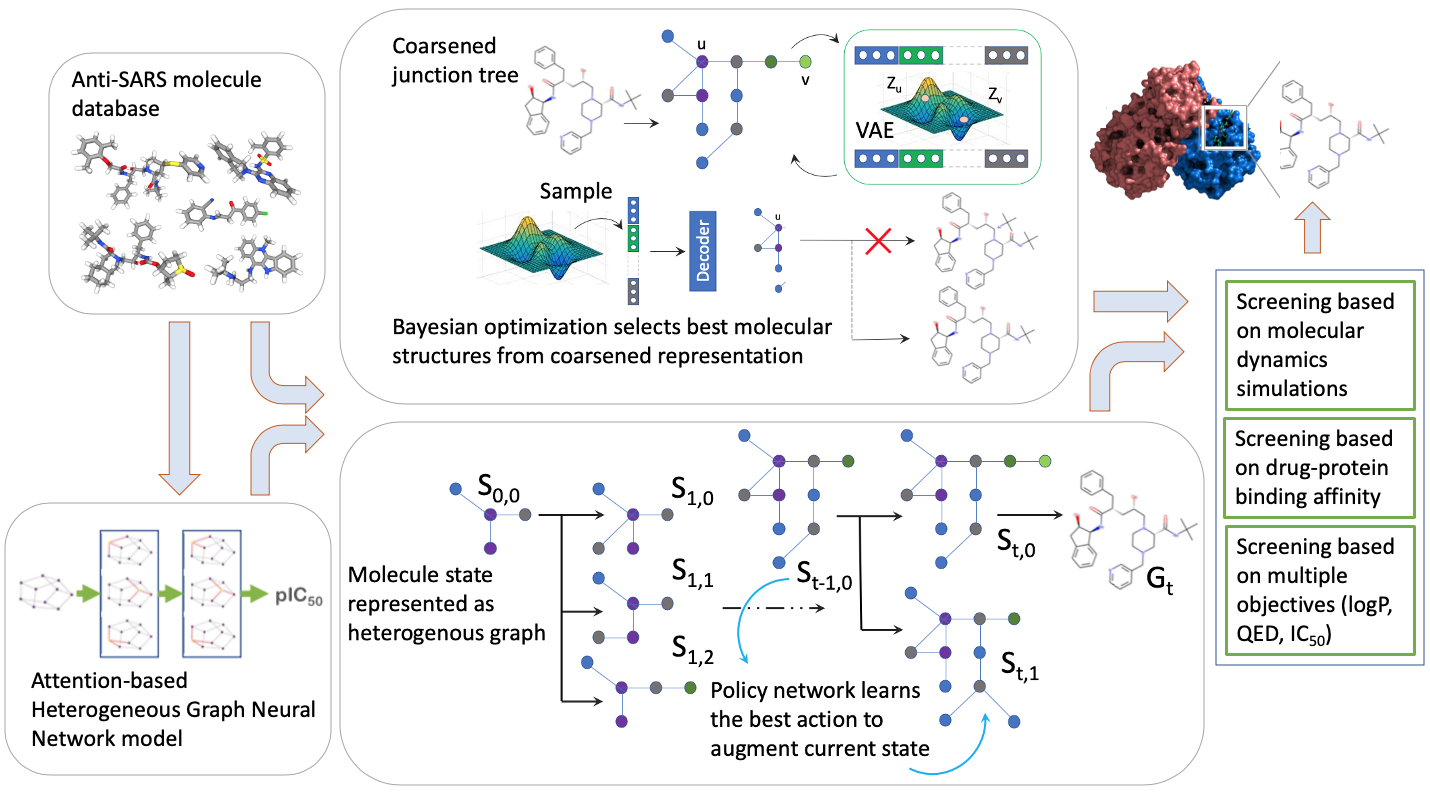
We use a junction-tree (JT) based variational autoencoder (VAE) method (Jin et al., 2018) for generating molecules with high proximity to anti-SARS drug molecules. This model generates novel molecular graphs by laying a tree-structured scaffold over substructures in the molecule, which are then combined into a valid molecule using a MPNN. The JT-VAE model allows for the incremental expansion of a molecular graph through the addition of subgraphs, or “vocabulary” of valid components (denoted ), derived from the training set (Figure 1). The subgraphs are used to encode a molecule into its vector representation and decode latent vectors into valid molecular graphs. The use of subgraphs, rather than building a molecule atom-by-atom, maintains chemical validity at each step, while also incorporating functional groups common to the training set. Chemical graphs generated from the vocabulary will be structurally similar to those in the training set, which is a benefit when attempting to design drugs with similar properties to those in the training set.
Given a molecular graph , JT-VAE coarsens into a junction tree data structure such that each node in represents a subgraph of . The subgraphs can be coarsened by using either automated JT construction algorithms from the graphical model literature (Lauritzen and Spiegelhalter, 1988) or a vocabulary based mapping approach that reduces to important building blocks of chemical structures.
Next, the JT-VAE method uses a message-passing network (as described in section 3.1) to encode (Figure 1) into a vector representation . We refer the reader to (Jin et al., 2018) for specific implementations of the MPNN-based encoders for the input graph and the junction tree. The decoder component of the VAE learns to generate the same junction tree structure from by maximizing the likelihood function .
Once the VAE model is trained, the next phase involves a two-step process for generating a molecular graph structure that is optimized for a target property. The first step involves drawing a sample from the latent space learnt by the VAE and transforming the sampled vector representation into a corresponding junction tree structure. The second step pursues a Bayesian optimization (BO) strategy to map the junction tree to a molecular graph that maximizes the target properties. Using the JT-VAE trained on our SARS-related database, we perform Bayesian optimization (BO), using the method of Kusner et al. (Kusner et al., 2017) to produce novel molecules with target properties described in section 3.4.
3.3. Deep Reinforcement Learning
We follow the Q-learning approach of Zhou et al. for our deep reinforcement learning approach (Zhou et al., 2019). We consider tasks in which an agent interacts with an environment represented as a molecular graph. The agent starts with a null graph. At each time-step the agent selects an action from an action space that includes addition of single atoms, changing the type of bonds or removing bonds from the graph. The agent also receives a reward at each time step depending on a property scoring function. All the property scoring functions are described in section 3.4.
In this setting, we cast the molecule generation problem as a Markov Decision Process (MDP) (Mnih et al., 2013) to learn a policy network that determines the best sequence of actions that start with an initial molecular graph and transform it a larger graph with desirable properties in a step-by-step fashion (Figure 1). At each step, we enumerate all possible actions and then select those which produce valid molecules (e.g., respect valency rules). Next, we train a multi-layer perceptron (MLP) to predict to predict the value (Mnih et al., 2013) of a certain action by passing the Morgan fingerprints (Rogers and Hahn, 2010) as input. The MLP approximates the value of an action computed using the Bellman equation, where the score of a state and the maximum score of the subsequent state is multiplied by a decay factor. As established with other Deep Q-Learning approaches, the addition of the value of the next state increases the value of moves which will lead to higher future rewards.
3.4. Scoring Functions
The scoring functions described in this section are used for both Bayesian optimization in the VAE based approach and reward computation for the deep reinforcement-learning based approach. Following Jin et al. (Jin et al., 2018), we first compute a score that penalizes logP by the SA score (recall from section 2 that higher SA values are discouraged) and number of cycles with more than 6 atoms (eqn. 5). Considering that QED is a more comprehensive heuristic than logP, we also use a similar scoring function composed of QED penalized by the SA score and number of long cycles (eqn. 6). We then examine the utility of a SARS-specific scoring function based on the pIC50 predicted by our MPNN penalized by the SA score and number of long cycles. Finally, we examine a multi-objective scoring function that accommodates both pIC50 and penalized QED.
| (5) |
| (6) |
| (7) |
| (8) |
4. Experimental Analysis
We conduct experiments to answer two questions: Q1: What are the best possible ways to generate molecules with targeted activity towards SARS-CoV-2? Q2: How do we evaluate the novelty of our generated molecules?
4.1. Dataset and Analysis
We assembled a dataset with molecules active against various enzymatic assays filtered from experimental pharmacology data logged in CheMBL, BindingDB, and ToxCat (Bento et al., 2014). Details of this dataset are provided in section 5.1. Following the workflow in Figure 1, we first train a pIC50 model, and subsequently use it to train the JT-VAE and DQN models. We begin with a discussion of the pIC50 model given its key role in training the JT-VAE and DQN models.
4.2. Training pIC50 surrogate model
We tested multiple variants of the pIC50 prediction model. We found that MPNNs that limited the computation of the pIC50 to contributions from only a few specific atoms in the molecule performed the best. As shown in Table S1, the models which use max and softmax functions for aggregating the atom-level representations to a molecule-level representation (equation 4) have higher scores than those which use summation or mean outputs.
The relative performance of different networks can be explained by the physical mechanism behind the performance of anti-viral drugs. The presence or absence of a specific pattern in the molecular structure (e.g., functional groups, substituents) controls whether the molecule will bind with a certain portion of a target virus protein. We hypothesize that the “maximum” function, in particular, models this “all-or-nothing” physics well. The other atoms in the molecule play a role in determining whether the molecule will stay affixed at the target site. The reduced but non-negligible effect of the side groups could explain why the “atomic”-contribution model, which only uses the contribution from a single atom, performs less well than the whole-molecule fingerprint. These trends give us confidence that the MPNNs are operating based on well-known physics, but we would require comparison of which atoms are contributing to the predicted pIC50 to results from molecular binding simulations to determine if the networks are indeed interpretable.
4.3. Effect of the scoring function
Molecule generation setup using JT-VAE. We trained JT-VAE for 8,300 iterations on the full database, with the following hyperparameters: hidden state dimension of 450, latent code dimension of 56, and graph message passing depth of 3. Analysis of the trained JT-VAE is given in Figure S1. To optimize towards the specified scoring functions, we trained a sparse Gaussian process (SGP) to predict a score given the latent representation learned by JT-VAE and then perform 10 iterations of batched BO (sampling = 50) based on the expected improvement.
| Scoring function | pIC50 | QED | logP | SA Score | ||||||||
|---|---|---|---|---|---|---|---|---|---|---|---|---|
| 1st | 2nd | 3rd | 1st | 2nd | 3rd | 1st | 2nd | 3rd | 1st | 2nd | 3rd | |
| logPP (JT-VAE) | ||||||||||||
| logPP (DQN) | ||||||||||||
| QEDP (JT-VAE) | ||||||||||||
| QEDP (DQN) | ||||||||||||
| pIC50 (JT-VAE) | ||||||||||||
| pIC50 (DQN) | ||||||||||||
| pIC50+QEDP (JT-VAE) | ||||||||||||
| pIC50+QEDP (DQN) | ||||||||||||
Molecule generation setup using DQN. Our DQN approach builds up molecules from a single atom to large molecules atom-by-atom and bond-by-bond. Each “episode” starts with a blank slate and the RL agent is allowed up to 40 steps. We update a model of the Q-function to predict the value of each move after each step in each episode and, as this model improves during training, we smoothly turn down the probability that we will choose a random move over the prediction of this model.
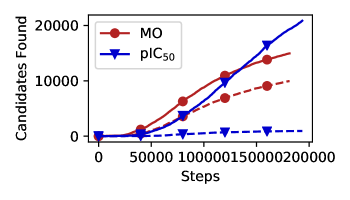
The DQN finds tens of thousands of candidate molecules with high pIC50, as shown in Figure 2 and Table 1. Using the multi-objective reward function led to fewer molecules with pIC50, but with increased druglikeness. Approximately two-thirds of the molecules with pIC50 found with the multi-objective reward also show QED. In contrast, only of the molecules in the pIC50-based search show QED ¿ 0.5. The addition of QED reduces the total number of high-pIC50molecules found by 25%, but increases the number of high-pIC50molecules found by over 10 times. Therefore, we recommend incorporating synthesizability and/or druglikeness into RL-driven searches for drug-like molecules.
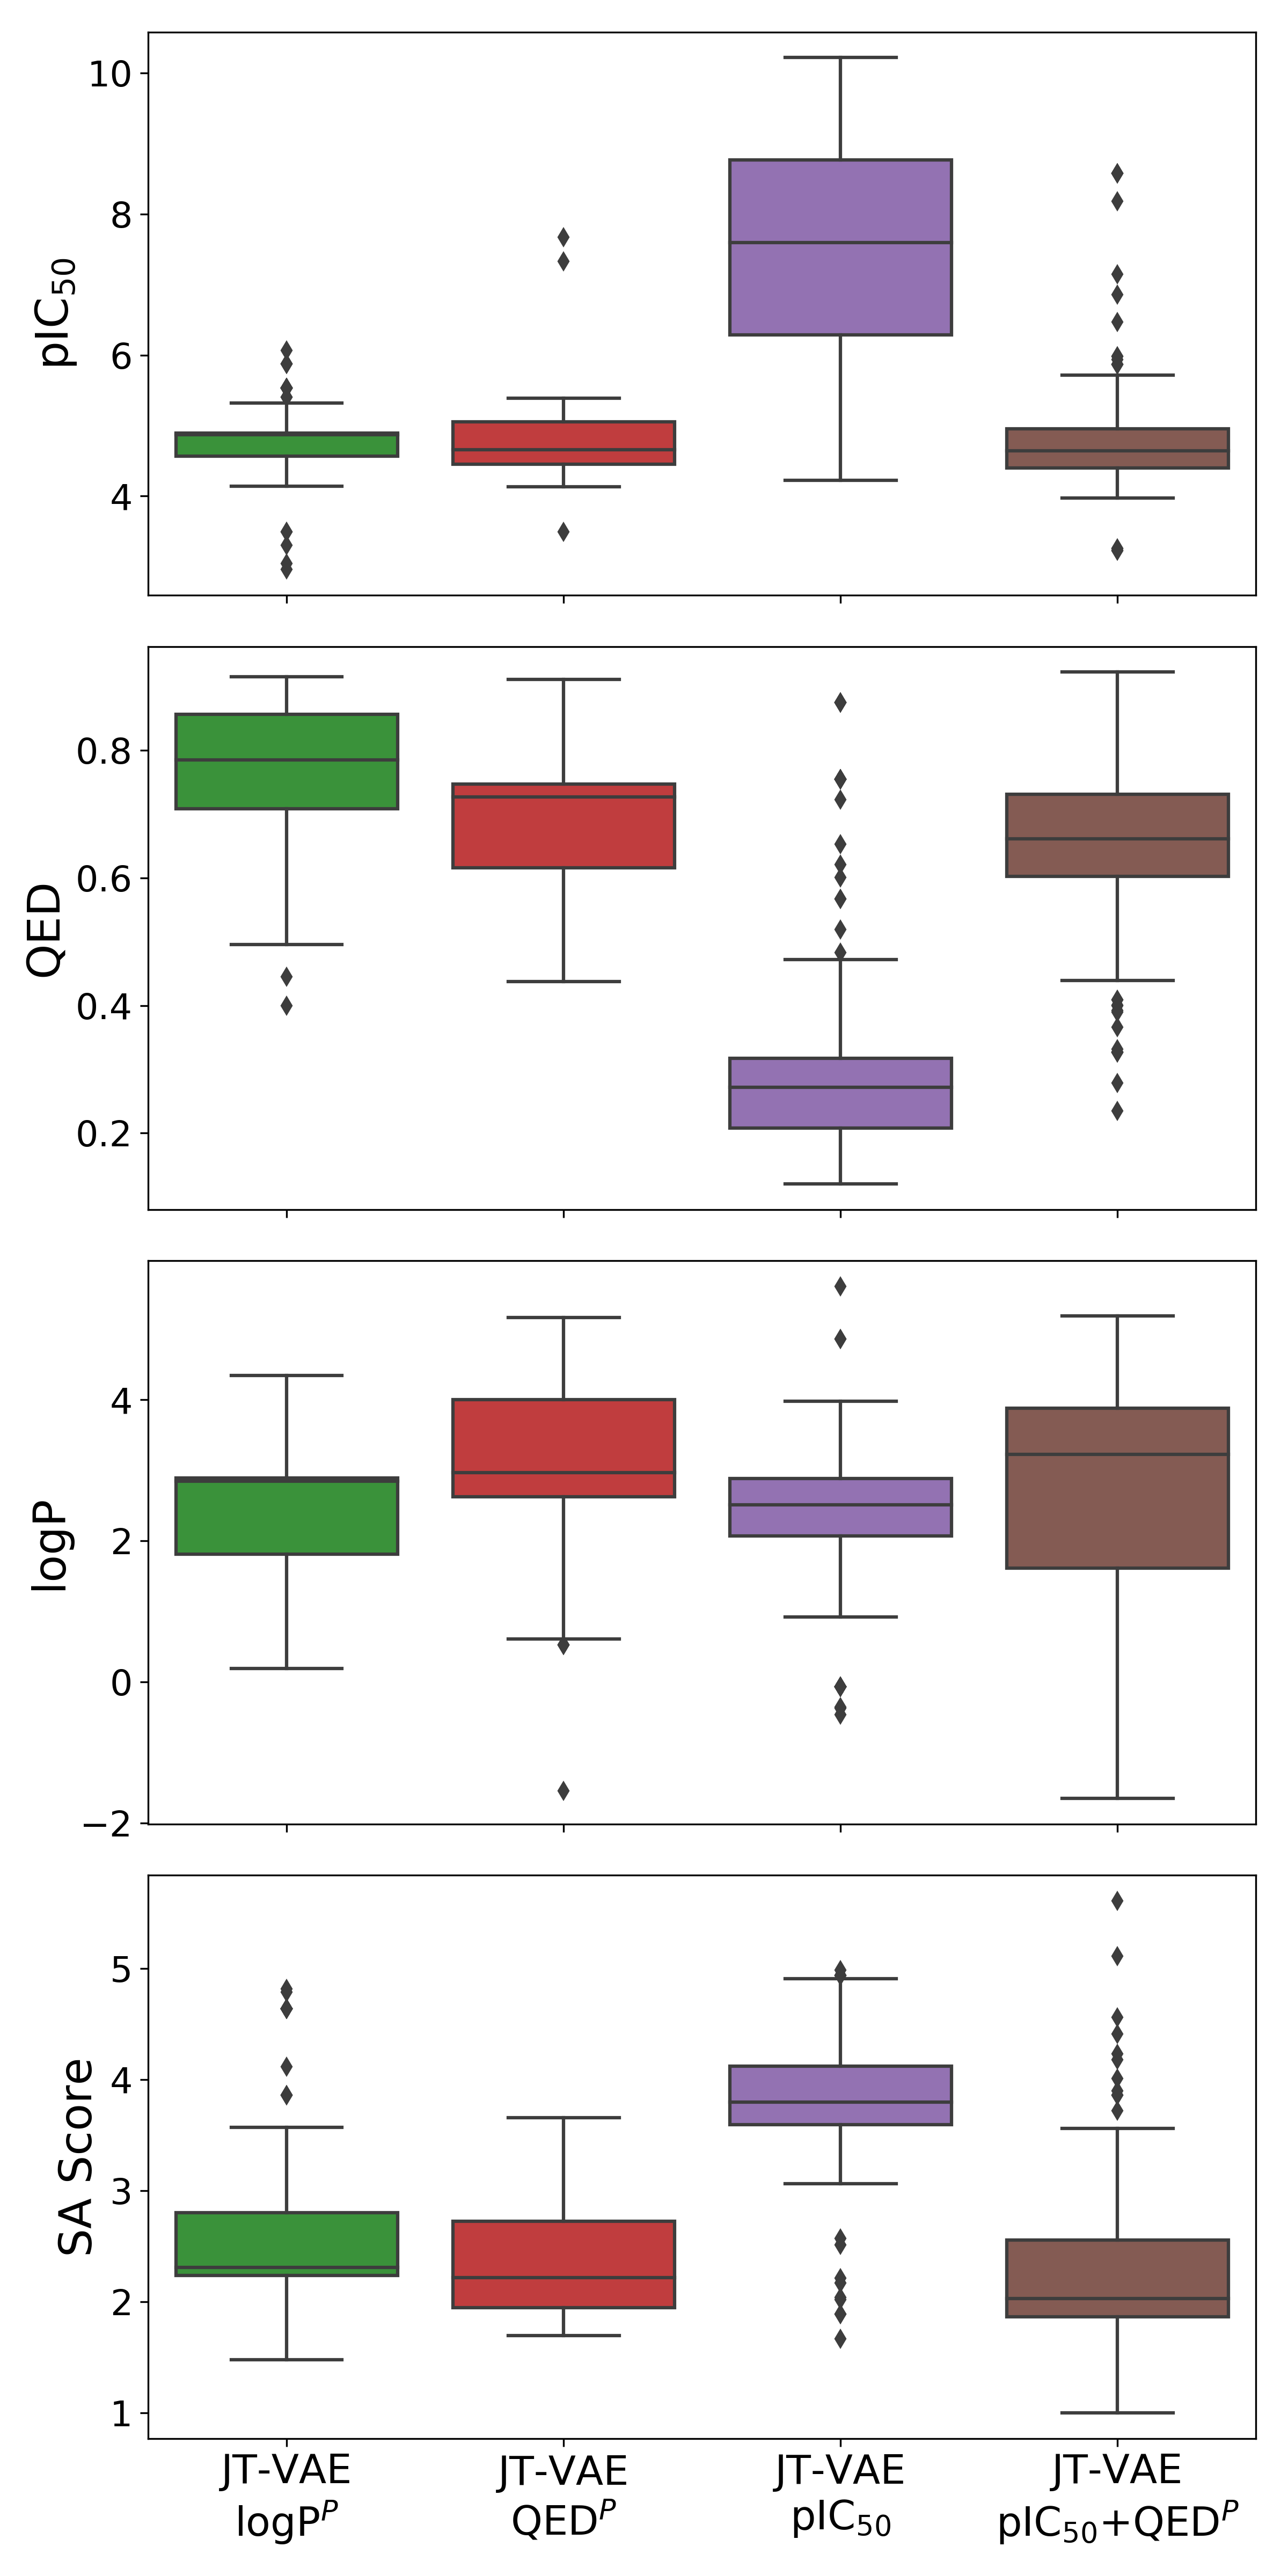
Comparing JT-VAE and DQN. Table 1 shows the three highest-scoring molecules generated by the two generative models with each scoring function. The DQN models always outperform JT-VAE in finding a molecule with a superior value of the scoring function being optimized. The performance disparity is particularly apparent when optimizing for logP: the maximum logP from DQN is 12.6 compared to only 4.1 for JT-VAE. We attribute the difference in optimization performance to JT-VAE implicitly sampling from a distribution of drug-like molecules and DQN having no such constraints.
The candidate molecules generated by JT-VAE have consistently better druglikeness and SA scores even when those values are not explicitly optimized for. When optimizing towards logP, the top-3 molecules generated by JT-VAE have moderate-to-high QEDs, while the top-3 from DQN are below 0.11. We attribute the exceptionally large disparity in optimal logP and associated QED values between the two methods to the fact that drugs typically have logP values between -0.4 and 5.6. The molecules from which JT-VAE was trained were all drug-like molecules, which makes it improbable to sample molecules with logP values far outside that range. Similarly, the molecules in the JT-VAE training set were experimentally synthesized. The SA score for these molecules is low, which could explain why the optimized molecules from the JT-VAE are also low even when this property was not optimized for. The RL agent uses no information about the space of experimentally studied drug molecules during its training process and, accordingly, finds molecules far from it.
Overall, we find two different purposes for JT-VAE and RL-based molecular optimization. JT-VAE implicitly uses the distribution of molecules in its training set to bias towards realistic molecules, albeit at the expense of finding better candidates. The RL-based approach lacks such constraints and, for better or worse, can optimize without even implicitly regarding synthesizability or any other characteristic not explicitly encoded in the scoring function.
4.4. Qualitative analysis from a drug discovery perspective
We observed an interesting structural trend in the molecules generated by JT-VAE when using pIC50 as the scoring function. Figure 3 shows the structures of both the molecules with pIC50 ¿ 8 and the anti-HIV drug Indinavir, an antiretroviral protease inhibitor. A common backbone is shared between Indinavir and the top-6 predictions. The Tanimoto similarity scores (Bajusz et al., 2015) of these six generated molecules against Indinavir range from 0.65 to 0.91. Indinavir has been proposed as a drug to treat SARS-CoV-2 due to favorable docking to the coronavirus 3-chymotrypsin-like protease (3CL-protease), a promising drug target for combating coronavirus infections (Chang, 2020; Gyebi et al., 2020; Harrison, 2020). Notably, three of the generated molecules have a higher predicted pIC50 than does Indinavir.
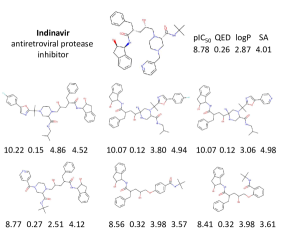
Experimental confirmation of Drug-Target-Interaction (DTI) is challenging and time-consuming (Thafar et al., 2019). In silico Drug-Target Binding Affinity (DTBA) methods offer an alternative to evaluate DTI (He et al., 2017). We employ a ML-based DTBA model to validate the interaction of molecules generated by JT-VAE against a target SARS-CoV2-L protease (Chen et al., 2020). We trained a DBTA binary classification model using extended connectivity fingerprint (Rogers and Hahn, 2010) encoding for the drug molecule and the target protease sequence encoding using a Convolution Neural Network (CNN) as implemented in the DeepPurpose toolkit (Huang et al., 2020). The default hyperparameters provided in the DeepPurpose toolkit were found to be sufficient. The DBTA model classified four of the top 11 molecules (including the top two in Figure 3) with probability 0.5 to have interaction with SARS-CoV2-3CL protease.
5. Conclusions
We compared two graph generative models, JT-VAE and DQN, for the task of discovering potential small-molecule candidates with activity against SARS-CoV-2. DQN always outperformed JT-VAE in finding a molecule with a superior value of the scoring function being optimized. However, JT-VAE generated molecules that were more structurally similar to those in the database due to substructure representation, which produced a lower SA score and logP ¡ 5. JT-VAE tended to produce what looked to be drug molecules, while DQN produced precursor-like candidates with optimized properties, which could be used as starting structures to add additional substituents aimed at the specific target.
References
- (1)
- Armutlu et al. (2008) P. Armutlu, M. E. Ozdemir, F. Uney-Yuksektepe, I. H. Kavakli, and M. Turkay. 2008. Classification of drug molecules considering their IC50 values using mixed-integer linear programming based hyper-boxes method. BMC Bioinformatics 9 (2008), 411. https://doi.org/10.1186/1471-2105-9-411
- Avdeef et al. (1998) A Avdeef, KJ Box, JEA Comer, C Hibbert, and KY Tam. 1998. pH-Metric logP 10. Determination of liposomal membrane-water partition coefficients of lonizable drugs. Pharmaceutical Research 15, 2 (1998), 209–215.
- Bag and Ghorai (2016) A. Bag and P. K. Ghorai. 2016. Development of Quantum Chemical Method to Calculate Half Maximal Inhibitory Concentration (IC50). Mol Inform 35, 5 (2016), 199–206. https://doi.org/10.1002/minf.201501004
- Bajusz et al. (2015) Dávid Bajusz, Anita Rácz, and Károly Héberger. 2015. Why is Tanimoto index an appropriate choice for fingerprint-based similarity calculations? Journal of cheminformatics 7, 1 (2015), 20.
- Batra et al. (2020) Rohit Batra, Henry Chan, Ganesh Kamath, Rampi Ramprasad, Mathew J. Cherukara, and Subramanian Sankaranarayanan. 2020. Screening of Therapeutic Agents for COVID-19 using Machine Learning and Ensemble Docking Simulations. arXiv e-prints, Article arXiv:2004.03766 (April 2020), arXiv:2004.03766 pages. arXiv:q-bio.BM/2004.03766
- Bento et al. (2014) A Patrícia Bento, Anna Gaulton, Anne Hersey, Louisa J Bellis, Jon Chambers, Mark Davies, Felix A Krüger, Yvonne Light, Lora Mak, Shaun McGlinchey, et al. 2014. The ChEMBL bioactivity database: an update. Nucleic Acids Research 42, D1 (2014), D1083–D1090.
- Bickerton et al. (2012a) G Richard Bickerton, Gaia V Paolini, Jérémy Besnard, Sorel Muresan, and Andrew L Hopkins. 2012a. Quantifying the chemical beauty of drugs. Nature Chemistry 4, 2 (2012), 90.
- Bickerton et al. (2012b) G. Richard Bickerton, Gaia V. Paolini, Jérémy Besnard, Sorel Muresan, and Andrew L. Hopkins. 2012b. Quantifying the chemical beauty of drugs. Nature chemistry 4, 2 (2012), 90–98. https://doi.org/10.1038/nchem.1243
- Bjerrum (2017) Esben Jannik Bjerrum. 2017. SMILES Enumeration as Data Augmentation for Neural Network Modeling of Molecules. CoRR abs/1703.07076 (2017). arXiv:1703.07076 http://arxiv.org/abs/1703.07076
- Born et al. ([n.d.]) Jannis Born, Matteo Manica, Joris Cadow, Greta Markert, Nil Adell Mill, Modestas Filipavicius, and María Rodríguez Martínez. [n.d.]. PaccMannRL on SARS-CoV-2: Designing antiviral candidates with conditional generative models. ([n. d.]).
- Chang (2020) Y. et al. Chang. 2020. Potential Therapeutic Agents for COVID-19 Based on the Analysis of Protease and RNA Polymerase Docking. Preprints (2020), 2020020242. https://doi.org/10.20944/preprints202002.0242.v1
- Chen et al. (2020) Yu Wai Chen, Chin-Pang Bennu Yiu, and Kwok-Yin Wong. 2020. Prediction of the SARS-CoV-2 (2019-nCoV) 3C-like protease (3CL pro) structure: virtual screening reveals velpatasvir, ledipasvir, and other drug repurposing candidates. F1000Research 9 (2020).
- Chenthamarakshan et al. (2020) Vijil Chenthamarakshan, Payel Das, Inkit Padhi, Hendrik Strobelt, Kar Wai Lim, Ben Hoover, Samuel C Hoffman, and Aleksandra Mojsilovic. 2020. Target-specific and selective drug design for covid-19 using deep generative models. arXiv preprint arXiv:2004.01215 (2020).
- Copeland et al. (2006) Robert A Copeland, David L Pompliano, and Thomas D Meek. 2006. Drug–target residence time and its implications for lead optimization. Nature Reviews Drug Discovery 5, 9 (2006), 730–739.
- de Wit et al. (2016) Emmie de Wit, Neeltje van Doremalen, Darryl Falzarano, and Vincent J Munster. 2016. SARS and MERS: recent insights into emerging coronaviruses. Nature Reviews Microbiology 14, 8 (2016), 523.
- Dror et al. (2012) Ron O Dror, Robert M Dirks, JP Grossman, Huafeng Xu, and David E Shaw. 2012. Biomolecular simulation: a computational microscope for molecular biology. Annual Review of Biophysics 41 (2012), 429–452.
- Ertl and Schuffenhauer (2009) Peter Ertl and Ansgar Schuffenhauer. 2009. Estimation of synthetic accessibility score of drug-like molecules based on molecular complexity and fragment contributions. Journal of Cheminformatics 1, 1 (2009), 8. https://doi.org/10.1186/1758-2946-1-8
- Fan et al. (2020) Hua-Hao Fan, Li-Qin Wang, Wen-Li Liu, Xiao-Ping An, Zhen-Dong Liu, Xiao-Qi He, Li-Hua Song, and Yi-Gang Tong. 2020. Repurposing of clinically approved drugs for treatment of coronavirus disease 2019 in a 2019-novel coronavirus-related coronavirus model. Chinese medical journal 133, 9 (2020), 1051–1056. https://doi.org/10.1097/CM9.0000000000000797
- Gilmer et al. (2017) Justin Gilmer, Samuel S Schoenholz, Patrick F Riley, Oriol Vinyals, and George E Dahl. 2017. Neural message passing for quantum chemistry. In 34th International Conference on Machine Learning-Volume 70. JMLR. org, 1263–1272.
- Gordon et al. (2020) David E. Gordon, Gwendolyn M. Jang, Mehdi Bouhaddou, Jiewei Xu, Kirsten Obernier, Kris M. White, Matthew J. O’Meara, Veronica V. Rezelj, Jeffrey Z. Guo, Danielle L. Swaney, Tia A. Tummino, Ruth Huettenhain, Robyn M. Kaake, Alicia L. Richards, Beril Tutuncuoglu, Helene Foussard, Jyoti Batra, Kelsey Haas, Maya Modak, Minkyu Kim, Paige Haas, Benjamin J. Polacco, Hannes Braberg, Jacqueline M. Fabius, Manon Eckhardt, Margaret Soucheray, Melanie J. Bennett, Merve Cakir, Michael J. McGregor, Qiongyu Li, Bjoern Meyer, Ferdinand Roesch, Thomas Vallet, Alice Mac Kain, Lisa Miorin, Elena Moreno, Zun Zar Chi Naing, Yuan Zhou, Shiming Peng, Ying Shi, Ziyang Zhang, Wenqi Shen, Ilsa T. Kirby, James E. Melnyk, John S. Chorba, Kevin Lou, Shizhong A. Dai, Inigo Barrio-Hernandez, Danish Memon, Claudia Hernandez-Armenta, Jiankun Lyu, Christopher J. P. Mathy, Tina Perica, Kala B. Pilla, Sai J. Ganesan, Daniel J. Saltzberg, Ramachandran Rakesh, Xi Liu, Sara B. Rosenthal, Lorenzo Calviello, Srivats Venkataramanan, Jose Liboy-Lugo, Yizhu Lin, Xi-Ping Huang, YongFeng Liu, Stephanie A. Wankowicz, Markus Bohn, Maliheh Safari, Fatima S. Ugur, Cassandra Koh, Nastaran Sadat Savar, Quang Dinh Tran, Djoshkun Shengjuler, Sabrina J. Fletcher, Michael C. O’Neal, Yiming Cai, Jason C. J. Chang, David J. Broadhurst, Saker Klippsten, Phillip P. Sharp, Nicole A. Wenzell, Duygu Kuzuoglu, Hao-Yuan Wang, Raphael Trenker, Janet M. Young, Devin A. Cavero, Joseph Hiatt, Theodore L. Roth, Ujjwal Rathore, Advait Subramanian, Julia Noack, Mathieu Hubert, Robert M. Stroud, Alan D. Frankel, Oren S. Rosenberg, Kliment A. Verba, David A. Agard, Melanie Ott, Michael Emerman, Natalia Jura, et al. 2020. A SARS-CoV-2 protein interaction map reveals targets for drug repurposing. Nature (2020). https://doi.org/10.1038/s41586-020-2286-9
- Gyebi et al. (2020) Gideon A. Gyebi, Olalekan B. Ogunro, Adegbenro P. Adegunloye, Oludare M. Ogunyemi, and Saheed O. Afolabi. 2020. Potential inhibitors of coronavirus 3-chymotrypsin-like protease (3CL(pro)): an in silico screening of alkaloids and terpenoids from African medicinal plants. Journal of Biomolecular Structure and Dynamics (2020), 1–13. https://doi.org/10.1080/07391102.2020.1764868
- Harrison (2020) C Harrison. 2020. Coronavirus puts drug repurposing on the fast track. Nature Biotechnology 38, 4 (2020), 379.
- He et al. (2017) Tong He, Marten Heidemeyer, Fuqiang Ban, Artem Cherkasov, and Martin Ester. 2017. SimBoost: a read-across approach for predicting drug–target binding affinities using gradient boosting machines. Journal of Cheminformatics 9, 1 (2017), 1–14.
- Horwood and Noutahi (2020) Julien Horwood and Emmanuel Noutahi. 2020. Molecular Design in Synthetically Accessible Chemical Space via Deep Reinforcement Learning. arXiv preprint arXiv:2004.14308 (2020).
- Huang et al. (2020) Kexin Huang, Tianfan Fu, Cao Xiao, Lucas Glass, and Jimeng Sun. 2020. DeepPurpose: a Deep Learning Based Drug Repurposing Toolkit. arXiv preprint arXiv:2004.08919 (2020).
- Jin et al. (2020) Wengong Jin, Regina Barzilay, and Tommi Jaakkola. 2020. Multi-Objective Molecule Generation using Interpretable Substructures. arXiv e-prints, Article arXiv:2002.03244 (Feb. 2020), arXiv:2002.03244 pages. arXiv:cs.LG/2002.03244
- Jin et al. (2018) Wengong Jin, Regina Barzilay, and Tommi S. Jaakkola. 2018. Junction Tree Variational Autoencoder for Molecular Graph Generation. CoRR abs/1802.04364 (2018). arXiv:1802.04364 http://arxiv.org/abs/1802.04364
- John et al. (2019) Peter C. St. John, Caleb Phillips, Travis W. Kemper, A. Nolan Wilson, Yanfei Guan, Michael F. Crowley, Mark R. Nimlos, and Ross E. Larsen. 2019. Message-passing neural networks for high-throughput polymer screening. Journal of Chemical Physics 150, 23 (June 2019), 234111. https://doi.org/10.1063/1.5099132
- Khemchandani et al. (2020) Yash Khemchandani, Steve O’Hagan, Soumitra Samanta, Neil Swainston, Timothy J Roberts, Danushka Bollegala, and Douglas B Kell. 2020. DeepGraphMol, a multi-objective, computational strategy for generating molecules with desirable properties: a graph convolution and reinforcement learning approach. bioRxiv (2020).
- Kumar and Zhang (2018) Ashutosh Kumar and Kam Y. J. Zhang. 2018. Advances in the Development of Shape Similarity Methods and Their Application in Drug Discovery. Frontiers in chemistry 6 (2018), 315–315. https://doi.org/10.3389/fchem.2018.00315
- Kusner et al. (2017) Matt J. Kusner, Brooks Paige, and José Miguel Hernández-Lobato. 2017. Grammar Variational Autoencoder. arXiv:stat.ML/1703.01925
- Lauritzen and Spiegelhalter (1988) Steffen L Lauritzen and David J Spiegelhalter. 1988. Local computations with probabilities on graphical structures and their application to expert systems. Journal of the Royal Statistical Society: Series B (Methodological) 50, 2 (1988), 157–194.
- Li et al. (2018) Yibo Li, Liangren Zhang, and Zhenming Liu. 2018. Multi-objective de novo drug design with conditional graph generative model. Journal of Cheminformatics 10, 1 (2018), 33. https://doi.org/10.1186/s13321-018-0287-6
- Lipinski (2004) Christopher A Lipinski. 2004. Lead-and drug-like compounds: the rule-of-five revolution. Drug Discovery Today: Technologies 1, 4 (2004), 337–341.
- Lu (2020) Hongzhou Lu. 2020. Drug treatment options for the 2019-new coronavirus (2019-nCoV). BioScience Trends 14, 1 (2020), 69–71. https://doi.org/10.5582/bst.2020.01020
- Maggiora et al. (2014) Gerald Maggiora, Martin Vogt, Dagmar Stumpfe, and Jurgen Bajorath. 2014. Molecular similarity in medicinal chemistry: miniperspective. Journal of medicinal chemistry 57, 8 (2014), 3186–3204.
- Mnih et al. (2013) Volodymyr Mnih, Koray Kavukcuoglu, David Silver, Alex Graves, Ioannis Antonoglou, Daan Wierstra, and Martin Riedmiller. 2013. Playing atari with deep reinforcement learning. arXiv preprint arXiv:1312.5602 (2013).
- Patankar and Jurs (2000) S. J. Patankar and P. C. Jurs. 2000. Prediction of IC50 Values for ACAT Inhibitors from Molecular Structure. Journal of Chemical Information and Computer Sciences 40, 3 (2000), 706–723. https://doi.org/10.1021/ci990125r
- Rogers and Hahn (2010) David Rogers and Mathew Hahn. 2010. Extended-connectivity fingerprints. Journal of Chemical Information and Modeling 50, 5 (2010), 742–754.
- Samanta et al. (2019) Bidisha Samanta, DE Abir, Gourhari Jana, Pratim Kumar Chattaraj, Niloy Ganguly, and Manuel Gomez Rodriguez. 2019. Nevae: A deep generative model for molecular graphs. In AAAI Conference on Artificial Intelligence, Vol. 33. 1110–1117.
- Scarselli et al. (2008) Franco Scarselli, Marco Gori, Ah Chung Tsoi, Markus Hagenbuchner, and Gabriele Monfardini. 2008. The graph neural network model. IEEE Transactions on Neural Networks 20, 1 (2008), 61–80.
- Sebaugh (2011) JL Sebaugh. 2011. Guidelines for accurate EC50/IC50 estimation. Pharmaceutical statistics 10, 2 (2011), 128–134.
- Sivaraman et al. (2020) Ganesh Sivaraman, Nicholas Jackson, Benjamin Sanchez-Lengeling, Alvaro Vasquez-Mayagoitia, Alan Aspuru-Guzik, Venkatram Vishwanath, and Juan de Pablo. 2020. A machine learning workflow for molecular analysis: application to melting points. Machine Learning: Science and Technology (2020).
- Smith and Smith (2020) Micholas Smith and Jeremy C. Smith. 2020. Repurposing Therapeutics for COVID-19: Supercomputer-Based Docking to the SARS-CoV-2 Viral Spike Protein and Viral Spike Protein-Human ACE2 Interface. https://doi.org/10.26434/chemrxiv.11871402.v3
- Ståhl et al. (2019) Niclas Ståhl, Göran Falkman, Alexander Karlsson, Gunnar Mathiason, and Jonas Bostrom. 2019. Deep reinforcement learning for multiparameter optimization in de novo drug design. Journal of Chemical Information and Modeling 59, 7 (2019), 3166–3176.
- Thafar et al. (2019) Maha Thafar, Arwa Bin Raies, Somayah Albaradei, Magbubah Essack, and Vladimir B Bajic. 2019. Comparison Study of Computational Prediction Tools for Drug-Target Binding Affinities. Frontiers in Chemistry 7 (2019).
- Waring (2010) Michael J Waring. 2010. Lipophilicity in drug discovery. Expert Opinion on Drug Discovery 5, 3 (2010), 235–248. https://doi.org/10.1517/17460441003605098 arXiv:https://doi.org/10.1517/17460441003605098 PMID: 22823020.
- Weininger (1990) David Weininger. 1990. SMILES. 3. DEPICT. Graphical depiction of chemical structures. Journal of Chemical Information and Computer Sciences 30, 3 (1990), 237–243.
- You et al. (2018) Jiaxuan You, Bowen Liu, Zhitao Ying, Vijay Pande, and Jure Leskovec. 2018. Graph convolutional policy network for goal-directed molecular graph generation. In Advances in Neural Information Processing Systems. 6410–6421.
- Zhang and Wilkinson (2007) Ming-Qiang Zhang and Barrie Wilkinson. 2007. Drug discovery beyond the ‘rule-of-five’. Current Opinion in Biotechnology 18, 6 (2007), 478 – 488. https://doi.org/10.1016/j.copbio.2007.10.005 Chemical biotechnology / Pharmaceutical biotechnology.
- Zhou et al. (2020) Yadi Zhou, Yuan Hou, Jiayu Shen, Yin Huang, William Martin, and Feixiong Cheng. 2020. Network-based drug repurposing for novel coronavirus 2019-nCoV/SARS-CoV-2. Cell Discovery 6, 1 (2020), 14. https://doi.org/10.1038/s41421-020-0153-3
- Zhou et al. (2019) Zhenpeng Zhou, Steven Kearnes, Li Li, Richard N. Zare, and Patrick Riley. 2019. Optimization of Molecules via Deep Reinforcement Learning. Scientific Reports 9, 1 (2019), 10752. https://doi.org/10.1038/s41598-019-47148-x
Supplementary Material
5.1. Dataset Description
Preparation. We prepared and assembled the protease datasets with molecules active against various protease in enzymatic assays filtered from experimentally pharmacology data such as CheMBL, BindingDB, and ToxCat (Bento et al., 2014). The database was filtered out with the IC50 activity standard types and their potency. Molecules with size larger than 1000 Dalton were removed due to the limitation of the representation of large molecules in cheminformatics. We also filtered out non-drug like molecules containing metals and polypeptides. The curated data was standardized using the logarithmic scale –log10 of a numeric value in nM for all compounds. We used the mean average for a molecule with more than one IC50 value. The resulting dataset contains 6545 unique molecules accompanied by their SMILES strings and experimental IC50 values.
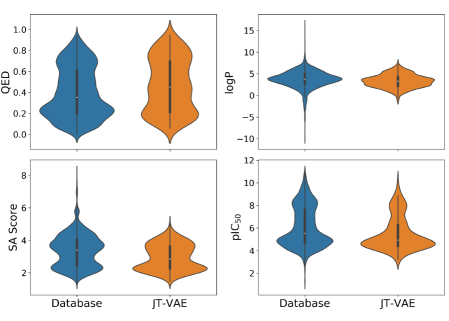
Quantitative Characterization. We computed the metrics included in our scoring functions for each molecule in the database. The range of values can be seen in Figure S1. The highest pIC50 is 10.89, while the lowest pIC50 is 1.22. The most common pIC50 is 4.0, which is shared by 320 structures, and the vast majority of structures (91.5%) have pIC50 values greater than 4.0. LogP values range from -10.36 to 16.65 in a near Gaussian distribution with a mean of 3.70; 77.0% of all structures meet the requirement of Lipinski’s Rule of 5 that logP be no greater than 5. QED values range from 0.01 to 0.94, while SA values range from 1.35 to 8.24, with 96.3% being below 5.
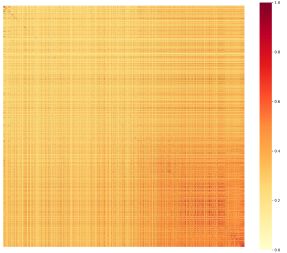
We computed the Tanimoto similarity for all pairs of compounds to gain insight into the structural diversity of molecules in our database (Figure S2). The entries in the matrix were ordered in increasing pIC50 values. The similarity is represented by the color bar, with yellow representing low similarity (0) and red high similarity (1). We observe that structures tend to become more similar to their neighbors as pIC50 increases, indicating that compounds with high pIC50 values tend to be structurally similar, supporting the consideration of molecular similarity during drug discovery.
| atomic | molecular | |
|---|---|---|
| readout | ||
| attention | 0.57 | 0.56 |
| max | 0.61 | 0.71 |
| mean | 0.57 | 0.61 |
| softmax | 0.61 | 0.70 |
| sum | 0.51 | 0.54 |