Unmasking the mask studies: why the effectiveness of surgical masks in preventing respiratory infections has been underestimated
Abstract
Face masks have been widely used as a protective measure against COVID-19. However, pre-pandemic empirical studies have produced mixed statistical results on the effectiveness of masks against respiratory viruses. The implications of the studies’ recognized limitations have not been quantitatively and statistically analyzed, leading to confusion regarding the effectiveness of masks. Such confusion may have contributed to organizations such as the WHO and CDC initially not recommending that the general public wear masks. Here we show that when the adherence to mask-usage guidelines is taken into account, the empirical evidence indicates that masks prevent disease transmission: all studies we analyzed that did not find surgical masks to be effective were under-powered to such an extent that even if masks were 100% effective, the studies in question would still have been unlikely to find a statistically significant effect. We also provide a framework for understanding the effect of masks on the probability of infection for single and repeated exposures. The framework demonstrates that more frequently wearing a mask provides super-linearly compounding protection, as does both the susceptible and infected individual wearing a mask. This work shows (1) that both theoretical and empirical evidence is consistent with masks protecting against respiratory infections and (2) that nonlinear effects and statistical considerations regarding the percentage of exposures for which masks are worn must be taken into account when designing empirical studies and interpreting their results.
In 1910, one of the first western-trained Chinese physicians adapted surgical masks for use against a respiratory plague that killed more than 60,000 people in four months [1]. The logic behind their function is transparent: a mask can block some viral or bacterial particles from entering and/or dispersing from the wearer’s respiratory tract. They have been used for prevention in a wide range of disease outbreaks and medical settings, and there is currently a general consensus that surgical and cloth masks help prevent infected individuals from spreading COVID-19 [2, 3]. Surprisingly, given the logic of their utility, there is less of a consensus that surgical/cloth masks also protect the wearer and many government health organizations did not initially recommend wearing them during the early months of the COVID-19 pandemic [4, 5].
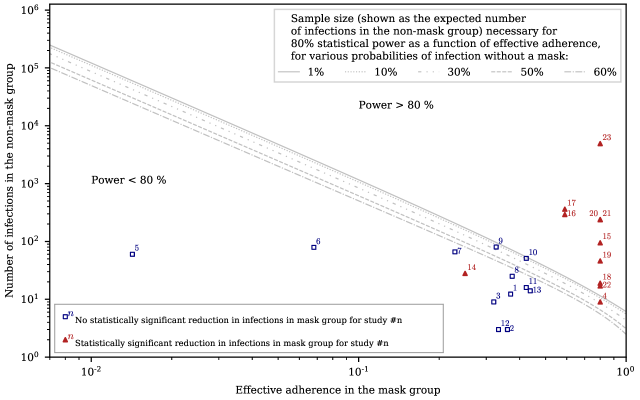
It is well established that surgical and cloth masks partially block virus-containing airborne droplets of various sizes [6, 7, 8, 9, 10, 11, 12, 13, 14, 15]. Cloth masks, surgical masks, respirator masks (e.g. N95), and powered air-purifying respirators are understood to be capable of providing increasing levels of protection. The amount of virus transmitted between an infected and a susceptible individual is therefore expected to be reduced if either is wearing a mask, with both wearing masks giving the best protection. However, this straightforward inference has been difficult to establish in experimental studies. Here we analyze why some experimental studies find masks to be effective while others do not. We determined that the studies that did not find surgical masks to be effective were under-powered to such an extent that even if the masks were 100% effective, they still would have been unlikely to find a statistically significant result. Statistical power is the probability that a study will find a statistically significant result if its intervention does in fact have a certain effect. Our results concerning the statistical power of mask studies are summarized in fig. 1, which shows that all studies that had a large enough sample size and/or adherence for 80% power (above and to the right of the gray lines) show a statistically significant reduction in infections among mask-wearers. As would be expected, most studies with less statistical power (towards the lower left) did not find a statistically significant effect. We also provide a framework for understanding the nonlinear effects of mask-wearing on the probability of infection. Experiments that do not take such factors into account provide misleading results unless interpreted carefully. While the precautionary principle [16, 17] would recommend the use of masks during the COVID-19 pandemic in any case (due to the asymmetric risks of using vs. not using masks), the analyses we provide gives consistency to theoretical analyses, experimental studies, and epidemiological recommendations.
Statistical power
Some empirical studies find masks to be effective in preventing disease transmission while others do not [16, 19, 20, 21, 22, 18, 23]. However, due to poor statistics, even the studies with negative results are not inconsistent with masks being highly effective. While some of the studies conducted a power analysis to estimate the sample size required to obtain a statistically significant result with 80% probability (i.e. to achieve 80% power, the standard level by convention), these power analyses did not take in to account the possibility of low adherence (i.e. masks being worn for a low percentage of exposure events) and/or the possibility of a very low probability of infection even without a mask. When we consider such factors, none of the studies we analyze that did not find masks to be effective had sufficient statistical power.
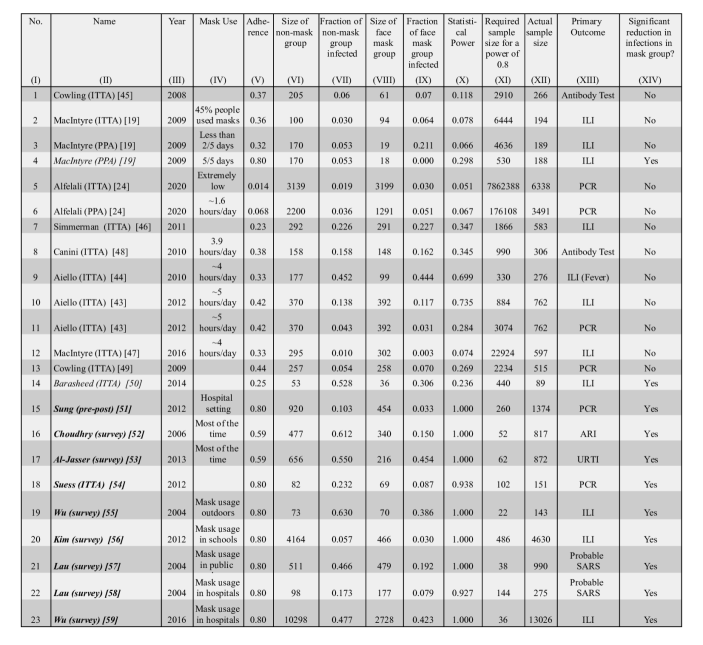
The sample of studies we consider is taken from a recent systematic review [18]; see table 2 for a list of studies that were excluded and why. Most of the studies we examine measure whether surgical masks protect the wearer; the exceptions are studies nos. 8, 12 and 15, which measure whether masks prevent the wearer from infecting others, and studies nos. 1, 7, 13, and 18, in which both the susceptible and infected individuals sometimes wore masks (see LABEL:tab:adh).
In order to account for adherence, we make two conservative assumptions that will result in our overestimating the studies’ statistical powers. First, we assume that the degree to which a mask reduces the probability of infection is proportional to the fraction of exposures for which it is worn (e.g. we assume wearing a mask half as often provides half as much protection); in fact, wearing a mask half as often will reduce the probability of infection by less than half as much (see fig. 2), meaning that we overestimate the statistical power of these studies. Second, the numbers we calculate represent the power the studies would have had were masks 100% effective (i.e. were it impossible to become infected while wearing a mask). To the extent that masks are less than 100% effective, even larger sample sizes would be needed.
For example, a randomized control trial (RCT) at the Hajj pilgrimage [24] assumed a reduction in infection rate from to in order to determine the sample size necessary for a statistical power of . After taking into account that the randomization was done by cluster (i.e. tent) rather than individual, the required sample size was . However, the study reports that individuals in the intervention group on average wore masks for far less than half the time. Under these conditions, even with perfectly effective masks, a 50% reduction in infection probability is impossible. Adherence can be estimated by the product of the fraction of people who wore masks and the fraction of time during which exposure is possible for which masks were used. The data reported in the study indicate an adherence in the mask group of , which could cause at most a reduction in the probability of infection. However, the adherence in the control group was 1.8%, meaning that the maximum possible expected reduction in infection between the two groups would be (eq. 10). Thus the effective adherence value used for this study is 0.014. In addition, the probability of infection without masks is reported to be quite low (). Under these conditions, the required sample size to achieve the desired statistical power of 80% would be 7.8 million (with individual randomization; with cluster randomization an even larger number of participants is needed). Power analyses for other studies and the methods used are described in the appendix and summarized in figs. 1, 5 and LABEL:tab:adh.
Other factors such as false positives may also limit statistical power. For instance, a recent study [25] conducted in Denmark reported that a mask recommendation did not have a statistically significant effect: in the study’s primary composite outcome, 42 vs. 53 people tested positive in the intervention and control groups, respectively. However, the vast majority of these positive results were from antibody tests, and given the antibody test’s comparable incidence and false positive rates (approximately and , respectively), a substantial fraction of the positive antibody tests in both the control and intervention groups are likely to be false positives, which would affect both the study’s power and its statistical analyses [26]. Further false positives could arise from individuals who were infected before the study but for whom seroconversion did not occur until partway through the study. However, false positives were not accounted for in the study’s statistical analysis or conclusions. If only the more reliable PCR tests are considered, then the reduction in infection due to masks (0 vs. 5 infections) is statistically significant ().
Nonlinear effects
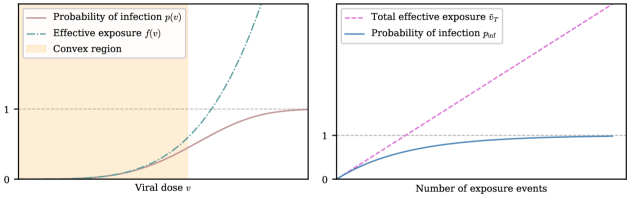
We now describe a framework to account for the nonlinear aspects of mask effectiveness. Given that there is a threshold for the viral dose (the amount of the virus inhaled) below which the probability of infection is very small due to the innate immune system [27, 28], and given that the probability of infection will converge to one (for susceptible individuals) as the viral dose is increased without limit, the probability of infection as a function of viral dose is described by a sigmoid function or S-curve (fig. 3, see Appendix for details). (Concave curves have also been used to model dose response curves, but such an approach ignores threshold effects [29, 30].) For a single exposure event, we can define the dimensionless effective exposure such that the probability of infection is . Conveniently, the effective exposure is additive for independent exposure events, i.e. the total probability of infection is given by where the total effective exposure is simply equal to the sum of the effective exposures for each exposure event.
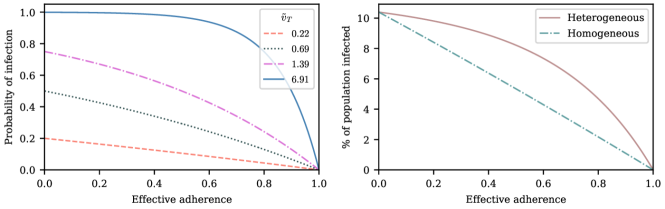
Because the probability of infection is a concave function of the total effective exposure (fig. 3), the protection afforded by a mask is super-linear in the percentage of exposures for which it is worn (e.g. wearing a mask twice as often is more than twice as effective; see fig. 2). These nonlinear effects can be substantial for high cumulative exposures. Under such conditions, a mask may need to be worn for most or nearly all of the exposure events in order to provide significant protection; otherwise the individual is likely to be infected during the exposures for which the mask is not worn. In the limit of an extremely high total exposure, a mask will of course not have an effect on the probability of infection since a susceptible individual will be infected with nearly 100% probability regardless of whether or not the mask is worn.
On the other hand, for low total exposures, the protection masks provide will be approximately proportional to the fraction of exposures for which they are worn. It should be noted that the total exposure of individuals can vary within any given study, such that even if the overall probability of infection is low, most of those who were infected may have been subjected to high cumulative exposures. Studies with low overall probabilities of infection also have an additional difficulty, which is that large sample sizes will be necessary in order that there may be enough infections in the non-mask group to produce a statistically meaningful comparison. In other words, for sufficiently low total exposure, the probability of infection will be quite low even without a mask, and so further reductions to this probability, even if proportionally large, will be small in absolute terms.
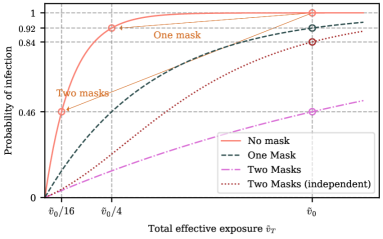
We can also analyze certain compound effects that are not considered in most empirical studies. For instance, masks worn on both the infected and susceptible individuals may prevent a transmission event even if neither mask individually would have. Furthermore, this compound effect may be super-linear: if the effect of only an infected individual wearing a mask is to reduce the infection probability by a factor of and the effect of only a susceptible individual wearing a mask is to reduce the infection probability by a factor of , both individuals wearing a mask could reduce the infection probability by far greater than a factor of , especially for large total effective exposures. In the example shown in fig. 4, the probability of transmission is reduced by only a factor of (a 7% reduction) due to one or the other individuals wearing a mask, while if both wear a mask, the probability of transmission will be reduced by a factor of (a 54% reduction). Similarly, just as there can be a super-linear compound effect from both individuals wearing masks, there can also be super-linear compound effects when mask-wearing is combined with other behaviors that reduce exposure, such as social distancing. Nonlinear effects continue to accumulate when multiple individuals perform multiple behavioral changes that reduce exposure. Recognizing these nonlinear effects is key to appreciating the effectiveness of transmission prevention policies.
It should also be noted that the proportional risk reduction from masks is expected to be large because—due to the convexity of the S-curve (fig. 3) when exposure is low (as is likely for many exposure events)—the probability of the mask-wearer being infected is decreased by a greater factor than the decrease in the viral dose [31] (see Appendix). For these low exposure events, although the probability of infection may be small for any given potential transmission event, given multiple events, the large factors by which the probabilities of infection decrease due to this convexity can significantly reduce both the spread of the virus and the probability that the wearer eventually is infected. In other words, wearing a mask may not only prevent the wearer from spreading viruses to others but may also have a surprisingly large protective effect for the mask-wearer. Indeed, studies that analyze population-level data show that masks significantly reduce transmission [17, 32, 33, 34, 35].
In addition to the probability of infection, the implications of a nonlinear dose-response curve apply to several other outcomes as well. In all of the above analyses, the probability of infection can be replaced with the probability of death or the probability of a particular degree of severity of symptoms, each of which can have a unique S-curve (that can also vary from individual to individual). Thus, even when a mask does not prevent infection, it may reduce the severity of symptoms and the chance of long-term health damage or death. It has been observed for the influenza virus that increasing the viral dose may lead to more adverse symptoms [36, 37, 38], an effect that may also apply to SARS-CoV-2 [39, 38, 40, 41, 42].
Conclusions
Masks block some fraction of viral particles from dispersing from those who are infected and from infecting those who are susceptible and are understood to prevent disease transmission through this mechanism. However, this simple understanding has been questioned based upon mixed empirical evidence. Here we have shown that studies that did not find masks to be effective had limited statistical power and therefore do not imply that masks are ineffective. The empirical evidence as a whole is thus consistent with current epidemiological recommendations to use masks during the COVID-19 pandemic.
We note that psycho-social effects can reinforce the effect of prevention. The more individuals who wear masks, the less stigma that is associated with wearing them, which may make it more likely for others—including those who are infectious (whether symptomatic, pre-symptomatic, or asymptomatic)—to wear masks. Masks may also serve as a reminder to take precautions that compound super-linearly with mask-wearing such as social distancing, although risk compensation, in which mask-wearing provides a sense of security that leads to higher risk taking, is also possible. Effective public communication should emphasize that masks should be used in addition to and not as a substitute for other precautionary measures.
We have also shown that for many exposure events, masks will reduce the probability of infection by a greater factor than the factor by which they filter viral particles. This effect is also compounded non-linearly when both infected and susceptible individuals wear masks. When interpreted in light of this a priori reasoning and the other considerations discussed above, the evidence indicates that, in addition to preventing the wearer from spreading respiratory infections, masks also protect the wearer from contracting them. The studies that did not find statistically significant effects prove only that masks cannot offer protection if they are not worn.
Acknowledgements
This material is based upon work supported by the National Science Foundation Graduate Research Fellowship Program under Grant No. 1122374 and by the Hertz Foundation. We thank Jeremy Rossman for helpful comments.
Appendix
.1 Accounting for non-linearities in the effectiveness of masks
In this section we develop a framework with which to understand the effect of masks. We show that even if masks were to reduce the viral dose by only a modest factor, they may have a significantly larger impact on the probability of infection. We demonstrate that wearing a mask more frequently can super-linearly reduce one’s chance of infection (e.g. wearing a mask 80% of the time reduces one’s probability of infection by more than twice as much as wearing a mask 40% of the time). We also show that when both infected and susceptible individuals wear masks, there can be a super-linear compound effect (e.g. if only infected individuals wearing masks reduces the probability of infecting susceptible individuals by a factor of 3 and only susceptible individuals wearing masks reduces the probability of being infected by a factor of 2, then if both wear masks the probability of infection will be reduced by a factor that is greater than ).
.1.1 General Framework
Although there is insufficient data to precisely describe the probability of infection as a function of the viral dose inhaled in a single exposure event, we can nonetheless derive some constraints on its shape. For a susceptible individual, the probability of infection (or any other outcome such as hospitalization or death) is a function of the viral dose , i.e. the quantity of virus to which the individual is exposed. (This function will vary from individual to individual based on biological factors, but should retain the general properties described below.) For small the probability of a susceptible individual becoming infected will approach zero, and for large this probability will approach one, so and . Since receiving two viral doses at once should not result in a lower probability of infection than the hypothetical in which the exposure to each viral dose could be modeled as an independent event, we have that
| (1) |
Equality will hold only in the absence of threshold effects; given that such effects are well established, we expect the inequality to be strict for small and . In order to characterize the set of functions satisfying eq. 1, we transform using , or equivalently, . Eq. 1 is then equivalent to
| (2) |
Thus eq. 1 is equivalent to being convex. Choosing a convex and then transforming back to yields an S-curve (fig. 3), also known as a sigmoid function or sigmoid curve.
When , it can be shown by Taylor expansion that . Thus, for small viral doses, will be convex as well. If a mask reduces the viral dose by a factor [6, 7], then the mask will reduce the probability of infection (or of some other outcome denoted by such as the probability of severe infection or death) by a factor of , which depends on . When is convex, the factor by which the mask reduces the probability of infection will be greater than (since convexity implies that ). Thus, for small exposures, masks can result in a surprisingly large reduction in the probability of infection. We treat the impact of masks in more generality below, after introducing a framework for considering multiple exposure events.
The S-curve describes the probability of infection for a single exposure event. For independent exposure events, the probability of getting infected is . Using the form as discussed above,
| (3) |
Defining the effective exposure and defining ,
| (4) |
where is the total effective exposure. Considering the effective exposure rather than the actual dose is convenient since the effective exposure for repeated independent exposures is simply the sum of the individual effective exposures. Note that for small effective exposures, the probability of being infected is approximately equal to the effective exposure, i.e. for .
.1.2 One mask
Let be the typical amount by which a mask reduces the effective exposure from a single exposure event—i.e. .
Since and is convex, the simplest possible expression for is the scale-free form , for some and . In this case, if a mask reduces the viral dose to , can be calculated exactly as , regardless of . For small exposures, the infection probability is roughly equal to the effective exposure, which is reduced by a factor greater than (i.e. ) due to convexity (), consistent with the analysis above. This effect could potentially be quite large: e.g. for , a mask filtering half of the viral particles () corresponds to a sixteen-fold reduction in effective exposure (). If we relax this assumption on the function , then becomes an effective parameter that may depend on the distribution of viral doses to which an individual is exposed. Regardless of the precise form of , however, will always hold due to the convexity of , i.e. masks will always have a disproportionately large effect on the effective exposure (and thus also on the infection probability when the effective exposure is small).
Then, if a mask is worn for a fraction of all exposures, the total effective exposure will be reduced from to . The probability of infection is thus
| (5) |
(see fig. 2).
Thus, we see that for any fixed (mask effectiveness) and (total effective exposure without a mask), the benefit of wearing a mask is a convex function of the fraction of the exposure events for which it is worn. In other words, wearing a mask times as often will reduce the infection probability by more than a factor of . Thus, even if masks were 100% effective (), a study in which participants wear masks 10% of the time would need to have sufficient power to detect less than a 10% reduction in the probability of infection. Our analysis therefore overestimates the true power of the studies.
.1.3 Two masks
To the extent that two masks together have an approximately linear effect on the effective exposure (e.g. if one person wearing a mask reduces effective exposure by and the second person wearing a mask reduces effective exposure by , then both wearing masks reduces effective exposure by ), the effect on the probability of transmission will be super-linear, since the probability of infection is concave in the effective exposure . In other words, especially for individuals who would have received a large total effective exposure without masks, both the susceptible and infectious individuals wearing masks will have a larger effect than would be calculated if each mask had an independent effect on the probability of transmission.
If the effect of the two masks on the effective exposure is super-linear (i.e. ), then the effect on the probability of transmission will be super-linear to an even greater extent. If the effect of the two masks on the effective exposure is sub-linear (i.e. ), then whether or not they still have a super-linear effect on the probability of transmission will depend on the total effective exposure.
(Note: Under the simplest possible form for , i.e. , if the mask on the infected individual reduces by a factor of , the mask on the susceptible individual reduces by a factor of , and together the masks reduce by a factor of , then the masks will have a linear effect on effective exposure, i.e. . Under other forms for or assumptions about how the masks affect , other behavior is possible.)
Abbreviations: ITTA: Intention-to-treat analysis; PPA: Per-protocol analysis; ILI: Influenza-like illness; ARI: Acute respiratory infection; URTI: Upper respiratory tract infection; PCR: Polymerase chain reaction test (nasopharyngeal swab test); SARS: Severe Acute Respiratory Syndrome
.2 Power analyses
Let and be the probabilities of getting infected in the non-mask (size ) and mask group (size ), respectively. Defining , the null hypothesis is and the alternate hypothesis is . A test statistic is
| (6) |
where and refer to the observed fraction of infections, assumed to be normally distributed random variables whose means are and (this approximation is asymptotically exact). We use the shorthand for the denominator of ; note that is an estimator for , where is the sum of the asymptotic variances of and . Asymptotically, follows a standard normal distribution. Using the standard notation where is the standard normal cumulative distribution function, the rejection region under for a significance level of is given by the union of
| (7) |
The various studies may use slightly different statistical tests, but the differences between tests should be small and will asymptotically disappear entirely. For any particular values of and , the probability is asymptotically given by and the probability is asymptotically given by . Thus, given and , the power, denoted by and equal to the probability that the null hypothesis is rejected if it is indeed false, is asymptotically given by
| (8) |
Under the assumptions that masks are fully effective () and that the probability of infection decreases linearly with the adherence, the effect of mask usage is
| (9) |
where the adherence is the average fraction of exposure events for which the masks were used (see section 1 of the Appendix; here we use instead of for the adherence to avoid confusion with the significance level). Thus, for an infection probability in the non-mask group (size ), the infection probability in the mask group (size ) will be . Thus, by estimating and for each study, we can use eq. 8 to find power of each study given the sizes of their non-mask and mask groups, as well as the sample size (i.e. total number of participants) that would have been required for 80% power. For the latter estimate, we assume a study design in which the participants are evenly divided between the non-mask and mask groups (i.e. ) and rounded up the necessary sample size to the nearest even integer.
For certain studies, some participants in the non-mask group used masks as well. In this case, adherence in both the mask group and non-mask group must be considered. Under the assumption that probability of infection decreases linearly with effective adherence, the probability of infection in the non-mask group is related to the probability of infection without masks by where is the adherence in the non-mask group and is mask effectiveness. Then the probability of infection in the mask group will be where is the adherence in the mask group. The net adherence is defined by , which yields . In our analyses we assume , which leads to an overestimate for the net adherence of
| (10) |
We estimate using the observed fraction of infections in the non-mask group . To check the robustness of our conclusions, we did a sensitivity analysis and found that if differs from by a standard deviation (i.e. if we increase our estimate of by ), all studies that were under-powered (), except for one [43] remain under-powered. (To ensure robustness we used as the standard deviation, which is the maximum possible value of the true standard deviation .) If underestimates by two standard deviations, another study [44] would have greater than 80% power under our assumptions. It should be noted, however, that these assumptions overestimate the power in multiple ways (fully effective masks, overestimated adherence values, assuming a linear relationship between adherence and effectiveness, and the fact that individuals whose infections were not detected until after the start of the study could have actually been infected before they start of the study, i.e. before the mask intervention was implemented).
A more significant limitation of our analysis is in the difficulty in estimating adherence. Adherence is often reported qualitatively, and even when quantitative, it is reported as the amount of time for which one wears a mask, which may differ from the fraction of exposures for which masks were worn. To account for this difficulty, our strategy has been to consistently overestimate statistical power; to this end, we have erred on the side of overestimating adherence (see LABEL:tab:adh), and have also used other overestimating assumptions described in the previous paragraph.
| No. | Name | Year | Masks used by | Description and calculation |
| 1 | Cowling (ITTA) [45] | 2008 | Infected patients and their contacts | Household study: 45% of index cases used masks and 21% of contacts wore masks. To overestimate adherence, we assume no transmission occurs while either the index patient or contact is wearing a mask. Neglecting correlations between whether or not the index patient wore a mask and the number of contacts of that index patient, an upper bound for the probability that either a contact or the index patient corresponding to that contact used a mask is 45%+21% = 66% (this is likely an overestimate since households in which index patients wear masks and households in which contacts wear masks are almost certainly not mutually exclusive). In the control group, 30 % of index patients and 1 % of contacts used masks. Those classified as using masks used them often or always; therefore we assume that they used masks for 80% of all exposures, a likely overestimate since the participants were asked to use masks only when they are not sleeping or eating. Therefore, the adherence in the mask group is estimated as , and adherence in the control group is estimated as . This leads to a net adherence of 0.37 according to eq. 10. |
| 2 | MacIntyre (ITTA) [19] | 2009 | Contacts of infected patients | Household study over 5 days: Contacts were told to use masks when in the same room as the index patient. We consider only the surgical mask group (the other group was using P2 masks). On day 3, maximum adherence was reported: 45% of contacts used masks for most of the time. We assume that those who used masks used them for 80% of exposures, a likely overestimate since contacts did not use masks while sleeping, even if the child (index patient) was next to them in bed, and because the contacts could have been infected even if they were not in the same room as the index patient. The adherence is estimated as |
| 3 | MacIntyre (PPA) [19] | 2009 | Contacts of infected patients | Household study over 5 days (see row no. 2): Participants in this arm of the per-protocol analysis used masks for out of 5 days. Overestimating adherence at 0.8 for 2 days gives adherence . |
| 4 | MacIntyre (PPA) [19] | 2009 | Contacts of infected patients | Household study over 5 days (see row no. 2): Participants in this arm of the per-protocol analysis used masks for all 5 days. Overestimating adherence at 0.8 for 5 days gives adherence an adherence of . |
| 5 | Alfelali (ITTA) [24] | 2020 | Susceptible individuals | Hajj study: From figure 2 of the study, we can only obtain approximate numbers since numerical data is not available in the figure. An average across the four days gives us the percentage of people using masks for various amounts of time. Using the upper bounds of the reported time ranges, we compute the average mask usage duration. For the last time range (greater than 3 hours), we assume that masks were used on average for 5 hours. This leads to an average mask use of 0.778 hours and an adherence in the mask group of . Participants in the control group used masks for 0.438 hours on average, yielding an adherence in the control group of . The net adherence value is thus (eq. 10). Note that the systematic review [18] uses an older pre-print version of this study. |
| 6 | Alfelali (PPA) [24] | 2020 | Susceptible individuals | Hajj study (see row no. 5): Those who wore masks were compared to those who did not. The average mask use among those who wore masks was 1.637 hours; thus adherence = . |
| 7 | Simmerman (ITTA) [46] | 2011 | Infected patients and their contacts | Household study: We compare the hand-hygiene group with the hand-hygiene + mask group. Only median (and not mean) mask usage was reported for the index and contact individuals; we therefore approximate the mean with the median. The median mask usage for the index patient was 35 minutes. The mean of median mask usage for contacts—parents, siblings and other relations—was 107.9 minutes. We estimate that index patients and contacts were in contact for 10.4 hours per day using data from a similar study [47] (row no. 12). Adherence is therefore estimated as (see row no. 1 for why the index and contact mask usages were added together), a likely overestimate, given that the majority of the households resided in small one-bedroom apartments and thus were likely in contact for significantly greater than 10.4 hours per day on average. Furthermore, contacts could have been infected outside of their homes. Also, it was reported that 17.6% of individuals in the control group used masks, meaning it was likely that those in the hand-hygiene-only group did as well (which would further reduce the net adherence). |
| 8 | Canini (ITTA) [48] | 2010 | Infected patients | Household study: Average mask use was hours per day (from table 3 of the study). We estimate that index and contact patients were in contact for 10.4 hours per day using data from a similar study [47] (row no. 12). Adherence is therefore estimated as , a likely overestimate given that contacts could have been infected outside their homes, or in their homes while not in contact with the index patient. |
| 9 | Aiello (ITTA) [44] | 2010 | Susceptible individuals | University residence hall: Mask usage was recorded inside the residence hall and they were used for hours per day. Assuming that residents spent 12 hours outside the halls, we exclude it from the adherence calculation. Adherence , a likely overestimate because participants were only encouraged but not required to use masks outside the residence halls, where they may be infected. In addition, the participants had left the residence halls for spring break, during which they were not required to wear masks. |
| 10 | Aiello (ITTA) [43] | 2012 | Susceptible individuals | University residence hall: Masks were used for hours per day. Adherence (see row no. 9). |
| 11 | Aiello (ITTA) [43] | 2012 | Susceptible individuals | University residence hall: Masks were used for hours per day. Adherence (see row no. 9). |
| 12 | MacIntyre (ITTA) [47] | 2016 | Infected patients | Household study: In the mask group, index patients were in contact with contacts for an average of 10.4 hours, and used masks for an average of 4.4 hours. The adherence in the mask group is thus estimated as . In the control group, average mask usage was 1.4 hours; adherence in the control group is thus estimated as . Net adherence is thus (eq. 10). |
| 13 | Cowling (ITTA) [49] | 2009 | Infected patients and their contacts | Household study: We compare the hand-hygiene group with the hand-hygiene + mask group. In the hand-hygiene + mask group, 49% of index cases and 26 % of contacts used a mask often or always. We therefore calculate adherence in the hand-hygiene + mask group as (see row no. 1). In the hand-hygiene group, 5 % of contacts and 31 % of index cases used masks, which leads to an adherence in the hand-hygiene group. Net adherence is thus (eq. 10). |
| 14 | Barasheed (ITTA) [50] | 2014 | Susceptible individuals | Hajj pilgramage: 36 people were in the face mask group: 8 people never used a mask; 11 people used masks for hours; 8 people used masks used for 5-8 hours; 9 people used masks for hours (from table 2 of the study). Using the upper limits of the duration ranges (and 12 hours for the hour group), adherence = . |
| 15 | Sung (Pre-post) [51] | 2012 | Potentially infected individuals | Visitors had to use face masks when they visited patients in their rooms and the incidence of infections was recorded among the patients. Although adherence was not reported, it is reasonable to assume that adherence was high since the study was conducted in a hospital where doctors and health care workers would have ensured that protocols are followed; in addition the visitors were in contact with patients only for a limited duration. We therefore assume an adherence of |
| 16 | Choudhry (Survey) [52] | 2006 | Susceptible individuals | Survey study for Hajj pilgrims: We consider the group of male pilgrims who reported using masks most of the time, compared to a group who did not use masks. We assume that masks were not used while sleeping or eating, and note that the pilgrims remain susceptible to infection during such activities since they slept in shared tents. Allotting 10 hours per day for sleeping and eating and other activities during which masks were not worn, we estimate the adherence as . |
| 17 | Al-Jasser (Survey) [53] | 2013 | Susceptible individuals | Survey study for Hajj pilgrims: We consider the group of male pilgrims who reported using masks most of the time, compared to a group who did not use masks, and therefore estimate adherence as 0.59 (see row no. 16). |
| 18 | Suess (ITTA) [54] | 2012 | Infected patients and their contacts | Household study: From figures 2 and 3 in the study, the average mask usage (across 8 days and across both seasons) among contacts and index patients is 69.4% and 56.4%, respectively. From this data it is not impossible that in every household either the index patient or contacts were wearing masks; using this potential overestimate, we calculate adherence as (see row no. 1). |
| 19 | Wu (survey) [55] | 2004 | Susceptible individuals | Survey study: Face mask usage was reported only outside the home. Adherence was reported subjectively – ‘Never’, ‘Sometimes’, ‘Always’ (table 1 of the study). We compare the groups which used masks always and never used masks, and use an adherence value of for the ‘Always’ group, a likely overestimate since participants could have been infected from household contacts. |
| 20 | Kim (survey)[56] | 2011 | Susceptible individuals | Survey study among school children for influenza: Mask usage during school hours was reported as ‘continuous’, ‘irregular’, ‘not used’. We assume an adherence of 0.8 for the ‘continuous’ group (and compare the infection rate to the group that did not use masks), a likely overestimate since children could be infected outside of school hours. |
| 21 | Lau (survey) [57] | 2004 | Susceptible individuals | Survey study during SARS epidemic: Mask usage was recorded only for public places. The study considered the frequent use of masks as using a mask, and occasional/seldom/no use was considered as not using a mask. We assume a value of 0.8 for adherence, a likely overestimate since people could have gotten infected at home where mask usage was not recorded and since some mask usage was possible in the non-mask group. |
| 22 | Lau (survey) [58] | 2004 | Susceptible individuals | Survey study during SARS epidemic: Mask usage was recorded only during hospital visits to patients with SARS. We use an adherence value of 0.8 for hospital settings (see row no. 15). For this study 0.8 is likely an overestimate since SARS infection could have occurred outside of the hospital as well. |
| 23 | Wu (survey) [59] | 2016 | Susceptible individuals | Survey study for influenza-like illness. Mask usage was recorded only during hospital visits. We use an adherence value of 0.8 for hospital settings (see row no. 15). For this study 0.8 is likely a substantial overestimate since infection could have occurred outside of the hospital as well. |
| Name | Year | Reason for exclusion from power analysis |
|---|---|---|
| Shin [60] | 2018 | Study was randomized for testing a common cold drug rather than mask usage, and mask usage was comparable in both of the groups. |
| Zhang [61] | 2013 | Unknown adherence and incomplete data. |
| Jolie [62] | 1998 | Animal to human transmission: We consider only human to human transmission for our analysis. |
| Tahir [63] | 2019 | Animal to human transmission: We consider only human to human transmission for our analysis. |
| Larson [64] | 2010 | Mask adherence was reported to be ‘poor’ but neither the percentage of participants using masks nor the duration of mask usage was reported, so we could not make an estimate for the adherence. |
| Emamian [65] | 2013 | Survey study for Hajj pilgrims: Adherence for mask usage was reported only as ‘Yes’ or ‘No’. Even occasional use of mask was considered as ‘Yes’. Since adherence data stratified by frequency and/or duration was not reported, we could not make an estimate for the adherence. |
| Deris [66] | 2010 | Survey study for Hajj pilgrims: Adherence for mask usage was reported only as ‘Yes’ or ‘No’. Since adherence data stratified by frequency and/or duration was not reported, we could not make an estimate for the adherence. |
| Uchida [67] | 2017 | Survey study for children. Mask usage was reported as ‘using masks at any time or place’. Since adherence data stratified by frequency and/or duration was not reported, we could not make an estimate for the adherence. |
| Balaban [68] | 2012 | Survey study for Hajj pilgrims: Adherence for mask usage was reported only as ‘Yes’ or ‘No’. Since adherence data stratified by frequency and/or duration was not reported, we could not make an estimate for the adherence. |
| Zein | 2002 | Study not available. |
References
- [1] Goodman, B. The forgotten science behind face masks (2020). URL https://www.webmd.com/lung/news/20200826/the-forgotten-science-behind-face-masks. Accessed 2021-02-04.
- [2] Considerations for wearing masks. CDC (2020). URL https://www.cdc.gov/coronavirus/2019-ncov/prevent-getting-sick/cloth-face-cover-guidance.html.
- [3] Coronavirus disease (covid-19) advice for the public. WHO (2020). URL https://www.who.int/emergencies/diseases/novel-coronavirus-2019/advice-for-public.
- [4] Milne, R. & Khan, M. Coronavirus outlier sweden chooses its own path on face masks. Financial Times (2020). URL https://www.ft.com/content/3148de6c-3b33-42d3-8cf6-d0e4263cea82.
- [5] What countries require public mask usage to help contain covid-19? (2020). URL https://masks4all.co/what-countries-require-masks-in-public/. Accessed 2021-02-04.
- [6] Booth, C. M., Clayton, M., Crook, B. & Gawn, J. Effectiveness of surgical masks against influenza bioaerosols. Journal of Hospital Infection 84, 22–26 (2013). URL https://doi.org/10.1016/j.jhin.2013.02.007.
- [7] Gawn, J., Clayton, M., Makison, C. & Crook, B. Evaluating the protection afforded by surgical masks against influenza bioaerosols: gross protection of surgical masks compared to filtering facepiece respirators. Health Safety Exec (2008). URL https://europepmc.org/article/ctx/c3304.
- [8] Lindsley, W. G. et al. Dispersion and exposure to a cough-generated aerosol in a simulated medical examination room. Journal of occupational and environmental hygiene 9, 681–690 (2012). URL https://www.ncbi.nlm.nih.gov/pmc/articles/PMC4688889/.
- [9] Milton, D. K., Fabian, M. P., Cowling, B. J., Grantham, M. L. & McDevitt, J. J. Influenza virus aerosols in human exhaled breath: Particle size, culturability, and effect of surgical masks. PLoS Pathogens 9, e1003205 (2013). URL https://doi.org/10.1371/journal.ppat.1003205.
- [10] Alsved, M. et al. Exhaled respiratory particles during singing and talking. Aerosol Science and Technology 1–5 (2020). URL https://doi.org/10.1080/02786826.2020.1812502.
- [11] van der Sande, M., Teunis, P. & Sabel, R. Professional and home-made face masks reduce exposure to respiratory infections among the general population. PLoS ONE 3, e2618 (2008). URL https://doi.org/10.1371/journal.pone.0002618.
- [12] Leung, N. H. L. et al. Respiratory virus shedding in exhaled breath and efficacy of face masks. Nature Medicine 26, 676–680 (2020). URL https://doi.org/10.1038/s41591-020-0843-2.
- [13] Davies, A. et al. Testing the efficacy of homemade masks: Would they protect in an influenza pandemic? Disaster Medicine and Public Health Preparedness 7, 413–418 (2013). URL https://doi.org/10.1017/dmp.2013.43.
- [14] Konda, A. et al. Aerosol filtration efficiency of common fabrics used in respiratory cloth masks. ACS Nano 14, 6339–6347 (2020). URL https://doi.org/10.1021/acsnano.0c03252.
- [15] Chughtai, A. A., Seale, H. & Macintyre, C. R. Effectiveness of cloth masks for protection against severe acute respiratory syndrome coronavirus 2. Emerging Infectious Diseases 26 (2020). URL https://doi.org/10.3201/eid2610.200948.
- [16] Greenhalgh, T., Schmid, M. B., Czypionka, T., Bassler, D. & Gruer, L. Face masks for the public during the covid-19 crisis. BMJ 369 (2020). URL https://www.bmj.com/content/369/bmj.m1435. eprint https://www.bmj.com/content/369/bmj.m1435.full.pdf.
- [17] Howard, J. et al. Face masks against COVID-19: An evidence review (2020). URL https://doi.org/10.20944/preprints202004.0203.v3.
- [18] Brainard, J. S., Jones, N., Lake, I., Hooper, L. & Hunter, P. Facemasks and similar barriers to prevent respiratory illness such as COVID-19: A rapid systematic review (2020). URL https://doi.org/10.1101/2020.04.01.20049528.
- [19] MacIntyre, C. R. et al. Face mask use and control of respiratory virus transmission in households. Emerging Infectious Diseases 15, 233–241 (2009). URL https://doi.org/10.3201/eid1502.081166.
- [20] Cowling, B. J., Zhou, Y., Ip, D. K. M., Leung, G. M. & Aiello, A. E. Face masks to prevent transmission of influenza virus: a systematic review. Epidemiology and Infection 138, 449–456 (2010). URL https://doi.org/10.1017/s0950268809991658.
- [21] Aledort, J. E., Lurie, N., Wasserman, J. & Bozzette, S. A. Non-pharmaceutical public health interventions for pandemic influenza: an evaluation of the evidence base. BMC Public Health 7 (2007). URL https://doi.org/10.1186/1471-2458-7-208.
- [22] Xiao, J. et al. Nonpharmaceutical measures for pandemic influenza in nonhealthcare settings—personal protective and environmental measures. Emerging Infectious Diseases 26, 967–975 (2020). URL https://doi.org/10.3201/eid2605.190994.
- [23] Chu, D. K. et al. Physical distancing, face masks, and eye protection to prevent person-to-person transmission of SARS-CoV-2 and COVID-19: a systematic review and meta-analysis. The Lancet 395, 1973–1987 (2020). URL https://doi.org/10.1016/s0140-6736(20)31142-9.
- [24] Alfelali, M. et al. Facemask against viral respiratory infections among hajj pilgrims: A challenging cluster-randomized trial. PLOS ONE 15, e0240287 (2020). URL https://doi.org/10.1371/journal.pone.0240287.
- [25] Bundgaard, H. et al. Effectiveness of adding a mask recommendation to other public health measures to prevent SARS-CoV-2 infection in danish mask wearers. Annals of Internal Medicine (2020). URL https://doi.org/10.7326/m20-6817.
- [26] Taleb, N. N. Hypothesis testing in the presence of false positives: The flaws in the Danish mask study (2020). URL https://fooledbyrandomnessdotcom.wordpress.com/2020/11/25/hypothesis-testing-in-the-presence-of-false-positives-the-flaws-in-the-danish-mask-study/. Accessed 2020-12-07.
- [27] Yezli, S. & Otter, J. A. Minimum infective dose of the major human respiratory and enteric viruses transmitted through food and the environment. Food and Environmental Virology 3, 1–30 (2011). URL https://www.ncbi.nlm.nih.gov/pmc/articles/PMC7090536/.
- [28] Mandavilli, A. It’s not whether you were exposed to the virus. it’s how much. The New York Times (2020). URL https://www.nytimes.com/2020/05/29/health/coronavirus-transmission-dose.html.
- [29] Sze To, G. N. & Chao, C. Y. H. Review and comparison between the wells–riley and dose-response approaches to risk assessment of infectious respiratory diseases. Indoor air 20, 2–16 (2010). URL https://www.ncbi.nlm.nih.gov/pmc/articles/PMC7202094/.
- [30] Teunis, P. F., Brienen, N. & Kretzschmar, M. E. High infectivity and pathogenicity of influenza a virus via aerosol and droplet transmission. Epidemics 2, 215–222 (2010). URL https://www.sciencedirect.com/science/article/pii/S1755436510000605.
- [31] Taleb, N. N. The masks masquerade (2020). URL https://medium.com/incerto/the-masks-masquerade-7de897b517b7. Accessed 2021-02-04.
- [32] Lyu, W. & Wehby, G. L. Community use of face masks and COVID-19: Evidence from a natural experiment of state mandates in the US. Health Affairs 39, 1419–1425 (2020). URL https://doi.org/10.1377/hlthaff.2020.00818.
- [33] Kenyon, C. Widespread use of face masks in public may slow the spread of SARS CoV-2: an ecological study (2020). URL https://doi.org/10.1101/2020.03.31.20048652.
- [34] Leffler, C. T. et al. Association of country-wide coronavirus mortality with demographics, testing, lockdowns, and public wearing of masks. update august 4, 2020. (2020). URL https://doi.org/10.1101/2020.05.22.20109231.
- [35] Cheng, V. C.-C. et al. The role of community-wide wearing of face mask for control of coronavirus disease 2019 (COVID-19) epidemic due to SARS-CoV-2. Journal of Infection 81, 107–114 (2020). URL https://doi.org/10.1016/j.jinf.2020.04.024.
- [36] Memoli, M. J. et al. Validation of the Wild-type Influenza A Human Challenge Model H1N1pdMIST: An A(H1N1)pdm09 Dose-Finding Investigational New Drug Study. Clinical Infectious Diseases 60, 693–702 (2014). URL https://doi.org/10.1093/cid/ciu924.
- [37] Virlogeux, V. et al. Incubation period duration and severity of clinical disease following severe acute respiratory syndrome coronavirus infection. Epidemiology 26, 666–669 (2015). URL https://doi.org/10.1097/ede.0000000000000339.
- [38] Gandhi, M., Beyrer, C. & Goosby, E. Masks do more than protect others during COVID-19: Reducing the inoculum of SARS-CoV-2 to protect the wearer. Journal of General Internal Medicine (2020). URL https://doi.org/10.1007/s11606-020-06067-8.
- [39] Chan, J. F.-W. et al. Surgical mask partition reduces the risk of noncontact transmission in a golden syrian hamster model for coronavirus disease 2019 (COVID-19). Clinical Infectious Diseases (2020). URL https://doi.org/10.1093/cid/ciaa644.
- [40] Ing, A. J., Cocks, C. & Green, J. P. COVID-19: in the footsteps of ernest shackleton. Thorax 75, 693–694 (2020). URL https://doi.org/10.1136/thoraxjnl-2020-215091.
- [41] Hundreds test positive at tyson foods plant in arkansas as china suspends imports (2020). URL https://www.latimes.com/world-nation/story/2020-06-22/hundreds-test-positive-coronavirus-tyson-foods-plant-arkansas.
- [42] Bielecki, M. et al. Social distancing alters the clinical course of COVID-19 in young adults: A comparative cohort study. Clinical Infectious Diseases (2020). URL https://doi.org/10.1093/cid/ciaa889.
- [43] Aiello, A. E. et al. Facemasks, hand hygiene, and influenza among young adults: A randomized intervention trial. PLoS ONE 7, e29744 (2012). URL https://doi.org/10.1371/journal.pone.0029744.
- [44] Aiello, A. E. et al. Mask use, hand hygiene, and seasonal influenza-like illness among young adults: A randomized intervention trial. The Journal of Infectious Diseases 201, 491–498 (2010). URL https://doi.org/10.1086/650396.
- [45] Cowling, B. J. et al. Preliminary findings of a randomized trial of non-pharmaceutical interventions to prevent influenza transmission in households. PLoS ONE 3, e2101 (2008). URL https://doi.org/10.1371/journal.pone.0002101.
- [46] Simmerman, J. M. et al. Findings from a household randomized controlled trial of hand washing and face masks to reduce influenza transmission in bangkok, thailand. Influenza and Other Respiratory Viruses 5, 256–267 (2011). URL https://doi.org/10.1111/j.1750-2659.2011.00205.x.
- [47] MacIntyre, C. R. et al. Cluster randomised controlled trial to examine medical mask use as source control for people with respiratory illness. BMJ Open 6, e012330 (2016). URL https://doi.org/10.1136/bmjopen-2016-012330.
- [48] Canini, L. et al. Surgical mask to prevent influenza transmission in households: A cluster randomized trial. PLoS ONE 5, e13998 (2010). URL https://doi.org/10.1371/journal.pone.0013998.
- [49] Cowling, B. J. et al. Facemasks and hand hygiene to prevent influenza transmission in households. Annals of Internal Medicine 151, 437 (2009). URL https://doi.org/10.7326/0003-4819-151-7-200910060-00142.
- [50] Barasheed, O. et al. Pilot randomised controlled trial to test effectiveness of facemasks in preventing influenza-like illness transmission among australian hajj pilgrims in 2011. Infectious Disorders - Drug Targets 14, 110–116 (2014). URL https://doi.org/10.2174/1871526514666141021112855.
- [51] Sung, A. D. et al. Surgical mask usage reduces the incidence of parainfluenza virus 3 in recipients of stem cell transplantation. Blood 120, 462–462 (2012). URL https://doi.org/10.1182/blood.v120.21.462.462.
- [52] Choudhry, A. J., Al-Mudaimegh, K. S., Turkistani, A. M. & Al-Hamdan, N. A. Hajj-associated acute respiratory infection among hajjis from Riyadh. East. Mediterr. Health J. 12, 300–309 (2006). URL https://apps.who.int/iris/handle/10665/117087.
- [53] Al-Jasser, F. S., Kabbash, I., Almazroa, M. A. & Memish, Z. Patterns of diseases and preventive measures among domestic hajjis from central, saudi arabia. Saudi medical journal 33 8, 879–86 (2012). URL http://www.emro.who.int/emhj-vol-19-2013/volume-19-supplement-1-mass-gathering/patterns-of-diseases-and-preventive-measures-among-domestic-hajjis-from-central-saudi-arabia-complete-republication.html.
- [54] Suess, T. et al. The role of facemasks and hand hygiene in the prevention of influenza transmission in households: results from a cluster randomised trial; berlin, germany, 2009-2011. BMC Infectious Diseases 12 (2012). URL https://doi.org/10.1186/1471-2334-12-26.
- [55] Wu, J. et al. Risk factors for SARS among persons without known contact with SARS patients, beijing, china. Emerging Infectious Diseases 10, 210–216 (2004). URL https://doi.org/10.3201/eid1002.030730.
- [56] Kim, C. O., Nam, C. M., Lee, D.-C., Chang, J. & Lee, J. W. Is abdominal obesity associated with the 2009 influenza a (h1n1) pandemic in korean school-aged children? Influenza and Other Respiratory Viruses 6, 313–317 (2011). URL https://doi.org/10.1111/j.1750-2659.2011.00318.x.
- [57] Lau, J., Tsui, H., Lau, M. & Yang, X. Sars transmission, risk factors, and prevention in hong kong. Emerging Infectious Diseases 10, 587 – 592 (2004). URL https://doi.org/10.3201/eid1004.030628.
- [58] Lau, J. T. et al. Probable secondary infections in households of SARS patients in hong kong. Emerging Infectious Diseases 10, 236–243 (2004). URL https://doi.org/10.3201/eid1002.030626.
- [59] Wu, S. et al. Hygiene behaviors associated with influenza-like illness among adults in beijing, china: A large, population-based survey. PLOS ONE 11, e0148448 (2016). URL https://doi.org/10.1371/journal.pone.0148448.
- [60] Shin, K. et al. Effects of orally administered lactoferrin and lactoperoxidase on symptoms of the common cold. International Journal of Health Sciences 12, 44 – 50 (2018).
- [61] Zhang, L. et al. Protection by face masks against influenza a(h1n1)pdm09 virus on trans-pacific passenger aircraft, 2009. Emerging Infectious Diseases 19 (2013). URL https://doi.org/10.3201/eid1909.121765.
- [62] Jolie, R., Bäckström, L. & Thomas, C. Health problems in veterinary students after visiting a commercial swine farm. Canadian journal of veterinary research = Revue canadienne de recherche vétérinaire 62, 44–8 (1998).
- [63] Tahir, M. F. et al. Seroprevalence and risk factors of avian influenza h9 virus among poultry professionals in rawalpindi, pakistan. Journal of Infection and Public Health 12, 482–485 (2019). URL https://doi.org/10.1016/j.jiph.2018.11.009.
- [64] Larson, E. L. et al. Impact of non-pharmaceutical interventions on URIs and influenza in crowded, urban households. Public Health Reports 125, 178–191 (2010). URL https://doi.org/10.1177/003335491012500206.
- [65] Emamian, M., Hassani, A. & Fateh, M. Respiratory tract infections and its preventive measures among hajj pilgrims, 2010: A nested case control study. International Journal of Preventive Medicine 4, 1030 – 1035 (2013).
- [66] Deris, Z. Z. et al. The prevalence of acute respiratory symptoms and role of protective measures among malaysian hajj pilgrims. Journal of Travel Medicine 17, 82–88 (2010). URL https://doi.org/10.1111/j.1708-8305.2009.00384.x.
- [67] Uchida, M. et al. Effectiveness of vaccination and wearing masks on seasonal influenza in matsumoto city, japan, in the 2014/2015 season: An observational study among all elementary schoolchildren. Preventive Medicine Reports 5, 86–91 (2017). URL https://doi.org/10.1016/j.pmedr.2016.12.002.
- [68] Balaban, V. et al. Protective practices and respiratory illness among US travelers to the 2009 hajj. Journal of Travel Medicine 19, 163–168 (2012). URL https://doi.org/10.1111/j.1708-8305.2012.00602.x.