Quantum dynamics of Mn2+ in dimethylammonium magnesium formate
Abstract
Dimethylammonium magnesium formate, [(CH3)2NH2][Mg(HCOO)3] or DMAMgF, is a model to study high temperature hybrid perovskite-like dielectrics. This compound displays a phase transition from para to ferroelectric at about 260 K. Using multifrequency electron spin resonance in continuous wave and pulsed modes, we herein present the quantum dynamic of Mn2+ ion probe in DMAMgF. In the high temperature paraelectric phase, we observe a large distribution of the zero field splitting that is attributed to high local disorder and further supported by DFT computations. In the low temperature ferroelectric phase, a single structure phase is detected and shown to contain two magnetic structures. The complex EPR signals were identifed by the means of Rabi oscillation method combined to crystal fields kernel density estimation.
I Introduction
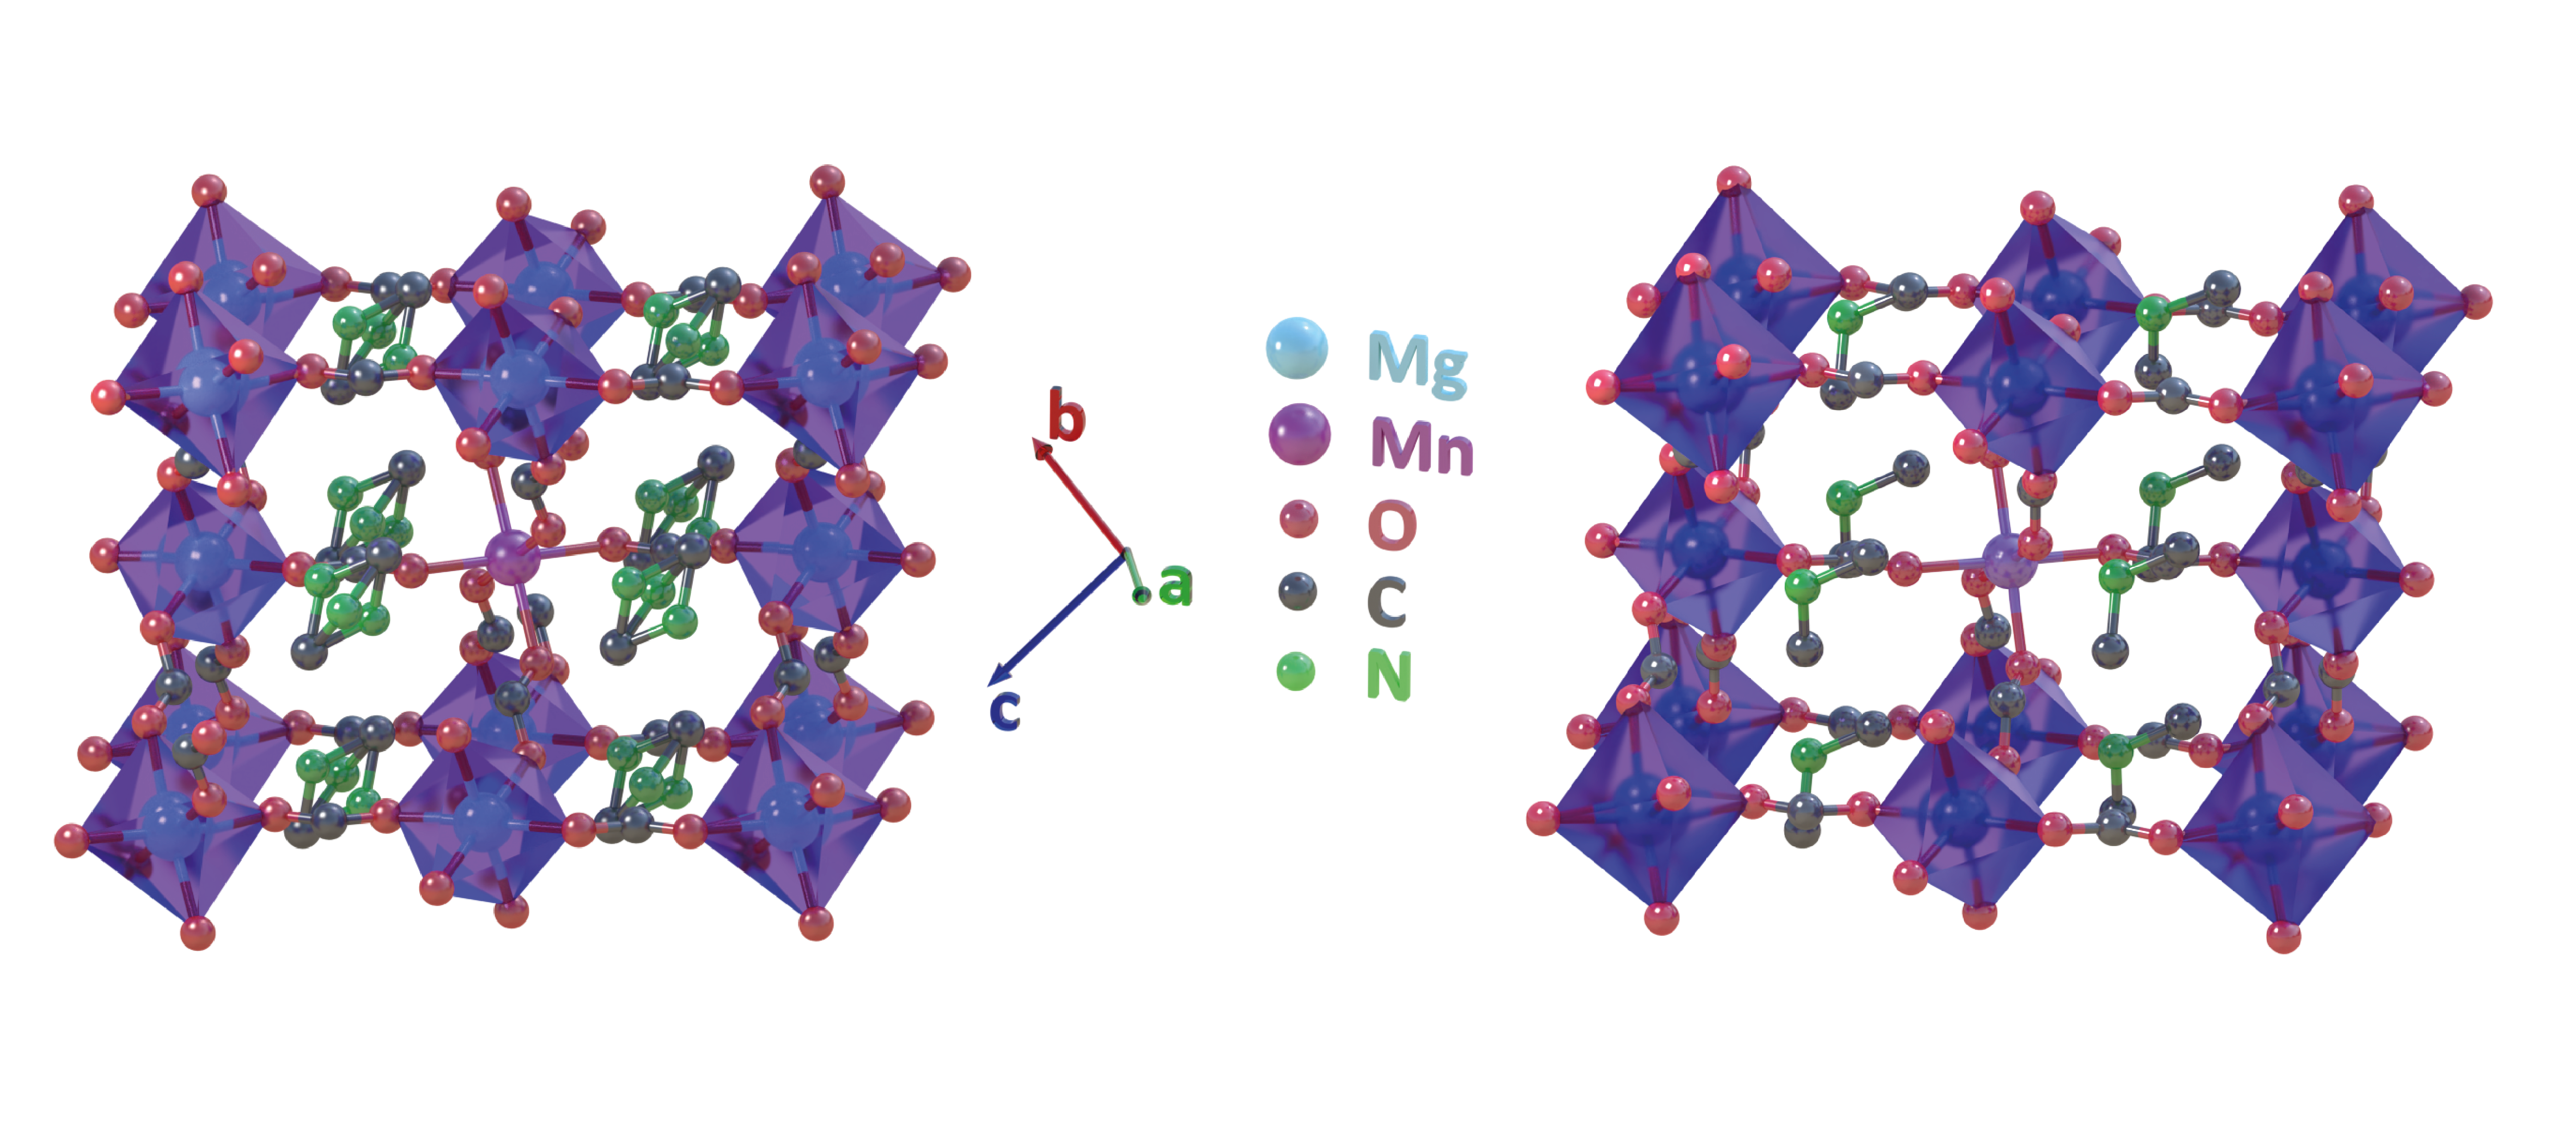
Metal-organic frameworks (MOFs) are constituted of two main building units: the framework consisting of metal centers connected to each other by organic linker molecules and the cation molecule in the cavity the dynamics of which are responsible for the dielectric transition. Previous works report hybrid organic-inorganic metal-organic frameworks (MOF), such as [(CH3)2NH2][M(HCOO)3] (dimethylammonium metal formate or DMAMF, M is divalent transition metal ionsJain et al. (2008); Besara et al. (2011); Jain et al. (2009); Abhyankar, Bertaina, and Dalal (2015); Bertaina et al. (2018); Wang et al. (2013); Sánchez-Andújar et al. (2014). Heat capacity and dielectric measurements of DMZnF indicated a phase transition at approximately 160 K Besara et al. (2011). The order-disorder phase transition is a common property in these materials. At higher temperatures in the disordered phase the (CH3)2NH (DMA+, dimethylammonium) cation that is trapped within the cage is disordered, which means that the nitrogen from the amine group can occupy three locally equivalent positions by forming hydrogen bonds with oxygen atoms from the formate linkers. As the temperature is decreased, the long-range order is established due to the cooperative ordering of the cations at . In the low temperature phase the nitrogen atoms freezes in to a single position in the cavity, while the metal-formate framework becomes more distorted Besara et al. (2011). The Mg analogue (DMMgF), is known to exhibit dielectric transition at exceptionally high of approximately 270 KPato-Doldán et al. (2012). The single crystal X-ray diffraction (XRD) studies reveal that the high- and low-temperature phases of these compounds belong to the trigonal, (centrosymmetric) and the monoclinic, (non-centrosymmetric) space groups, respectively Pato-Doldán et al. (2012); Asaji et al. (2014). The metal-formate frameworks of these materials consist of pseudo-cuboid cavities, each containing a single DMA+ cation as shwo in Fig. 2. DMMgF has been intensively investigated using heat capacity, dielectric, and XRD measurementsPato-Doldán et al. (2012); Asaji et al. (2014). However, despite this huge effort the precise nature of the phase transition in DMMgF is still obscured. Among many other experimental methods, electron paramagnetic resonance (EPR) spectroscopy is well-suited to study structural phase transitions Abhyankar, Bertaina, and Dalal (2015); Abhyankar et al. (2018); Bertaina et al. (2018); Šimėnas et al. (2015, 2018, 2017). It used to detect the local environment of a paramagnetic center (e.g., local order parameter such as electric polarization) that can be influenced by the structural transformations. Although most of the MOFs do not contain any intrinsic paramagnetic center, they can be doped with a small amount of paramagnetic transition metal ions (e.g., Mn2+) which act as local probes in the structure. In our previous studies we have employed continuous wave (CW) EPR spectroscopy to successfully investigate the phase transition in undoped DMAMnF and DMAZnF:Mn2+MOFs Abhyankar, Bertaina, and Dalal (2015); Bertaina et al. (2018). However, due to the strong magnetic dipolar and exchange interactions between the Mn2+ centers the EPR spectrum of DMAMnF consists of a single broad line which is barely sensitive to the ordering of the DMA+ cations Abhyankar, Bertaina, and Dalal (2015). Also, slow dynamics of DMA+ cation around the phase transitions in DMAZnF:Mn2+was investigated using S-Band (4 GHz) EPR. S-Band EPR spectra yielded clear signatures of the slow motion of both the formate and DMA+ groupsBertaina et al. (2018). EPR methods have also been used to characterize the low temperature phases and dynamics in Mn2+ and Cu2+ doped niccolite [NH3(CH2)4NH3][Zn(HCOO)3]2 Šimėnas et al. (2018) . Mn2+ doping in such systems is the probe of choice for the local properties (crystal fields, motion). The large number of EPR transitions as well as the long coherence time allows us to have access to the quantum dynamics of the spins. Large spin ions like Mn2+ () is used for their quantum coherence properties as a potential qubitLoss and DiVincenzo (1998); Leuenberger and Loss (2001). In weak crystal field it was shown that multiple quantum coherence can be induced and controlled Bertaina et al. (2009, 2015a, 2011a). In this paper, by mean of incoherent (continous wave) and coherent (pulsed wave) EPR, we describe the quantum dynamics of DMAMgF:Mn2+. We show how the complex quantum dynamics of Mn2+ in moderate crystal fields can be resolved using a kernel density estimation.
II Materials and methods
II.1 Sample preparation
Sample preparation The DMAMgF:Mn2+samples were prepared using the method similar to the one described in detail in our earlier paper with some minor modifications. A 23 mL solution of 50 vol % dimethylformamide (DMF) in Nanopure water into which 85.0 mM MgCl2 and 2 M MnCl2 (0.002%) were dissolved was sealed in a 35 mL pressure vessel. The pressure vessel was then heated to 140 C for 2 days, then allowed to cool to room temperature. Once cool, the supernatant was decanted. Single crystals were obtained by slowly evaporating the solution in a 10 dram glass vial with a 1 in. diameter. We assumed a cuboid shape of the crystal, and the axes of the Cartesian reference frame were chosen such that they coincide with the edges of the crystal. (102) parallel to H and the angular dependent single crystal HF-EPR measurements were performed by rotating the sample about (112) plane.
II.2 Single crystal X-ray diffraction
A suitable crystal for compound DMAMgF:Mn2+was measured on a Rigaku Oxford Diffraction SuperNova diffractometer at 220 K (=260K) at the CuK radiation (=1.54184 Å). Data collection reduction and multiscan ABSPACK correction were performed with CrysAlisPro (Rigaku Oxford Diffraction). Using Olex2Dolomanov et al. (2009) the structures were solved by intrinsic phasing methods with SHELXT Sheldrick (2015a) and SHELXLSheldrick (2015b) was used for full matrix least squares refinement. All H-atoms were found experimentally and their coordinates and Uiso parameters were constraint to 1.5Ueq (parent atoms) for the methyls and to 1.2Ueq (parent atom) for the other carbons.
II.3 EPR spectroscopy
X-band (about 9.6GHz) EPR measurements were performed using two conventional Bruker spectrometers operating in continuous wave (cw) mode X-band (EMX - 9.6 GHz) and pulse mode X-band (E680 9.6 GHz). The cw spectrometer uses a standard 4102ST resonator (TE102) installed in an oxford cryostat ESR900. Low temperature measurements were performed using a cryogen free Bruker Stinger cryocooler allowing the temperature to reach 7K. The angular dependence was measured using an automatic goniometer. Magnetic field modulation ( kHz) associated with lock-in detection was employed, resulting in the derivative of the signal. The amplitude of the modulation can be set up to 10 G and was carefully chosen to be below any linewidth to avoid overmodulation effect.
The pulse spectrometer was used to performed Rabi oscillations measurements on Mn2+ ions Bertaina et al. (2011a) using the sequence where is Rabi pulse which controls the coherent rotation of the spin and is a wait time longer than the coherence time in order to destroy the transverse magnetization but shorter than the relaxation time maintaining the longitudinal magnetization . The later is then recorded by the standard Hahn echo. Du to the large distribution of transitions, the pulse is selective in DMAMgF:Mn2+. However, it is more convenient in field sweep Rabi oscillation sequence since one want to excite just a small quantity of spin (the ones actually in resonance) in the spin packet. The measurements were performed at 7K using the Bruker MD5 dielectric resonator overcoupled. The microwave field was calibrated by measuring the nutation of a S=1/2 standard.
High-field/high-frequency EPR (HF-EPR) experiments have been carried out using a homemade quasioptical superheterodyn setup developed at NHMFL van Tol, Brunel, and Wylde (2005). The spectrometer operates at 240 GHz and at temperature from RT down to 5 K. Angular dependence with respect of magnetic field direction is achieved using a manual goniometer every 18∘
II.4 DFT
All theoretical calculations were based on the Density Functional Theory (DFT) and were performed with the ORCA program packageNeese (2018). To facilitate comparisons between theory and experiments, all DFT models were obtained from the experimental X-ray crystal structures and were optimized while constraining the positions of all heavy atoms to their experimentally derived coordinates. Only the positions of the hydrogen atoms were relaxed because these are not reliably determined from the X-ray structure. Geometry optimizations were undertaken using the GGA functional BP86Perdew (1986a, b); Becke (1988) in combination with the TZV/PSchäfer, Huber, and Ahlrichs (1994) basis set for all atoms and by exploiting the resolution of the identity (RI) approximation in the Split-RI-J variantNeese (2003) with the appropriate Coulomb fitting setsWeigend (2006). Increased integration grids (Grid4 and GridX4 in ORCA convention) and tight SCF convergence criteria were used. The zero-field splitting parameters were obtained from additional single-point calculations using the BP functional. Scalar relativistic effects were included with ZORA paired with the SARC def2-TZVP(-f) basis setsPantazis et al. (2008); Pantazis and Neese (2009) and the decontracted def2-TZVP/J Coulomb fitting basis sets for all atoms. The spin-spin contribution to the zfs was calculated on the basis of the UNO determinantSinnecker and Neese (2006).
III Rabi distribution calculation
To simulate the EPR spectra, we used the following Hamiltonian:
| (1) |
Here, the first term represents the Zeeman interaction with the g tensor and is the Bohr magneton, the second represents the hyperfine interaction with the hyperfine constant tensor considered isotropic, while the last term represents the crystal-field interaction in the formalism of the extended Stevens operatorsAbragam (1950); Ryabov (1999) (=2, 4, 6 and ). The are real coefficients with the relations : the axial anisotropy, the rhombic anisotropy, the cubic contribution and the fourth order contribution. terms were considered small enough to be neglected. and are considered as scalar (isotropic) for Mn2+ .
The EPR simulations were performed using a hybrid method. The conventional cw EPR spectra were simulated using the Matlab package Easyspin v5.2.28 Stoll and Schweiger (2006) .
The Rabi mode distributions were computed using a database approach. Due to the large anisotropy and the disoriented nature of DMAMgF:Mn2+at low temperature, the full dynamical density matrix model developed in ref. [Bertaina et al., 2015b] for photon transitions should have been too heavy to implement and unnecessary. Due to the large zfs expected in this family of compounds Šimėnas et al. (2018); Bertaina et al. (2018), only the 1-photon transitions are expected to occur(n-photon transitions are expected when Bertaina et al. (2011b) with the microwave field ). Using the first order Fermi golden rule, the Rabi frequency of a transition to is . The database of the Rabi frequencies was constructed as the following. The static field orientation is set first, then, after diagonalization of the Hamiltonian, all transitions fields are computed (regardless of the intensity), the Rabi frequency of each transition is calculated by the Fermi’s golden rule and the intensity of the transition simply equals the square of the Rabi frequencies. Orientations, resonance fields, transitions and Rabi frequencies are collected in the database. The treatment of the data is then realized using Pandas module of Python 3.8. We use the kernel density estimation (KDE)Rosenblatt (1956) to reconstruct the Rabi oscillation distribution:
| (2) |
where is the kernel function, the bandwidth and the number of samples. This method can be seen as an extension of the histogram method which counts the number of occurrences around a value. In our analysis we used the Gaussian kernel function . Since we have access to the transitions, field resonances and orientations, we can identify the nature and distribution of all transitions.
IV Results and discussion
IV.1 HT Phase
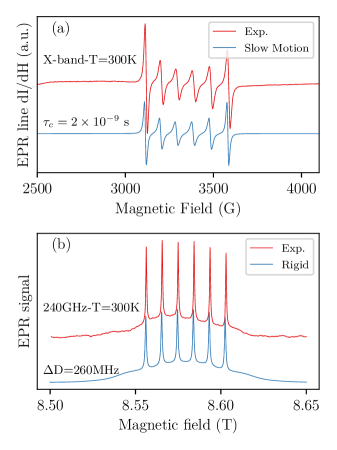
Continuous wave EPR studies have been previously reported for the LT phase of the Zn compound, DMAZnF:Mn2+ Šimėnas et al. (2015, 2018) and a particular focus has been made on the dynamics in the HT phase Bertaina et al. (2018). Here we are interested in determining focus on how the change from Zn to Mg, which highly affects the structural phase transition temperature, can also have effects on the dynamics probed by EPR. Figure 3(a) shows the EPR signal of DMAMgF:Mn2+for H[102] at room temperature. The signal is composed of 6 lines corresponding to the nuclear spin projection of 55Mn. The separation between lines is 93.6 G which corresponds to 262.3 MHz or 87.5 cm-1 and is a classical value reported for Mn2+ ions Low (1957). In solid-state EPR and for single crystal measurements, the intensity and linewidth of the 6 line pattern is expected to be comparable while in our case the lines at lowest and highest field (corresponding to ) are clearly sharper than the onespresent in the intermediate field region. Moreover no forbidden transition Smith, Auzins, and Wertz (1968) is resolved while it is usually observed in Mn2+ ions in anisotropic crystal field. This behavior was also observedBertaina et al. (2018) in DMAZnF:Mn2+ and was attributed to the slow motion regime McLachlan (1964); Goldammer and Zorn (1974); von Goldammer, Muller, and Conway (1974) caused by the DMA+ movement around the Mn2+ ion. Using this modelMcLachlan (1964) we managed to simulate the experimental data within DMAZnF:Mn2+. Indeed, by decreasing the temperature, the DMA+ slow down and when its correlation time is longer than the time scale of the measurement (i.e. ), the system is considered frozen and can be described by the rigid model. However, in DMAMgF:Mn2+, (263 K) is higher than in the Zn counterparts (173 K) and the structure of the system changes before reaching the frozen regime. To observe the frozen regime we have to increase significantly the frequency. Fig. 3(b) shows the EPR signal of DMAMgF:Mn2+recorded at =240 GHz and at room temperature. Contrary to the X-band measurements, all of the six nuclear isotope lines for transitions have the same intensity suggesting that we have reached to rigid limit of EPR. However, whatever the orientation of crystal is, no satellite lines corresponding to and were resolved indicating a large distribution of the crystal field parameters. To simulate the spectrum of Fig.3(b) we used the crystal field parameters of the DMAZnF:Mn2+compound Bertaina et al. (2018) =250 MHz but we have to set a distribution of the crystal field parameter =260 MHz which seems inconsistent since is usually less than 10% of . To explain this large value of it is worth to mention that, in the HT phase, the system is locally highly disordered. Indeed, the Mn2+ ion is surrounded by 8 DMA+ cations which all have 3 different positions giving rise to configurations of the crystal field which are responsible for the large zfs distribution.
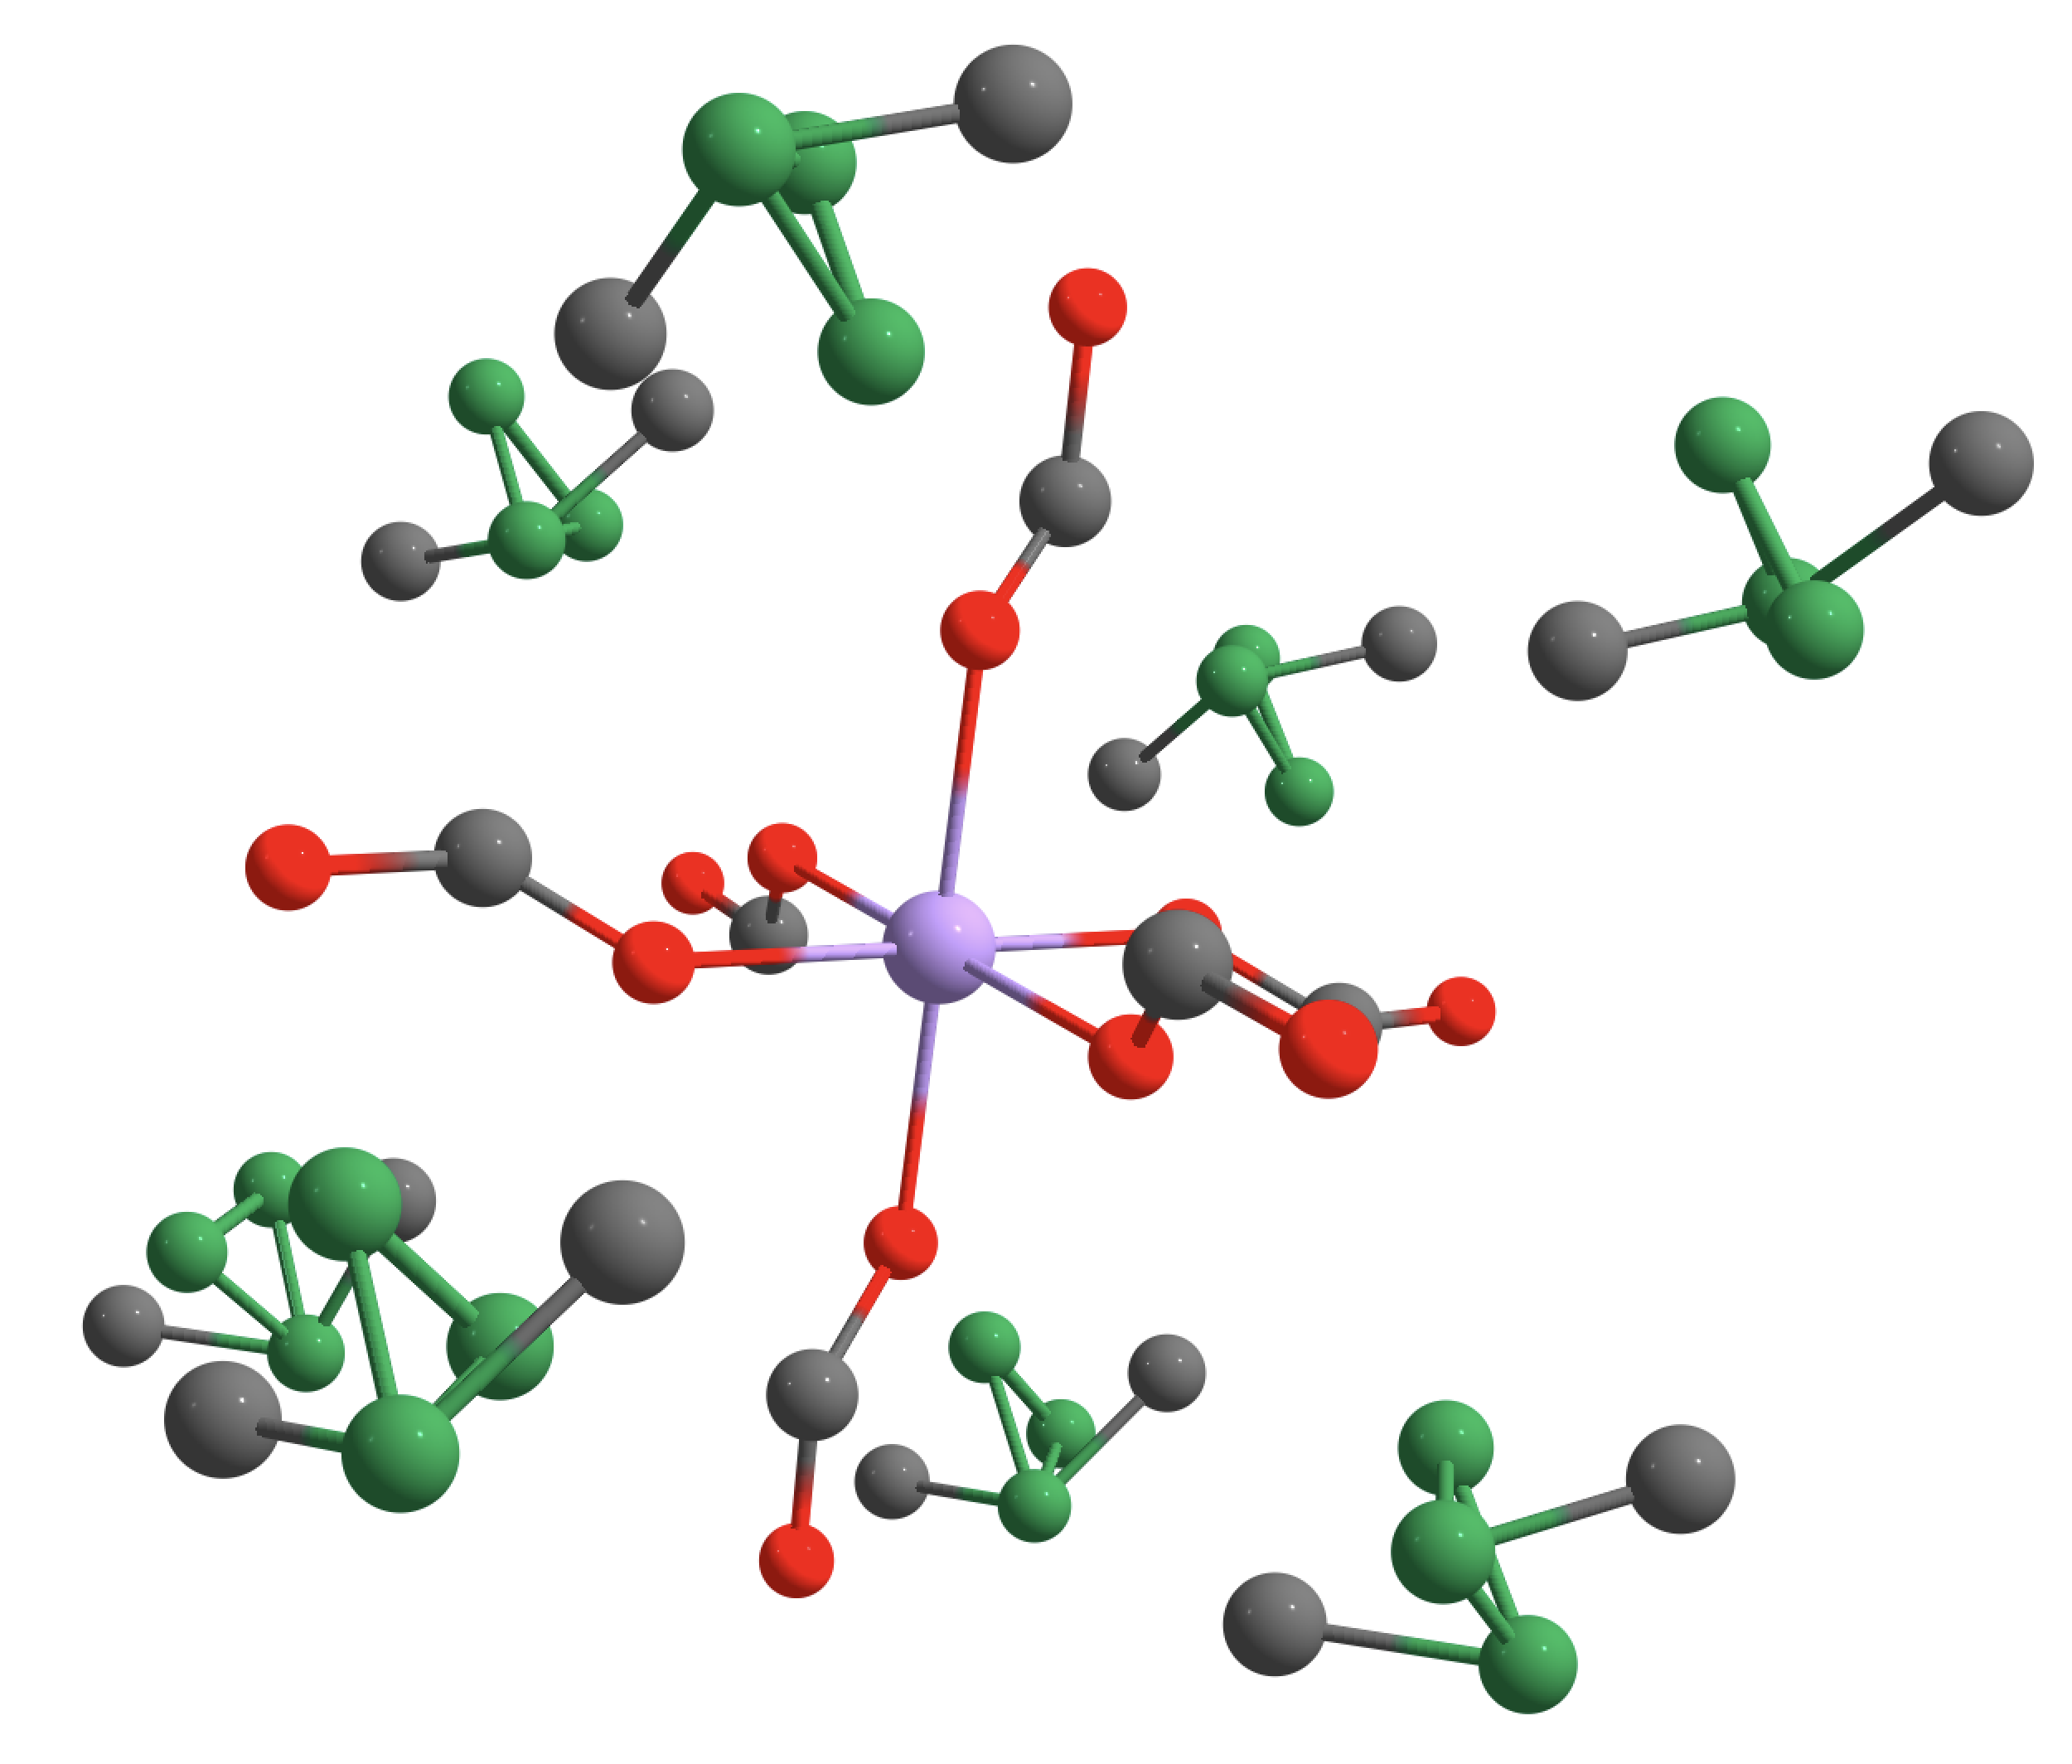
To support and rationalise the experimental findings about , DFT calculations were conducted. To do so, we employed a methodology similar to that from our previous study on DMAZnF:Mn2+Bertaina et al. (2008) and worked with a minimal model consisting in one Mn2+ ion bound to 6 formate anions and surrounded by 8 DMA+ cations 111See Supplemental Material. The resulting metal cluster displays a quasi-octahedral coordination geometry. Based on the high temperature single crystal XRD structure of DMMgF that identified three equivalent positions of the nitrogen in each DMA+, we have considered several configurations in which the Mn-N distances for 6 DMA+ can take values of 4.495, 5.121 and 5.679 Å while the 2 remaining DMA+ display Mn-N distances of 5.698 Å. This provides a random sampling of the different situations and allows to determine the distribution of the zfs parameter, which was found to be MHz. The computed value is in fair agreement with the experimentally estimated value of 260 MHz and our calculations adequately reproduce the increased value for the zfs distribution when comparing DMAMgF:Mn2+to DMAZnF:Mn2+( MHz and MHz). While there is no clear evidence for an effect from the Mg, our results confirm the influence from the DMA+ cations on the crystal-field effect on the Mn2+ as observed in the case of DMAZnF:Mn2+.
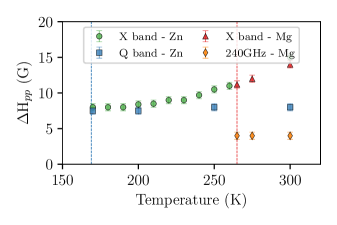
Fig. 4 shows the temperature dependence of the peak-peak linewidth of the smallest field line () for DMAMgF:Mn2+(this work) and DMAZnF:Mn2+(from Ref. [Bertaina et al., 2018]) in the HT phase. In DMAZnF:Mn2+, =170 K while in DMAMgF:Mn2+=260 K that’s why the temperature range of the HT phase in DMAMgF:Mn2+is more limited. In X-band and in slow regime, the temperature dependence of is the barely the same in the two compounds showing that the correlation time of the DMA+ cation is weakly affected by the nature of the metal, Zn or Mg, as pointed out in Ref. [RamakrishnaSanath2021]. In the rigid limit the linewidth of the transition in DMAMgF:Mn2+is about two times smaller than in DMAZnF:Mn2+at high frequencies although the working frequency used to investigate DMAMgF:Mn2+was 240 GHz while it was 34 GHz for DMAZnF:Mn2+. The distribution of the crystal field does not affect this transition, and a distribution of g-factor should have as effect to increase the linewidth when the frequency is increased.
IV.2 LT Phase
IV.2.1 CW-EPR
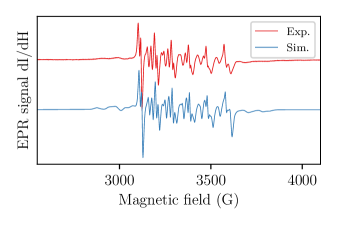
When the temperature is below =263 K, the system undergoes a structural phase transition from disordered trigonal to ordered monoclinic . Fig. 5 shows the EPR spectrum of DMAMgF:Mn2+powder at T=100 K. The signal is now more resolved than in the HT phase due to an apparent decreasing of the value. Using eq.(1) we simulate the spectrum with the following parameters : =110 MHz, =10 MHz, =0.5 MHz, =0.7 MHz, =0.5 MHz and =264 MHz. While second order crystal field parameters are provided with a good approximation, the fourth order ones have to be taken with caution since the transitions and are not perfectly resolved. Nevertheless, the crystal field parameters are in the range of what is expected for this family of material. Šimėnas et al. (2018) The crystal field distribution is about 50 MHz, much less than the one needed to simulate the HT phase. In the LT phase, the DMA+ cations now have only one possible orientation induced by the ferroelastic phase. The residual is thus due to local inhomogeneity.
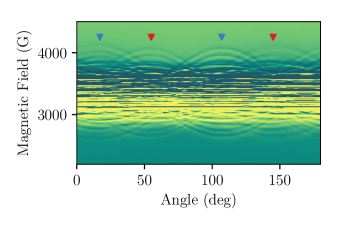
Fig.6 shows the angular dependence of the X-band EPR signal of DMAMgF:Mn2+recorded at 100 K with a resolution of 1∘. Most of the transitions are between 3000 G and 3500 G and are therefor impossible to resolve. However, the highest anisotropic transitions, , are visible on the edges of the spectra. The triangles point to the maximum of resonance fields and are found at 18∘ and 108∘ for the blue ones and at 55∘ and 145∘ for the red ones. The angular separation between these two magnetic substructures is 53∘ which corresponds to the angle between the two MnO6 orientation resolved by XRD (see Fig. S1 Note (1) ). It is worth noticing that, in DMAZnF:Mn2+, six substructures was necessary to describe the angular dependence of the EPRŠimėnas et al. (2017). Single crystal XRD data obtained at 100 K reveals the presence of a two component twin with a minor domain of only 5% weight. (Fig. S2 Note (1)).
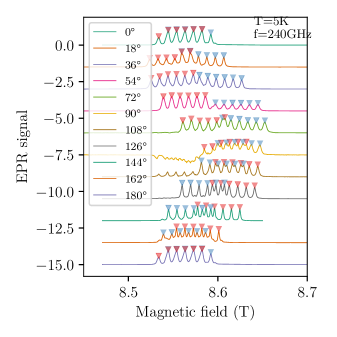
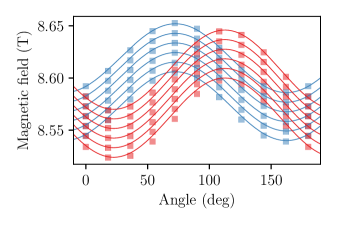
To confirm that DMAMgF:Mn2+has mostly a single ferroelastic domain, we performed high frequency/field EPR (240 GHz 8.87 T) at 5 K. At this temperature and for this field, the Boltzmann statistic populates mostly the lowest energy levels (). The transitions are mainly visible, while the others are either weak or absent. Thus, the spectra are "cleaned" and easier to read. Fig 7 shows the angular dependence of DMAMgF:Mn2+at GHz. Blue and red triangles represent the resonance fields and are useful to follow the angular variation of the resonance field of the two magnetic substructures. We can clearly distinguish the 2 sub-magnetic systems. The small signals at 90∘ and 108∘ are due to thermal population of the state which is caused by temperature instability in the cryostat.
While EPR studies Šimenas et al. (2017) has clearly shown the presence of three crystallographic twins of two magnetic domains in DMAZnF:Mn2+, we observe only a single domain of two magnetic structures. If one consider that changing the metal ion in DMAXF from Zn to Mg modify the elastic property of the MOF, the same arguiment can be used to explain the dramatic increase of in the DMAMgF compared to DMAZnF.
IV.2.2 Pulsed EPR
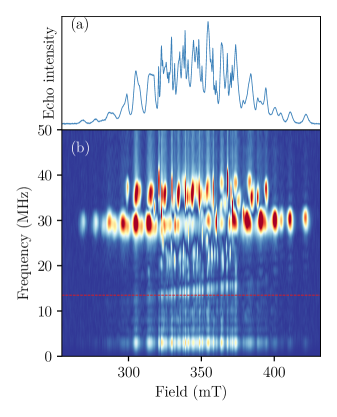
Despite our efforts to resolve all EPR lines in DMAMgF:Mn2+using low and high frequency EPR, the large number of lines in Mn2+ makes it difficult to identify them completely. By means of pulsed EPR, we measured the field sweep Rabi oscillations. The Rabi spectroscopy adds another dimension to the EPR spectrum. While for a fixed field, the EPR intensity might contain many transitions with unresolved contribution, the Rabi frequency of each transition is often unique. On Fig. 8(a) we show the 1D echo field and on Fig. 8(b) we show the contour plot of the field sweep fast Fourier transform (FFT) of Rabi oscillations recorded on a single crystal of DMAMgF:Mn2+at K with G. The red dashed line corresponds to the frequency expected for a spin. Clearly, the 2D Rabi field sweep helps to resolve many more transitions. The distribution in the frequency dimension is due to the damping of the oscillation while the distribution in the field dimension is due to the . Qualitatively, the broadly distributed frequencies are related to the and transitions which are sensitive to while the narrow distributed ones are related to which are insensitive to the crystal field. Moreover, in first approximation, the Rabi frequency in a large spin system is given by the adapted Fermi Golden rules Schweiger and Jeschke (2001) :
| (3) |
such as : MHz, MHz and MHz
While the agreement with this model is fair (but not exact) for and it fails for . To understand the distribution of Rabi frequencies in DMAMgF:Mn2+we developed a kernel density estimation of all transitions and all orientations in the crystals. Using the crystal field parameters found in the previous section, we computed the fields of resonance for each (allowed and forbidden) transitions accessible from 260 mT to 430 mT. For each pair of resonance field/transition we computed the amplitude of transition probability () in the direction perpendicular to the field orientation that is imposed by the experimental condition since the cavity force the microwave polarization to be perpendicular to the static field. The Rabi frequency is then , with is the g-factor (close to 2), the Bohr magneton, the Planck constant and the microwave field. This series of Rabi frequencies is then computed for all orientations. We discretize the space using an icosphere to avoid over-density of orientations by using a simple equally spaced Euler’s angles. The calculation included 20609 orientations and using a threshold of 10-2 to suppress the far too low frequency Rabi oscillations we obtained 1 346 898 sets of data containing resonance fields, probability amplitude, transition identification and Euler angles.
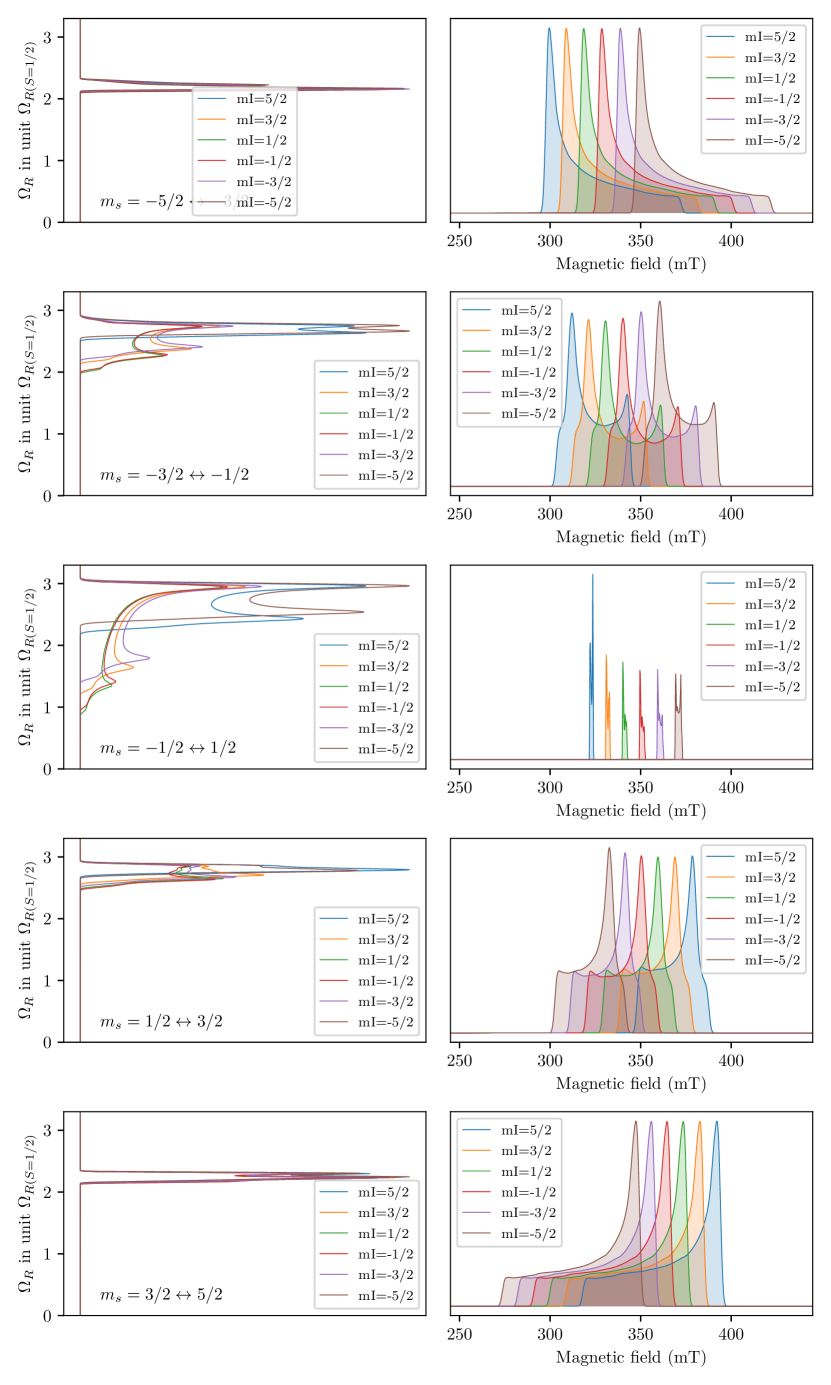
We first describe the Rabi and field distribution for the "allowed" transitions ( and ). Fig. 9 shows the Rabi frequencies and magnetic field distributions for the 30 allowed transitions. First, the field distribution follows what we expected for a Mn2+ ion in a moderate crystal field : are spread on large distribution of the field, are slightly less distributed while are fairly insensitive to the crystal field and induce the narrow lines observed on Fig. 8. More surprisingly, the Rabi frequency distribution is less intuitive. The transitions are weakly distributed around whatever is, confirming the validity of Eq. (3) while the transitions are different. also show a weak frequency distribution around but and are much more distributed. The transitions are even more sensitive to the orientation. In this case the Rabi frequency distribution is very broad and dependent to the value while the resonance field distribution is essentially independent to the orientation. This explains why the transition is narrow in the field dimension but distributed in a large range of Rabi frequency (see Fig. 8) .
Now we consider the case of Rabi frequencies and resonant field distributions of the "forbidden" transitions. The calculation method is based on the first order Fermi’s golden rule and so only one photon is involved in the resonance mechanism. The multiple photon transitions Sorokin, Gelles, and Smith (1958); Bertaina et al. (2009, 2015a) are not taken into account. However such transitions are induced only when which is far from being the case here. The "forbidden" transitions that we are considering are thus and . It appears that the transitions and (see SI) are weakly distributed in field, which is expected for such transition but we also observe that the Rabi frequency distribution is centered at 1.6 making these transitions highly probable.
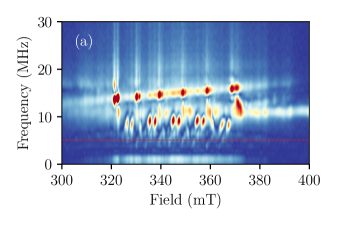
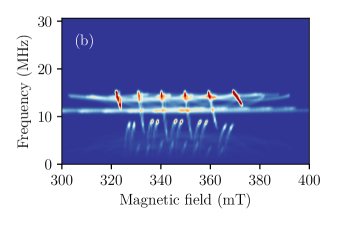
To confront the model, we have measured the field sweep Rabi oscillations of a powder of DMAMgF:Mn2+. After some signal processing (baseline correction, hamming, zero filing) the FFT is presented in Fig. 10 (a). We then simulated the distribution of both frequencies and resonance fields of a Mn2+ ion with the crystal field parameters extracted from CW-EPR of DMAMgF:Mn2+and a microwave field of 1.8 G. Our simulation describes rather well the experimental data. We should note that the apparent slope in the Rabi frequencies around 15 MHz in Fig. 10(a) is du to the nuclear zeeman of protons (42.57 MHz/T ) which induce an amplification of the Rabi intensity in case of Hartman-Hahn conditionsHartmann and Hahn (1962) ( ). Without fitting parameters we can describe the experimental data but the strength of this method is to help of the identification of transitions. Fig. S6 and S7 show the frequency and field distribution of all principal transitions.
To simulate the single crystal field sweep Rabi frequency distribution presented in Fig. 8 we just replaced the Euler angles sweep by the crystal field parameter D distribution in order to simulate the broadening. We used a Gaussian distribution with width of 40 MHz corresponding to the strain of extracted from EPR measurements. We then calculate the field sweep Rabi frequency distribution for two orientations separated by 58∘ which correspond to the angle between the 2 magnetic domains observed in Fig. 6 and presented in Fig.S8. The agreement between theory and experiment (Fig. 8) is fairly good thus confirming the presence of two magnetic structures that are disoriented by about 60∘. We also note that very low modes at about 2.5 MHz are visible experimentally but not displayed in our model. We believe these modes are related to the recently observed quantum rotor tunneling of methyl group in DMAZnFŠimėnas et al. (2020) which has not been taken into account in our model.
V Conclusion
We employed the electron spin resonance technique to investigate the dynamics of the electron spin of a Mn2+ ion used as a probe in the multiferroic compound DMAMgF. In the high temperature phase, the X-band cw-EPR study demonstrated that the correlation time describing the motion of DMA+ in DMAMgF:Mn2+is similar to that observed in the Zn analogue. The high frequency EPR data revealed a large zfs distribution in DMAMgF:Mn2+. Using a wide range of configurations and DFT computations, we were able to support this finding and fairly estimate this distribution. In the low temperature phase, we observed a single elastic phase containing two magnetic structures in agreement with single crystal XRD analysis. The complex EPR structure observed in the LT phase was then solved using pulse EPR combined to the field sweep Rabi oscillations method. A model based on the crystal field and the kernel density estimation of all possible transitions and orientations finally provided an accurate description of the complicated EPR structure of DMAMgF:Mn2+.
Author’s contributions
SB and ND designed and directed the study. JKB synthetize the samples. JKB and JVT conducted the HF-EPR measurements. SB performed the X-band EPR measurements. MG performed the XRD measurements. MO carried out the DFT calculations. MO and SB conducted the theoretical analysis and wrote the paper with input from all authors. All authors contributed to the implementation of the research and to the analysis of the results.
Acknowledgments
Pulsed ESR measurements were supported by the Centre National de la Recherche Scientifique (CNRS) research infrastructure RENARD (Grant No. IR-RPE CNRS 3443). We thank the international research program of CNRS - PICS SomeTIME. The NHMFL is supported by the NSF Cooperative Agreement Grant No. DMR-1157490 and the State of Florida.
Datasets
The data that support the findings of this study are openly available in Zanodo at http://doi.org/10.5281/zenodo.4521882, reference number 4521882.
Supplementary information
See supplementary information for XRD data and structure description, detail about DFT minimal models and simulation of rabi field sweep distributions.
References
- Jain et al. (2008) P. Jain, N. S. Dalal, B. H. Toby, H. W. Kroto, and A. K. Cheetham, “Order-Disorder Antiferroelectric Phase Transition in a Hybrid Inorganic-Organic Framework with the Perovskite Architecture,” Journal of the American Chemical Society 130, 10450–10451 (2008).
- Besara et al. (2011) T. Besara, P. Jain, N. S. Dalal, P. L. Kuhns, A. P. Reyes, H. W. Kroto, and A. K. Cheetham, “Mechanism of the order-disorder phase transition, and glassy behavior in the metal-organic framework [(CH3)2NH2]Zn(HCOO)3,” Proceedings of the National Academy of Sciences 108, 6828–6832 (2011).
- Jain et al. (2009) P. Jain, V. Ramachandran, R. J. Clark, H. D. Zhou, B. H. Toby, N. S. Dalal, H. W. Kroto, and A. K. Cheetham, “Multiferroic Behavior Associated with an Order-Disorder Hydrogen Bonding Transition in Metal-Organic Frameworks (MOFs) with the Perovskite ABX 3 Architecture,” Journal of the American Chemical Society 131, 13625–13627 (2009).
- Abhyankar, Bertaina, and Dalal (2015) N. Abhyankar, S. Bertaina, and N. S. Dalal, “On Mn 2+ EPR Probing of the Ferroelectric Transition and Absence of Magnetoelectric Coupling in Dimethylammonium Manganese Formate (CH 3 ) 2 NH 2 Mn(HCOO) 3 , a Metal–Organic Complex with the Pb-Free Perovskite Framework,” The Journal of Physical Chemistry C 119, 28143–28147 (2015).
- Bertaina et al. (2018) S. Bertaina, N. Abhyankar, M. Orio, and N. S. Dalal, “Measuring Motional Dynamics of [(CH3)2NH2]+ in the Perovskite-Like Metal–Organic Framework [(CH3)2 NH 2 ][Zn(HCOO) 3 ]: The Value of Low-Frequency Electron Paramagnetic Resonance,” The Journal of Physical Chemistry C 122, 16431–16436 (2018).
- Wang et al. (2013) Z. Wang, P. Jain, K. Y. Choi, J. Van Tol, A. K. Cheetham, H. W. Kroto, H. J. Koo, H. Zhou, J. Hwang, E. S. Choi, M. H. Whangbo, and N. S. Dalal, “Dimethylammonium copper formate [(CH3)2NH 2]Cu(HCOO)3: A metal-organic framework with quasi-one-dimensional antiferromagnetism and magnetostriction,” Physical Review B - Condensed Matter and Materials Physics 87, 1–8 (2013).
- Sánchez-Andújar et al. (2014) M. Sánchez-Andújar, L. C. Gómez-Aguirre, B. Pato Doldán, S. Yáñez-Vilar, R. Artiaga, A. L. Llamas-Saiz, R. S. Manna, F. Schnelle, M. Lang, F. Ritter, A. A. Haghighirad, and M. A. Señarís-Rodríguez, “First-order structural transition in the multiferroic perovskite-like formate [(CH3)2NH2][Mn(HCOO)3],” CrystEngComm 16, 3558 (2014).
- Pato-Doldán et al. (2012) B. Pato-Doldán, M. Sánchez-Andújar, L. C. Gómez-Aguirre, S. Yáñez-Vilar, J. López-Beceiro, C. Gracia-Fernández, A. A. Haghighirad, F. Ritter, S. Castro-García, and M. A. Señarís-Rodríguez, “Near room temperature dielectric transition in the perovskite formate framework [(CH3)2NH2][Mg(HCOO)3],” Physical Chemistry Chemical Physics 14, 8498 (2012).
- Asaji et al. (2014) T. Asaji, S. Yoshitake, Y. Ito, and H. Fujimori, “Phase transition and cationic motion in the perovskite formate framework [(CH3)2NH2][Mg(HCOO)3],” Journal of Molecular Structure 1076, 719–723 (2014).
- Abhyankar et al. (2018) N. Abhyankar, S. Bertaina, M. Orio, and N. S. Dalal, “Magnetic resonance probing of ferroelectricity and magnetism in metal-organic frameworks,” Ferroelectrics 534, 11–18 (2018).
- Šimėnas et al. (2015) M. Šimėnas, A. Ciupa, M. Ma̧czka, A. Pöppl, and J. Banys, “EPR Study of Structural Phase Transition in Manganese-Doped [(CH3)2NH2][Zn(HCOO)3] Metal–Organic Framework,” The Journal of Physical Chemistry C 119, 24522–24528 (2015).
- Šimėnas et al. (2018) M. Šimėnas, M. Ptak, A. H. Khan, L. Dagys, V. Balevičius, M. Bertmer, G. Völkel, M. Ma̧czka, A. Pöppl, and J. Banys, “Spectroscopic Study of [(CH3)2NH2][Zn(HCOO)3] Hybrid Perovskite Containing Different Nitrogen Isotopes,” The Journal of Physical Chemistry C 122, 10284–10292 (2018).
- Šimėnas et al. (2017) M. Šimėnas, S. Balčiūnas, M. Trzebiatowska, M. Ptak, M. Mcaczka, G. Völkel, A. Pöppl, and J. Banys, “Electron paramagnetic resonance and electric characterization of a [CH3NH2NH 2][Zn(HCOO)3] perovskite metal formate framework,” J. Mater. Chem. C 5, 4526–4536 (2017).
- Loss and DiVincenzo (1998) D. Loss and D. P. DiVincenzo, “Quantum computation with quantum dots,” Physical Review A 57, 120–126 (1998).
- Leuenberger and Loss (2001) M. N. Leuenberger and D. Loss, “Quantum computing in molecular magnets.” Nature 410, 789–93 (2001).
- Bertaina et al. (2009) S. Bertaina, L. Chen, N. Groll, J. Van Tol, N. S. Dalal, and I. Chiorescu, “Multiphoton Coherent Manipulation in Large-Spin Qubits,” Physical Review Letters 102, 50501–50504 (2009).
- Bertaina et al. (2015a) S. Bertaina, M. Martens, M. Egels, D. Barakel, and I. Chiorescu, “Resonant single-photon and multiphoton coherent transitions in a detuned regime,” Physical Review B 92, 024408 (2015a).
- Bertaina et al. (2011a) S. Bertaina, N. Groll, L. Chen, and I. Chiorescu, “Multi-photon Rabi oscillations in high spin paramagnetic impurity,” Journal of Physics: Conference Series 324, 012008 (2011a).
- Dolomanov et al. (2009) O. V. Dolomanov, L. J. Bourhis, R. J. Gildea, J. A. K. Howard, and H. Puschmann, “OLEX2 : A complete structure solution, refinement and analysis program,” Journal of Applied Crystallography 42, 339–341 (2009).
- Sheldrick (2015a) G. M. Sheldrick, “SHELXT – Integrated space-group and crystal-structure determination,” Acta Crystallographica Section A Foundations and Advances 71, 3–8 (2015a).
- Sheldrick (2015b) G. M. Sheldrick, “Crystal structure refinement with SHELXL,” Acta Crystallographica Section C Structural Chemistry 71, 3–8 (2015b).
- van Tol, Brunel, and Wylde (2005) J. van Tol, L.-C. Brunel, and R. J. Wylde, “A quasioptical transient electron spin resonance spectrometer operating at 120 and 240 GHz,” Review of Scientific Instruments 76, 074101 (2005).
- Neese (2018) F. Neese, “Software update: The ORCA program system, version 4.0,” WIREs Computational Molecular Science 8, e1327 (2018).
- Perdew (1986a) J. P. Perdew, “Density-functional approximation for the correlation energy of the inhomogeneous electron gas,” Physical Review B 33, 8822–8824 (1986a).
- Perdew (1986b) J. P. Perdew, Erratum: Density-Functional Approximation for the Correlation Energy of the Inhomogeneous Electron Gas (Physical Review B (1986) 34, 10 (7406)), Vol. 34 (1986).
- Becke (1988) A. D. Becke, “Density-functional exchange-energy approximation with correct asymptotic behavior,” Physical Review A 38, 3098–3100 (1988).
- Schäfer, Huber, and Ahlrichs (1994) A. Schäfer, C. Huber, and R. Ahlrichs, “Fully optimized contracted Gaussian basis sets of triple zeta valence quality for atoms Li to Kr,” The Journal of Chemical Physics 100, 5829–5835 (1994).
- Neese (2003) F. Neese, “Metal and ligand hyperfine couplings in transition metal complexes: The effect of spin-orbit coupling as studied by coupled perturbed Kohn-Sham theory,” Journal of Chemical Physics 118, 3939–3948 (2003).
- Weigend (2006) F. Weigend, “Accurate Coulomb-fitting basis sets for H to Rn,” Physical Chemistry Chemical Physics 8, 1057 (2006).
- Pantazis et al. (2008) D. A. Pantazis, X.-Y. Chen, C. R. Landis, and F. Neese, “All-Electron Scalar Relativistic Basis Sets for Third-Row Transition Metal Atoms,” Journal of Chemical Theory and Computation 4, 908–919 (2008).
- Pantazis and Neese (2009) D. A. Pantazis and F. Neese, “All-Electron Scalar Relativistic Basis Sets for the Lanthanides,” Journal of Chemical Theory and Computation 5, 2229–2238 (2009).
- Sinnecker and Neese (2006) S. Sinnecker and F. Neese, “Spin-Spin Contributions to the Zero-Field Splitting Tensor in Organic Triplets, Carbenes and BiradicalsA Density Functional and Ab Initio Study,” The Journal of Physical Chemistry A 110, 12267–12275 (2006).
- Abragam (1950) A. Abragam, “Paramagnetic Resonance and Hyperfine Structure in the Iron Transition Group,” Physical Review 79, 534–534 (1950).
- Ryabov (1999) I. D. Ryabov, “On the Generation of Operator Equivalents and the Calculation of Their Matrix Elements.” Journal of Magnetic Resonance 140, 141–145 (1999).
- Stoll and Schweiger (2006) S. Stoll and A. Schweiger, “EasySpin, a comprehensive software package for spectral simulation and analysis in EPR.” Journal of magnetic resonance (San Diego, Calif. : 1997) 178, 42–55 (2006).
- Bertaina et al. (2015b) S. Bertaina, C.-e. Dutoit, J. Van Tol, M. Dressel, B. Barbara, and A. Stepanov, “Quantum Coherence of Strongly Correlated Defects in Spin Chains,” Physics Procedia 75, 23–28 (2015b).
- Bertaina et al. (2011b) S. Bertaina, N. Groll, L. Chen, and I. Chiorescu, “Tunable multiphoton Rabi oscillations in an electronic spin system,” Physical Review B 84, 134433 (2011b).
- Rosenblatt (1956) M. Rosenblatt, “Remarks on Some Nonparametric Estimates of a Density Function,” Annals of Mathematical Statistics 27, 832–837 (1956).
- Low (1957) W. Low, “Paramagnetic Resonance Spectrum of Manganese in Cubic MgO and CaF2,” Physical Review 105, 793–800 (1957).
- Smith, Auzins, and Wertz (1968) S. Smith, P. Auzins, and J. Wertz, “Angular Dependence of the Intensities of "Forbidden" Transitions of Mn2+ in MgO,” Physical Review 166, 222–225 (1968).
- McLachlan (1964) A. D. McLachlan, “Line Widths of Electron Resonance Spectra in Solution,” Proceedings of the Royal Society A: Mathematical, Physical and Engineering Sciences 280, 271–288 (1964).
- Goldammer and Zorn (1974) E. Goldammer and H. Zorn, “Electron-Paramagnetic-Resonance Study of Manganese Ions Bound to Concanavalin A,” European Journal of Biochemistry 44, 195–199 (1974).
- von Goldammer, Muller, and Conway (1974) E. von Goldammer, A. Muller, and B. E. Conway, “Electron paramagnetic relaxation and EPR-line shapes of manganese ions in a sulfonated polystyrene ion-exchange resin at various degrees of hydration,” Berichte der Bunsengesellschaft Physikalische Chemie 78, 35–42 (1974).
- Bertaina et al. (2008) S. Bertaina, S. Gambarelli, T. Mitra, B. Tsukerblat, A. Müller, and B. Barbara, “Quantum oscillations in a molecular magnet,” Nature 453, 203–206 (2008).
- Note (1) See Supplemental Material.
- Šimenas et al. (2017) M. Šimenas, A. Kultaeva, S. Balčiunas, M. Trzebiatowska, D. Klose, G. Jeschke, M. Ma̧czka, J. Banys, and A. Pöppl, “Single Crystal Electron Paramagnetic Resonance of Dimethylammonium and Ammonium Hybrid Formate Frameworks: Influence of External Electric Field,” Journal of Physical Chemistry C 121, 16533–16540 (2017).
- Schweiger and Jeschke (2001) A. Schweiger and G. Jeschke, Principles of Pulse Electron Paramagnetic Resonance (Oxford University Press, USA, 2001).
- Sorokin, Gelles, and Smith (1958) P. Sorokin, I. Gelles, and W. Smith, “Multiple Quantum Transitions in Paramagnetic Resonance,” Physical Review 112, 1513–1515 (1958).
- Hartmann and Hahn (1962) S. Hartmann and E. Hahn, “Nuclear Double Resonance in the Rotating Frame,” Physical Review 128, 2042–2053 (1962).
- Šimėnas et al. (2020) M. Šimėnas, D. Klose, M. Ptak, K. Aidas, M. Mączka, J. Banys, A. Pöppl, and G. Jeschke, “Magnetic excitation and readout of methyl group tunnel coherence,” Science Advances 6, eaba1517 (2020).