Using Structural and Semantic Information to Identify Software Components
Abstract
Component Based Software Engineering (CBSE) seeks to promote the reuse of software by using existing software modules into the development process. However, the availability of such a reusable component is not immediate and is costly and time consuming. As an alternative, the extraction from pre-existing OO software can be considered.
In this work, we evaluate two community detection algorithms for the task of software components identification. Considering ‘components’ as ‘communities’, the aim is to evaluate how independent, yet cohesive, the components are when extracted by structurally informed algorithms.
We analyze 412 Java systems and evaluate the cohesion of the extracted communities using four document representation techniques. The evaluation aims to find which algorithm extracts the most semantically cohesive, yet separated communities.
The results show a good performance in both algorithms, however, each has its own strengths. Leiden extracts less cohesive, but better separated, and better clustered components that depend more on similar ones. Infomap, on the other side, creates more cohesive, slightly overlapping clusters that are less likely to depend on other semantically similar components.
Index Terms:
Components Identification, Community Detection, Components Semantic AnalysisI Introduction
CBSE is an alternative to Object-Oriented (OO) development that aims to make it easier to develop easily reusable and understandable software by using components [1]. In order to become useful, CBSE has to produce a repository containing enough components, so that developers do not have to rewrite them from scratch[2, 3].
An alternative to pre-developed and designed components is to extract them from pre-existing software. As an example of this approach, [4] proposed an architecture recovery approach called ROMANTIC, helped by human experts. Similarly, using particle swarm optimization, [5] proposed a method that uses a meta-heuristic search-based clustering. Frequent usage patterns propelled instead the search heuristics in [6].
Other papers, although not necessarily focusing on component reuse, provided algorithms for component extraction: [7, 8] proposed a metric called MQ to measures edge density of graphs, to help in the module selection. The use of graph clustering was often used for the same purpose in later publications [9, 10].
The aim of this paper is to evaluate how well-formed the components are when they are automatically extracted by community-detection algorithms [11]. Based on the extracted ‘communities as modules’, we aim to test the semantic cohesiveness of those communities (of features) in the context of the overall software system. As a case study, we use a curated population of 700 Java projects111Awesome Java is a GiHub project that aggregates several hundreds of curated Java projects, available at https://github.com/akullpp/awesome-java. After removing empty projects, tutorials, links to websites, or giving issues when analyzing, we obtained a sample of 412 Java projects.
The two objectives of this paper are (i) to evaluate the effectiveness of extracting structure-informed modules from a software system, and (ii) to detect whether the extracted modules are semantically cohesive. In order to assess the first objective, we used two community detection algorithms, Infomap [12] and Leiden [13]. The second objective is assessed in two ways: firstly, we evaluated whether there is a low cohesion between different modules (e.g., semantic separation); secondly, we checked whether the identified modules are semantically cohesive per-se. The source code to replicate our analysis has been made publicly available222https://github.com/SasCezar/ComponentSemantics/tree/SANER-ERA.
II Preliminaries
In the following section, we introduce the three steps in this work: how we extracted the structural dependencies (II-A), how we detected the software modules as ‘communities’ (II-B) and how we assessed the cohesiveness of the modules (II-C). Figure 1 presents a visual representation of our pipeline.
II-A Structural Dependencies
The first step of our approach is the extraction of the dependency graph for each project in our sample. Using the Arcan [14] tool, we obtained the nodes and the edges describing the dependencies between classes, where the edge weight is the number of uses [15] of one class in the other. Arcan parses the abstract syntax tree, extracted with Spoon[16], of the project source files, and it looks for any reference to classes, variables, and methods and saves that information in a graph. For example, in the antlr4 project, we have a dependency between org.antlr.v4.automata.ParserATNFactory.java and org.antlr.v4.tool.LexerGrammar.java as the former imports the latter.
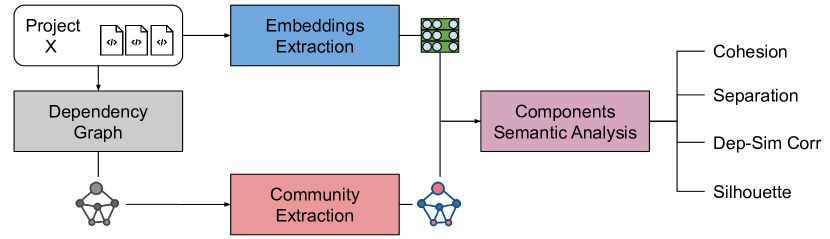
II-B Community Detection via Graph Clustering
The second step of our approach uses the relationships identified by the structural dependencies as input for the Community Detection (CD) algorithms. CD (or graph clustering) approaches have been used for various tasks in the software engineering domain besides component identification. Examples include aiding the transition from monolithic applications to microservices architectures [17], architecture reconstruction [18], and refactoring of software packages [19].
In this step we compare two different types of CD algorithms, Infomap and Leiden: both are popular and effective clustering tools that have been deployed in different domains.
Infomap [12]
is an algorithm based on random walks and Huffman coding [20]. They frame the partitioning of the graph into communities as a code optimization problem. To find an efficient code, Infomap looks for a partition that minimizes the expected description length of a random walk in the graph. In the resulting partition, a community is made of a group of nodes among which information flows quickly and easily.
Leiden [13]
is an improvement of Louvain [21], with Leiden guaranteeing well connected communities. Both maximise the community modularity by isolating modules with the most dense internal connections (i.e., higher structural cohesion) and the least amount of connections between outside nodes (i.e., lowest structural coupling). Leiden starts by assigning different communities to each vertex. Then, it merges the nodes iteratively, based on the gain in modularity (if there is no gain, the node remains in its current community). The procedure stops when, moving a node into another community, there is no further gain in the modularity.
II-C Semantic Cohesion from Source Code
The third step of our approach is based on the extraction of representations of project’s source code. We used three popular document representation techniques: TF-IDF, BERT, and fastText.
TF-IDF
is a measure that reflects the importance of a word in a document based on a collection of documents. It is the ratio between the number of times the word appears in the document and the amount of information that word provides. TF-IDF does not capture the position in the text, semantics, co-occurrences in different documents, meaning that the created representations are only useful as lexical level features. However, unlike BERT and fastText, its vocabulary adapts to the collection.
BERT [22]
is a state-of-the-art neural language model for learning dense vector representation of words (embeddings). It makes use of the Transformer [23], and learns contextual relations between words in a text. BERT representations are contextual, meaning that word’s representation is based on the other words in the sentence (context). In this paper we used the Hugging Face’s bert-base-uncased pre-trained model [24]. Although this pre-trained model has a vocabulary optimized for natural text, it also adopts a subword segmentation technique called WordPiece [25] (e.g. playing becomes play #ing) that aids with out-of-vocabulary words. While this provides additional bits of information, some technical words are nevertheless poorly tokenized (e.g. servlet becomes ser + #v + #let).
fastText [26]
is a neural embedding model that uses subword information to create word embeddings. fastText words are split into n-grams, each having its own embedding. The word embedding is an aggregation of the embeddings of all n-grams that the word is made of. In contrast to BERT’s WordPiece subword segmentation, fastText’s n-grams have the advantage that technical words are less affected by a segmentation learned from non-technical corpora, due to the smaller size subword information.
III Dataset
Our dataset is made by 412 Java projects. Each project has two distinct parts: the structural information from the dependency graph and community detection algorithms, and the semantic information extracted using Natural Language Processing (NLP) techniques.
III-A Dependency Graph and Communities
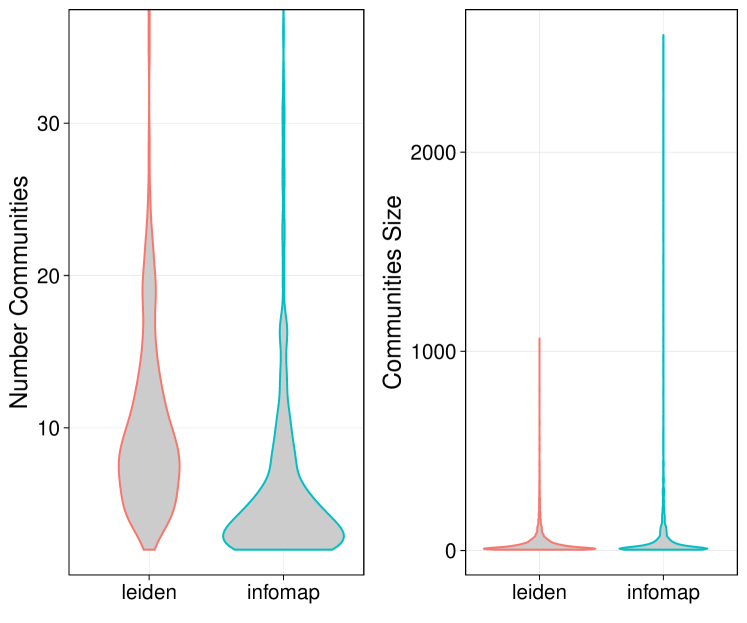
We extract the dependency graphs using Arcan, and with the previously defined community detection algorithm extract their communities. After extracting the communities, we perform some pre-processing before carrying out our analysis. The structural pre-processing includes the removal of the communities with less than 4 nodes. This choice is driven by the fact that small sized communities skew the result given their high cohesion, usually close to 1, which will advantage algorithms that identify many small modules.
After the removal of the smaller communities we obtain the results in Figure 2 which summarises the distribution of the number and size of identified components. Infomap has fewer communities, while their size is larger with more outliers. Leiden extracts a larger number of smaller communities, and it has fewer outliers.
III-B Document Embeddings
The extraction of features representing the documents is performed on two conceptual levels, package- and class-names, and source code. We create four different representation:
Embeddings from package- and class-names
The first feature extraction uses BERT to perform an embedding of the cleaned text of the package and class name. The cleaning consists of splitting the package name by dot; next, we remove the first two elements of the list as they represent the organization that developed the software. The final step is to split the camel case strings into words and remove any Java keyword. For example org.antlr.v4.tool.LexerGrammar becomes “v4 tool lexer grammar”.
BERT embeddings from source code
The second feature extraction method also uses BERT; in this case, we perform the embedding on the set of identifiers extracted from the source code file. For the extraction of the identifiers contained in the source code, we used the tree-sitter parser generator tool333https://github.com/tree-sitter/tree-sitter. It makes easy to get the identifiers, without keywords, from the annotated concrete syntax tree created using a grammar for Java code. We clean the identifiers as before, and remove common Java terms that do not add much semantically (e.g., ‘main’, ‘println’, etc).
fastText embeddings from source code
The third document representation solution focuses on the identifiers again, but it uses fastText as the embedding model. For our experiments we use the wiki.en pre-trained model.
TF-IDF bag of words from source code
The last feature extraction method uses TF-IDF for the creation of the document embedding. To reduce the vocabulary, and normalize words, we use the lemma of the identifiers as our tokens. Furthermore, for each of the analysed systems, we limit the vocabulary size to the top terms (the mean vocabulary size in our dataset is around tokens).
IV Experiments and Metrics
Below we describe the metrics that were used to evaluate Infomap and Leiden in terms of semantic cohesion of components and separation between different components.
IV-A Semantic Cohesion
We first evaluate the internal semantic cohesion of the components using the cosine similarity. This should indicate how cohesive are the components found by the CD algorithm.
The pairwise similarity is evaluated between all the vectors describing the nodes in the community and then averaged. Then, for each project, we average the internal similarities of all communities. Formally, we compute it as follows:
where is the number of communities, is the cardinality of community (with at least 4 nodes), is the cosine similarity measure, and is the -th node of community .
IV-B Semantic Separation
The extracted components should have low semantic similarity between each other. This is measured by the cosine similarity between the representing vectors of each community. Since each component is composed of many nodes, each with its own embedding, the community vector is obtained aggregating in a single vector all the information using the mean function. More formally:
where is the representation of the -th community:
IV-C Silhouette
The average similarity scores above do not give a global idea of how well the nodes are grouped together semantically. We can get a combined measure of both the internal cohesion and external separation by using the Silhouette coefficient[27]. This is a measure of how similar an object is to its own cluster (cohesion), as compared to other clusters (separation). It uses the information from the nodes to get an average quality score. For our experiments we use the cosine distance.
IV-D Correlation Between Dependencies and Similarity
The final analysis measures the correlation between the number of dependencies connecting the components and their semantic similarity.
We would like this score to be slightly negative, since having similar components with a high dependency between each other might indicate (i) that the algorithm splits a component into two, or (ii) that there are different components that perform different parts of the same tasks.
For this experiment, we measured the number of edges between each community in a pairwise fashion. We consider the edges as undirected and use the total amount of dependencies between communities. Using the previously defined features, we measured the semantic similarity between components. We used the mean of the embeddings of each vector as the component representation. The resulting representations are used to compute the pairwise similarities. We compute the correlation of the two variables using Pearson’s .
V Results and Discussion
The results of our analysis are presented in Table I. They are aggregated, showing how many times either Infomap or Leiden is better than the other on the specific metric.
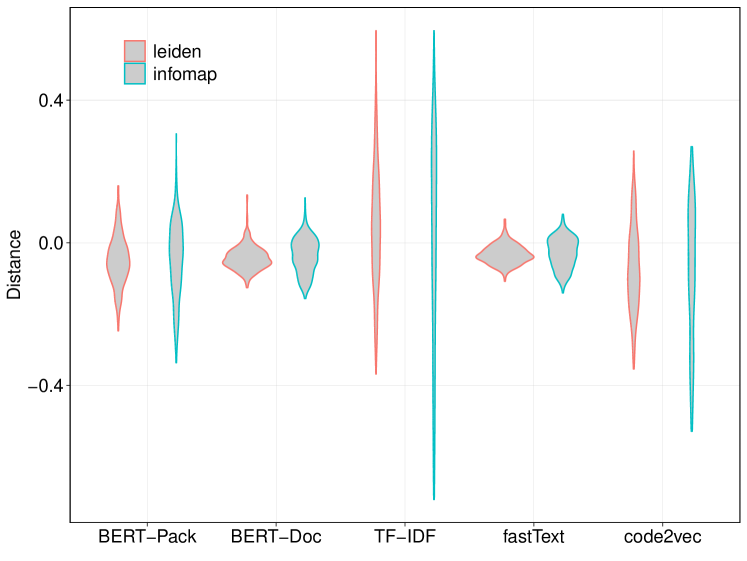
We can notice that Infomap has in general a higher cohesion across all features, while Leiden has a better separation between components. However, the ‘Cohesion Separation (%)’, which measures the number of times (and the percentage) the cohesion is higher than the separation in a project, shows that although Leiden has better results when using TF-IDF, Infomap performs better on the other three methods. Figure 3 shows the distribution of the differences.
| BERT | TF-IDF | fastText | ||||||
|---|---|---|---|---|---|---|---|---|
| Metric | Package | Document | ||||||
| Leiden | Infomap | Leiden | Infomap | Leiden | Infomap | Leiden | Infomap | |
| Cohesion | 229 | 240 | 240 | 235 | ||||
| Separation | 223 | 208 | 292 | 217 | ||||
| Silhouette | 256 | 251 | 323 | 234 | ||||
| Dep-Sim Corr | 326 | 314 | 322 | 308 | ||||
| Cohesion Separation (%) | 140 (33%) | 105 (25%) | 247 (60%) | 120 (29%) | ||||
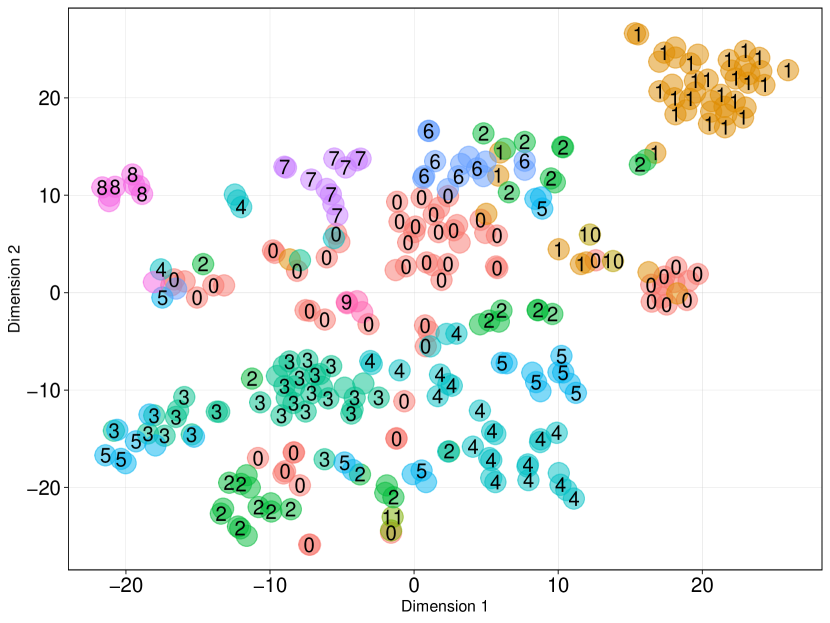
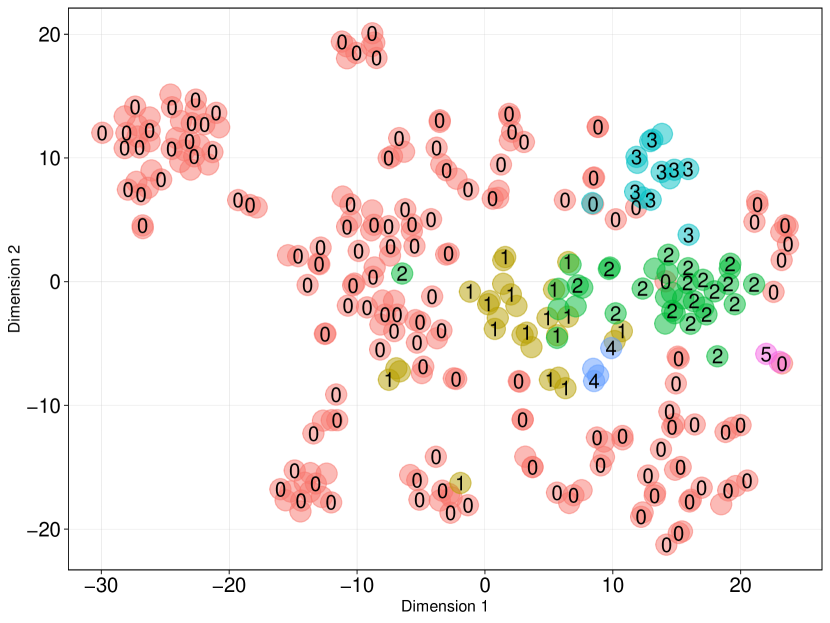
Leiden shows better scores using the Silhouette metric: this result is actually due to the fact that Infomap communities are larger in size, but sparser in terms of semantic. This is reflected by nodes clustered in one large component, but that are semantically closer to other components (see Figure 4).
Lastly, we have the results of the correlation between the similarity of the identified modules, and their dependency. In this experiment, Leiden is the better algorithm in around of the cases. However, this score can be influenced by having few very large communities and many smaller ones.
While the communities extracted by Infomap can become too large, this could be fixed by running a multi-level extraction: the algorithm could be semi-automatically forced to optimize its first partitioning by running over the individual communities again. However, this will cause the opposite issue on smaller graphs: this has to be further investigated in order to find the best policy given the project size.
A threat to our methodology is the removal of the small communities. While the choice might seem arbitrary, it also has to be considered that, beside skewing the results, components with less than 4 nodes are unlikely to be of much interest in large projects. Furthermore, the averaged representations and similarities, and the small differences between the internal and external similarity scores, give only a preliminary idea of what the algorithms really identify. Lastly, the analyses are dependant on the chosen representation technique: however, this threat is reduced by having four different representation.
VI Conclusion and Future Work
In this work we compared two different community detection algorithms (Infomap and Leiden) for identifying software components. We evaluated the algorithms by using four different representation methods. The results show that Leiden extracts more components with fewer nodes. Its components are less cohesive, yet better separated, and their nodes are better clustered, but the components depend more on similar ones. Infomap, on the other hand, creates fewer but bigger components that are more cohesive, with slightly overlapping clusters and are less likely to depend more on semantically similar components.
As future work, we plan to qualitatively evaluate each of the extracted components individually, and to assess possible automatic refinements to the content of the components based on their semantics. Furthermore, components should be assigned a topic to make them easily understandable and accessible. Lastly, we plan to evaluate other algorithms that use both the structural and semantic information to assess if they achieve better results and consistency across the different metrics.
References
- [1] G. Booch, Software Component with ADA. Benjamin-Cummings Publishing Co., Inc., 1987.
- [2] N. Md Jubair Basha and S. A. Moiz, “Component based software development: A state of art,” in IEEE-International Conference On Advances In Engineering, Science And Management (ICAESM -2012), 2012, pp. 599–604.
- [3] R. Holmes, Pragmatic software reuse. Citeseer, 2008.
- [4] S. Chardigny, A. Seriai, M. Oussalah, and D. Tamzalit, “Extraction of component-based architecture from object-oriented systems,” in Seventh Working IEEE/IFIP Conference on Software Architecture, 2008.
- [5] A. Rathee and J. K. Chhabra, “Mining reusable software components from object-oriented source code using discrete pso and modeling them as java beans,” Information Systems Frontiers, pp. 1–19, 2019.
- [6] ——, “Improving cohesion of a software system by performing usage pattern based clustering,” Procedia Computer Science, vol. 125, pp. 740 – 746, 2018.
- [7] S. Mancoridis, B. S. Mitchell, C. Rorres, Y. Chen, and E. R. Gansner, “Using automatic clustering to produce high-level system organizations of source code,” in Proceedings. 6th International Workshop on Program Comprehension. IWPC’98 (Cat. No.98TB100242), 1998, pp. 45–52.
- [8] Y. Chiricota, F. Jourdan, and G. Melancon, “Software components capture using graph clustering,” in 11th IEEE International Workshop on Program Comprehension, 2003., 2003, pp. 217–226.
- [9] Jong Kook Lee, Seung Jae Jung, Soo Dong Kim, Woo Hyun Jang, and Dong Han Ham, “Component identification method with coupling and cohesion,” in Proceedings Eighth Asia-Pacific Software Engineering Conference, 2001, pp. 79–86.
- [10] S. Allier, H. A. Sahraoui, and S. Sadou, “Identifying components in object-oriented programs using dynamic analysis and clustering,” in Proceedings of the 2009 Conference of the Center for Advanced Studies on Collaborative Research, ser. CASCON ’09, USA, 2009, p. 136–148.
- [11] A. Lancichinetti and S. Fortunato, “Community detection algorithms: a comparative analysis,” Physical review E, vol. 80, no. 5, 2009.
- [12] M. Rosvall and C. T. Bergstrom, “Maps of random walks on complex networks reveal community structure,” Proceedings of the National Academy of Sciences, vol. 105, no. 4, pp. 1118–1123, 2008.
- [13] V. A. Traag, L. Waltman, and N. J. van Eck, “From louvain to leiden: guaranteeing well-connected communities,” Scientific reports, vol. 9, no. 1, pp. 1–12, 2019.
- [14] F. A. Fontana, I. Pigazzini, R. Roveda, D. Tamburri, M. Zanoni, and E. Di Nitto, “Arcan: A tool for architectural smells detection,” in 2017 IEEE International Conference on Software Architecture Workshops (ICSAW). IEEE, 2017, pp. 282–285.
- [15] L. Pruijt, C. Köppe, J. M. van der Werf, and S. Brinkkemper, “The accuracy of dependency analysis in static architecture compliance checking,” Software: practice and Experience, vol. 47, no. 2, pp. 273–309, 2017.
- [16] R. Pawlak, M. Monperrus, N. Petitprez, C. Noguera, and L. Seinturier, “Spoon: A Library for Implementing Analyses and Transformations of Java Source Code,” Software: Practice and Experience, 2015.
- [17] G. Mazlami, J. Cito, and P. Leitner, “Extraction of microservices from monolithic software architectures,” in 2017 IEEE International Conference on Web Services (ICWS), 2017, pp. 524–531.
- [18] I. Şora, G. Glodean, and M. Gligor, “Software architecture reconstruction: An approach based on combining graph clustering and partitioning,” in 2010 International Joint Conference on Computational Cybernetics and Technical Informatics. IEEE, 2010, pp. 259–264.
- [19] W.-F. Pan, B. Jiang, and B. Li, “Refactoring software packages via community detection in complex software networks,” International Journal of Automation and Computing, vol. 10, no. 2, 2013.
- [20] D. A. Huffman, “A method for the construction of minimum-redundancy codes,” Proceedings of the IRE, vol. 40, no. 9, pp. 1098–1101, 1952.
- [21] V. D. Blondel, J.-L. Guillaume, R. Lambiotte, and E. Lefebvre, “Fast unfolding of communities in large networks,” Journal of Statistical Mechanics: Theory and Experiment, vol. 2008, no. 10, oct 2008.
- [22] J. Devlin, M.-W. Chang, K. Lee, and K. Toutanova, “BERT: Pre-training of deep bidirectional transformers for language understanding,” in Proceedings of the 2019 Conference of the North American Chapter of the ACL: HLT, Volume 1. Minneapolis, Minnesota: Association for Computational Linguistics, Jun. 2019, pp. 4171–4186.
- [23] A. Vaswani, N. Shazeer, N. Parmar, J. Uszkoreit, L. Jones, A. N. Gomez, L. Kaiser, and I. Polosukhin, “Attention is all you need,” in Advances in Neural Information Processing Systems, 2017, 4-9 December 2017, Long Beach, CA, USA, 2017, pp. 5998–6008.
- [24] T. Wolf, L. Debut, V. Sanh, J. Chaumond, C. Delangue, A. Moi, P. Cistac, T. Rault, R. Louf, M. Funtowicz, J. Davison, S. Shleifer, P. von Platen, C. Ma, Y. Jernite, J. Plu, C. Xu, T. L. Scao, S. Gugger, M. Drame, Q. Lhoest, and A. M. Rush, “Huggingface’s transformers: State-of-the-art natural language processing,” ArXiv, vol. abs/1910.03771, 2019.
- [25] Y. Wu, M. Schuster, Z. Chen, Q. V. Le, M. Norouzi, W. Macherey, M. Krikun, Y. Cao, Q. Gao, K. Macherey, J. Klingner, A. Shah, M. Johnson, X. Liu, L. Kaiser, S. Gouws, Y. Kato, T. Kudo, H. Kazawa, K. Stevens, G. Kurian, N. Patil, W. Wang, C. Young, J. Smith, J. Riesa, A. Rudnick, O. Vinyals, G. Corrado, M. Hughes, and J. Dean, “Google’s neural machine translation system: Bridging the gap between human and machine translation,” ArXiv, vol. abs/1609.08144, 2016.
- [26] P. Bojanowski, E. Grave, A. Joulin, and T. Mikolov, “Enriching word vectors with subword information,” Transactions of the Association for Computational Linguistics, vol. 5, pp. 135–146, 2017.
- [27] P. J. Rousseeuw, “Silhouettes: A graphical aid to the interpretation and validation of cluster analysis,” Journal of Computational and Applied Mathematics, vol. 20, pp. 53 – 65, 1987.