Successive destruction of charge density wave states by pressure in LaAgSb2
Abstract
We comprehensively studied the magnetotransport properties of LaAgSb2 under high pressure up to 4 GPa, which showed unique successive charge density wave (CDW) transitions at K and K at ambient pressure. With the application of pressure, both and were suppressed and disappeared at the critical pressures of –3.4 GPa and –1.9 GPa, respectively. At , the Hall conductivity showed a step-like increase, which is consistently understood by the emergence of two-dimensional hollow Fermi surface at . We also observed a significant negative magnetoresistance effect when the magnetic field and current were applied parallel to the axis. The negative contribution was observed in whole pressure region from 0 to 4 GPa. Shubnikov–de Haas (SdH) oscillation measurements under pressure directly showed the changes in the Fermi surface across the CDW phase boundaries. In , three major oscillation components, , , and , were identified, whose frequencies were increased by application of pressure. The increment rate of these frequencies was considerably larger than that expected from the shrinkage of lattice constant, indicating the unignorable band modification under pressure. In the normal metallic phase above , we observed a single frequency of T with a cyclotron effective mass of 0.066 , whose cross section in the reciprocal space corresponded to only 0.22% of the first Brillouin zone. Besides, we observed another oscillation component with frequency of T, which is significantly enhanced in the limited pressure range of . The amplitude of this oscillation was anomalously suppressed in the high-field and low-temperature region, which cannot be explained by the conventional Lifshitz–Kosevich formula.
I Introduction
The charge density wave (CDW) has long been known as a macroscopic quantum state, which shows a static order of charge carrier accompanied by lattice modulation. Several three-dimensional materials with anisotropic crystal structure and Fermi surface show spontaneous formation of a CDW state with a lattice modulation wavenumber of by lowering the temperature Grüner (1994). Following the Peierls transition in one-dimensional system, the mechanism of CDW is frequently understood as a nesting of Fermi surfaces connected by a nesting vector , which results in an opening of the energy gap at the the nested region. The vanishing of the corresponding Fermi surface considerably alters the density of state at the Fermi level and causes drastic changes in various physical properties. In real three-dimensional material with multiple Fermi surfaces, however, it is a long-standing issue under intense discussion whether the formation of CDW can be understood fully with only the Fermi surface properties Johannes and Mazin (2008); Eiter et al. (2013).
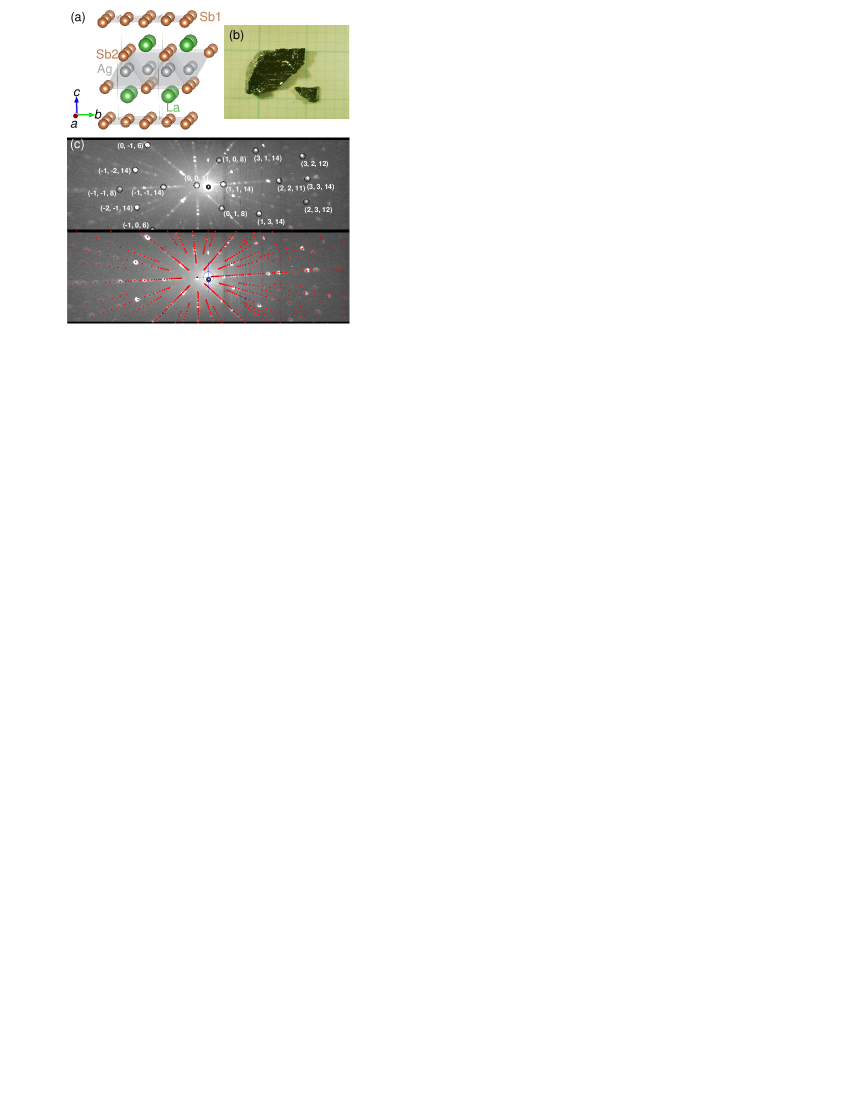
The layered intermetallic compound LaAgSb2, the target of the present study, forms a tetragonal crystal structure (, space group No. 129) Brylak et al. (1995), as shown in Fig. 1(a). Ag and Sb forms a layered structure similar to the iron-based superconductors Johrendt (2011), in which Sb1 forms square nets and Ag is located in a slightly distorted tetrahedron formed by Sb2. La is located between these layers in an alternating manner along the axis.
LaAgSb2 has been known to exhibit successive CDW transitions at K and K. An X-ray diffraction study Song et al. (2003) revealed that the CDW1 has a lattice modulation along the axis characterized by modulation vector (, 0, 0), while the CDW2 has a modulation along the axis with modulation vector (0, 0, ), where and represent the lattice constants. Both CDW1 and CDW2 have been explained as a result of Fermi-surface nesting Song et al. (2003). The phase transition to the CDW1 can be observed as a clear hump-like anomaly in the temperature dependence of the resistivity Myers et al. (1999a). Compared to CDW1, the phase transition to CDW2 causes a smaller anomaly in the electrical transport, which is barely observed in the out-of-plane resistivity Song et al. (2003); Watanabe et al. (2006). This difference has been explained as a larger segment of the Fermi surface being gapped by the CDW1 transition, which causes a significant change in the carrier density.
The Fermi surfaces of LaAgSb2 have been studied by quantum oscillation measurements Myers et al. (1999b); Inada et al. (2002); Bud’ko et al. (2008) combined with first principles calculations and angle-resolved photoemission spectroscopy (ARPES) measurements Arakane et al. (2007); Shi et al. (2016). Although several controversial conclusions can be seen in previous literature (e.g., regarding the shape of Fermi surfaces and correspondence of Fermi surface cross sections with quantum-oscillation frequencies), LaAgSb2 is considered to have four Fermi surfaces: two-hole Fermi surfaces around the point, a two-dimensional hollow electron surface, and an ellipsoidal electron surface around the point Myers et al. (1999b). Intriguingly, a recent ARPES measurement reported that the hollow Fermi surface, which is considered responsible for the nesting of CDW1, hosts a Dirac-cone-like dispersion in the vicinity of the Fermi level Shi et al. (2016). Although a part of this linear dispersion is considered to be gapped by the formation of CDW1 at ambient pressure, the large linear magnetoresistance that is frequently observed in Dirac fermion systems and the existence of high mobility carrier have been reported in a magnetotransport study Wang and Petrovic (2012). If we can eliminate the CDW1 by tuning an external parameter, we can expect the full contribution of the Dirac-like dispersion that is hidden by the CDW energy gap at ambient pressure. Thus, LaAgSb2 can be a typical example to investigate the exotic transport phenomena originating from the Dirac fermion and the interplay between CDW formation and the presence of the Dirac fermion.
Replacement of the Ag site with its homologues, Au and Cu, has been known to cause a drastic change in the CDW properties. In LaCuSb2, the temperature dependence of the resistivity is monotonic in contrast with LaAgSb2 Chamorro et al. (2019), and no phase transition has been reported to date. However, LaAuSb2 shows CDW transition with clear hump-like anomaly at 100 K in resistivity Seo et al. (2012); Kuo et al. (2019), as well as LaAgSb2, though the is considerably lower than that of LaAgSb2. The dimensionality of the Fermi surfaces is considered a possible factor to determine the occurrence of CDW Hase and Yanagisawa (2014), though the specific origin of this difference is not clear at the present stage. Interestingly, in a recent study of LaAuSb2, it has been reported that there exists a secondary CDW transition at K at ambient pressure Xiang et al. (2020), suggesting that LaAuSb2 and LaAgSb2 have quite similar CDW phase diagrams. Thus, it is important to compare and contrast the CDW properties between LaAgSb2 and LaAuSb2 to understand the origin of the CDW formation in this material class. In case of LaAuSb2, both and are suppressed by application of pressure, and disappear at 1.7 GPa and 0.75 GPa , respectively Xiang et al. (2020).
The application of pressure and chemical substitution of La/Ag sites are known as effective methods to control the and in LaAgSb2 Bud’ko et al. (2006); Torikachvili et al. (2007); Masubuchi et al. (2014). However, chemical substitution usually introduces lattice defects and unintentional carrier doping, which hinders systematic investigation of the CDW states. In contrast, high pressure is a useful external parameter that is free from the problems mentioned above. However, the effect of pressure on the electronic state has only been studied below 2.1 GPa Bud’ko et al. (2006); Torikachvili et al. (2007), which is insufficient to eliminate the CDW1. At present, the critical pressures of the CDWs in LaAgSb2 has remained unclear.
To clarify the complete pressure–temperature phase diagram of CDWs and to investigate the change in Fermi surfaces by application of pressure, we comprehensively studied magnetotransport properties of LaAgSb2 under high pressure up to 4 GPa.
II Experimental methods
Single crystals of LaAgSb2 were obtained by the Sb self-flux method Myers et al. (1999a). La (99.9%), Ag (99.99%), and Sb (99.9999%) with a molar ratio of 1 : 2 : 20 were placed in an alumina crucible, and sealed in a quartz ampoule with argon gas. After the mixture was heated to , it dwelled at this temperature for 12 hours. Then, it was cooled to for 110–120 h. The flux was removed using a centrifuge separator. A picture of the as-grown single crystal is shown in Fig. 1(b). Most of crystals obtained by above method were millimeter-size lumps or plates. The crystals were appropriately shaped into rectangle for electrical resistivity measurements.
X-ray single-crystal structural analysis at ambient pressure and K was performed using VariMax with Saturn (RIGAKU) with monochromated Mo Kα radiation ( Å). The obtained data collection are listed in Tab. 1 and 2. Laue diffraction measurement was performed using IPX-YGR (IPX Co., Ltd.) with back-reflection configuration. We obtained quite clear Laue spots, as shown in Fig. 1(c), which is explained by the identified crystallographic data and indicates high quality of our single crystal.
| formula | LaAgSb2 |
|---|---|
| crystal system | tetragonal |
| space group | (#129) |
| (Å) | 4.3941(18) |
| (Å) | 10.868(6) |
| volume (Å3) | 209.84(17) |
| Z value | 2 |
| [] | 0.0302 |
| atom | site | (Å2) | |||
|---|---|---|---|---|---|
| La | 2c | 1/4 | 1/4 | 0.23969(10) | 0.0095(3) |
| Sb1 | 2a | 3/4 | 1/4 | 0 | 0.0110(4) |
| Sb2 | 2c | 3/4 | 3/4 | 0.33036(11) | 0.0102(4) |
| Ag | 2b | 3/4 | 1/4 | 1/2 | 0.0133(4) |
The electrical transport under high pressure were measured by indenter-type pressure cell ( GPa) Kobayashi et al. (2007). Daphne oil 7474 Murata et al. (2008) was used as a pressure medium. The pressure in the sample space was determined by the superconducting transition temperature of Pb set near the sample.
Temperature dependence of the resistivity at zero field was measured by using a gas-flow-type optical cryostat (Oxford Instruments, K) and by a standard four-terminal method with a 2400 sourcemeter and 2182A nanovoltmeter (Keithley Instruments). The effect of thermal electromotive force by temperature gradient was removed by inversion of the current () direction.
The transverse magnetoresistivity , longitudinal magnetoresistivity , and Hall resistivity in a static magnetic field were measured using PPMS (Quantum Design, T and K), or superconducting magnet with variable-temperature insert (Oxford Instruments, T and K). For the latter system, LR-700 AC resistance bridge (Linear Research) were utilized with the measurement frequency of 16 Hz. They were measured by the standard four-terminal method, and electrical contacts were formed by silver paste (Dupont 4922N).
III Results and discussion
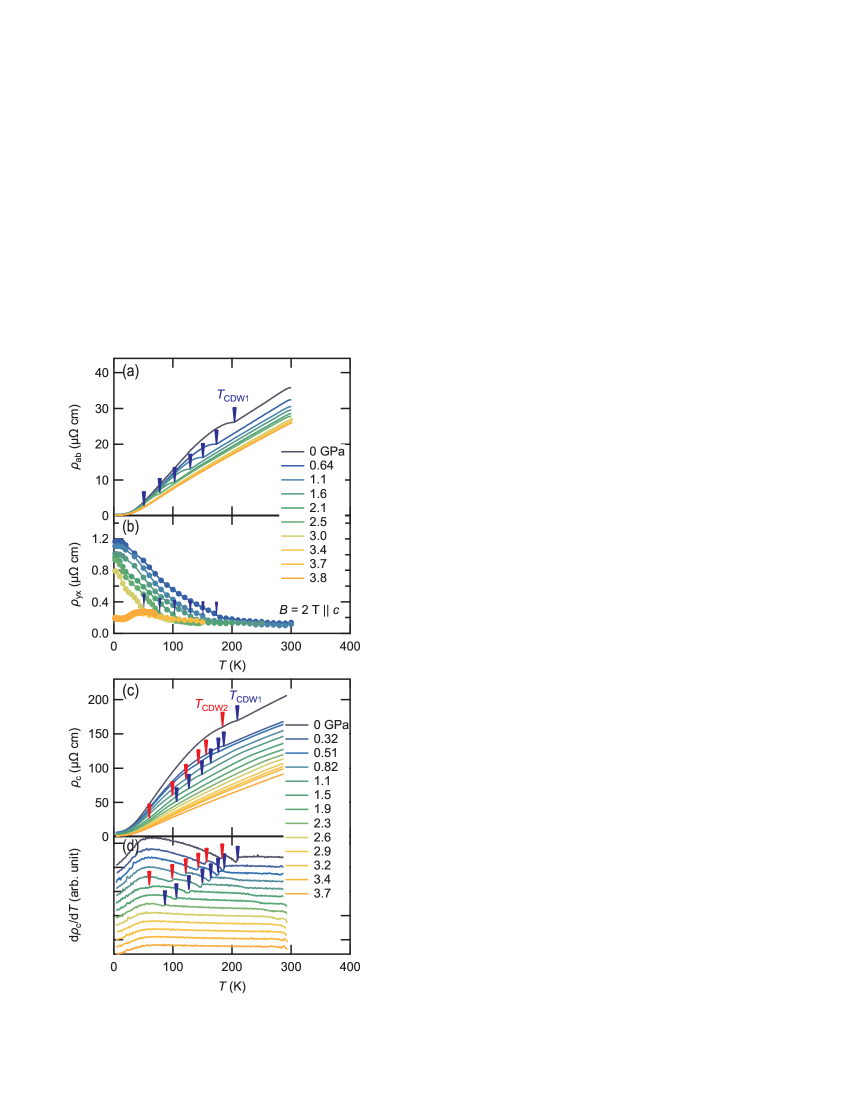
First, we focus on the temperature dependence of the in-plane resistivity () at several pressures up to 3.8 GPa. At ambient pressure, we observed an abrupt increase in at 204 K, as indicated by a blue arrow in Fig. 2(a), which is ascribed to . This value agrees with the previous reports Masubuchi et al. (2014); Bud’ko et al. (2006); Torikachvili et al. (2007); Song et al. (2003); Myers et al. (1999a). With the increment in pressure, monotonically decreased, and could not be defined above 3.4 GPa. Complementary, the temperature dependence of Hall resistivity at T is shown in Fig. 2(b). At all pressures below 3.0 GPa, a clear increase in was observed at , which may correspond to the disappearance of partial Fermi surfaces due to the transition to CDW1. Above 3.4 GPa, however, did not show an increase and hardly depended on pressure. These results indicate that the critical pressure of CDW1 () lies between 3.0 and 3.4 GPa. divided by the applied is the Hall coefficient , which is represented by in the high-field limit of the simple electron–hole conduction model with closed Fermi pockets. Here, , , and represent the hole carrier density, electron carrier density, and elemental charge, respectively. However, because the Fermi surface of LaAgSb2 has complicated geometry, cannot be connected simply with the carrier density, as discussed later. Thus, we do not enter the quantitative analysis of in the present study.
As suggested by previous studies, an anomaly at is quite subtle in , and we could not trace the pressure dependence of in the in-plane transport. Thus, we focused on the out-of-plane resistivity () to identify the . Figure 2(c) shows the temperature dependence of at several pressures. K is also clearly observed in , whose pressure dependence is consistent with that in Figs. 2(a) and (b). Furthermore, we can identify a kink at 184 K at ambient pressure, as indicated by a red arrow in Fig. 2(c). This is consistent with the transition temperature to CDW2 reported in the previous study Song et al. (2003); Watanabe et al. (2006), and thus, we hereafter define this anomaly as . As clearly observed in the in Fig. 2(d), was suppressed by pressure and became invisible above 1.9 GPa. From this result, we determined that the critical pressure of the CDW2 () lies between 1.5 and 1.9 GPa.
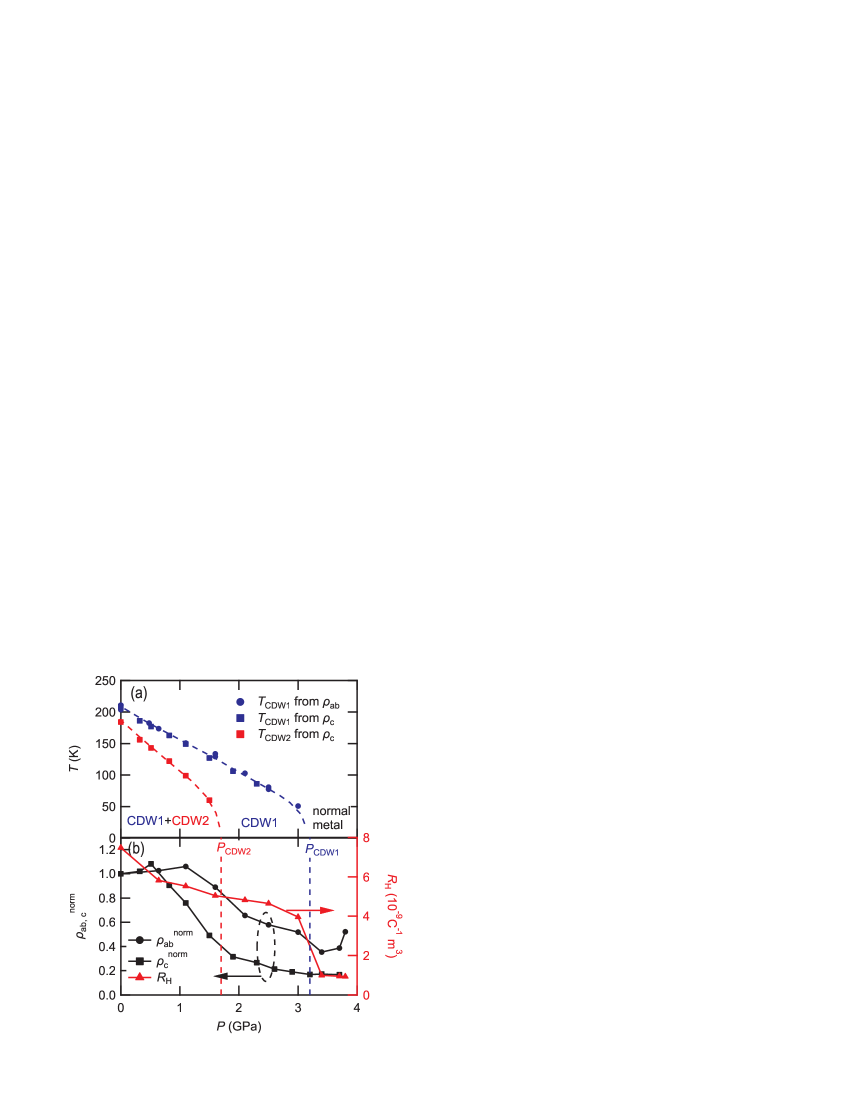
We summarize the pressure dependence of and in Fig. 3(a). determined from and both lie on an identical line, and the slope is determined to be K/GPa. This value is slightly steeper than that reported in previous results ( K/GPa) Bud’ko et al. (2006); Torikachvili et al. (2007), but shows reasonable agreement. Compared to , is more rapidly suppressed by pressure with slope of K/GPa. Both and depend linearly on the pressure sufficiently above and , whereas they seem to more rapidly approach zero in the vicinity of their critical pressure than in a simple linear extrapolation. We note that and in LaAuSb2 is estimated to be and K/GPa, respectively Xiang et al. (2020), suggesting that CDW orders in LaAgSb2 is more robust against the application of pressure than those of LaAuSb2. The black traces in Fig. 3(b) show the pressure dependences of the in-plane resistivity at 2 K () and out-of-plane resistivity at 3.7 K () normalized by values at ambient pressure. Up to , shows decreasing trend. In the normal metallic phase above , on the other hand, changes its slope and shows a rather weak pressure dependence. also changes its slope at and , and is almost constant in the normal phase. A similar change in the slope at is also reported in the pressure dependence of the in-plane residual resistivity of LaAuSb2 Xiang et al. (2020). The red trace in Fig. 3(b) shows defined by at T, which shows a significant decrease at .
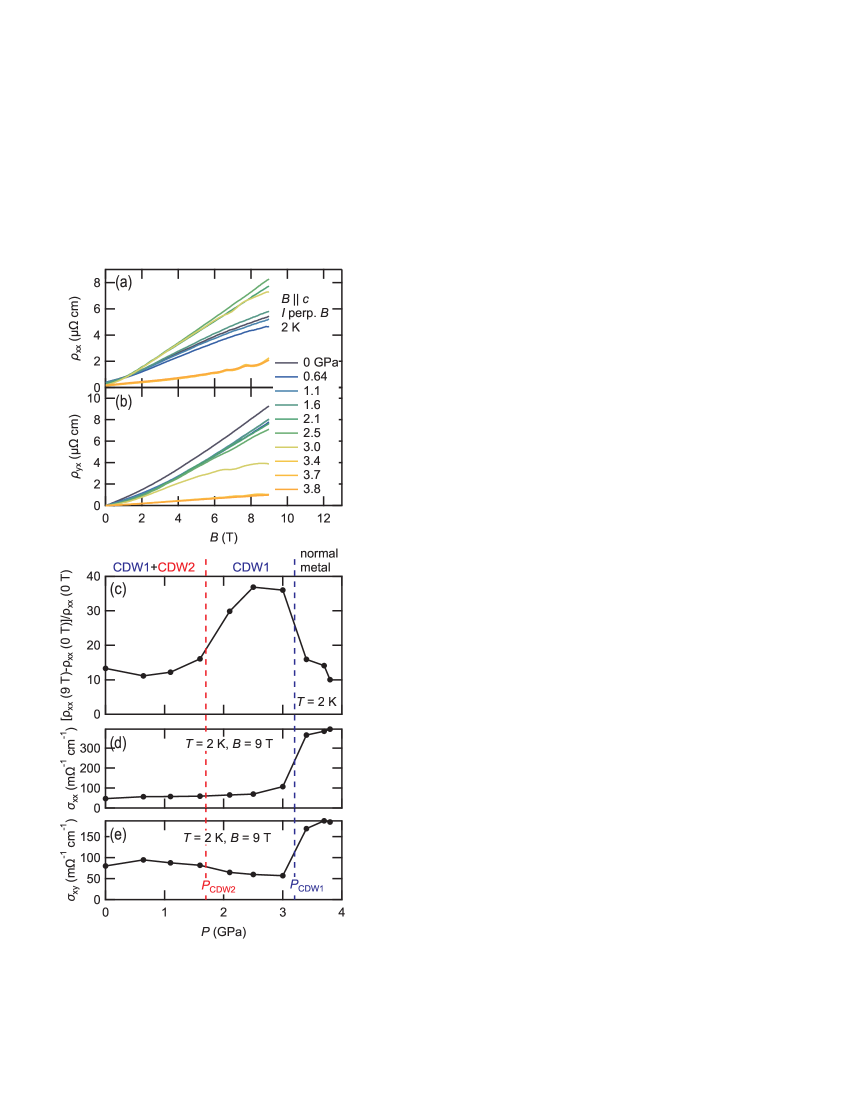
To obtain more insight on the change in electronic structure across and , we investigated the in-plane magnetoresistivity () and Hall resistivity () under high pressure with magnetic fields along the axis and electric current within the – plane, whose results are shown in Figs. 4(a) and (b). at 2 K does not show the tendency of saturation and has quasilinear magnetic-field dependence rather than conventional quadratic one at all measured pressures. at ambient pressure shows almost identical property with the previous report Wang and Petrovic (2012) and is significantly suppressed above 3.4 GPa. In addition, we can see non-monotonic modulation superposed on and , which is notably enhanced above 3.4 GPa. This is ascribed to quantum oscillation, whose details will be discussed later. As shown in Fig. 4(c), the magnetoresistance effect shows characteristic behavior in each CDW phases. Below , in which CDW1 and CDW2 coexist, the magnetoresistance effect at 9 T is approximately 10–20 and shows weak pressure dependence. In the intermediate pressure range between and , in which only CDW1 survives, it is drastically enhanced up to 40. In the normal phase above , it rapidly decreases and again shows weak pressure dependence.
Using the data shown in Fig. 4(a) and 4(b), we deduced the pressure dependence of the in-plane electrical conductivity and Hall conductivity at K and T, as shown in Fig. 4(d) and (e). Both and show step-like increase at , while there is no apparent change at . in the normal metallic phase is approximately 8 times larger than that at ambient pressure, indicating the realization of highly conductive phase above .
is represented by in case of simple closed Fermi surface and , where and represent the cyclotron frequency and relaxation time, respectively. However, it should be noted that this picture cannot be applied directly in a complicated Fermi surface, as in LaAgSb2. More elementary, is represented by the following expression with the cross sections of hole-like orbit and electron-like orbit cut by a constant- plane Abrikosov (1988):
| (1) |
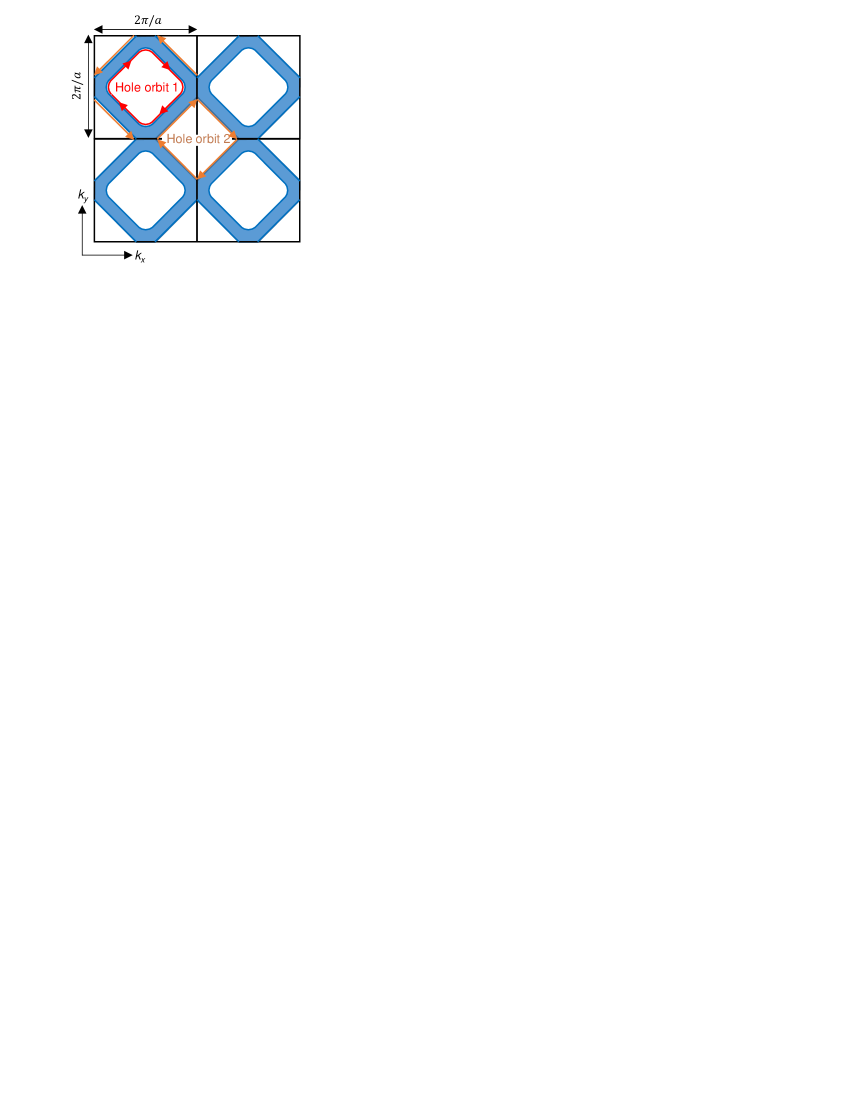
Here, the hole-like and electron-like orbits represent the trajectories that enclose the higher- and lower-energy regions in the momentum space, respectively. Let us consider a Fermi surface shown in Fig. 5, which is a simplified hollow Fermi surface of LaAgSb2. As mentioned above, the CDW1 is regarded to be result from a nesting within this Fermi surface. In the first Brillouin zone, this Fermi surface hosts two types of closed orbit indicated by red and orange loops. Because both orbits enclose a hollow region (high-energy region), these orbits should bring positive contribution to . This Fermi surface is more or less gapped out in the presence of CDW1; thus, the positive contribution to should be suppressed below . Above , on the other hand, this Fermi surface fully contributes to the electrical transport, which results in enhancement of . This scenario qualitatively agree with the step-like increase in electrical conductivities at . The absence of an anomaly at , may suggest that the formation of CDW2 brings modest effect in the in-plane orbital motion.
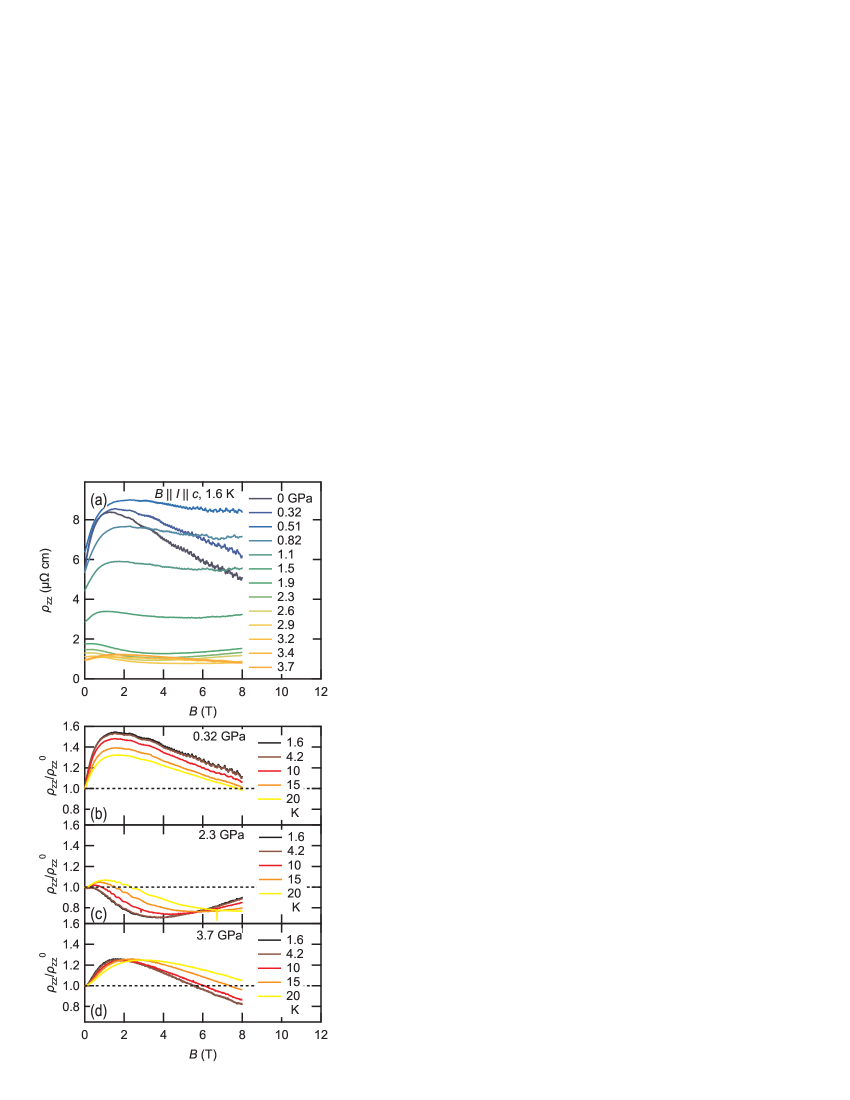
We also investigated the out-of-plane magnetoresistivity () at 1.6 K and up to 3.7 GPa, which is shown in Fig. 6(a). At ambient pressure, rapidly increases as increases and has local maximum at approximately 1 T. In higher , we observed notable negative magnetoresistance effect, i.e., the decrease in as a function of . Fig. 6(b) shows the out-of-plane resistivity normalized by zero-field value () at 0.32 GPa. The local maximum decreases as the temperature increases, whereas the slope of the negative magnetoresistance effect is less sensitive to the temperature. Compared to , very clear SdH oscillation superposed on the negative magnetoresistance was observed in high-field region. With increments in pressure up to , the quasilinear negative slope in high-field region was gradually suppressed, as shown in Fig. 6(a), though local maximum still exists at T. After passes through , the increase in below 1 T was hardly observed at 1.6 K, though it appeared as the temperature increases, as shown in Fig. 6(c). The origin of drastic change in the functional form of is unclear at the present stage. In the normal metallic phase above , the increase in resistivity below 1 T and SdH oscillation again observed at 1.6 K. As shown in Fig. 6(d), the negative slope of at 3.7 GPa is almost identical to that at 0.32 GPa.
In conventional Drude model, remains unchanged as a function of magnetic field since the current parallel to the field direction is free from Lorentz force. An artificial negative longitudinal magnetoresistance effect is known to caused by an extrinsic mechanism called current jetting Arnold et al. (2016); dos Reis et al. (2016), which becomes dominant in systems with large non-saturating and high mobility. In such a system with large anisotropy factor , the electric current in the sample becomes strongly inhomogeneous in high magnetic fields, and artificial negative longitudinal magnetoresistance can appear depending on the geometry of the potential contact. As for the present case, let we assume that does not drastically change from the zero-field value, i.e., remains in order of 1 cm. Then, is estimated to be in order of 1, since Fig. 4(a) indicates that is also in order of 1 cm in the present magnetic field and pressure range. Thus, this extrinsic mechanism is excluded from the possible origin. We regard that the observed negative longitudinal magnetoresistance is arise from the intrinsic electronic structure. The negative longitudinal magnetoresistance effect is often discussed in Dirac/Weyl systems, which is called chiral anomaly Son and Spivak (2013); Xiong et al. (2015). In this mechanism, charge carriers are pumped from one Weyl point to another with opposite chiralities via the lowest Landau level in the presence of parallel to the electric field. However, we observed negative contribution in all pressure from ambient pressure to 4 GPa, and no apparent enhancement was observed above , which is evident in comparison between Fig. 6(b) and 6(d). This results suggest that the presence of the two-dimensional hollow Fermi surface, in which possible Dirac dispersion has been proposed, cause little influence on the emergence of negative contribution. On the other hand, recent theoretical study showed that negative magnetoresistance effect can arise from the warp of the Fermi surface from the perfect sphere, regardless of the nontrivial band topology Awashima and Fuseya (2019). Thus, more details of the Fermi surfaces in both CDW phase and normal metallic phase under high pressure are indispensable to discuss the origin of negative longitudinal magnetoresistance. Here, we also note that isostructural LaAuxSb2, which shows CDW transitions at K at ambient pressure, shows weak positive longitudinal magnetoresistance at ambient pressure up to 8 T (Fig. 13 in Appendix A). The sample size and configurations of electrical contact are almost identical with those in LaAgSb2. This supports that the remarkable negative longitudinal magnetoresistance is unique to the electronic structure of LaAgSb2.
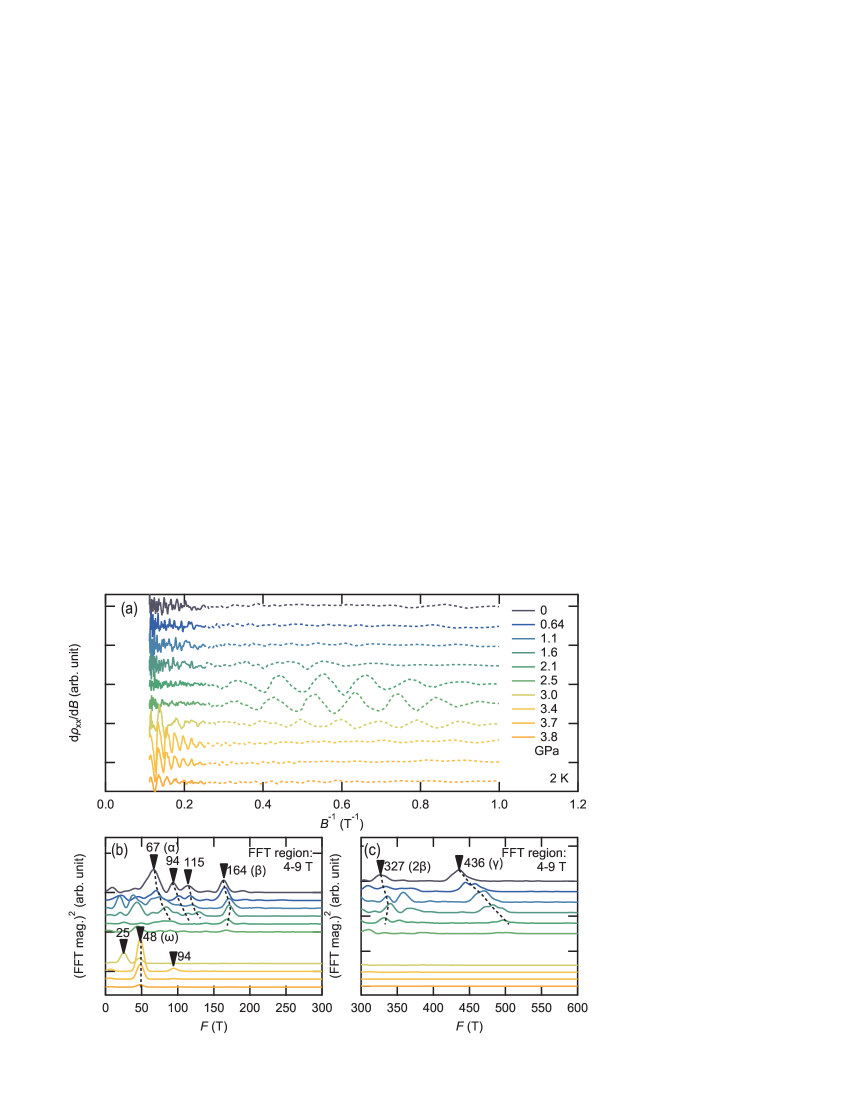
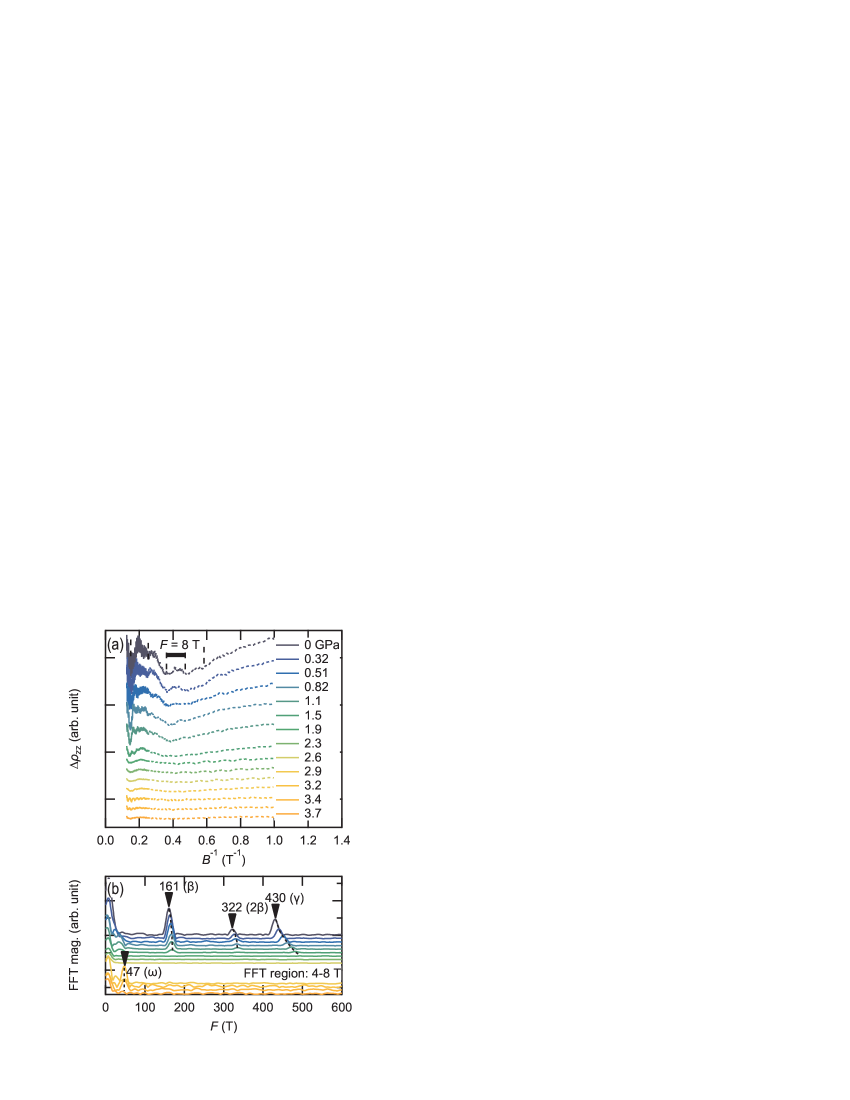
Then, we focus on the oscillatory structure on . Figure 7(a) shows the magnetic-field derivative of at 2 K as a function of . At ambient pressure, the oscillation is discernible above 4 T, and the oscillation pattern changes with application of pressure up to 3.8 GPa. In particular, we can recognize a drastic change in oscillation pattern when passes through . The oscillation above 4 T is periodic with respect to and damps as the temperature increases, which is well described by conventional Lifshitz–Kosevich (LK) formula for quantum oscillation phenomena Shoenberg (1984). Thus, this can be ascribed to Shubnikov–de Haas (SdH) oscillation by extremum cyclotron orbit of the Fermi surfaces. Below 4 T (dotted region in Fig. 7(a)), on the other hand, we can also recognize another oscillatory structure with lower frequency between and . This oscillation is also assumed to be SdH oscillation, though its amplitude shows anomalous temperature/magnetic-field dependence unlike those above 4 T. In the following, we firstly focus on the oscillation structure observed above 4 T, and the oscillation observed below 4 T will be discussed later.
| label | (T) | () | (K) | (GPa-1) |
|---|---|---|---|---|
| 67 (72 Myers et al. (1999b)) | ||||
| 94 | ||||
| 115 | ||||
| 164 (164 Myers et al. (1999b), 160 Inada et al. (2002)) | (0.16 Myers et al. (1999b), 0.16 Inada et al. (2002)) | (0.67 Inada et al. (2002)) | ||
| 436 (432 Myers et al. (1999b), 440 Inada et al. (2002)) | 111Data obtained from at 0.32 GPa. (0.28 Myers et al. (1999b), 0.34 Inada et al. (2002)) | (1.1 Inada et al. (2002)) | (0.16 Myers et al. (1999b)) | |
| 48 222Data obtained from at 3.4 GPa. | 222Data obtained from at 3.4 GPa. | 222Data obtained from at 3.4 GPa. |
Figure 7(b) and (c) shows the fast Fourier transform (FFT) spectra of at various pressure. The FFT was performed in the magnetic field region between 4 and 9 T. At ambient pressure, we identified six peaks, as indicated by arrows in Fig. 7(b) and (c). Following the previous quantum oscillation studies Myers et al. (1999b); Inada et al. (2002); Bud’ko et al. (2008), the peaks with frequencies , and 436 T are labeled as , , and peaks, respectively. These peaks shows quite well accordance with the previous studies as shown in Tab. 3. The peak at 327 T is assigned to be second harmonic of since the pressure dependence of the frequency is identical with that of . The adopted temperature and magnetic-field range are different from those in previous studies, and thus, oscillatory component higher than 600 T was not identified in the present study. In the pressure region below , we recognized several FFT peaks below 60 T, though it was difficult to trace the reliable pressure dependence. As the pressure approaches to , all these peaks got gradually weaker and we could not trace the pressure dependence above 2.5 GPa. Then, above , a single oscillation with frequency of 48 T becomes dominant. At 3.0 and 3.4 GPa, just above , secondary oscillation components with frequencies of 25 and 94 were also identified.
Then, we focus on the quantum oscillation in . Figure 8(a) shows the out-of-plane magnetoresistivity with fourth-polynomial background subtraction. Compared with the in-plane magnetotransport, oscillation structure is quite sharp in the field region above 4 T, and another oscillation component below 4 T also appeared in the pressure region . Figure 8(b) shows the FFT spectra of SdH oscillation above 4 T. We identified , , and peaks at ambient pressure, whose frequency agree quite well with those in in-plane magnetotransport. We also identified a oscillatory component with small frequency of T [indicated by vertical broken lines and frequency scale in Fig. 8(a)], which has not been reported in previous studies. As seen in Fig. 8(b), the FFT peaks become gradually weak, and we could not see any discernible peak between and . Above , single peak with T appeared, which also consistent with Fig. 7
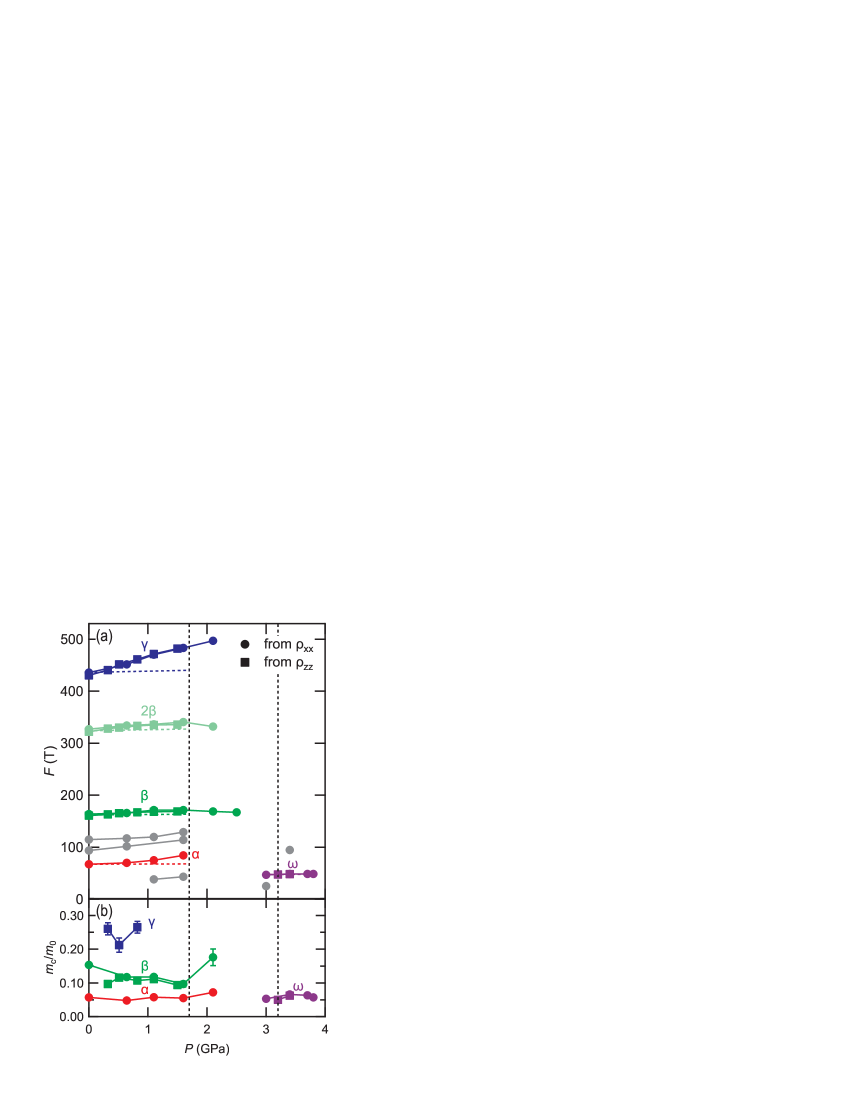
The pressure dependence of the FFT peaks obtained from and measurements are summarized in Fig. 9(a). , , , and shift almost linearly with the increment in pressure, while only showed tendency of saturation as it approaches and slight decrement in . In general, the cross section of a Fermi surface becomes larger as the first Brillouin zone is enlarged by shrinkage of lattice constant. Using the linear compressibility of in-plane lattice parameter GPa-1 Bud’ko et al. (2006), the pressure derivative of the SdH frequency due to the shrinkage of lattice constant is estimated as GPa-1. Here, and represents the in-plane lattice constant and SdH frequency at ambient pressure. Pressure dependence of lattice constant is approximated to be linear for simplicity. We estimate for each branch by linear curve fitting in the pressure range of , which is listed in Tab. 3. For all branches, is significantly larger than that expected from the lattice compression, indicating that the change in the cross sections under pressure is dominated by modification of the band structure that is not scaled by lattice deformation. For comparison, the pressure dependence of for each branch expected from the lattice deformation is shown by approximately horizontal broken line in Fig. 9(a). This suggests that the deformation effect of the Fermi surface cannot be ignored to discuss the electronic structure under pressure. For branch, a previous study has been estimated the pressure derivative 0.16 GPa-1 Myers et al. (1999b). The disagreement with the present study may come from limited data point and pressure region in the previous study. We also estimated the cyclotron effective mass () from the temperature dependence of SdH oscillations for primary branches, the result of which is summarized in Fig. 9(b). of , , and branches at ambient pressure were confirmed to be consistent with previous quantum oscillation measurements, as described in Tab. 3. is not so sensitive to the pressure for all branches below , and the branch in the normal metallic phase above holds small effective mass of . As we can see in Fig. 9, the SdH oscillation observed in and shows quite good agreement with each other. Although all Fermi surfaces should contribute to the transport properties above , we found only peaks in the and range of the present study, possibly due to larger external cross section and heavier cyclotron effective masses of the other orbits compared to .
We further focus on the branch in the normal metallic phase under pressure. The corresponding cross section in the space () is estimated to be m-2 with using T at 3.4 GPa. Comparing with the cross section of the first Brillouin zone at 3.4 GPa, m-2, is only 0.22% of , indicating a quite small cyclotron orbit. Based on the Fermi surface at ambient pressure Myers et al. (1999b); Inada et al. (2002), the small ellipsoidal electron pocket located at the point might be the origin of this frequency. However, whether the Fermi surface at ambient pressure is directly applicable to the case under pressure is unclear at present, considering the unignorable band deformation suggested in the pressure dependence of the SdH frequency. Further investigation of field-angular dependence of this frequency and careful comparison with band calculation under pressure are needed to clarify the geometry of the Fermi surface in the normal metallic phase.
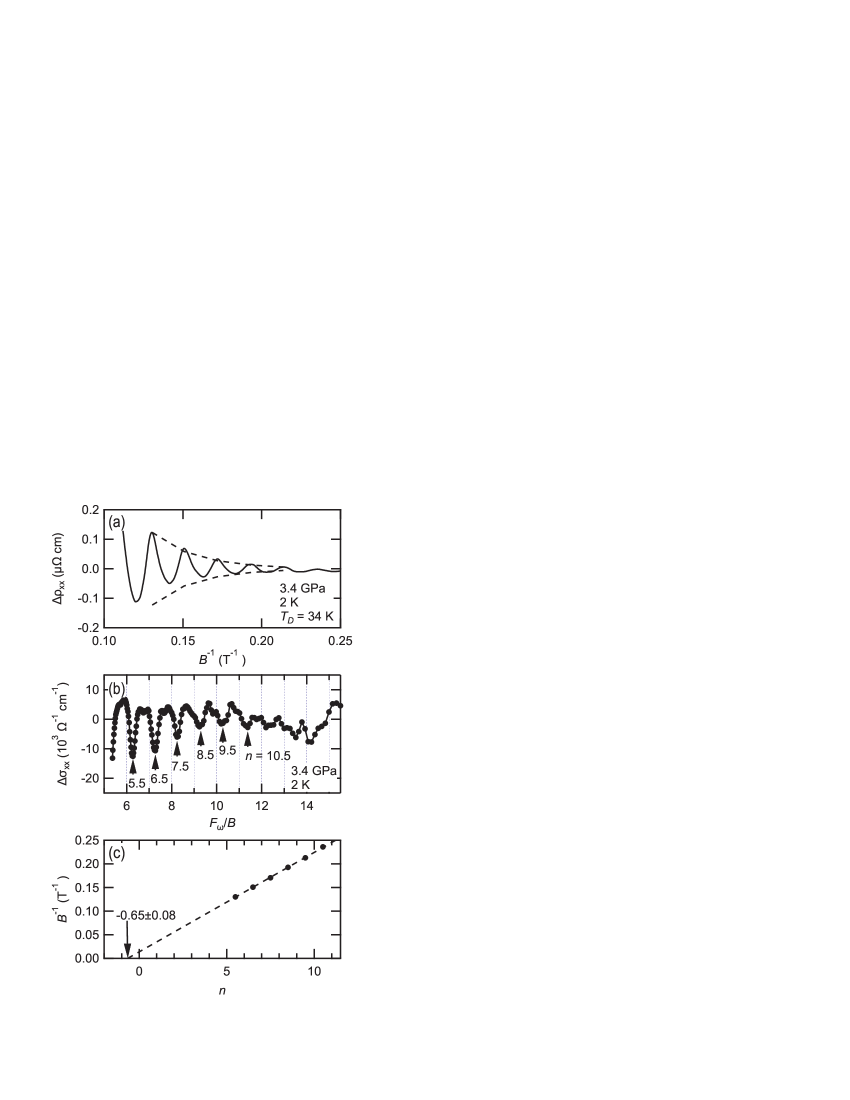
Figure 10(a) shows at GPa and K as a function of . The SdH oscillation originating from shows a clear bell-bottom-shaped envelope, which enables the Dingle temperature to be deduced. According to the LK formula, the field dependence of the amplitude is expected as follows, with cyclotron frequency : Shoenberg (1984)
| (2) |
From the plot of as a function of , K was extracted. Here, we adopted , estimated from the temperature dependence of the amplitude at 3.4 GPa. As shown by the dotted curves in Fig. 10(a), the envelope function was reproduced well by Eq. (2), assuming the obtained . Correspondingly, the relaxation time and mobility were estimated as s and cm2/(Vs), respectively.
To obtain the insight on possible existence of nontrivial band topology in the normal metallic phase above , we analyzed the phase factor of the SdH oscillation in the in-plane conductivity . Figure 10(b) shows the oscillatory component of the in-plane conductivity () at GPa and K as a function of . Here, was obtained by subtraction of the fourth-polynomial background from . The dips in were quite sharp, as indicated by the solid arrows in Fig. 10(b), whereas the peaks of , which are ascribed to level-crossing points, exhibited relatively flat figures. We associated the inverse magnetic field of the dip position to the half-integer Landau index, whose relationship is shown in Fig. 10(c). The horizontal intercept of this Landau-level fan diagram is discussed to identify the anomalous phase shift originating from the presence of the Dirac fermion Ando (2013); Murakawa et al. (2013). The functional form of is simplified as
| (3) |
is believed to reflect the Berry phase , which is for a Dirac system and zero for a trivial system. depends on the dimensionality of the system: for the three-dimensional case and for the two-dimensional case. The above formulation indicates that in the three-dimensional system, the horizontal intercept of the Landau-level fan diagram takes and for the trivial and Dirac case, respectively. In the case of the branch, the horizontal intercept is determined to be , which seems to be close to the trivial case (). However, we note that the phase of quantum oscillation is considerably affected by whether Zeeman splitting exists or not Akiba et al. (2018). The effect of Zeeman splitting yields an amplitude factor , whose sign changes depending on the effective factor () and cyclotron effective mass. The flat peaks in Fig. 10(b) may indicate that this branch possesses finite Zeeman splitting, which is inconspicuous, owing to the limited magnetic field range in the present study. Thus, to properly evaluate the topological aspect from SdH oscillation, the value of the Zeeman–cyclotron ratio , which is an alternative index to discuss the nontrivial band topology Fuseya et al. (2015); Hayasaka and Fuseya (2016), should be clarified by further high-field or field-angular dependence measurements. The horizontal intercept of branch determined in the present study suggests , where . The specification of remains for future study.
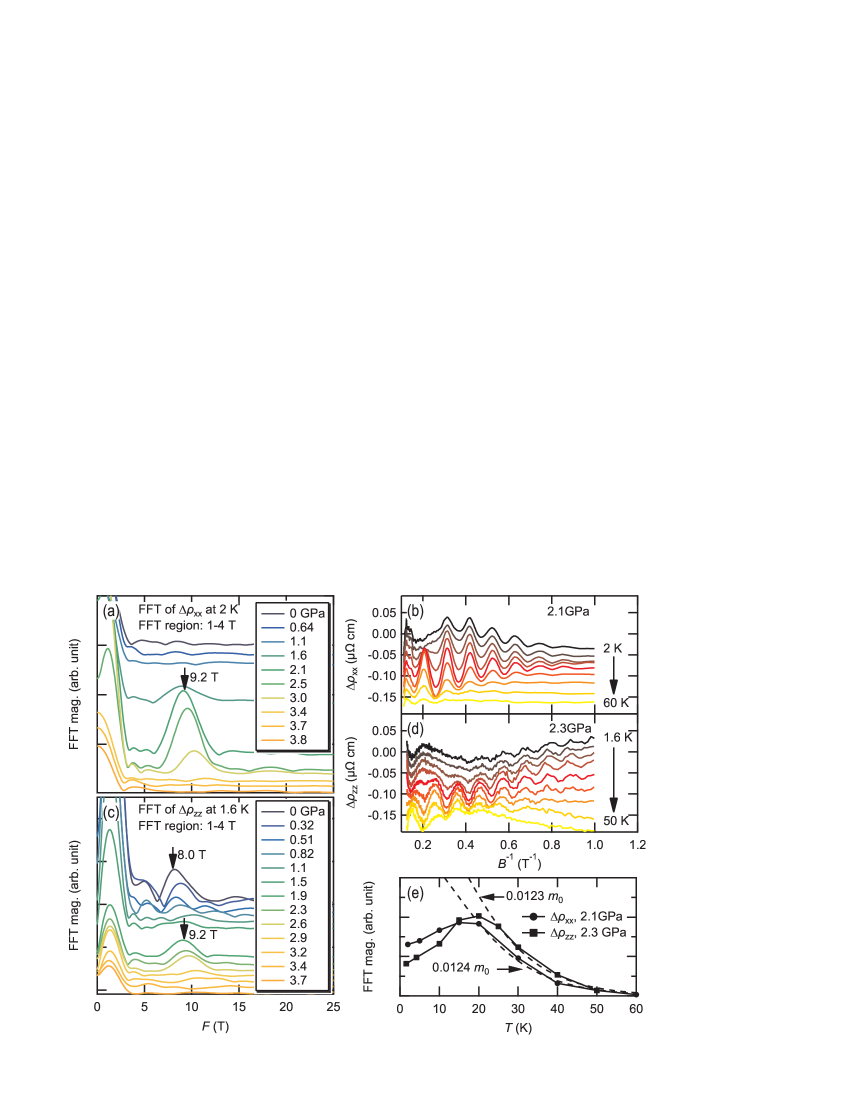
Finally, we focus on the oscillatory component observed below 4 T [dotted area in Fig. 7(a) and Fig. 8(a)] in the pressure range of . Figure 11(a) shows the FFT spectra of between 1 and 4 T at 2 K. A FFT peak of T is discernible at 1.6 GPa where CDW2 still exists, and it was suddenly enhanced in . As increases toward , the oscillation becomes considerably damped and is not observed above . Figure 11(b) shows the temperature variation of at 2.1 GPa, where the FFT magnitude at 2 K reaches its maximum. We can see that the peak at T-1 shows anomalous behavior: although it is absent below 10 K, it becomes large as the temperature increases, and then decreases. It seems that the oscillation amplitude at high- and low- region is strongly suppressed for some reason. The oscillation with frequency of T was also reproduced in the out-of-plane resistivity measurement. Figure 11(c) shows the FFT spectra of between 1 to 4 T at 1.6 K. We can recognize the enhancement of the FFT peak with T in , which is consistent with the result shown in Fig. 11(a). We can also identify a peak with T at ambient pressure, which is considered to be a long-period oscillation, as described in Fig. 8(a). Whether the oscillation with T at ambient pressure has an identical origin with that observed in remains unclear at present, although the frequencies are close with each other. Figure 11(d) shows the temperature variation of at 2.3 GPa. The suppression of oscillation amplitude at the high- and low- region is seen more clearly.
The distinct peak in the FFT spectrum indicates that this oscillation is well periodic as a function of , suggesting a sort of magnetotransport effect. Besides, the frequency is independent of current direction as long as the magnetic-field direction is identical, which agree with the general feature of the SdH oscillation. However, the significant reduction of the amplitude observed at the high- and low- is unusual compared with conventional SdH oscillation. Several mechanisms have been known to cause the resistivity oscillation, whose amplitude shows anomalous temperature dependence although they are quite similar with the SdH oscillation. One is called magneto-phonon resonance Nicholas (1985), whose origin is resonant carrier scattering across the Landau levels caused by optical phonon. However, this phenomenon is mostly observed in low-carrier systems such as semiconductors and usually absent below 50 K, where the population of the optical phonon is quite small. These features do not agree with our results. Another example is called Stark quantum interference Shoenberg (1984); Stark and Friedberg (1971). The origin of this resistivity oscillation is a quantum interference of the wavefunction between two open orbits running parallel in the momentum space. However, the oscillation amplitude is expected to be almost independent of temperature unless the orbits are considerably smeared out. Thus, the strong temperature dependence of the resistivity peak at high- region cannot be explained by this mechanism. Thus, we ascribe the SdH oscillation being most probable origin of this oscillation phenomenon. The deviation from the conventional LK formula may caused by a change of and/or , though the precise origin is unclear within the scope of the present study. The small frequency of 9.2 T corresponds to the cross section of m-2 in the space, which is only 0.042% of the cross section of the first Brillouin zone at 2.1 GPa. Because such a small cross section is not expected in the band calculation at ambient pressure, the emergence of small Fermi surface under pressure (Lifshitz transition) or reconstruction of Fermi surface by nesting of CDW1 is considered to be possible origin.
Figure 11(e) summarizes the temperature dependence of the FFT magnitude calculated from the data shown in Fig. 11(b) and 11(d). The temperature dependence of the oscillation showed almost identical property between and . As shown in the broken lines in Fig. 11(e), the temperature dependence of the FFT magnitude above 20 K is reproduced well by conventional the LK formula with fixed . The reduction of the FFT magnitude below 20 K reflects the damping behavior described in Figs. 11(b) and 11(b).
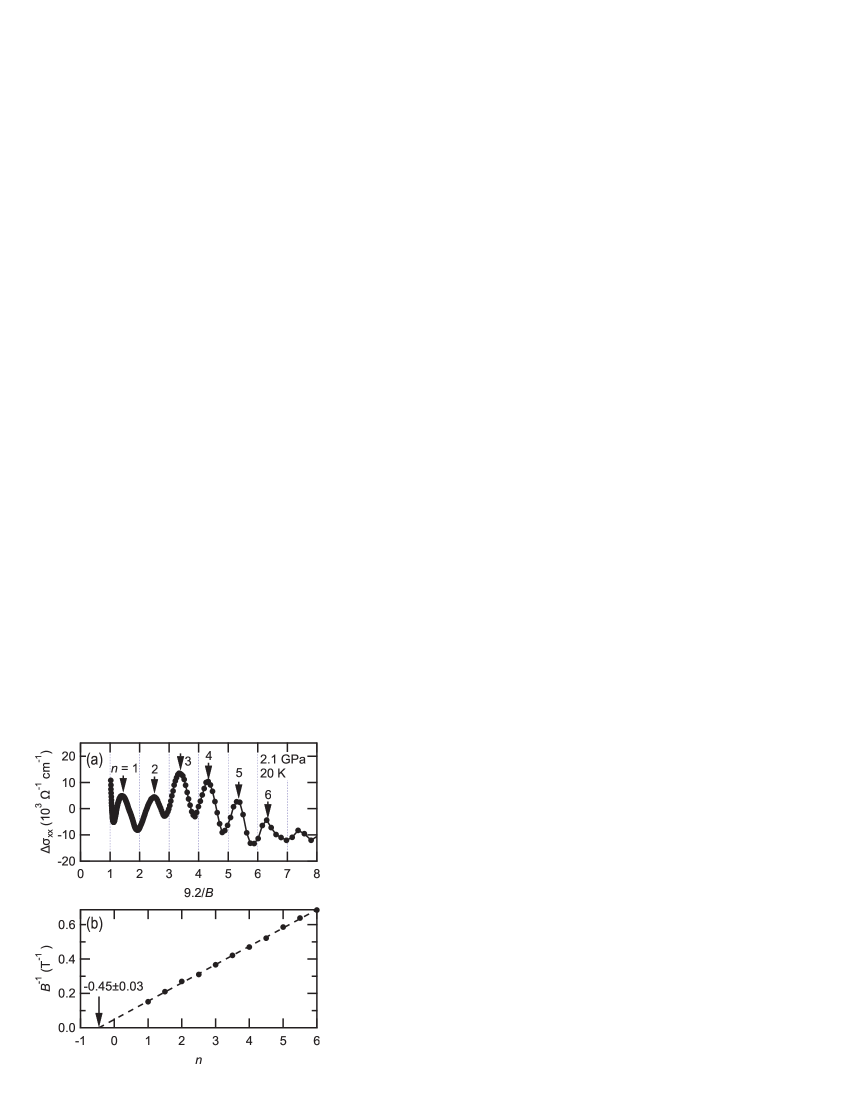
At last, we focus on the phase factor of this small cyclotron orbit. Figure 12(a) shows the oscillatory component of conductivity () at 2.1 GPa and 20 K. As well as the case of branch, we assigned the peak position to the integer Landau index, and constructed Landau-level fan diagram is shown in Fig. 12(b). The horizontal intercept was estimated to be , which seems to be close to the trivial case (), or where using the Zeeman–cyclotron ratio.
IV Conclusion
In conclusion, we comprehensively investigated the magnetotransport properties of LaAgSb2 under high pressure to clarify the phase diagram of the two charge-density-wave (CDW) states and the change in the electronic structure across the CDW critical pressures. The temperature dependence of in-plane, out-of-plane, and Hall resistivity showed anomalies at K and K at ambient pressure; this result agrees with the previous studies. Both and were suppressed under pressure with rates of and K/GPa, respectively. Compared with LaAuSb2, which shows similar successive CDW transitions, the CDW states in LaAgSb2 seems robust against pressure. The critical pressure of CDW1 and CDW2 were determined to be –3.4 GPa and –1.9 GPa, respectively.
The measurements (, ) under pressure showed that the quasilinear magnetoresistance effect (1000% in and , and 4000% in at 9 T). In-plane Hall conductivity showed step-like increase at . This is qualitatively consistent with the emergence of two-dimensional hollow Fermi surface, which is regarded to responsible for the nesting of CDW1. () showed prominent negative magnetoresistance effect, which was observed to some extent in all measured pressures from ambient to 4 GPa. The presence of hollow Fermi surface seems to be insensitive to the emergence of this negative magnetoresistance effect. Additional information about the Fermi surface under pressure is necessary to understand the field dependence of .
We observed clear Shubnikov–de Haas (SdH) oscillation in both and , whose oscillation frequencies were consistent with those found in the previous quantum oscillation studies at ambient pressure. The pressure dependence of the oscillation frequencies were significantly larger than those expected from the decrease in the in-plane lattice constant, which indicates unignorable deformation of the Fermi surface under pressure. In the normal metallic state above , we observed a single SdH oscillation with a frequency and cyclotron mass of 48 T and 0.066 , respectively. This cyclotron orbit corresponds to only 0.22% of the first-Brillouin-zone area projected on . The Landau-level fan diagram analysis suggested the trivial phase factor for this oscillation. In the pressure region in the present study ( GPa), the cyclotron effective mass for each oscillation component showed little pressure dependence. We also identified another oscillatory component below 4 T, which is significantly enhanced for . The oscillation was periodic in terms of the inverse magnetic field and showed an identical frequency of 9.2 T in and . We ascribe that this is an SdH oscillation from its small cyclotron orbit (0.042% of the first Brillouin zone). The amplitude of this SdH oscillation was anomalously suppressed in the low-temperature and high-field region, and its origin has been left for future study.
Acknowledgements.
We thank S. Araki and H. Harima for their many helpful comments and discussions, H. Ota for the X-ray single-crystal structural analyses, and M. Yokoyama for support with Laue diffraction measurements. This research was supported by JSPS KAKENHI Grant Number 19K14660. X-ray single-crystal structural analyses were performed at the Division of Instrumental Analysis, Okayama University.References
- Grüner (1994) G. Grüner, Density Waves in Solids (Perseus Publishing, Cambridge, 1994).
- Johannes and Mazin (2008) M. D. Johannes and I. I. Mazin, Phys. Rev. B 77, 165135 (2008).
- Eiter et al. (2013) H.-M. Eiter, M. Lavagnini, R. Hackl, E. A. Nowadnick, A. F. Kemper, T. P. Devereaux, J.-H. Chu, J. G. Analytis, I. R. Fisher, and L. Degiorgi, Proc. Natl. Acad. Sci. USA 110, 64 (2013).
- Brylak et al. (1995) M. Brylak, M. H. Möller, and W. Jeitschko, J. Solid State Chem. 115, 305 (1995).
- Johrendt (2011) D. Johrendt, J. Mater. Chem. 21, 13726 (2011).
- Song et al. (2003) C. Song, J. Park, J. Koo, K.-B. Lee, J. Y. Rhee, S. L. Bud’ko, P. C. Canfield, B. N. Harmon, and A. I. Goldman, Phys. Rev. B 68, 035113 (2003).
- Myers et al. (1999a) K. D. Myers, S. L. Bud’ko, I. R. Fisher, Z. Islam, H. Kleinke, A. H. Lacerda, and P. C. Canfield, J. Magn. Magn. Mater. 205, 27 (1999a).
- Watanabe et al. (2006) Y. Watanabe, Y. Inada, H. Hidaka, H. Kotegawa, T. Kobayashi, T. Matsuda, and D. Aoki, Physica B: Condensed Matter 378-380, 827 (2006).
- Myers et al. (1999b) K. D. Myers, S. L. Bud’ko, V. P. Antropov, B. N. Harmon, P. C. Canfield, and A. H. Lacerda, Phys. Rev. B 60, 13371 (1999b).
- Inada et al. (2002) Y. Inada, A. Thamizhavel, H. Yamagami, T. Takeuchi, Y. Sawai, S. Ikeda, H. Shishido, T. Okubo, M. Yamada, K. Sugiyama, N. Nakamura, T. Yamamoto, K. Kindo, T. Ebihara, A. Galatanu, E. Yamamoto, R. Settai, and Y. Onuki, Phil. Mag. 82, 1867 (2002).
- Bud’ko et al. (2008) S. L. Bud’ko, S. A. Law, P. C. Canfield, G. D. Samolyuk, M. S. Torikachvili, and G. M. Schmiedeshoff, J. Phys.: Condens. Matter 20, 115210 (2008).
- Arakane et al. (2007) T. Arakane, T. Sato, S. Souma, T. Takahashi, Y. Watanabe, and Y. Inada, J. Magn. Magn. Mater. 310, 396 (2007).
- Shi et al. (2016) X. Shi, P. Richard, K. Wang, M. Liu, C. E. Matt, N. Xu, R. S. Dhaka, Z. Ristic, T. Qian, Y.-F. Yang, C. Petrovic, M. Shi, and H. Ding, Phys. Rev. B 93, 081105(R) (2016).
- Wang and Petrovic (2012) K. Wang and C. Petrovic, Phys. Rev. B 86, 155213 (2012).
- Chamorro et al. (2019) J. R. Chamorro, A. Topp, Y. Fang, M. J. Winiarski, C. R. Ast, M. Krivenkov, A. Varykhalov, B. J. Ramshaw, L. M. Schoop, and T. M. McQueen, APL Mater. 7, 121108 (2019).
- Seo et al. (2012) S. Seo, V. A. Sidorov, H. Lee, D. Jang, Z. Fisk, J. D. Thompson, and T. Park, Phys. Rev. B 85, 205145 (2012).
- Kuo et al. (2019) C. N. Kuo, D. Shen, B. S. Li, N. N. Quyen, W. Y. Tzeng, C. W. Luo, L. M. Wang, Y. K. Kuo, and C. S. Lue, Phys. Rev. B 99, 235121 (2019).
- Hase and Yanagisawa (2014) I. Hase and T. Yanagisawa, Phys. Procedia 58, 42 (2014).
- Xiang et al. (2020) L. Xiang, D. H. Ryan, W. E. Straszheim, P. C. Canfield, and S. L. Bud’ko, Phys. Rev. B 102, 125110 (2020).
- Bud’ko et al. (2006) S. L. Bud’ko, T. A. Wiener, R. A. Ribeiro, P. C. Canfield, Y. Lee, T. Vogt, and A. H. Lacerda, Phys. Rev. B 73, 184111 (2006).
- Torikachvili et al. (2007) M. S. Torikachvili, S. L. Bud’ko, S. A. Law, M. E. Tillman, E. D. Mun, and P. C. Canfield, Phys. Rev. B 76, 235110 (2007).
- Masubuchi et al. (2014) S. Masubuchi, Y. Ishii, K. Ooiwa, T. Fukuhara, F. Shimizu, and H. Sato, JPS Conf. Proc. 3, 011053 (2014).
- Kobayashi et al. (2007) T. C. Kobayashi, H. Hidaka, and H. Kotegawa, Rev. Sci. Instrum 78, 023909 (2007).
- Murata et al. (2008) K. Murata, K. Yokogawa, H. Yoshino, S. Klotz, P. Munsch, A. Irizawa, M. Nishiyama, K. Iizuka, T. Nanba, T. Okada, Y. Shiraga, and S. Aoyama, Rev. Sci. Instrum. 79, 085101 (2008).
- Abrikosov (1988) A. A. Abrikosov, Fundamentals of the theory of metals (North-Holland, Amsterdam, 1988).
- Arnold et al. (2016) F. Arnold, C. Shekhar, S.-C. Wu, Y. Sun, R. D. dos Reis, N. Kumar, M. Naumann, M. O. Ajeesh, M. Schmidt, A. G. Grushin, J. H. Bardarson, M. Baenitz, D. Sokolov, H. Borrmann, M. Nicklas, C. Felser, E. Hassinger, and B. Yan, Nat. Commun. 7, 11615 (2016).
- dos Reis et al. (2016) R. D. dos Reis, M. O. Ajeesh, N. Kumar, F. Arnold, C. Shekhar, M. Naumann, M. Schmidt, M. Nicklas, and E. Hassinger, New J. Phys. 18, 085006 (2016).
- Son and Spivak (2013) D. T. Son and B. Z. Spivak, Phys. Rev. B 88, 104412 (2013).
- Xiong et al. (2015) J. Xiong, S. K. Kushwaha, T. Liang, J. W. Krizan, M. Hirschberger, W. Wang, R. J. Cava, and N. P. Ong, Science 350, 413 (2015).
- Awashima and Fuseya (2019) Y. Awashima and Y. Fuseya, J. Phys.: Condens. Matter 31, 29LT01 (2019).
- Shoenberg (1984) D. Shoenberg, Magnetic oscillations in metals (Cambridge University Press, Cambridge, 1984).
- Ando (2013) Y. Ando, J. Phys. Soc. Jpn. 82, 102001 (2013).
- Murakawa et al. (2013) H. Murakawa, M. S. Bahramy, M. Tokunaga, Y. Kohama, C. Bell, Y. Kaneko, N. Nagaosa, H. Y. Hwang, and Y. Tokura, Science 342, 1490 (2013).
- Akiba et al. (2018) K. Akiba, A. Miyake, H. Sakai, K. Katayama, H. Murakawa, N. Hanasaki, S. Takaoka, Y. Nakanishi, M. Yoshizawa, and M. Tokunaga, Phys. Rev. B 98, 115144 (2018).
- Fuseya et al. (2015) Y. Fuseya, Z. Zhu, B. Fauqué, W. Kang, B. Lenoir, and K. Behnia, Phys. Rev. Lett. 115, 216401 (2015).
- Hayasaka and Fuseya (2016) H. Hayasaka and Y. Fuseya, J. Phys.: Condens. Matter 28, 31LT01 (2016).
- Nicholas (1985) R. J. Nicholas, Quantum Electron. 10, 1 (1985).
- Stark and Friedberg (1971) R. W. Stark and C. B. Friedberg, Phys. Rev. Lett. 26, 556 (1971).
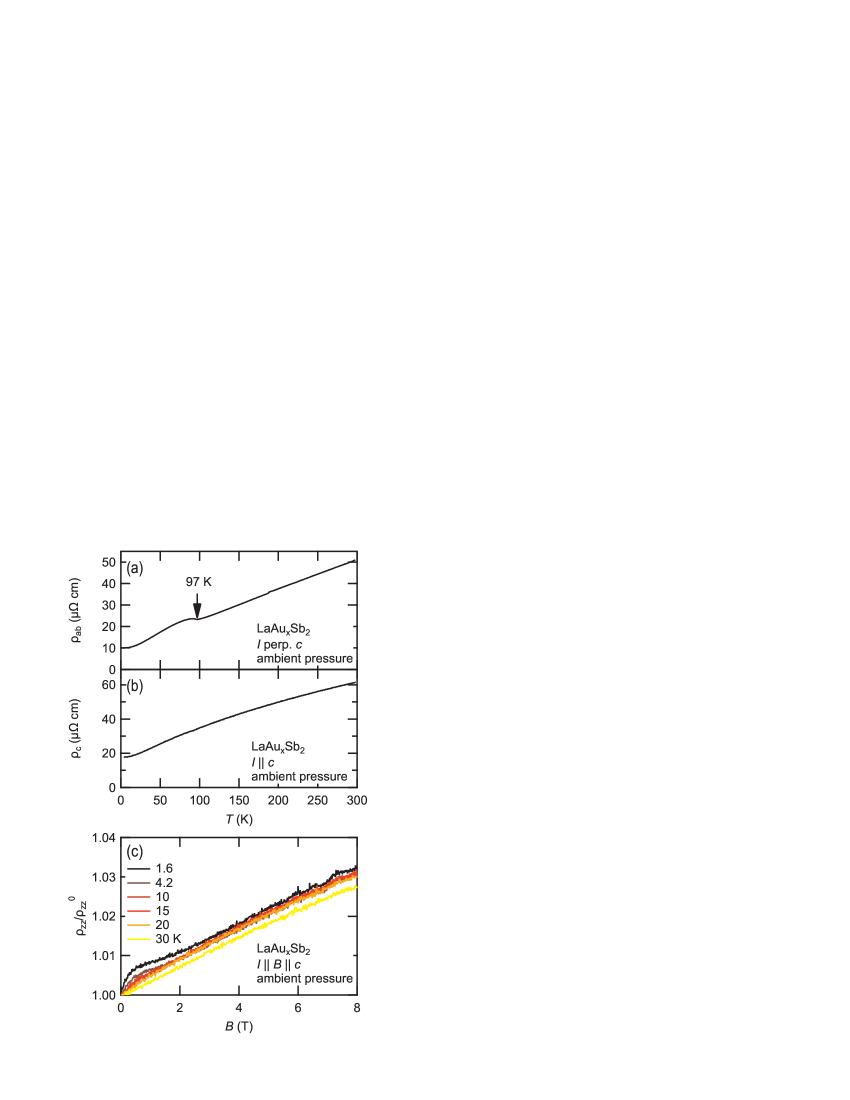
Appendix A Electrical transport properties of LaAuxSb2
Single crystals of LaAuxSb2 were obtained by Sb self-flux method Kuo et al. (2019). La (99.9%), Au (99.9%), and Sb (99.9999%) with a molar ratio of 1:2:20 were placed in an alumina crucible, and synthesized by the same process described in LaAgSb2. The temperature dependence of in-plane resistivity () at ambient pressure is shown in Fig. 13(a). We observed a hump-like anomaly at K, which is ascribed to the CDW transition with higher transition temperature. Based on Ref. Xiang et al. (2020), the amount is affected by initial molar ratio of the elements. Although we did not evaluate the precise amount of Au, of our sample seems to be close to the case of LaAu0.947Sb2 in Ref. Xiang et al. (2020). We could not identify the secondary CDW transition with lower transition temperature, possibly owing to the off-stoichiometric nature. Figure 13(b) shows the out-of-plane resistivity () at ambient pressure. The anomaly at is quite weak compared to , which is consistent with the previous report Xiang et al. (2020). Figure 13(c) shows the longitudinal magnetoresistivity normalized by zero-field value () at ambient pressure. The magnetoresistance effect is positive and quite small, which contrasts with the prominent negative magnetoresistance effect observed in LaAgSb2. We note that the sample size and geometry of electrical contact is almost identical to those in LaAgSb2.