Ripple-like instability in the simulated gel phase of finite size phosphocholine bilayers
Abstract
Atomistic molecular dynamics simulations have reached a degree of maturity that makes it possible to investigate the lipid polymorphism of model bilayers over a wide range of temperatures. However if both the fluid and tilted gel states are routinely obtained, the ripple phase of phosphatidylcholine lipid bilayers is still unsatifactorily described. Performing simulations of lipid bilayers made of different numbers of DPPC (1,2-dipalmitoylphosphatidylcholine) molecules ranging from 32 to 512, we demonstrate that the tilted gel phase expected below the pre-transition cannot be obtained for large systems ( 94 DPPC molecules) through common simulations settings or temperature treatments. Large systems are instead found in a disordered gel phase which display configurations, topography and energies reminiscent from the ripple phase observed between the pretransition and the main melting transition. We show how the state of the bilayers below the pretransition can be controlled and depends on thermal history and conditions of preparations. A mechanism for the observed topographic instability is suggested.
keywords:
Lipid bilayers , Molecular dynamics simulations , Phase transition1 Introduction
Lipid membranes are fundamental components of living organisms, for their pivotal role in the structure and the biochemistry of the cells. Their properties are for a large part the consequence of the organisation of the phospholipid molecules that compose them to a large extent. This organisation is best revealed by experimenting with artificial lipid bilayers [1, 2]. Through a perfect control of the molecular composition, an extended range of geometries and the possibility to insert membrane proteins and all sort of molecules, artificial bilayers have become a standard tool in modern biophysics [3, 4].
A striking property of pure phospholipids bilayers is to exhibit a number of thermodynamic transitions upon temperature changes, meaning that they can be found in several phases including a dense structured tilted gel phase at low temperature or a disordered fluid phase at higher temperature [3, 4, 5, 6]. Decades ago, a new phase have been identified in the most common sort of phospholipid, the phosphocholines (PC lipids) [7, 8, 3]. This new phase, specific to the PC lipids and called the ripple phase , is characterised by important corrugation along the bilayer and the alternation between interdigitated leaflets and non-interdigitated ones. The ripple phase is observed experimentally in pure bilayers of 1,2-dipalmitoylphosphatidylcholine (DMPC) between 16 and 24∘C, 1,2-dipalmitoylphosphatidylcholine (DPPC) between 34 and 41∘C and 1,2-distearoylphosphatidylcholine (DSPC) between 51 and 55∘C [9, 3].
This structure is sometimes presented as resulting from an alternation of gel and fluid lipid configurations [10]. There is no consensus regarding the cause[11, 12, 13, 14, 15], and the experimental structure is still subject to detailed investigations [16]. The interest in the ripple phase has grown over the years, and intense research in its nature are made jointly in experimental and numerical sciences [17, 18, 19].
In a recent paper, Khakbaz and Klauda investigated the phase transition of DMPC and DPPC [20]. They reported formation of a structure resembling the phase for DMPC bilayers in a range of temperature, while for DPPC only a transition from the tilted to the fluid phase was observed in bilayers composed of 70 lipids. More recently, we investigated the phase transition of DPPC bilayers using Machine Learning algorithms [21]. In membranes composed of 212 lipids, we observed a transition at 315 K from a fluid phase to a condensed disordered gel phase similar to the ripple phase that persists well below the pre-transition temperature of 307K and the tilted phase was never obtained directly from a quench of the state.
In this article, we provide a detailed analysis of the nature of the phase of DPPC simulated with the CHARMM36 force field below its melting temperature. We investigate the state of DPPC bilayers at 288 K, for different system sizes and different thermal routes. While the phase was observed for small systems, we found that a disordered gel phase, reminiscent from the phase, occurs in larger systems. In particular, we noticed the formation of corrugations whose amplitude increases with the system sizes investigated. By applying different thermal treatments, we characterize the metastability of DPPC and show that disordered gel is the preferred phase of simulated DPPC at 288K, in the thermodynamic limit.
2 Material & Methods
2.1 System Description
DPPC bilayers were obtained using the CHARMM-GUI online Membrane Builder [22, 23, 24, 25]. The size of the membrane was controlled via the number of lipids, ranging from 32 to 512 and with equal amounts of lipids in both leaflets. The bilayers were hydrated with water blocks of 10 nm on each side to prevent any interaction of the leaflets through the PBCs along the Z-axis. The exact composition of each system used is given in the Supplementary Informations.
The constructed system were minimized in energy using a steepest descent algorithm and equilibrated by running two NVT simulations at 288 K for 10 ps, with respectively a 0.001 ps and a 0.002 ps step; and two NPT simulations at 288 K and 1 bar, with a 0.002 ps step for respectively 100 ps and 1 ns.
2.2 Simulation Runs
Unless specified, the following conditions and parameters have been used for all simulations. All simulations were performed using GROMACS 2016.4 [26, 27] along with the CHARMM-36 all-atom force-field [28] (June 2015 version). The force field parameters for the lipid molecules were provided directly by CHARMM-GUI [29, 30].
All the molecular dynamics simulations used the leap-frog integration algorithm [31] with a time step set to 2 fs. The temperature was controlled during the simulation using a Nosé-Hoover thermostat [32, 33] with a correlation time of ps, and a Parrinello-Rahman semi-isotropic barostat [34, 35] set to 1 bar in all directions was applied to the system (correlation time ps, compressibility bar-1).
Lipid and water molecules were separately coupled to the thermostat. Following GROMACS recommendations for the CHARMM-36 all-atom force field, a Verlet cut-off scheme on grid cells was used with a distance of 1.2 nm, and non-bonded interactions cut-offs (Van der Waals and Coulombic) were also set to 1.2 nm. Fast smooth Particle-Mesh Ewald electrostatics was selected for handling the Coulombic interactions, with a grid spacing of 4 nm. A standard cut-off scheme with a force-switch smooth modifier at 1.0 nm was applied to the Van der Waals interactions. We did not account for long range energy and pressure corrections, and constrained all the hydrogen bonds of the system using the LINCS algorithm.
Molecular dynamics production were run for a minimum of 50 ns. When temperature treatments occurred, the systems were simulated for another 50 ns to allow for the bilayer to reach equilibrium. Regardless of the length of the simulation, the analysis were always performed on the last 25 ns of the simulations.
2.3 Analysis
The areas per lipid of the systems were measured using two different methods: (i) measure by projection of the bilayer in the XY plane of the box, noted , and (ii) measure by meshing of the water-lipid interfaces of each leaflet of the bilayer, written . The projected area per lipid was measured directly in Gromacs by measuring the area of the simulation box in the XY plane and by dividing it by the number of lipids per leaflet. The meshed area per lipid was computed using Ovito 2.9. To do so, the surface of the water blocks at the water-lipid interface was meshed using a probe sphere radius of 6 and a smoothing level of 30 after removing the lipid molecules. The area of the meshing was then divided by the total number of lipids in the bilayer.
The amplitude and the period of the corrugations were measured using the meshing of the water-lipid interface collected for the measurement of the area per lipid. The position of the vertices of the meshing were interpolated using SciPy [36] on a (200,200) uniform grid of the size of the simulation box, and the height of these 200200 points were analysed. This grid was directly used to generate the height maps. The amplitude of the corrugations, represented by the root mean square (RMS) height of the points on the grid, were calculated by subtracting the mean and then measuring the standard deviation of the height . The period of the corrugations were calculated by computing the azimuthal power spectrum density (PSD) of the points of the grid and determining the frequency of the highest peak of the PSD.
To measure the local chain tilt direction, the positions of the atoms of the tails of the lipids were extracted from the simulation files using MDAnalysis [37, 38]. The vectors from the first carbon atom of each tail to all the carbon atom of their respective tails were computed, before calculating the mean vector. The vector field was then created by binning the membrane in squares and averaging over time the tilt direction vectors found in each square . As a consequence, the vector field account for the average direction of the tails found at this location on the membrane over time and not to the average direction of a lipid over time.
The enthalpy of the systems were extracted from the simulation using directly the tool provided with Gromacs, gmx energy. The systems used strictly had the exact same number of atoms, for both lipids and water molecules, to prevent changes due to the system composition. The (tilted) gel - fluid phase transition enthalpy was measured using the method from [39]. Briefly, the total enthalpy of a system simulated at different temperatures over a wide range, here 283 to 358 K, was collected. The effects of the temperature increase on the enthalpy, besides any phase transition, were removed from the measurement by subtracting the affine baseline measured in each phase. The values were then divided by the total number of lipids in the system, and the transition enthalpy was calculated by integrating the difference between the fitted gel and fluid baseline over the range of temperature at which the transition occurs (here 308 to 318 K, accounting for Gromacs accuracy in setting a temperature). For the tilted to disordered gel phase transition, the enthalpy was measured by bringing the two systems at the exact same temperature. The difference in enthalpy measured between these two systems was then divided by the total number of lipids in the system.
3 Results
3.1 Corrugation formation and characterization
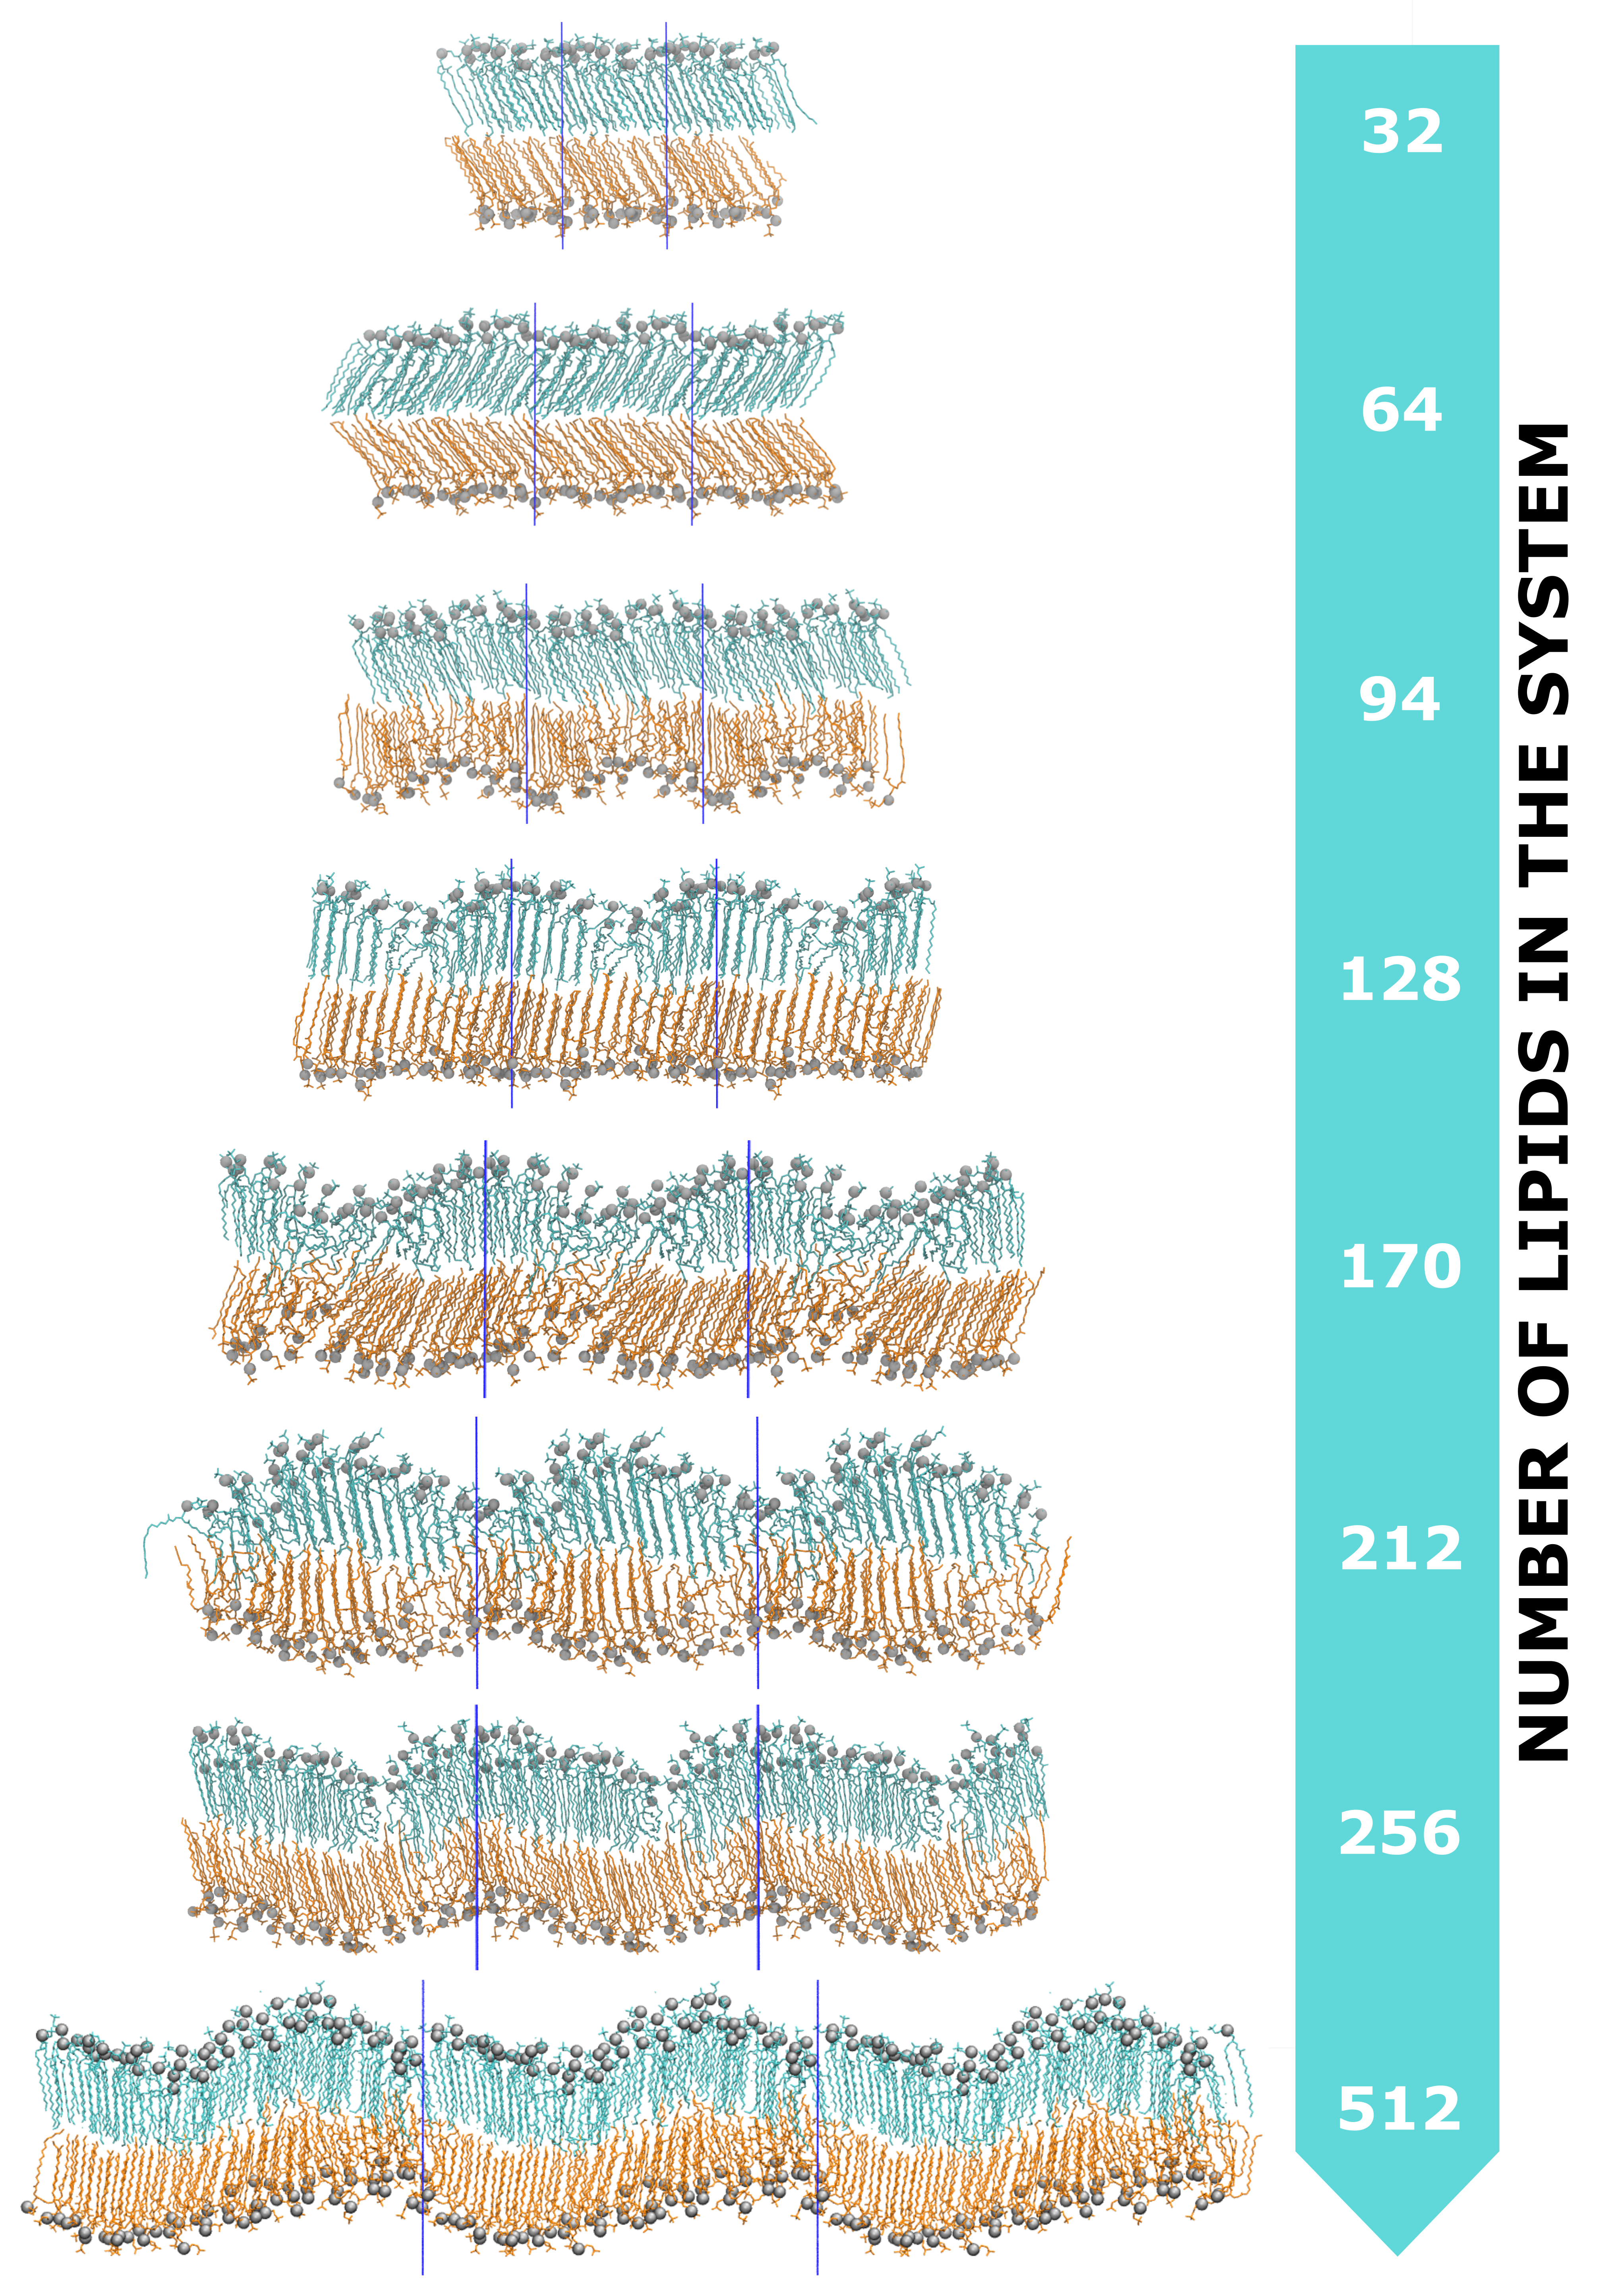
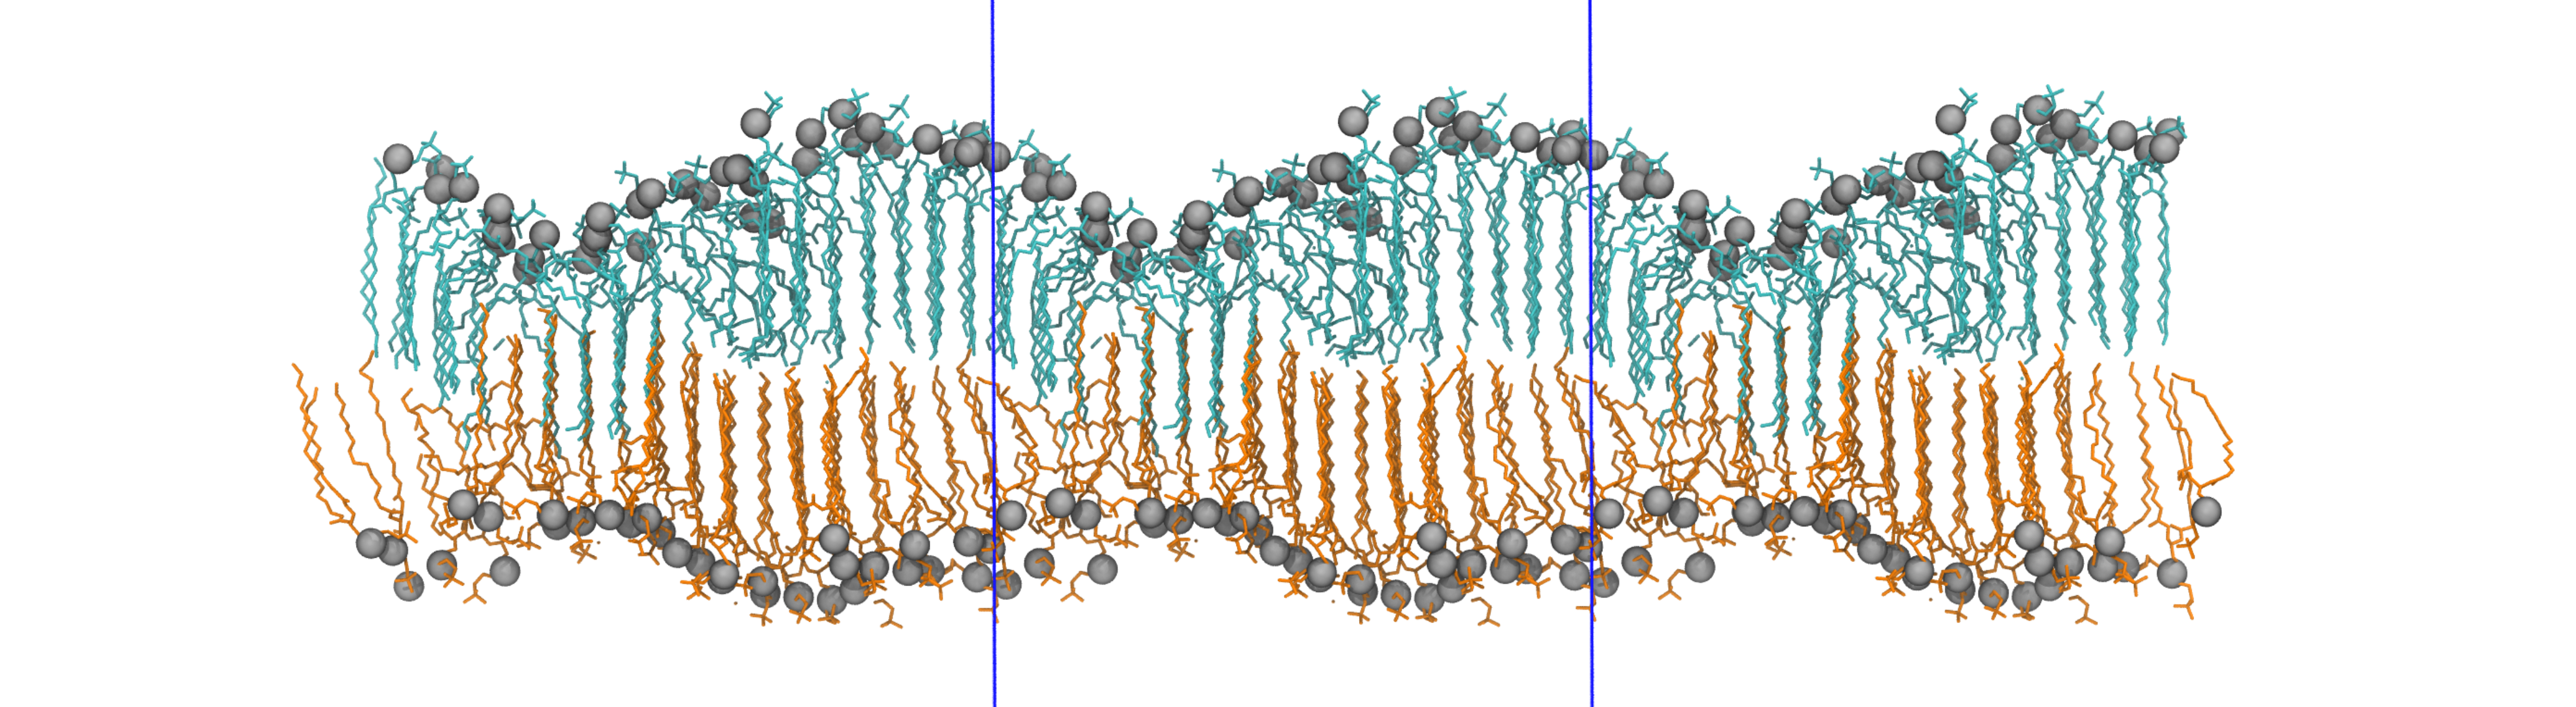
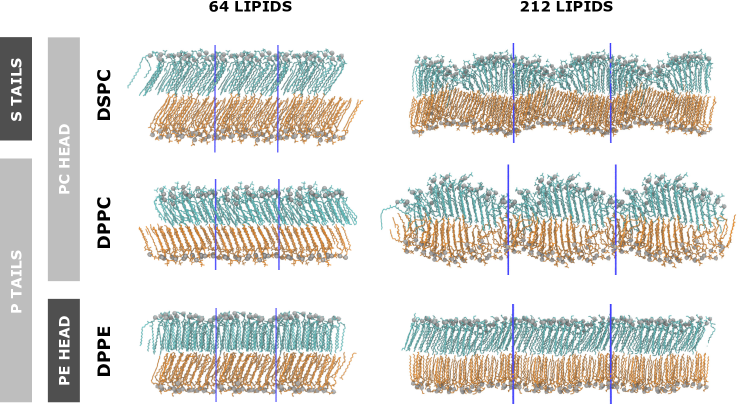
We considered DPPC bilayers prepared with CHARMM-GUI at temperature K whose size is ranging from 32 to 512 lipids. For small bilayers made of 64 lipids or less, we observed the formation of a smooth tilted gel phase, in agreement with the numerous experiments and simulations reported in the literature [40]. The geometry of these bilayers remained stable over time, even after a 50 ns simulation. When larger systems lipids were concerned, we noticed the formation of a corrugation deforming significantly the leaftlets (cf Figure 1).
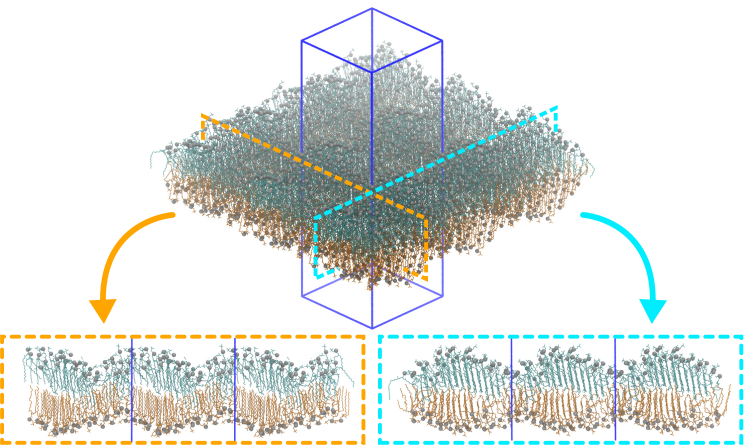
The corrugations takes place along both simulations box axis ( and ). As already observed and investigated in details for DMPC by Khakbaz and Klauda [20], the molecular configurations of the lipids do not appear uniform along the corrugations, and the typical stretched tails of the gel phase seem to turn into the typical disordered tail configurations of the fluid phase in the thin portions of the corrugations where interdigitation happens. These variations in configuration can be highlighted by computing and mapping the local segment order parameter of each atom of each lipid (cf Figure 2(a)).
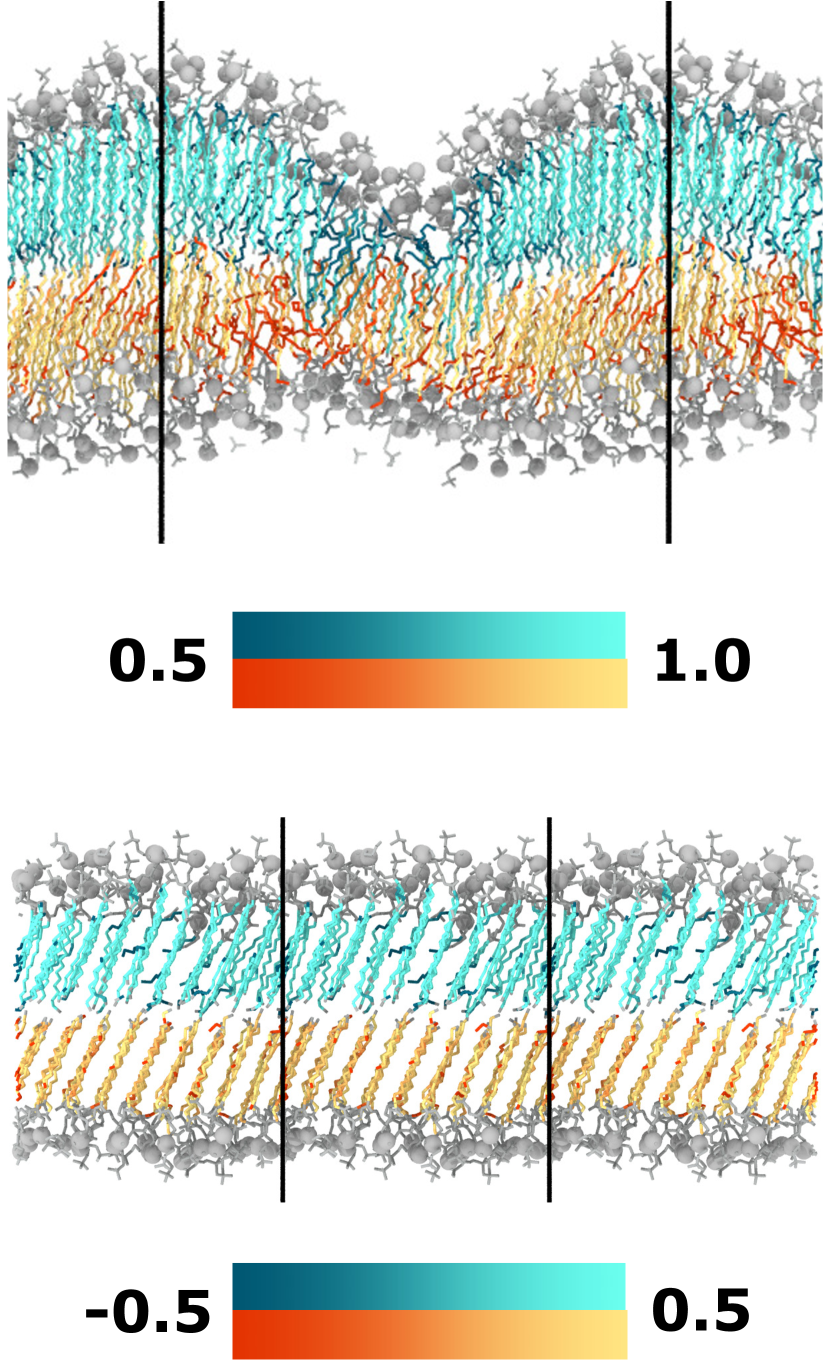
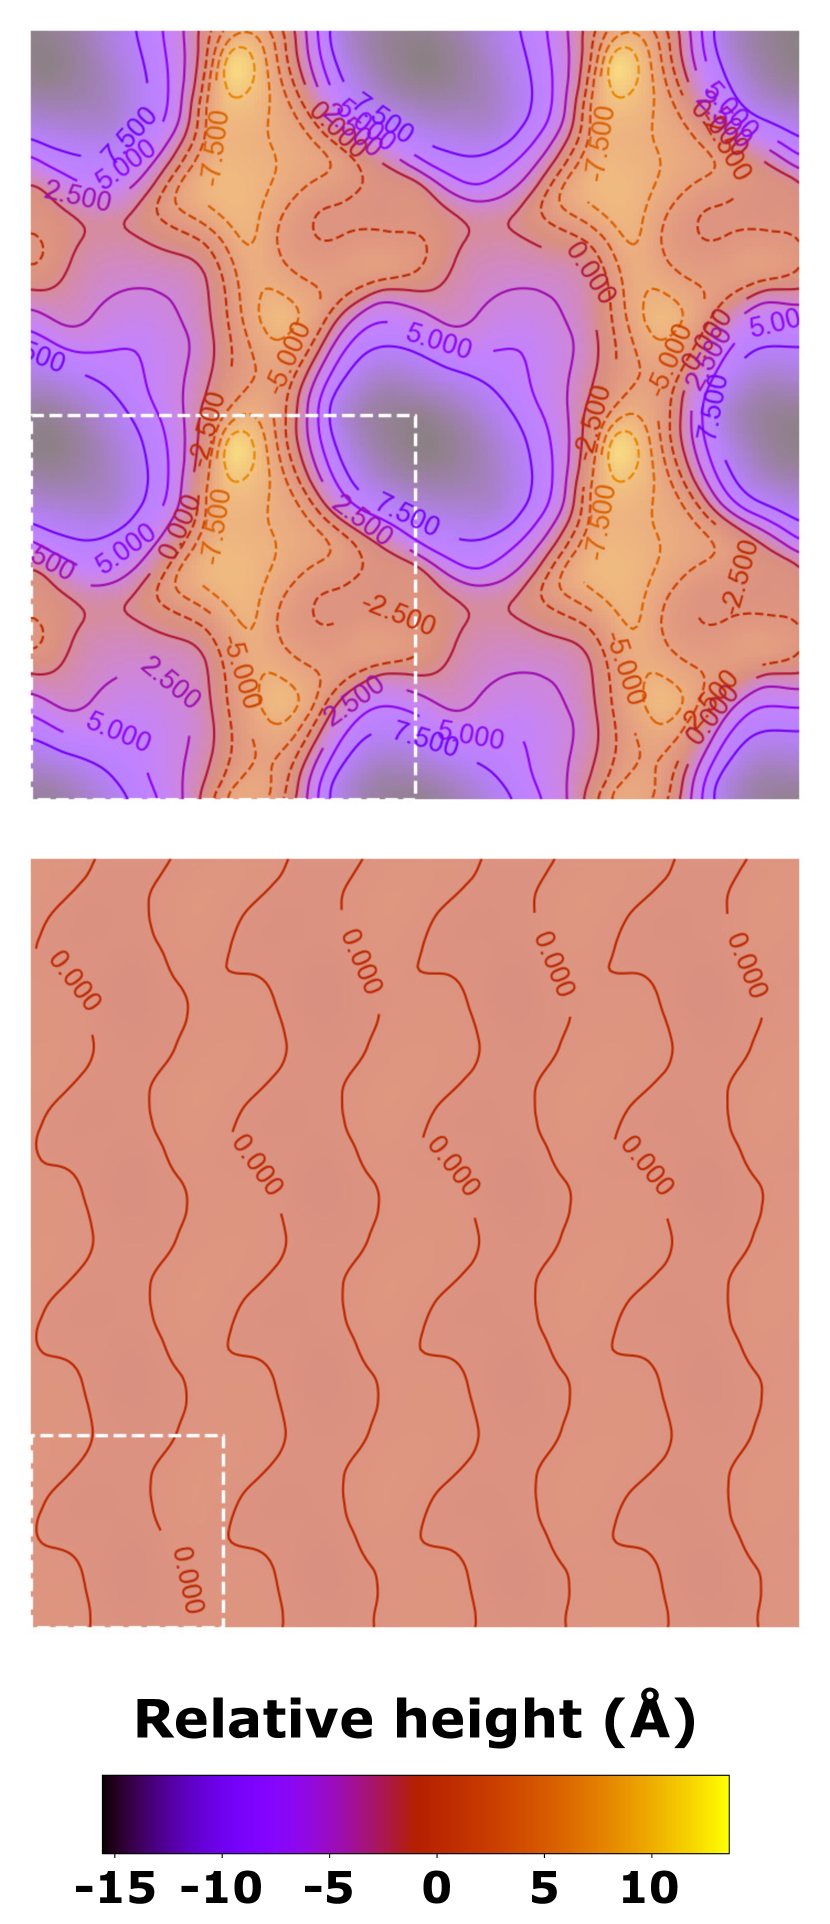
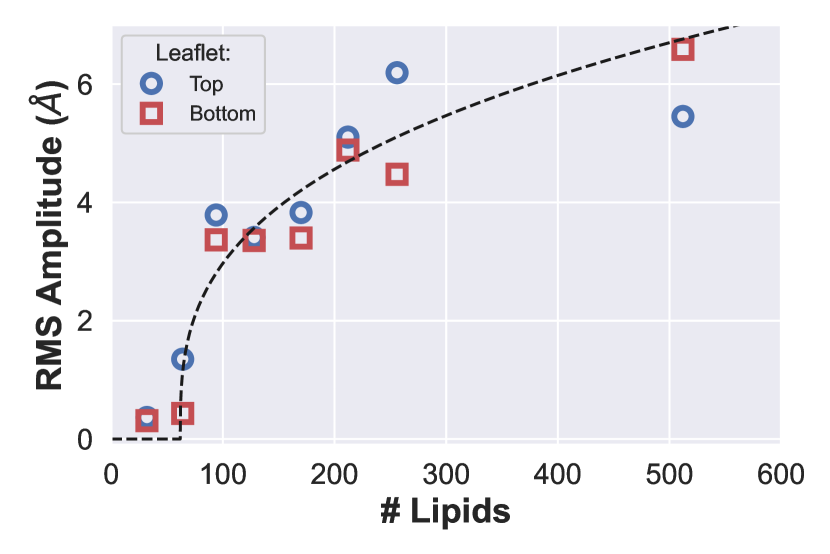
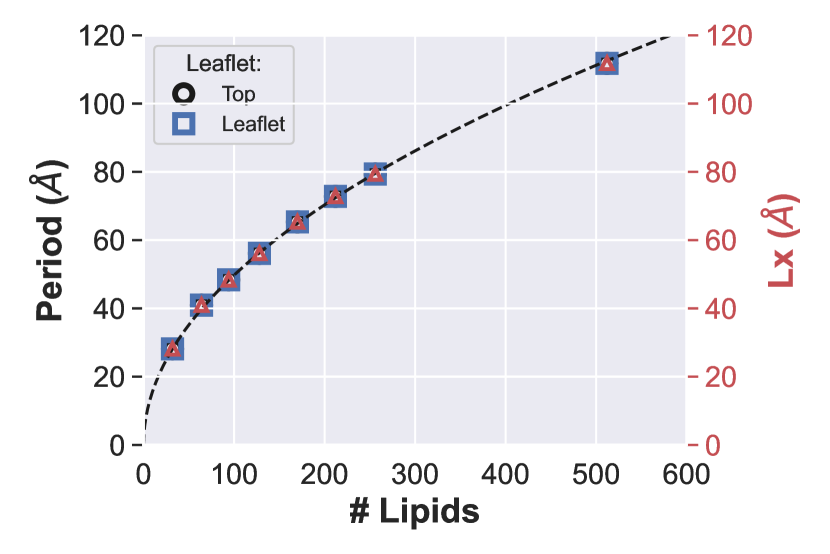
We systematically characterized the corrugation and probed its evolution with system size. To quantify it in a more specific way, we investigated the topographic elevation function for each leaflet (see Figure 2(b)) from which we defined the amplitude of the corrugation as the root mean square (RMS) height of the two water-lipid interfaces of the bilayers. The heights of the interfaces were obtained by meshing the water surface and removing the mean height of each leaflet. In these circumstances, is equal to the standard deviation of the heights . The leaflet corrugation amplitudes are identical for both leaflets even though cross section pictures might suggest otherwise (Figure 3(a)). The corrugation amplitude increases with system size but saturates for large systems (Figure 3(b)). The longitudinal period of the corrugations always coincide with the periodic boundary conditions (PBC, see Figure 3(c)). The power spectrum densities (PSD) used to measure the periods are given in the Supplementary Materials.
|
|
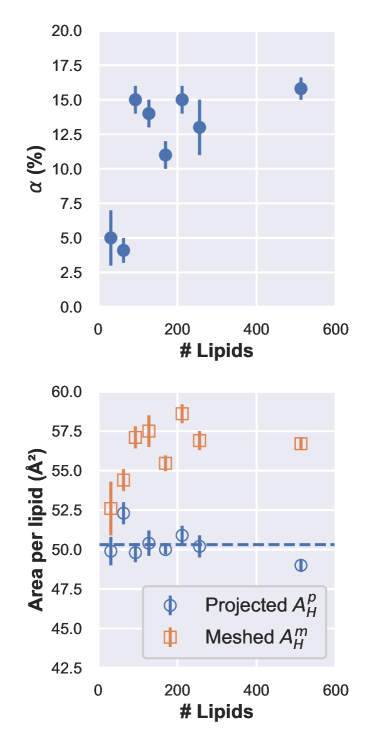
To better quantify the nature of the corrugation, we investigated the area per lipid using two methods: i) projection in the plane of the box, i.e the area of the box divided by the number of lipid; ii) meshing of the water lipid interface that enables the determination of the interfacial area . We found that the difference between interfacial and projected area per lipid
| (1) |
provides an excellent characterization of the corrugated phase (Figure 4). Indeed, is three times larger for corrugated systems () than for tilted ones (). The differentiation using usual methods such as the area per lipid or the tail order parameter achieved less significant results (cf Supplementary materials).
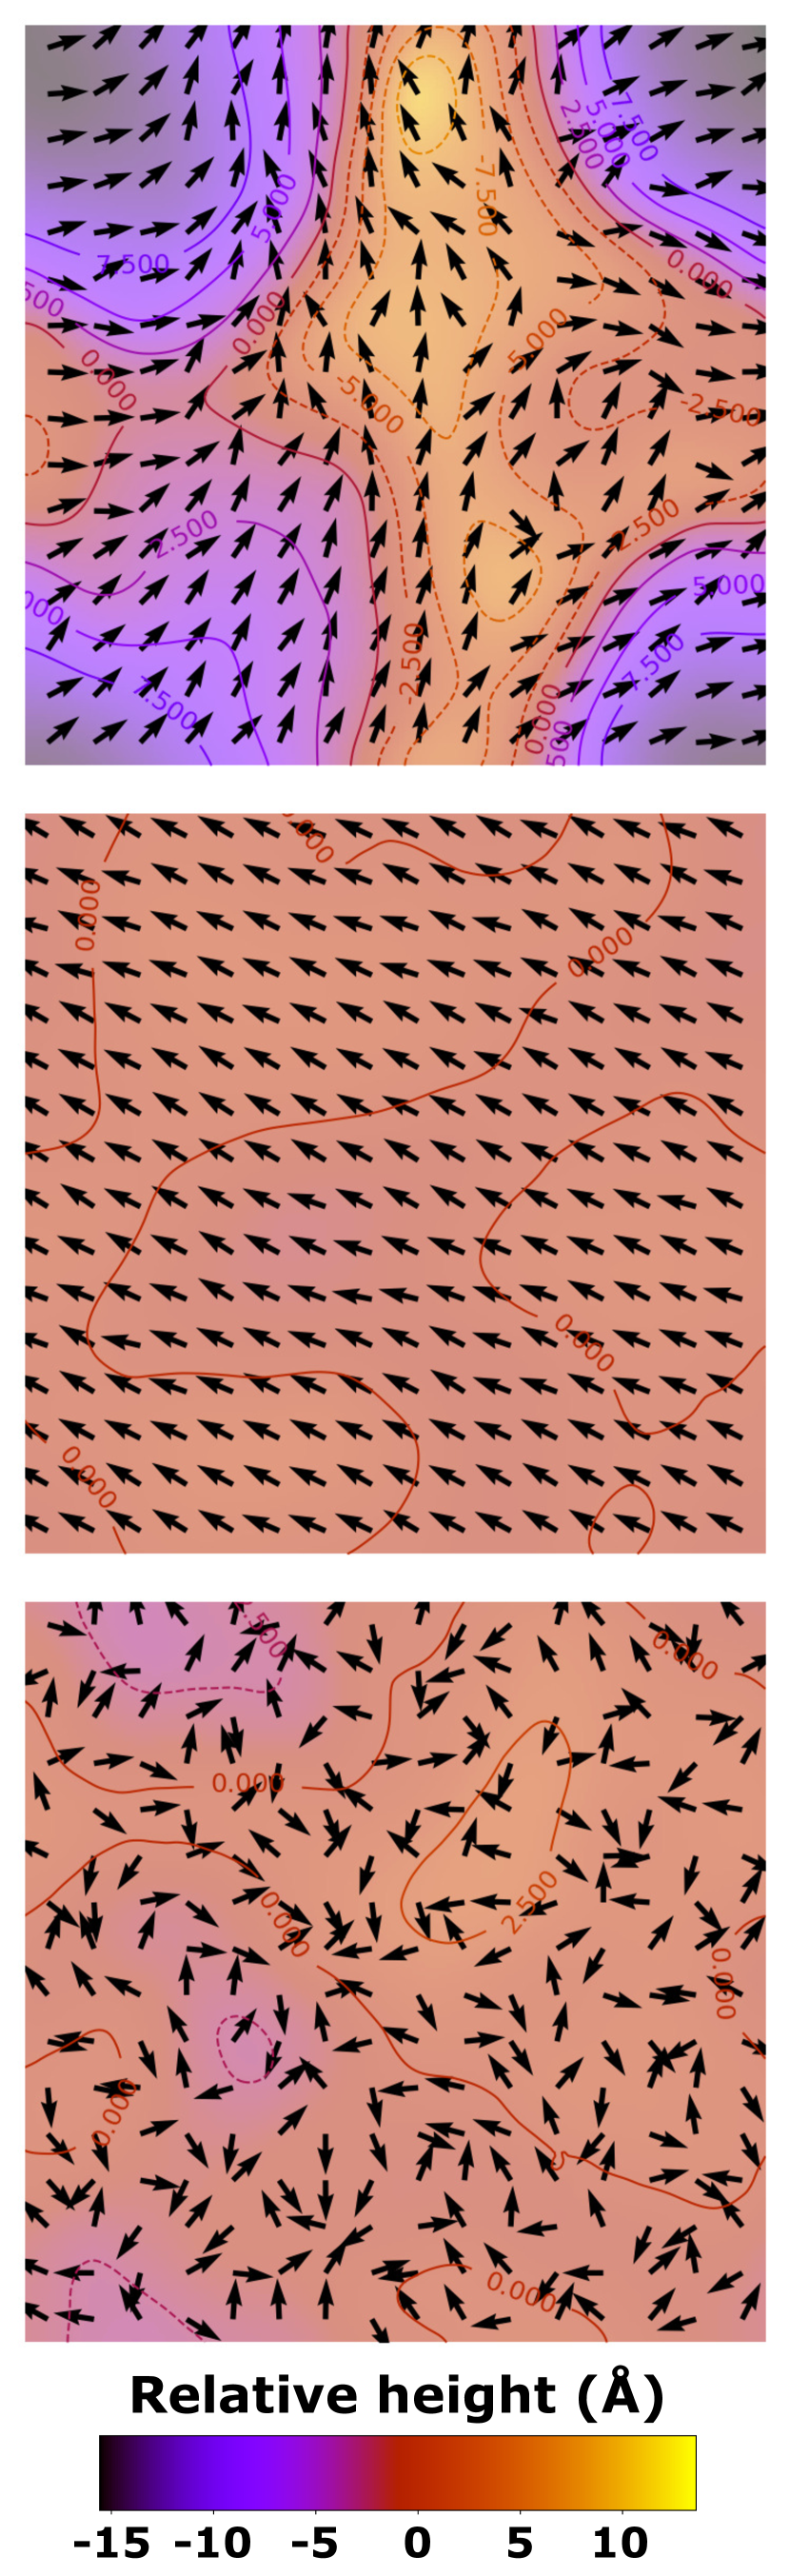
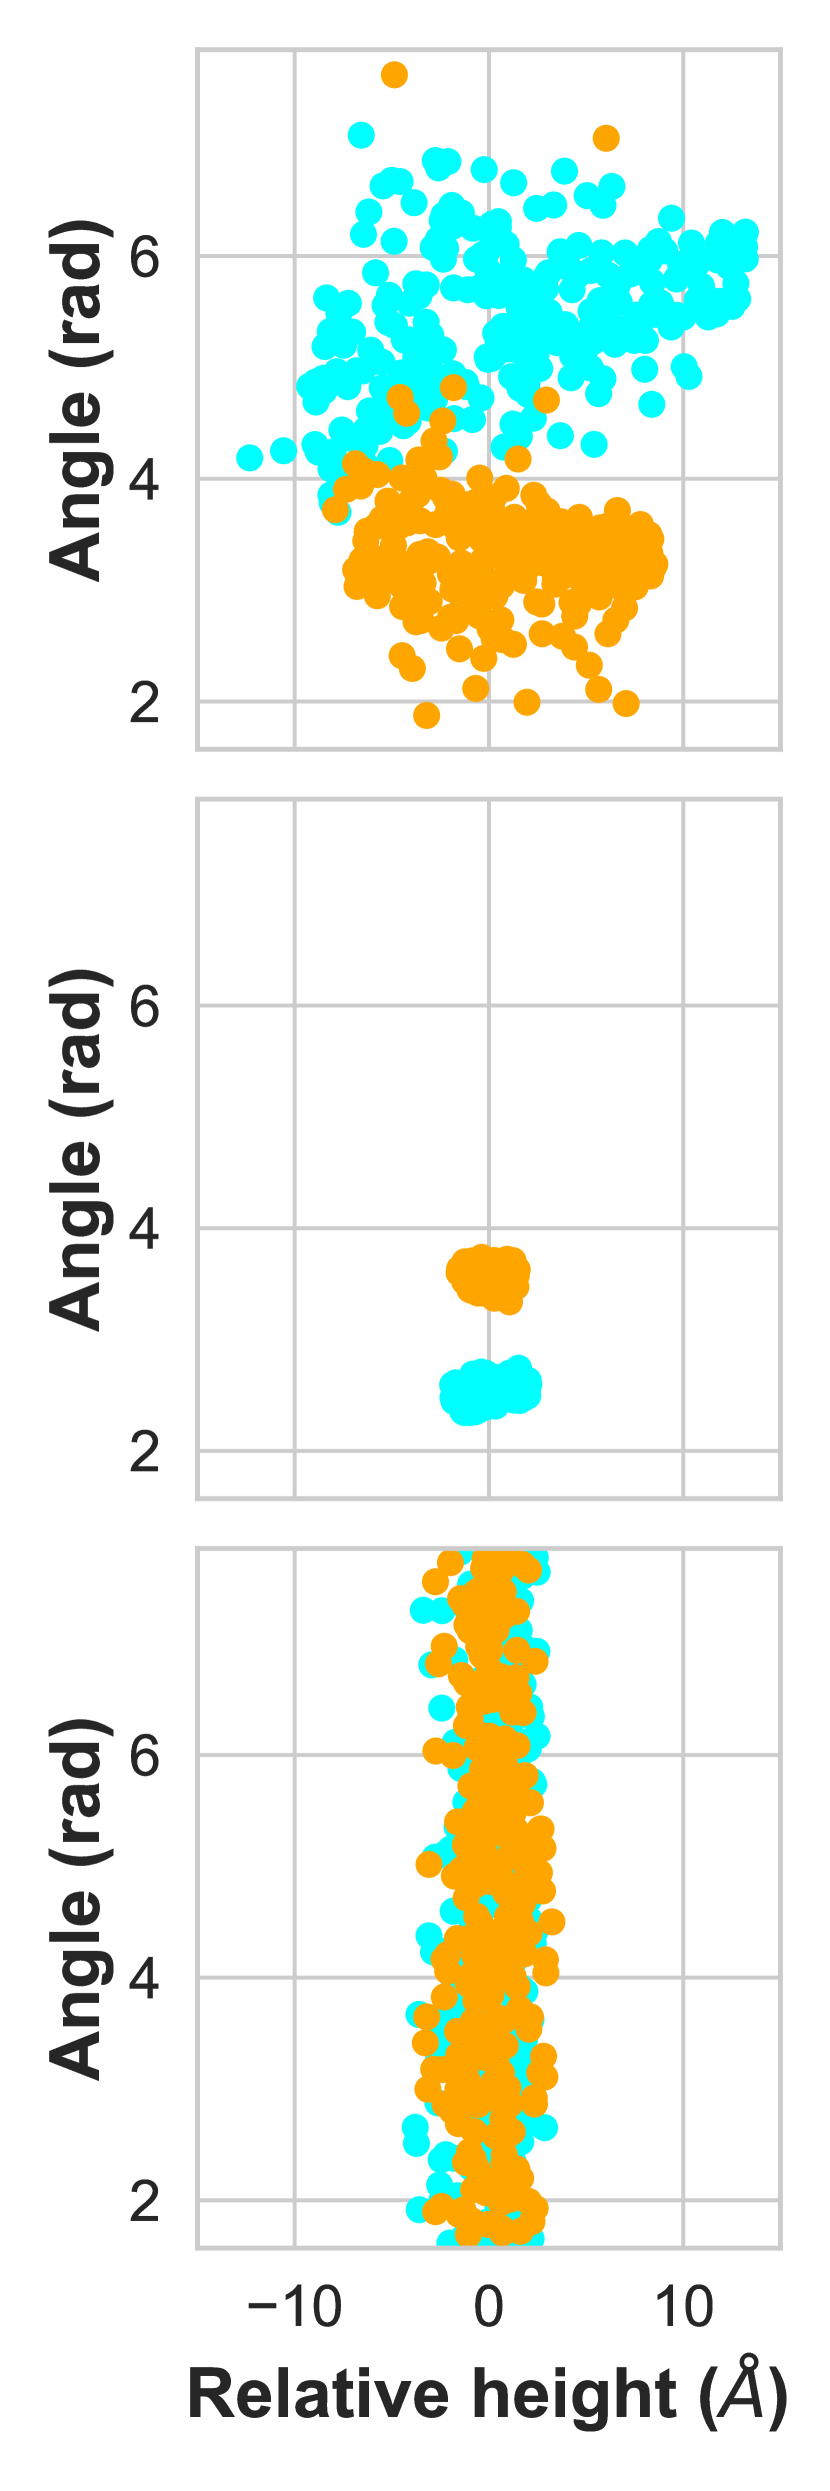
The local chain tilt direction in the XY plane was also determined and mapped (Figure 5(a)). As expected, tilts are uniform in the state and present a random short-range correlation in the fluid state. This was confirmed by the distribution of the angles with respect to the X-axis, as a function of the height on the leaflet. In the corrugated systems, the local chain tilts displays long-range variations. The angle distribution of the corrugated systems shows that small heights have random orientation similar to the fluid, while small heights are subject to less variations.
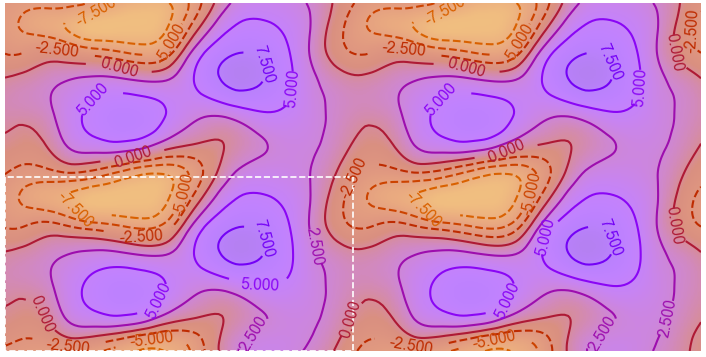
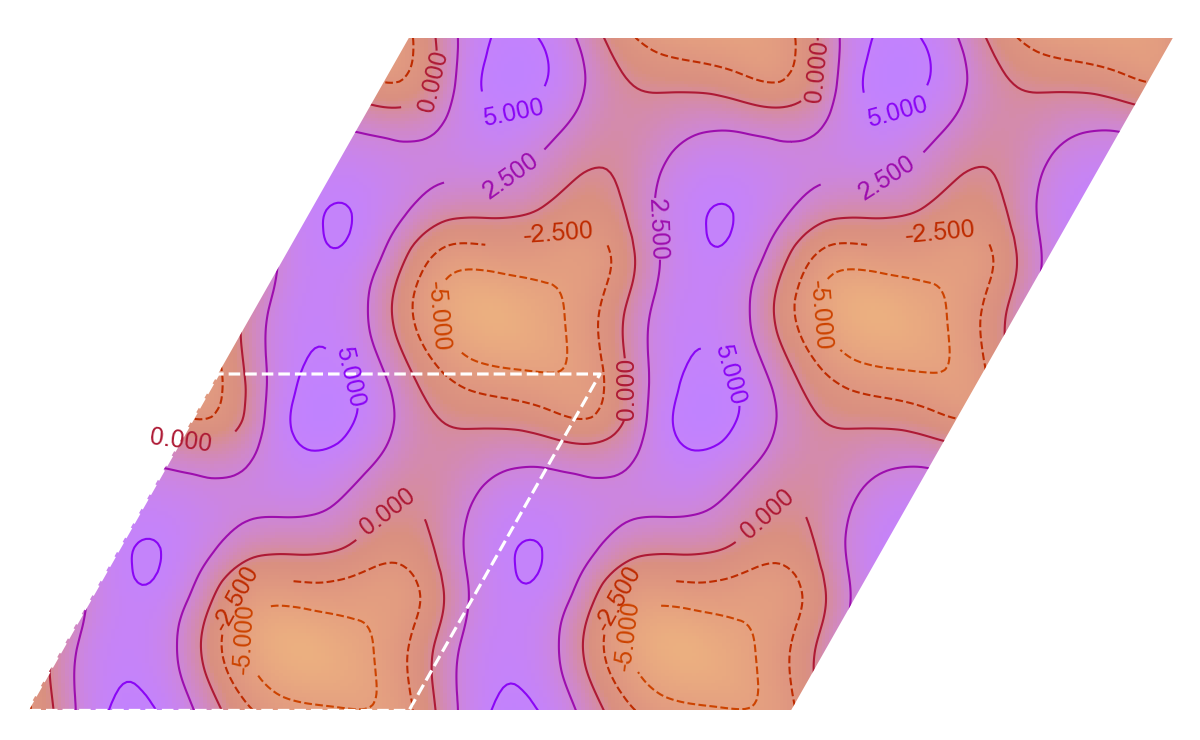
We also probed the sensitivity of the corrugation to modifications of space group. A simple change from cubic to rectangular simulation boxes with shows commensurate corrugations periods. Moreover we carry out simulations in hexagonal and monoclinic simulation boxes counting 128 lipids. Both of these systems were found to be corrugated, with modulation vectors directed along the PBC/crystallographic directions (Figure 6).
To release residual stress on the bilayer configuration that could have been brought by the semi-isotropic barostat, an anisotropic barostat was applied to the systems, with 1 bar and a bar-1 compressibility set along each axes, and the pressure crossed terms set to 0 for both pressure and compressibility. We found that releasing residual anisotropic stress did not modify the structure of the bilayers. After this simulation run, the system was still found in a corrugated state, as shown in Figure 7, with a relative area increase of 11.9 0.8% and a RMS corrugation amplitude of 4.89 Å comparable to the amplitude before the run (5.18 Å). We therefore conclude from this result that both tilted gel and corrugated states behave as a cohesive, solid state on the simulated time scales. They also display significant residual static stresses of 0.8 and 1.0 bars respectively in the x and the y directions. Based on these characterizations we refer to the corrugated state as the ”disordered gel state”, noted here , to make a clear distinction between these configurations and the ripple phase that has only be experimentally reported above the pre-transition temperature.
Finally one can wonder whether the appearance of the corrugation is restricted to DPPC or DMPC. To answer this question, we probed the effect of the tail and the head groups by considering the longer-tailed DSPC and the ethanolamine-based DPPE. As shown in Figure 8, the large DSPC systems were found in the disordered gel state while the DPPE systems remained in the expected homogeneous tilted gel state. The respective area differences of these systems are 12 1 and 5 1 %.
3.2 Influence of thermal history
The previous observations suggest that disordered and tilted gel states are two competing states whose appearance seem to be correlated to the system size for freshly thermalised systems generated with CHARMM-GUI. In what follows we probe the sensitivity of the stability of these phases to different routes of thermal treatments.
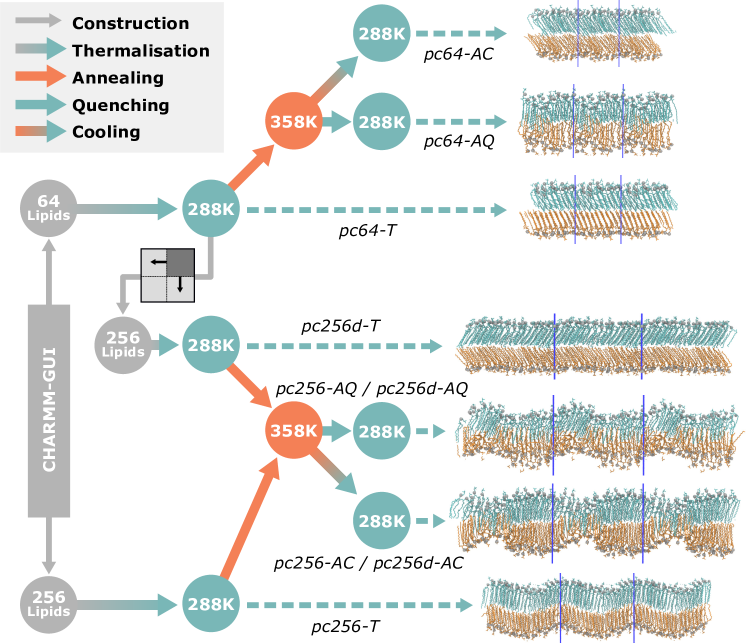
We focus our analysis on two system sizes: 64 lipids, which has been found in the phase, and 256 lipids which has been found in the . Both systems were subjected to the following thermal treatment: starting from , systems were annealed at K in the fluid phase. These systems are respectively named pc64-A and pc256-A, for annealing. They were then cooled down to K in two different ways: either with a brutal fast cooling, named here quenched, or with a slow gradual cooling of K/ns that we denote gentle cooling. The quenched systems are noted pc64-AQ and pc256-AQ (annealing-quenching), and the cooled systems called pc64-AC and pc256-AC (annealing-cooling).
We first notice that whatever the thermal history, large systems were always found in the disordered gel state as shown in Figure 9. Gentle cooling of small systems allowed them to recover the phase while quenching lead to phase. As in this latter case, either phases could be obtained depending on the thermal history, we conclude that the disordered gel is metastable with respect to the tilted gel for small systems. Furthermore, we can note that both the gently cooled and the quenched systems have a final projected area per lipid (respectively 50.1 0.7 and 50.8 0.8 Å2) close to the average projected area of 50 Å2 found for systems of all sizes, hence correcting the odd value of 52.3 Å2 found before temperature treatment (cf Figure 4).
As large systems of 256 lipids were never spontaneously found in the state, we decided to force them into this state by duplicating along both and directions the 64 system. The flat tilted duplicated system was found to be stable on the simulation time scale, suggesting that could be either stable or metastable in large systems too. The nature of the relevant stable thermodynamic phase for large systems remains an open question, while our simulations clearly favor the disordered gel state . Measurements of the difference in area can be found in the Supplementary Materials.
3.3 Thermodynamics of tilted and disordered states
Since the small systems made of 64 lipids can be prepared and controlled to reach all the observed phases, we used them to compare the energetic properties of the respective gel phase. Having in mind the idea of a complex underlying potential energy landscape composed of several minima located at different energy levels, we probe how far energetically the disordered gel phase stand from the tilted gel phase minimum. Therefore we performed an energy minimization using conjugate gradient to remove thermal fluctuations on the tilted and disordered gel configurations. We found kJ/mol, meaning that if both states are metastable, the tilted system is the most stable one. In addition, we also computed the difference in enthalpy between the disordered and the tilted thermalised gel phases. To this aim, we used the same initial states, after quenching or gentle cooling but without energy minimisation. Since the two systems share the same atomic compositions (same number of lipid, water molecules and constraints), the difference in enthalpy (kinetic and potential energy according to the force field, plus the contribution) at a given temperature should be characteristic of the enthalpy difference between the two states. We found an enthalpy difference of kJ/mol at K. This value is higher than the one reported experimentally for the calorimetric gel to ripple phase pretransition, 4.6 kJ/mol [4] but obtained at a higher temperature. We therefore repeated the measure after rising both systems at a temperature close to the pretransition temperature, namely 305 K, and then found a difference in enthalpy of kJ/mol now compatible with experimental measurements. It is essential to note here that, in order to obtain a disordered system configuration at 305 K, the system had first to be annealed at 375 K instead of 358 K, meaning that the difference in temperature required for quenching should be at least of 70 K in order to obtain the phase (see Supplementary materials).
The enthalpy of the transition was also measured in our small systems. This was performed by simulating the 64 DPPC system at temperatures ranging from 283 to 358 K and by removing the change in enthalpy due to the change in temperature (data shown in Supplementary Materials). The transition enthalpy was found equal to 27.3 kJ/mol, which is also comparable with the experimental reported values circa 32.2 kJ/mol [4]. We can conclude that despite the approximations, and the absence of quantum corrections to the bond vibrations contributions, the CHARMM36 force field thermodynamic predictions seem in good agreement with experimental observations.
4 Discussion
A careful inspection of the corrugations shows that the topographic modulation is imposed by the periodicity of the simulation box. The corrugation shows finite system size dependence, as its amplitude increases up to sizes of the order of nm where the modulation saturates to a value of 7 1 Å. Assuming a sine-like corrugation, this maximum RMS amplitude measured can be converted into a peak-to-peak amplitude of 2.0 0.2 nm similar to the previously published values of 2.4 nm for the DPPC or even 1.8 nm in DMPC bilayers [41, 16]. The saturation of the corrugation amplitude is expected, given that it can only reach a fraction of the total membrane thickness. The associated lateral length 8 nm can therefore be considered as a lower bound of the instability characteristic longitudinal length scale.
We believe that the relative difference between the interfacial area and the projected one, , introduced in equation (1) can be taken as a relevant order parameter for the transition between the and the disordered gel phases . The latter being reminiscent from ripple phase, could be seen as a critical parameter to investigate the existence of the ripple phase and discriminate it from the tilted gel or from the fluid phase.
However, unlike experiments, the numerical instability occurs along two orthogonal directions, or along the hexagonal axes. Non-square boxes fail to select only one modulation direction. We nevertheless think that the numerical corrugation instability is related to the experimental ripple instability, as also suggested by the dependence of the presence of corrugation to the chemical nature of the heads and tails of the lipids. Indeed, experiments have shown that the ripple phase is specific from the phosphocholine (PC) lipids [40, 42].
Another striking observation is the insensitivity of large systems (256 lipids) to thermal treatment which have been systematically ended in the disordered gel state. On the opposite small systems can alternate between both phases. However, when thermalised at low temperatures from CHARMM-GUI or slowly quenched, they end up preferentially into the tilted gel state, suggesting that in the range of temperatures investigated the state is thermodynamically favored. By contrast the state is never selected spontaneously by larger systems. For the latter, MD suggests that the disordered gel state is the most preferred state for all temperatures below melting. Metastability and kinetic effects are certainly significant and may hide to true nature of the stable phase.
Assuming that the difference between tilted and disordered gels has something to do with the pretransition, we found an enthalpy difference 3 times larger than the premelting latent heat at 288K, and of the same order of magnitude at 305K, close to the observed experimental transition. This points towards the relevance of disordered gel state as a ripple state analogue. Moreover the higher enthalpy of the disordered gel with respect to the tilted gel is consistent with a sequence of transitions as temperature is increased.
The reason of the outcome of a ripple instability below the melting temperature is nothing but obvious. Our simulations point out to a competition between an homogeneous tilted state and an inhomogeneous corrugated state. The transition between these states is discontinuous. The corrugated state is not very tilted, and partially melted, or disordered, and interdigitated. We suggest now a possible mechanism explaining the observed situation. The tilted phase can be understood as the result of a frustration between lipid headgroups which try to increase their exposure to water in the interface region, lipid chains which try to reach an optimal packing density as a result of cohesive forces, and chain stiffness for which the introduction of gauche dihedral angles is unfavorable at low temperatures. Tilt allows lipid to optimize simultaneously those three constraints. On the other hand, melting a lipid chain enables the release of the constraint acting on the chain stiffness, and makes it possible to increase the hydration free-energy by reducing the membrane thickness. Below melting temperature, thermodynamics makes it unfavorable to melt all the lipid molecules. However, some local disordering of the lipids may still be favorable, increasing the hydration of the headgroups without need of spending too much energy in melting the chains.
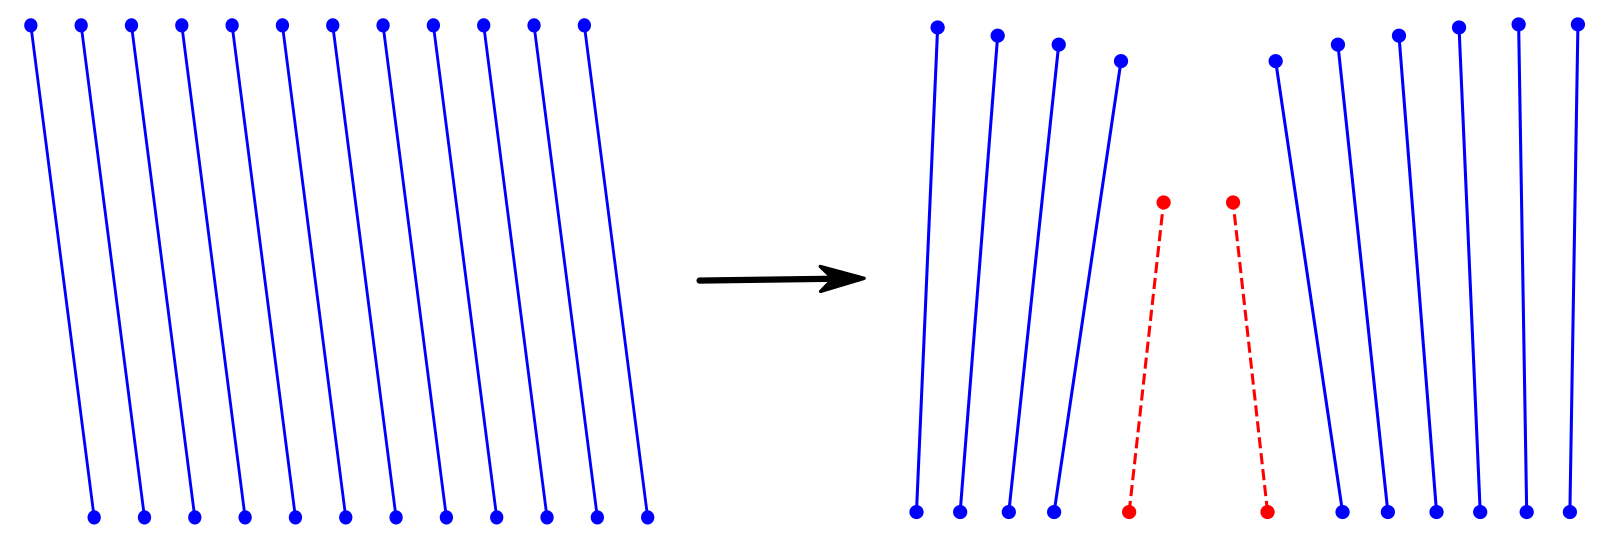
Based upon those considerations, we designed a simple one dimensional lipid chain model that supports the idea that in an temperature range just below melting, the homogeneous tilted state energetically unstable with respect to a local corrugation of the bilayer, see Figure 10. Details of the parameterisation of the model and further results are presented in the Supplementary Information section. We conclude that the thickness modulation might indeed be caused by a subtle interplay between headgroup hydration, hydrophobic chain packing, trans-gauche isomerisation and tilt elasticity energy terms.
5 Conclusion
We have successfully demonstrated in this work how the size of the simulation box influences the ripple-like instability in a PC membrane simulated with the Charmm36 force field at low temperature, where it is usually expected to be in the tilted gel phase. This unexpected organisation, which we called the disordered gel phase , does not appear in small systems, which is consistent with the results from Khakbaz and Klauda [20] as well as with our results in a previously published paper [21]. The energy and geometry analyses demonstrated that this disordered gel phase has a lot in common with the phase. Furthermore, this instability was not observed with PE lipids, in agreement with experimental findings. For small systems, we found ways of preparing the system in either tilted gel or disordered gel states by acting on the thermal treatment. More work is needed to determine whether the Charmm36 force-field can describe a one-dimensional spatial thickness modulation, with the right periodicity, and at which temperatures. Our work suggests that simulations will have to be guided to the desired structure. Finally, we conclude that the ripple instability looks like a generic mechanism adopted by the phosphatidylcholines lipids to increase the headgroup hydration while still satisfying the packing constraints, at the expense of a mild cost in disordering/melting a small fraction of the chains.
Acknowledgements
V. W. warmly thanks T.E. de Oliveira for helping with simulations set-up. A.G. acknowledges partial support from the Investissements d’Avenir program “Développement de l’Économie Numérique” through the SMICE project. The authors gratefully acknowledge support from the high performance cluster (HPC) Equip@Meso from the University of Strasbourg, through grants no. G2019A131C and G2020A140C.
References
- Mouritsen [2005] O. G. Mouritsen, Life-as a matter of fat: the emerging science of lipidomics, Springer, 2005.
- Dimova and Marques [2019] R. Dimova, C. M. Marques (Eds.), The Giant Vesicle Book, 1st ed., CRC Press, Taylor and Francis, 2019.
- Marsh [2013] D. Marsh, Handbook of Lipid Bilayers, 2nd ed., CRC Press, Boca Raton, 2013.
- Cevc and Marsh [1987] G. Cevc, D. Marsh, Phospholipid Bilayers. Physical Principles and Models, John Wiley & Sons, New-York, 1987.
- Mabrey and Sturtevant [1976] S. Mabrey, J. M. Sturtevant, Investigation of phase transitions in lipids and lipid mixtures by high sensitivity differential scanning calorimetry, Proceedings of the Natural Academy of Sciences USA 73 (1976) 3862–3866.
- Heimburg [2007] T. Heimburg, Thermal Biophysics of Membranes, Wiley-VCH, 2007.
- Tardieu et al. [1973] A. Tardieu, V. Luzzati, F. C. Reman, Structure and polymorphism of the hydrocarbon chains of lipids: A study of lecithin-water phases, Journal of Molecular Biology 75 (1973) 719–733.
- Sun et al. [1996] W. J. Sun, S. Tristram-Nagle, R. M. Suter, J. F. Nagle, Structure of the ripple phase in lecithin bilayers., Proceedings of the National Academy of Sciences 93 (1996) 7008–7012. doi:10.1073/pnas.93.14.7008.
- Lewis et al. [1987] R. N. A. H. Lewis, N. Mak, R. N. McElhaney, A differential scanning calorimetric study of the thermotropic phase behavior of model membranes composed of phosphatidylcholines containing linear saturated fatty acyl chains, Biochemistry 26 (1987) 6118–6126. doi:10.1021/bi00393a026.
- Heimburg [2000] T. Heimburg, A model for the lipid pretransition: coupling of ripple formation with the chain-melting transition, Biophysical Journal 78 (2000) 1154–1165.
- Doniach [1979] S. Doniach, A thermodynamic model for the monoclinic (ripple) phase of hydrated phospholipid bilayers, The Journal of Chemical Physics 70 (1979) 4587–4596. doi:10.1063/1.437292.
- Lubensky and MacKintosh [1993] T. C. Lubensky, F. C. MacKintosh, Theory of “ripple” phases of lipid bilayers, Physical Review Letters 71 (1993) 1565–1568. doi:10.1103/physrevlett.71.1565.
- Fournier [1998] J.-B. Fournier, Coupling between membrane tilt-difference and dilation: A new “ripple” instability and multiple crystalline inclusions phases, Europhysics Letters (EPL) 43 (1998) 725–730. doi:10.1209/epl/i1998-00424-4.
- Misbah et al. [1998] C. Misbah, J. Duplat, B. Houchmandzadeh, Transition to ripple phases in hydrated amphiphiles, Physical Review Letters 80 (1998) 4598–4601. doi:10.1103/physrevlett.80.4598.
- Sengupta et al. [2001] K. Sengupta, V. A. Raghunathan, Y. Hatwalne, Role of tilt order in the asymmetric ripple phase of phospholipid bilayers, Physical Review Letters 87 (2001). doi:10.1103/physrevlett.87.055705.
- Akabori and Nagle [2015] K. Akabori, J. F. Nagle, Structure of the dmpc lipid bilayer ripple phase, Soft Matter 11 (2015) 918–926.
- de Vries et al. [2005] A. H. de Vries, S. Yefimov, A. E. Mark, S. J. Marrink, Molecular structure of the lecithin ripple phase, Proceedings of the National Academy of Sciences 102 (2005) 5392–5396. doi:10.1073/pnas.0408249102.
- Lenz and Schmid [2007] O. Lenz, F. Schmid, Structure of symmetric and asymmetric ”ripple” phases in lipid bilayers, Physical Review Letters 98 (2007).
- Debnath et al. [2014] A. Debnath, F. M. Thakkar, V. Kumaran, P. K. Maiti, K. G. Ayappa, Laterally structured ripple and square phases with one and two dimensional thickness modulations in a model bilayer system, Soft Matter 10 (2014) 7630–7637.
- Khakbaz and Klauda [2018] P. Khakbaz, J. B. Klauda, Investigation of phase transitions of saturated phosphocholine lipid bilayers via molecular dynamics simulations, Biochimica et Biophysica Acta (BBA) - Biomembranes 1860 (2018) 1489 – 1501.
- Walter et al. [2020] V. Walter, C. Ruscher, C. M. Marques, O. Benzerara, F. Thalmann, A machine learning study of the two states model for lipid bilayer phase transitions, Phys. Chem. Chem. Phys. (2020) –.
- Jo et al. [2007] S. Jo, T. Kim, W. Im, Automated builder and database of protein/membrane complexes for molecular dynamics simulations, PLoS ONE 2 (2007) 880.
- Jo et al. [2008] S. Jo, T. Kim, V. G. Iyer, W. Im, Charmm-gui: A web-based graphical user interface for charmm, Journal of Computational Chemistry 29 (2008) 1859–1865.
- Jo et al. [2009] S. Jo, J. B. Lim, J. B. Klauda, W. Im, Charmm-gui membrane builder for mixed bilayers and its application to yeast membranes, Biophysical Journal 97 (2009) 50–58.
- Wu et al. [2014] E. L. Wu, X. Cheng, S. Jo, H. Rui, H. K. Song, E. M. Davila-Contreras, Y. Qi, J. Lee, V. Monje-Galvan, R. M. Venable, J. B. Klauda, W. Im, Charmm-gui membrane builder toward realistic biological membrane simulations, Journal of Chemical Theory and Computation 35 (2014) 1997–2004.
- Berendsen et al. [1995] H. Berendsen, D. van der Spoel, R. van Drunen, Gromacs: A message-passing parallel molecular dynamics implementation, Computer Physics Communications (1995).
- Abraham et al. [2015] M. J. Abraham, T. Murtola, R. Schulz, S. Páll, J. C. Smith, B. Hess, E. Lindahl, Gromacs: High performance molecular simulations through multi-level parallelism from laptops to supercomputers, SoftwareX (2015).
- Best et al. [2012] R. B. Best, X. Zhu, J. Shim, P. E. M. Lopes, J. Mittal, M. Feig, A. D. MacKerell Jr., Optimization of the additive charmm all-atom protein force field targeting improved sampling of the backbone phi, psi and side-chain khi1 and khi2 dihedral angles, Journal of Chemical Theory and Computation 8 (2012) 3257–3273.
- Brooks et al. [2009] B. R. Brooks, C. L. Brooks III, A. D. MacKerell Jr, L. Nilsson, R. J. Petrella, B. Roux, Y. Won, G. Archontis, C. Bartels, S. Boresch, A. Caflisch, L. Caves, Q. Cui, A. R. Dinner, M. Feig, S. Fischer, J. Gao, M. Hodoscek, W. Im, K. Kuczera, T. Lazaridis, J. Ma, V. Ovchinnikov, E. Paci, R. W. Pastor, C. B. Post, J. Z. Pu, M. Schaefer, B. Tidor, R. M. Venable, H. L. Woodcock, X. Wu, W. Yang, D. M. York, M. Karplus, Charmm: The biomolecular simulation program, Journal of Computational Chemistry 30 (2009) 1545–1614.
- Lee et al. [2016] J. Lee, X. Cheng, J. M. Swails, M. S. Yeom, P. K. Eastman, J. A. Lemkul, S. Wei, J. Buckner, J. C. Jeong, Y. Qi, S. Jo, V. S. Pande, D. A. Case, C. L. Brooks III, A. D. MacKerell Jr, J. B. Klauda, W. Im, Charmm-gui input generator for namd, gromacs, amber, openmm, and charmm/openmm simulations using the charmm36 additive force field, Journal of Chemical Theory and Computation 12 (2016) 405–413.
- Hockney et al. [1974] R. W. Hockney, S. P. Goel, J. W. Eastwood, Quiet high-resolution computer models of a plasma, Journal of Computational Physics 14 (1974) 148–158.
- Nosé [1984] S. Nosé, A molecular dynamics method for simulations in the canonical ensemble, Molecular Physics 52 (1984) 255–268.
- Hoover [1985] W. G. Hoover, Canonical dynamics: Equilibrium phase-space distributions, Physical Review A 31 (1985) 1695.
- Nose and Klein [1983] S. Nose, M. L. Klein, Constant pressure molecular dynamics for molecular systems, Molecular Physics 50 (1983) 1055–1076.
- Parinello and Rahman [1998] M. Parinello, A. Rahman, Polymorphic transitions in single crystals: A new molecular dynamics method, Journal of Applied Physics 52 (1998) 7182.
- Virtanen et al. [2020] P. Virtanen, R. Gommers, T. E. Oliphant, M. Haberland, T. Reddy, D. Cournapeau, E. Burovski, P. Peterson, W. Weckesser, J. Bright, S. J. van der Walt, M. Brett, J. Wilson, K. Jarrod Millman, N. Mayorov, A. R. J. Nelson, E. Jones, R. Kern, E. Larson, C. Carey, İ. Polat, Y. Feng, E. W. Moore, J. VanderPlas, D. Laxalde, J. Perktold, R. Cimrman, I. Henriksen, E. A. Quintero, C. R. Harris, A. M. Archibald, A. H. Ribeiro, F. Pedregosa, P. van Mulbregt, S. . . Contributors, Scipy 1.0: Fundamental algorithms for scientific computing in python, Nature Methods 17 (2020) 261–272.
- Michaud‐Agrawal et al. [2011] N. Michaud‐Agrawal, E. J. Denning, T. B. Woolf, O. Beckstein, Mdanalysis: A toolkit for the analysis of molecular dynamics simulations, Journal of Computational Chemistry 32 (2011) 2319–2327.
- Gowers et al. [2016] R. J. Gowers, M. Linke, J. Barnoud, T. J. E. Reddy, M. N. Melo, S. L. Seyler, D. L. Dotson, J. Domanski, S. Buchoux, I. M. Kenney, O. Beckstein, Mdanalysis: A python package for the rapid analysis of molecular dynamics simulations, Proceedings of the 15th Python in Science Conference (2016) 98–105.
- de Oliveira et al. [2020] T. E. de Oliveira, F. Leonforte, L. Nicolas-Morgantini, A.-L. Fameau, B. Querleux, F. Thalmann, C. M. Marques, Fluid bilayer phase in aqueous mixtures of fatty alcohol and cationic surfactant, Phys. Rev. Research 2 (2020) 013075. doi:10.1103/PhysRevResearch.2.013075.
- Cunningham et al. [1998] B. A. Cunningham, A.-D. Brown, D. H. Wolfe, W. P. Williams, A. Brain, Ripple phase formation in phosphatidylcholine: Effect of acyl chain relative length, position, and unsaturation, Physical Review E 58 (1998).
- de Vries et al. [2005] A. H. de Vries, S. Yefimov, A. E. Mark, S. J. Marrink, Molecular structure of the lecithin ripple phase, PNAS 102 (2005) 5392–5396.
- Katsaras et al. [2000] J. Katsaras, S. Tristram-Nagle, Y. Liu, R. L. Headrick, E. Fontes, P. C. Mason, J. F. Nagle, Clarification of the ripple phase of lecithin bilayers using fully hydrated, aligned samples, Physical Review E 61 (2000).