Drug Package Recommendation via
Interaction-aware
Graph Induction
Abstract.
Recent years have witnessed the rapid accumulation of massive electronic medical records (EMRs), which highly support the intelligent medical services such as drug recommendation. However, prior arts mainly follow the traditional recommendation strategies like collaborative filtering, which usually treat individual drugs as mutually independent, while the latent interactions among drugs, e.g., synergistic or antagonistic effect, have been largely ignored. To that end, in this paper, we target at developing a new paradigm for drug package recommendation with considering the interaction effect within drugs, in which the interaction effects could be affected by patient conditions. Specifically, we first design a pre-training method based on neural collaborative filtering to get the initial embedding of patients and drugs. Then, the drug interaction graph will be initialized based on medical records and domain knowledge. Along this line, we propose a new Drug Package Recommendation (DPR) framework with two variants, respectively DPR on Weighted Graph (DPR-WG) and DPR on Attributed Graph (DPR-AG) to solve the problem, in which each the interactions will be described as signed weights or attribute vectors. In detail, a mask layer is utilized to capture the impact of patient condition, and graph neural networks (GNNs) are leveraged for the final graph induction task to embed the package. Extensive experiments on a real-world data set from a first-rate hospital demonstrate the effectiveness of our DPR framework compared with several competitive baseline methods, and further support the heuristic study for the drug package generation task with adequate performance.
1. INTRODUCTION
With the growth of population and the intensification of population aging, people’s demand for high-quality medical services continues to rise, and the pressure on the medical workers is increasing. Moreover, certain public health emergencies such as the outbreak of COVID-19, will also have a huge impact on the medical system. Meanwhile, artificial intelligence (AI) technologies have shown enormous potential to reduce human labor. Therefore, if AI technologies could be effectively utilized to realize intelligent diagnosis and drug recommendation clinically, it will greatly improve the overall quality of medical services.
Fortunately, with the popularization of information technology in the medical industry, electronic medical records (EMRs) have been widely used in major hospitals, which powerfully support the downstream intelligent applications like medical image analysis (Litjens et al., 2017; Dilsizian and Siegel, 2014), chronic disease management (García-Lizana and Sarría-Santamera, 2007; Martin et al., 2008), medical text analysis (Afzal et al., 2017; Miller et al., 2017), etc. However, due to the limitation of data and technology, drug recommendation based on EMR is still largely unexplored. In terms of data, similar to traditional recommendation system, drug recommendation is sensitive to data quality, but it is hard to get reliable medical data sources. Moreover, most patients have only been recorded once or several times in EMR database, which makes it hard to utilize conventional personalized recommendation methods based on user preference analysis. In terms of technology, it is very important for the recommender system to consider both drug effect and the interaction between drugs at the same time, and give the patient a suitable drug package, which contains multiple drugs. However, most of existing studies generally rely on traditional methods such as collaborative filtering (Zhang et al., 2015) to solve this problem. Due to the lack of item relation data for interaction analysis, there are limits for these methods to achieve satisfactory performance in practical applications.
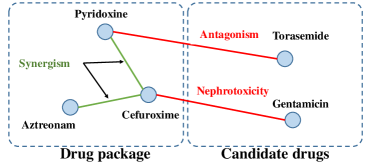
In order to address the above challenges, in this paper, we aim to develop a new paradigm for drug package recommendation with the awareness of drug interaction. The rationale behind this is that the interaction between drugs will influence the effect of the drug package, and the impact of drug interaction on drug effect will be further affected by patient conditions. We illustrate this by a patient with kidney disease as shown in Figure 1. The drug package for this patient contains three drugs, respectively pyridoxine, aztreonam and cefuroxime. Cefuroxime is synergistic with the other two drugs, which can improve the effect of the drug package. Torasemide is antagonistic with pyridoxine, so it is not included in the package. Furthermore, the combination of cefuroxime and gentamicin has a synergistic antibacterial effect, but at the same time it may increase nephrotoxicity, so it is not suitable for this patient.
Along this line, we first design a pre-training model to get the embedding of patients and drugs based on neural collaborative filtering (NCF). Then we collect drug interaction data from public online dataset and divide drug pairs into three categories with the help of domain experts, respectively No Interaction, Synergism and Antagonism. After that, we propose to represent drug packages as graphs based on the labeled data. Furthermore, we propose a Drug Package Recommendation (DPR) framework with two variants. The first one, namely DPR on Weight Graph (DPR-WG), regards the effect of drug interaction as graph edge weights, while the second one, DPR on Attributed Graph (DPR-AG), utilizes edge attribute vectors to describe the influence of drug interaction. In both two models, we exploit a mask layer to capture the impact of the patient condition on the drug package representation, and Graph Neural Networks (GNNs) are leveraged for the final graph induction task to embed the package. Finally, extensive experiments on a real-world dataset from a first-rate hospital demonstrate the effectiveness of our DPR framework compared with several competitive baseline methods, and further support the heuristic study for the drug package generation task with adequate performance.
Specifically, the major contributions of this paper can be summarized as follows:
-
•
We develop a new paradigm to represent drug packages as graphs based on drug interaction classification.
-
•
We design a drug package recommendation framework with two variants, which can integrate drug interaction information based on graph induction.
-
•
We propose to utilize a mask layer to capture the impact of patient condition on the drug package representation.
-
•
We conduct extensive experiments on a real-world data set from a first-rate hospital, which clearly validate the effectiveness of our DPR framework and reveal some interesting rules based on the derived insights on patient conditions and drug interaction.
2. RELATED WORK
In this section, we will summarize the related works as following three categories, respectively drug recommendation system, package recommendation system, and graph neural networks.
2.1. Drug Recommendation System
Recommendation systems have been widely used in a variety of applications like social networking and e-commerce. The methods can be broadly classified into two categories, respectively neighborhood-based collaborative filtering methods based on similar users or items (Adomavicius and Tuzhilin, 2005), and model-based methods, particularly latent factor models that factorize the user-item matrix into user factors and item factors (Koren et al., 2009). Recent recommender systems have been further advanced by the significant contribution from deep learning (Zhang et al., 2019; He et al., 2017; Xue et al., 2017), where user preferences and item characteristics can be learned in deep architectures. Based on these technologies, some methods focusing on drug recommendation have been put forward. For example, (Zheng et al., 2020) introduces a LDA-based contextual collaborative model called Medicine-LDA to integrate the multi-source information. (Zhang et al., 2014) constructs a heterogeneous graph which includes patients and drugs, and describes a novel recommendation system based on label propagation. (Chiang et al., 2018) develops a joint model with a recommendation component and an ADR label prediction component to recommend a set of to-avoid drugs. With the increasing emergence of knowledge graph, some researchers have extracted information from medical database like (Law et al., 2014) to build up giant medical knowledge graphs. Based on these knowledge graphs, (Wang et al., 2017) proposes to jointly embed diseases, drugs and patients into a shared lower dimensional space, and decomposes the drug recommendation into a link prediction process. However, these models lack the ability to recommend drugs as a package, and the studies on drug interaction are not thorough enough.
2.2. Package Recommendation System
Most recommendation research concentrates on recommending one item to users at a time. However, in many real world scenarios, the platform needs to show users a set of items, in other words, a package (or a bundle). Several efforts have been made to solve this problem. Some studies turn this problem into optimization problems like 0-1 Knapsack problem, and provide some approximate solutions due to the NP-Hardness (Parameswaran and Garcia-Molina, 2009; Lappas et al., 2009; Deng et al., 2013; Zhu et al., 2014). (Liu et al., 2011) puts forward a Tourist-Area-Season topic model and proposes a cocktail approach on personalized travel package recommendation. (Bai et al., 2019) proposes a bundle generation network which decomposes the problem by derterminantal point processes. (Pathak et al., 2017) develops a model which utilizes the trained features of an item recommendation model to learn the personalized ranking over bundles. (Chen et al., 2019) contributes a neural network solution based on factorized attention network to aggregate the item embeddings in a package. (Chang et al., 2020) proposes a model based on graph neural network which explicitly models the interaction and affiliation between users, bundles, and items by unifying them into a heterogeneous graph. However, these models neglect the different types of interactions between items, which prevents them from capturing satisfactory performance for drug package recommendation.
2.3. Graph Neural Networks
Recently, many studies on extending deep learning approaches for graph data have emerged. Unlike standard neural networks, GNNs retain a state that can represent information from its neighborhood with arbitrary depth. For example, (Kipf and Welling, 2016) presents graph convolutional network (GCN) for semi-supervised learning on graph data via an approximation of spectral graph convolutions. (Hamilton et al., 2017) presents GraphSAGE to generate node embeddings by sampling and aggregating features from the local neighborhoods of nodes. (Veličković et al., 2017) presents graph attention networks (GATs) which leverage masked self-attentional layers to address the shortcomings of methods based on graph convolutions. (Gilmer et al., 2017) further presents that the essence of existing GNNs is to learn a message passing algorithm and an aggregation procedure to compute a function of the entire input graph, and reformulates existing models into a single common framework called Message Passing Neural Networks (MPNNs). With the strong power of learning structure, GNNs have been widely applied in many fields. For example, (Zhang et al., 2020; Li et al., 2020) utilize graph data and graph neural networks for competitive analysis. (Liu et al., 2020) propose a deep model to integrate structural and temporal social contexts to address the dynamic social-aware recommendation task.
3. PRELIMINARIES
In this section, we first introduce the real-world dataset used in our study, and then propose the problem formulation of drug package recommendation.
3.1. Data Description and Preprocessing
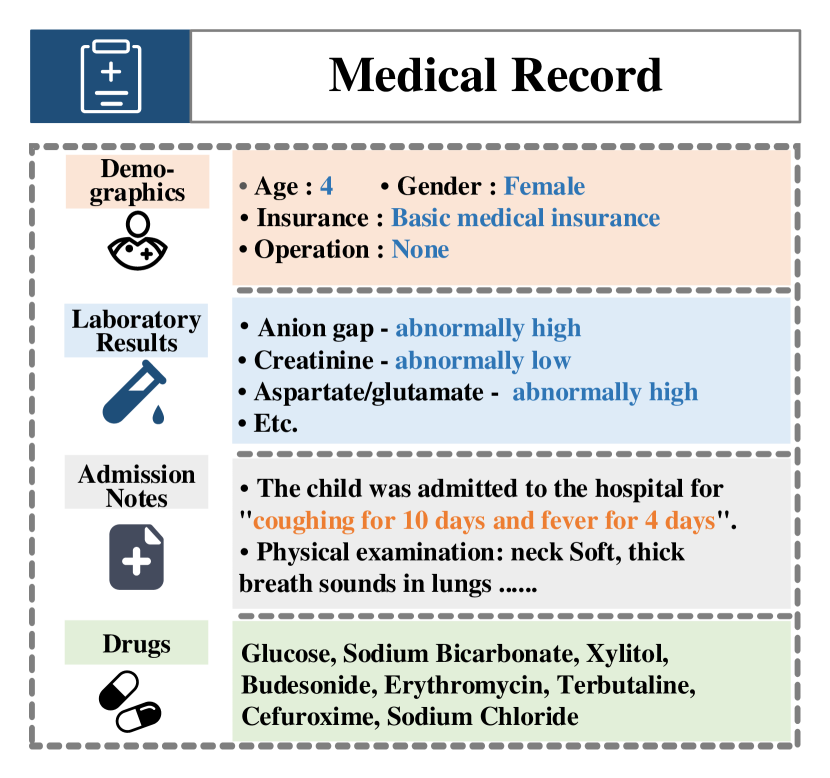
The EMR dataset used in this paper comes from the electronic medical record database of a first-rate hospital in China. As shown in Figure 2, each medical record contains the following information:
-
•
Demographics. Demographics are formatted data including basic patient information, such as patient’s gender, age, type of medical insurance, whether surgery has been performed, etc. This information provides guidance for doctors to prescribe, for example, some drugs are not suitable for children, while some drugs are only covered by certain medical insurance, etc.
-
•
Laboratory results. A laboratory test is a procedure in which the hospital takes a sample of the patient’s body fluid or body tissue to get information of the patient’s health. The laboratory results are shown as the patient’s values and normal values for laboratory items. For example, ”glucose value: 77 mg/dL, normal value: 65-99 mg/dL”.
-
•
Admission notes. An admission note is part of a medical record that documents the patient’s status including physical examination findings, reasons why the patient is being admitted for inpatient care to a hospital, and the initial instructions for the patient’s care.
-
•
Drugs. This information includes all of the drugs used during the patient’s hospital stay.
In order to integrate and utilize the above multi-source heterogeneous data, we conduct the following preprocessing steps. First, for the demographics, we convert them into documents, e.g., ”Gender : Male, Age : Teenager”. Second, for the laboratory results, we divide the results into three levels, respectively normal, abnormally high and abnormally low according to the given normal values. We then extract all abnormal test results (abnormally high and low) from the results and converted them into documents, e.g., ”glucose value : abnormally high, lipid panel : abnormally high”. After that, we merge the demographic documents and laboratory result documents, namely disease documents. Finally, for the admission notes, we remove all the punctuation and meaningless characters, and adjust all of the admission notes in the dataset to the same length by padding and cut-off.
For the purpose of studying the interaction between drugs, we collect data from two large online pharmaceutical knowledge bases, i.e., DrugBank111https://go.drugbank.com/releases/latest and YaoZhi222https://db.yaozh.com/interaction, where users can check drug properties and drug-drug interaction. The drug interaction information in these two databases are stored in text format based on some certain templates. We further classify the templates into three categories with the help of domain experts, respectively No Interaction, Synergism and Antagonism. No Interaction means there is no interaction between two drugs. Synergism means the combination of two drugs can lead to enhanced drug effect, and Antagonism is the opposite. Table 2 shows some examples of different drug interactions. Note that the interaction can be directed, for example, if drug A can increase the effect of drug B, then the direction is from A to B. Moreover, for most of the drug pairs, we cannot confirm whether there is any type of interactions between them, so we leave them as unlabeled. Section 4.2.1 will further discuss how to exploit these labeled and unlabeled data.
Finally, we pick out the EMR records containing more than one drug and we get totally 158,556 EMR records with complete information. More detailed statistics of our data are shown in Table 1.
| Discription | Number |
| The number of records | 158,556 |
| The number of drugs | 1,428 |
| The number of words in disease document | 1,242 |
| The average size of drug packages | 18 |
| The number of aligned drugs | 565 |
| The number of drug pairs with No Interaction | 2,560 |
| The number of drug pairs with Synergism | 22,986 |
| The number of drug pairs with Antagonism | 6,389 |
| Drug A | Drug B | Description | Classification | Direction |
|---|---|---|---|---|
| Amoxicillin | Oseltamivir | No Interaction | No Interaction | Bidirection |
| Dipyridamole | Valsartan | Dipyridamole may increase the antihypertensive activities of Valsartan. | Synergism | A to B |
| Repaglinide | Doxepin | Doxepin may decrease the hypoglycemic activities of Repaglinide. | Antagonism | B to A |
3.2. Problem Formulation
Based on the above EMR and drug interaction data, here we introduce the problem formulation of drug package recommendation. For facilitating illustration, Table 3 lists some important mathematical notations used throughout this paper.
Suppose there are patients and drugs in the training set. Based on the above preprocessing method, for patient , we can construct the disease document and turn it into one-hot encoding form as , where is the 0/1 indicator value for a demographic feature or a lab result. In addition, we can formulate the admission note as , where is a word in the processed admission note. In this way, the patient can be expressed as a patient description . We also have the drug package , where is a drug that patient used. Moreover, based on the labeled drug interaction data, we can construct the drug relation matrix , where represents the interaction between and , namely 0 for No Interaction, 1 for Synergism, 2 for Antagonism and -1 for unknown. Note that the direction is from to . Along this line, the problem of drug package recommendation can be formulated as:
Definition 1 (Drug Package Recommendation).
Given a set of patient descriptions with the corresponding drug packages , and the drug relation matrix , the goal of drug package recommendation is to get a personalized scoring function for each patient: .
Note that the cold start patients and packages are very common in our drug package recommendation problem. For example, a new patient comes to the hospital or a doctor prescribes a new drug package. This requires the model to score a package based on the patient condition and the effect of drug packages, making the problem radically different from traditional recommendation based on user-item interaction matrix.
| Symbol | Description |
|---|---|
| The number of patients and the number of drugs; | |
| The drug package of patient ; | |
| The disease document of patient ; | |
| The admission note of patient ; | |
| The patient discription of patient ; | |
| The drug package graph of patient ; | |
| The drug relation matrix; | |
| Model Parameters; | |
| The th drug in the entire drug set; | |
| Drug in the drug package of patient ; | |
| Indicator value in the disease document of patient ; | |
| Word in the admission note of patient ; | |
| Multilayer Perceptron with ReLU Activation Function. |
4. TECHNICAL DETAILS
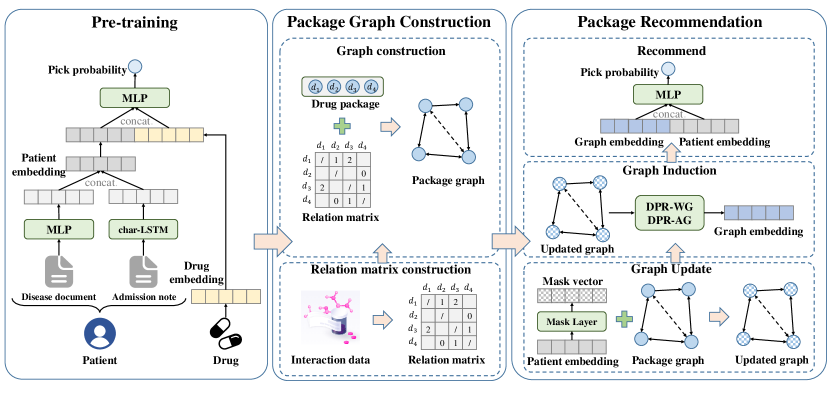
In this section, we will introduce the framework of our model in detail. As shown in Figure 3, our framework mainly consists of three components, i.e., pre-training, package graph construction, and drug package recommendation. Specifically, we first design a pre-training method based on neural collaborative filtering to get the initial embedding of patients and drugs. Then, we propose to construct drug package graphs based on the medical records and domain knowledge. Finally, a novel Drug Package Recommendation (DPR) framework with two variants are proposed to solve the drug package recommendation problem.
4.1. Pre-training
A patient’s description consists of two heterogeneous parts, and a drug package consists of several drugs. In order to recommend drug packages, we first need to get the embeddings of drugs and patients. Therefore, we propose a pre-training method as follows.
First, we propose a hybrid method to get the patient embedding based on patient description , which can be split into two steps. To be specific, in the first step, we extract the feature of the patient’s disease document by MLP as:
| (1) |
In the second step, we associate each word in patients’ admission notes with a word embedding vector . By this way we can convert to a sequence of vectors . Then we input the sequence into char-LSTM (Lample et al., 2016) as:
| (2) |
We get the final time step output as the embedding of , and the patient embedding is the concatenation of the two parts:
| (3) |
Second, we associate each drug with a randomly initialized embedding which directly projects drug one-hot ID to the latent space. Finally, We utilize Neural Collaborative Filtering (NCF) framework (He et al., 2017) and Bayesian Personalized Ranking (BPR) loss (Rendle et al., 2009) to train the above embeddings and models. Specifically, for patient , we get a patient-drug predictive model by feeding patient embedding and drug embedding into a matching model:
| (4) |
Then we adopt BPR loss as:
| (5) |
where is in drug package and is not. We minimize the loss function forcing the prediction to be larger than . is the sigmoid function, and is the parameter set. regularization is applied to prevent overfitting.
4.2. Package Graph with Message Passing
Compared with traditional item recommendation, the core problem of drug package recommendation is how to get the representation of drug packages considering the interaction between drugs. Therefore, in this section, we propose to utilize graph models to solve this problem. To be specific, we first present a method to convert the drug packages into package graphs. Then, we formulate the message passing framework which will be further utilized for the graph induction task.
4.2.1. Package Graph Construction.
For drug package , we define a corresponding package graph , where is the node set and is the edge set. Each specific node is associated with corresponding drug embedding . Each directed edge also has its attribute, and its form will change with different methods, which will be discussed in later sections.
The topology structure of the package graph , i.e., whether edge should exist, needs to be defined. Theoretically, since any pair of drugs may have drug interaction, the package graph should be a complete graph, where all nodes are connected with each other. However, this will make the time complexity of graph induction increases from to owing to the pairwise interaction. Furthermore, we find that the frequency of drug co-occurrence obeys a long-tailed distribution, which means most of the drug pairs have no clear relationship. Therefore, we propose the following two criterions to define the topology of a package graph. For nodes : If , which means this drug paired has been labeled in Section 3.1, then edge exists. Calculate the co-occurrence proportion , where means the number of packages containing drug , and means the number of packages containing both drug and drug . If is bigger than a threshold value, then edge exists.
4.2.2. Message Passing on Package Graph.
We propose to exploit the MPNN (Gilmer et al., 2017) framework for making use of the package graphs constructed in the last section. MPNN is a general approach to describe GNNs, which inductively learns a node representation by recursively aggregating and transforming the feature vectors of its neighboring nodes. A per-layer update of the MPNN model in our setting involves message passing, message aggregation, and node representation updating, which can be expressed as:
| (6) |
| (7) |
| (8) |
where is the message vector passing from to , is the representation of node on the layer ; is the attribute corresponding to edge . is the neighborhood of node from where it collects information to update its aggregated message . is initialized by corresponding drug embedding , and we also express it as for facilitating illustration.
4.3. Drug Package Recommendation
After the formulation of package graphs and massage passing neural networks, we can finish the graph induction task, i.e., get the embedding of the package graph, based on the MPNN framework and further solve the drug package recommendation problem. The key to obtain effective representation of the drug package graph is to utilize the edge attributes to capture the interaction between the drugs. Therefore, we propose the following two ways to formulate the edge attributes in package graphs from two different point of views. First, since the two major interactions in our dataset, respectively Synergism and Antagonism, are opposite to each other, we can simply exploit signed edge weights to describe the drug interaction intensity. Second, if we expect our model to be more generic, we can define the edge attributes as vectors which contain the information about the type of interaction. Along this line, we propose our Drug Package Recommendation (DPR) model with two variants, respectively DPR on Weighted Graph (DPR-WG) and DPR on Attributed Graph (DPR-AG) in the following sections.
4.3.1. DPR on Weighted Graph
In DPR-WG, we present to convert a package graph into a weighted graph by assigning real numbers to edge attributes, i.e., . Specifically, for edge in a package graph , we initialize the edge attribute as:
Note that we set edge attribute for even if or , since the interaction data may be incomplete or incorrect.
As previously stated, the impact of drug interaction will also be affected by patient condition. Inspried by (Wang et al., 2019), we propose to utilize a mask layer to extract a mask vector from a patient’s embedding , and get the conditional drug embedding as follows:
| (9) |
where the mask layer is formed as , and the mask vector plays the role of feature selecting on the drug embeddings. represents the element-wise product of two vectors. Then, for edge , we can calculate a contextual impact factor as:
| (10) |
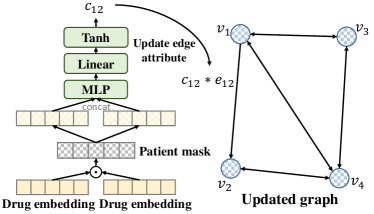
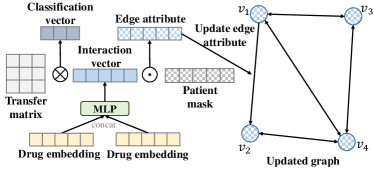
where is a row vector which has the same length with the MLP output. The contextual impact factor reflects the impact of the the patient condition on the drug interaction between and . After the above calculation, we can update the edge attribute as . Figure 4 shows the updating progress in detail.
Then, we can form the GNN layer using edge weight for filtering as the following steps:
| (11) |
| (12) |
| (13) |
where denotes the model’s parameters to be learned, and GRU denotes the gated recurrent neural network (Chung et al., 2014). We set the dimension of all the layers equal to the dimension of 0th layer.
Now we can utilize the formed GNN layer for the graph induction task. Note that different from general sparse graphs, a drug package graph is a graph which is dense enough. Therefore, we only need one layer of GNN to extract almost all the information we expected, and there is no need for high-order neighbors, which will be discussed later. For each node , we have the initial node embedding and the corresponding hidden representation from the GNN layer. Following (Li et al., 2015), the package graph embedding can be formed as:
| (14) |
Again, we utilize NCF framework and BPR loss to train the model. For patient , we have the patient embedding and the corresponding package graph embedding . The loss function can be formed as follows, where the MLP model is the final prediction model:
| (15) |
4.3.2. Drug Package Recommendation on Attributed Graph
In DPR-AG, the package graph is formed as an attributed graph, where both nodes and edges have corresponding attribute vectors.
Specifically, for edge and the corresponding drug embedding , we first form the edge attribute vector as the interaction vector between and , which is calculated by MLP model as:
| (16) |
Then, we utilize the mask layer again to update the edge attributes by adding the impact of patient’s condition on the interaction vector as follows:
| (17) |
The detailed updating progress is shown in Figure 5. Based on the above steps, we can form the GNN layer as the following steps, note that the settings are the same as DPR-WG in the former section:
| (18) |
| (19) |
| (20) |
After getting the package graph embedding by equation 14, we can form the loss function for DPR-AG. The essential difference between DPR-WG and DPR-AG is that, in DPR-WG, the prior knowledge is leveraged explicitly by initializing the edge weights according to the relation matrix . On the contrary, we propose to utilize the prior knowledge implicitly in DPR-AG. Specifically, we design a hybrid loss function as:
| (21) | ||||
where the MLP model is the final prediction model. is the transfer matrix to transform the edge attribute into classification probabilities, where is the dimension of . We add cross entropy loss to the loss function, which aims to force the edge attribute to contain the interaction type information.
5. EXPERIMENTS
In this section, we evaluate the proposed model with a number of competitive baselines. Meanwhile, many discussions and case studies on drug package recommendation will be presented.
5.1. Experimental Settings
We omit the dataset description in this section since it has been introduced in Section 3.1. Other experimental settings will be described in the following parts.
5.1.1. Baselines and Evaluation Metrics.
To evaluate the performance of our models for drug package recommendation, we selected a number of state-of-art methods as baselines. Specifically, we first chose two popular traditional recommendation approaches, and several state-of-art package recommendation models as follows:
-
•
NCF (He et al., 2017): NCF is a state of art deep neural networks on recommendation system, which replacing the inner product in matrix factorization with a neural architecture. This model recommends top drugs as packages for the patients in test sets based on the patient embeddings, where is the average size of drug packages.
-
•
NN: This method utilizes the pretrained patient embeddings based on NCF, and returns the drug package corresponding to the Nearset Neighbor (NN) by calculating the cosine similarity of patient embeddings.
-
•
Package2vec: (Wan et al., 2018) proposes to utilize Item2vec (Barkan and Koenigstein, 2016) for enhancing the item embeddings in a package , and we extend Item2vec following (Le and Mikolov, 2014) to get the embedding of a package. NCF framework and BPR loss are utilized to train the package recommendation model.
-
•
LDA (Blei et al., 2003): This method utilizes the LDA model to get the embedding of a package and uses the same framework as Package2vec to recommend packages.
-
•
BR (Pathak et al., 2017): BR is a package recommendation method which aggregates item latent vectors to get the package embeddings based on package size and item compatibility.
-
•
DAM (Chen et al., 2019): DAM is the state-of-art neural network architecture for package recommendation which utilizes factorized attention network to get the embedding of packages.
-
•
GNN: This method is a simplified variant of our models, which only uses the package graph structure and ignore the edge attributes.
It is worth noting that the drug package recommendation is much different from general recommendation since there is no fixed users in our task. Therefore, in all of the baseline methods, we exploited the patient embedding model proposed in Section 4.1 to get the representation of patients. Another problem is how to generate packages for patients in test set since most of the models are discriminant. Therefore, we proposed that except for the NCF model which can generate packages itself, all the remaining models only pick out the best package from a candidate set, and the candidate set consists of drug packages from 10 most similar patients. The similarity was calculated by the cosine similarity between patient embeddings. Evaluation metrics including Precision, Recall and F1-score were utilized to compare the performance of the models.
5.1.2. Implementation Details.
We implemented our model by PyTorch333https://pytorch.org/ and Pytorch Geometric444https://github.com/rusty1s/pytorch_geometric. The parameters were all initialized using Kaiming (He et al., 2015) initialization. For the pre-training model, we set the output dimension of the MLP, the dimension of char embeddings, and the hidden size of the LSTM as 32, while the dimension of patient embeddings was set as 64. For the construction of package graph, we set the threshold value of co-occurrence proportion as 0.01. For the BPR loss used in this paper, we used negative sampling to train the model and set the negative sampling ratio as 10, which means 10 negative samples for one positive sample. For all the MLP models used in this paper, we set the dimension of hidden layers as 128. In the process of model training, we used the Adam optimizer (Kingma and Ba, 2015) for parameter optimization. We set learning rate as 0.001 and mini-batch size as 256. The parameters of baselines were set up similarly as our method and were all tuned to be optimal to ensure fair comparisons. For the dataset splitting, we divided our dataset into 80%/10%/10% training/validation/test and we report performance on the test set for the model that performed best on the validation set.
| model | Precision | Recall | F1-score |
|---|---|---|---|
| NCF | 0.3812 | 0.5442 | 0.4200 |
| NN | 0.4890 | 0.4985 | 0.4732 |
| Package2vec | 0.4846 | 0.5268 | 0.4857 |
| LDA | 0.5014 | 0.5219 | 0.4904 |
| BR | 0.5068 | 0.5106 | 0.4879 |
| DAM | 0.5254 | 0.5107 | 0.4979 |
| GNN | 0.5085 | 0.5288 | 0.5009 |
| DPR-WG | 0.5133 | 0.5488 | 0.5137 |
| DPR-AG | 0.5260 | 0.5407 | 0.5162 |
5.2. Discussions
5.2.1. Overall Performance.
To demonstrate the effectiveness of our drug package recommendation framework, we compared DPR-WG and DPR-AG with all the baselines, and the results are shown in Table 4. From the results, we can get several observations:
First, the performance of our models surpasses most of the baseline methods on different evaluation metrics. This clearly proves the effectiveness of our DPR framework based on package graph construction and message passing neural networks. Furthermore, our models obtain much higher recall than baselines, which indicates our models are more likely to prevent doctors from neglecting certain factors in practical application.
Second, the performance of NCF model is the worst, since this method based on collaborative filtering prefers to recommend items with higher popularity, and cannot model the drugs as a whole. This clearly verifies the necessity for the studies of package recommendation systems.
Third, the GNN model which only leverages the graph topological structure to exchange information between different drugs cannot achieve comparable result with our model. However, this model surpasses all the other baselines. This verifies the effectiveness of constructing package graphs to capture the interaction between drugs, and futher indicates the effectiveness of our method for the graph induction process.
Last but not least, the results of the models except NCF are close to each other, since patients with similar condition are more likely to use similar drugs.
5.2.2. Ablation Study.
To further validate the effectiveness of each component of our models, we also designed some simplified variants of our models as follows:
-
•
DPR-WG-Context: This method is a simplified variant of DPR-WG which only utilizes the edge attributes initialized by the drug interaction matrix and ignores the influence of the patient condition.
-
•
DPR-WG-Type: This method is a simplified variant of DPR-WG which only uses the contextual impact factor as edge attributes and ignores the drug interaction type.
-
•
DPR-AG-Mask: This method is a simplified variant of DPR-AG which deletes the mask layer in the calculation process.
-
•
DPR-AG-Type: This method is a simplified variant of DPR-AG which deletes the cross entropy loss in the loss function. In this way, the edge attributes dose not contain the information of drug interaction type.
The results of ablation study are shown in Table 5 from which we can draw the following conclusions. First, DPR-WG performs better than the two variants. This indicates that both the contextual impact factors and the initial edge weights are significant, which clearly verifies our assumption that patient condition will influence the interaction effect between drugs. Second, DPR-AG also performs better than the two variants, which verifies that both parts of drug interaction type and mask vectors are effectual, and the mask layer we proposed can effectively extract the feature of patient condition.
| model | Precision | Recall | F1-score |
|---|---|---|---|
| DPR-WG-Context | 0.5126 | 0.5330 | 0.5053 |
| DPR-WG-Type | 0.5126 | 0.5377 | 0.5074 |
| DPR-AG-Mask | 0.5152 | 0.5342 | 0.5061 |
| DPR-AG-Type | 0.5154 | 0.5317 | 0.5056 |
| DPR-WG | 0.5133 | 0.5488 | 0.5137 |
| DPR-AG | 0.5260 | 0.5407 | 0.5162 |
| model | Precision | Recall | F1-score |
|---|---|---|---|
| DPR-WG-1 | 0.5133 | 0.5488 | 0.5137 |
| DPR-WG-2 | 0.4994 | 0.5582 | 0.5100 |
| DPR-AG-1 | 0.5260 | 0.5407 | 0.5162 |
| DPR-AG-2 | 0.5139 | 0.5457 | 0.5128 |
5.3. Parameter Sensitivity
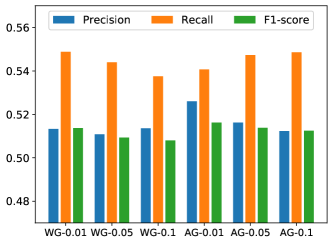
We investigated the sensitivity of our model parameter in this section. First, we evaluated how the threshold for co-occurrence proportion affected the performance, and the results are shown in Figure 6. From the results, we can find that as the number of edges decreases, the model performance does not change significantly, and the F1-score shows a downward trend. This indicates the fact that there is no interaction between most of the drug pairs.
Next, we investigated whether utilizing two GNN layers can affect the results. Table 6 shows the results of our two models with one and two GNN layers. The results have not witnessed a performance improvement by adding one more GNN layer. As mentioned before, different from general graphs, we only need one GNN layer to extract almost all the information we expect since the drug package graph is dense enough.
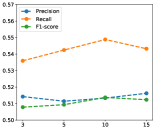
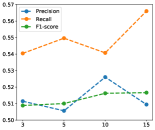
Finally, we verified the impact of the negative sampling ratio. As shown in Figure 7, we can find the performance only fluctuates in a small range, and the model with a small negative sample number also works well in practice. All the above experiments have proved the robustness of the methods proposed in this paper.
5.4. Case Study
In this part, we present some cases to illustrate the effectiveness of our models and reveal some interesting medical rules based on the derived insights on patient conditions and drug interaction.
5.4.1. Mask Vector Analysis
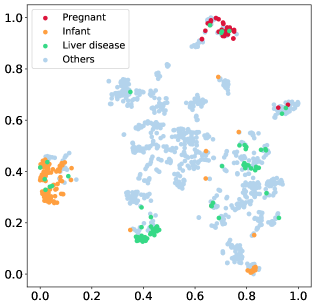
As mentioned before, we extracted the mask vector of patient to describe the impact of the patient condition. In order to analyze the effect of the mask vectors, we randomly selected 1,000 patients and their corresponding mask vectors, and projected them into two-dimensional space with t-SNE, which is proposed in (Maaten and Hinton, 2008). We further selected three representative patient groups with special needs for drugs based on common sense, respectively pregnant women, infants (or young children) and patients with liver disease.
Figure 8 shows the visualization result. We can find that the mask vectors of infants and pregnant women deviate the most from the vectors of other patients, which indicates that these two groups have the most special requirements for drug selecting, and this is consistent with our common sense. Moreover, the mask vectors of patients with liver disease are also relatively deviated from other patients, but the degree of aggregation is lower than previous two groups. This indicates that patients with liver disease have special needs for drugs, but there are also certain personalized needs. We can further study the impact of patient conditions on drug selection by statistical methods such as clusting, which shows a great possibility of our method to help medical researchers.
5.4.2. Contextual Impact Factor Analysis
| Drug 1 | Drug 2 | Description | Type | Factor |
|---|---|---|---|---|
| Potassium Chloride | Cefazolin | drug 2 may decrease the excretion rate of drug 1. | Synergism | 0.993 |
| Midazolam | Potassium Chloride | drug 1 may decrease the excretion rate of drug 2. | Synergism | -0.264 |
| Ephedrine | Methylprednisolone | drug 1 may increase the excretion rate of drug 2. | Antagonism | -0.309 |
| Drug 1 | Drug 2 | Type | ||
|---|---|---|---|---|
| Warfarin | Ondansetron | Synergism | [0.007, 0.807, 0.184] | [0.015, 0.923, 0.061] |
| Metformin | Spironolactone | Antagonism | [0.358, 0.163, 0.478] | [0.769, 0.022, 0.208] |
In Section 4.3.1, we propose to utilize contextual impact factors to reflect the impact of patient condition on drug interaction. In this section we will show how these impact factors play a role for recommending packages.
We picked patient #27667 for detailed analysis. From the EMR database we can know that this patient suffered from gallstones and came to the hospital for cholecystectomy. We input the ground truth drug package into DPR-WG, and got the contextual impact factors between all of the drug pairs. Table 7 shows three samples of drug pairs with different interaction types. From the results we can get several observations. First, Cefazolin can bring Potassium Chloride to a higher serum level, and the contextual impact factor for this edge is very high. This shows that our model believes the synergism between these two drugs is necessary for this patient. Second, Midazolam can also bring Potassium Chloride to a higher serum level, but our model gives a small negative factor for this interaction. By understanding more medical knowledge, we know that the combination of these two drugs has a greater risk, and they are even used for euthanasia. Our model predicts the risk of these two drugs. Finally, Ephedrine may decrease the effect of Methylprednisolone, but Methylprednisolone is an adrenal glucocorticoid with strong anti-inflammatory effect, which is very necessary for this patient. So our model gives a small negative factor to adjust the interaction effect between these two drugs. The above examples strongly confirm the effectiveness and interpretability of DPR-WG from different perspectives.
5.4.3. Edge Attribute Analysis
In Section 4.3.2, edge attribute vectors are calculated to describe the interaction between two drugs. The attribute vectors are forced to contain drug interaction category information, and mask vectors are utilized to bring the impact of patient condition. We propose that the mask vector plays a role by feature selecting. If we multiply a contextual edge attribute vector with the classification transfer matrix , we can get a personalized drug interaction classification result, and we will illustrate this intuition in this case study.
We picked patient #25256 for detailed analysis. This patient was a 79-year-old woman with high blood pressure, diabetes and heart disease. We got the corresponding patient mask vector and drug interaction vectors by DPR-AG, and we further got the non-personalized and personalized drug interaction classification results for the drug interaction vectors. Table 8 shows two examples for this. We can find that Warfarin and Ondansetron have a synergistic effect, and the initial drug interaction vector reflects this point. Furthermore, the mask vector enhances this feature, since Warfarin (which can prevent the formation and development of thrombus) is very important for this patient, and it is beneficial to keep this synergistic effect. In addition, Metformin and Spironolactone are marked as antagonistic, but it is not significantly reflected in the drug interaction vector, and the mask vector believes that these two drugs may have no interaction. To explain this, we consulted a doctor and learned that the interaction between these two drugs is relatively moderate, and they are often used together clinically. These examples clearly confirm the interpretability and learning ability of our model.
6. PACKAGE GENERATION
| model | Non-heuristic | Heuristic |
|---|---|---|
| doctor1 | 39% | 61% |
| doctor2 | 37% | 63% |
| doctor3 | 39% | 61% |
| doctor4 | 45% | 55% |
| doctor5 | 30% | 70% |
| average | 38% | 62% |
| Patient ID | Ground Truth | Non-heuristic | Heuristic | ||||||||||||||
|---|---|---|---|---|---|---|---|---|---|---|---|---|---|---|---|---|---|
| #28062 |
|
|
|
||||||||||||||
| #28199 |
|
|
|
Until now, we have considered recommending drug packages that already exist within the EMR database. However, existing packages cannot meet the needs of new patients sometimes. Therefore, we present a heuristic algorithm which combines the existing packages, personalized drug prediction lists and drug interaction matrix to generate new packages. The algorithm is described as follows.
First, we get the drug frequency rank list which contains drugs in descending order of occurrence frequency in the EMR dataset. Then, we calculate the drug co-occurrence proportion matrix which is mentioned in Section 4.2. For a new patient, we can get the patient embedding based on the patient’s description. With the patient embedding, we can get the candidate set from similar patients as previously mentioned, and we can get the personalized prediction list of all drugs by utilizing the NCF model obtained in the pre-training phase, which contains drugs in descending order of predict value. It is worth noting that, as shown in Section 5.2, the top drugs in can be incorrect. Finally, start with the initial candidate set , we can get new drug packages as:
-
(1)
Form a new candidate set based on reforming the packages in by the following ways:
-
•
Delete the drugs that only appear in a small number of packages in and rank low in ;
-
•
Add the drugs that rank low in and rank high in , which means these drugs are not recommended just because they have high popularity.
-
•
-
(2)
Generate candidate set by modifying the drugs in using more radical strategies as:
-
•
If drug ranks high in and has synergism relationship with a drug in package , then add drug to package ;
-
•
If drug ranks high in and has high co-occurrence proportion with a drug in package , then add drug to package ;
-
•
If drug and in package have antagonism relationship and low co-occurrence proportion, then delete the drug with lower lank in ;
-
•
-
(3)
returns final candidate set .
We verified the effectiveness of our heuristic algorithm on DPR-WG, where the non-heuristic model selected the best package from the initial candidate set , and the heuristic model selected best package from . Due to the hidden security risks of directly using the generated package, we randomly selected some test samples and handed them to five doctors to mark the packages they preferred.
The results are shown in Table 9, where the percentages reflect the ratio of the doctors’ choice. From the results, we can find that utilizing the drug packages generated by the heuristic algorithm can significantly improve the performance of drug package recommendation. Furthermore, we picked two examples to illustrate the effect of the heuristic method. The examples are shown in Table 10, where patient #28062 is a patient with tuberculosis, and patient #28199 is a pregnant woman. We can find that both the adding and deleting strategies are effective. For the adding strategy, Isoniazid was added since the rank promotion between list and , and Pyridoxine was added because of the synergism interaction with Levofloxacin in the first example. For the deleting strategy, several incorrect drugs were deleted in the second example. All the results confirm the effectiveness of our package generation method.
7. CONCLUSION
In this paper, we studied the problem of drug package recommendation. Specifically, we first designed a pre-training method based on neural collaborative filtering to get the initial embedding of patients and drugs. Then, the drug interaction graph was initialized based on medical records and domain knowledge. Furthermore, we proposed a new drug package recommendation framework with two variants, respectively DPR-WG and DPR-AG to solve the problem, in which each the interactions was described as signed weights or attribute vectors. Finally, extensive experiments on a real-world data set from a first-rate hospital demonstrated the effectiveness of our DPR framework compared with several competitive baseline methods, and further supported the heuristic study for the drug package generation task with adequate performance.
References
- (1)
- Adomavicius and Tuzhilin (2005) Gediminas Adomavicius and Alexander Tuzhilin. 2005. Toward the next generation of recommender systems: A survey of the state-of-the-art and possible extensions. IEEE transactions on knowledge and data engineering 17, 6 (2005), 734–749.
- Afzal et al. (2017) Naveed Afzal, Sunghwan Sohn, Sara Abram, Christopher G Scott, Rajeev Chaudhry, Hongfang Liu, Iftikhar J Kullo, and Adelaide M Arruda-Olson. 2017. Mining peripheral arterial disease cases from narrative clinical notes using natural language processing. Journal of vascular surgery 65, 6 (2017), 1753–1761.
- Bai et al. (2019) Jinze Bai, Chang Zhou, Junshuai Song, Xiaoru Qu, Weiting An, Zhao Li, and Jun Gao. 2019. Personalized bundle list recommendation. In The World Wide Web Conference. 60–71.
- Barkan and Koenigstein (2016) Oren Barkan and Noam Koenigstein. 2016. Item2vec: neural item embedding for collaborative filtering. In 2016 IEEE 26th International Workshop on Machine Learning for Signal Processing (MLSP). IEEE, 1–6.
- Blei et al. (2003) David M Blei, Andrew Y Ng, and Michael I Jordan. 2003. Latent dirichlet allocation. Journal of machine Learning research 3, Jan (2003), 993–1022.
- Chang et al. (2020) Jianxin Chang, Chen Gao, Xiangnan He, Depeng Jin, and Yong Li. 2020. Bundle Recommendation with Graph Convolutional Networks. In Proceedings of the 43rd International ACM SIGIR Conference on Research and Development in Information Retrieval. 1673–1676.
- Chen et al. (2019) Liang Chen, Yang Liu, Xiangnan He, Lianli Gao, and Zibin Zheng. 2019. Matching User with Item Set: Collaborative Bundle Recommendation with Deep Attention Network.. In IJCAI. 2095–2101.
- Chiang et al. (2018) Wen-Hao Chiang, Li Shen, Lang Li, and Xia Ning. 2018. Drug recommendation toward safe polypharmacy. arXiv preprint arXiv:1803.03185 (2018).
- Chung et al. (2014) Junyoung Chung, Caglar Gulcehre, KyungHyun Cho, and Yoshua Bengio. 2014. Empirical evaluation of gated recurrent neural networks on sequence modeling. arXiv preprint arXiv:1412.3555 (2014).
- Deng et al. (2013) Ting Deng, Wenfei Fan, and Floris Geerts. 2013. On the complexity of package recommendation problems. SIAM J. Comput. 42, 5 (2013), 1940–1986.
- Dilsizian and Siegel (2014) Steven E Dilsizian and Eliot L Siegel. 2014. Artificial intelligence in medicine and cardiac imaging: harnessing big data and advanced computing to provide personalized medical diagnosis and treatment. Current cardiology reports 16, 1 (2014), 441.
- García-Lizana and Sarría-Santamera (2007) Francisca García-Lizana and Antonio Sarría-Santamera. 2007. New technologies for chronic disease management and control: a systematic review. Journal of telemedicine and telecare 13, 2 (2007), 62–68.
- Gilmer et al. (2017) Justin Gilmer, Samuel S. Schoenholz, Patrick F. Riley, Oriol Vinyals, and George E. Dahl. 2017. Neural Message Passing for Quantum Chemistry. In Proceedings of the 34th International Conference on Machine Learning - Volume 70 (Sydney, NSW, Australia) (ICML’17). JMLR.org, 1263–1272.
- Hamilton et al. (2017) Will Hamilton, Zhitao Ying, and Jure Leskovec. 2017. Inductive representation learning on large graphs. In Advances in neural information processing systems. 1024–1034.
- He et al. (2015) Kaiming He, Xiangyu Zhang, Shaoqing Ren, and Jian Sun. 2015. Delving deep into rectifiers: Surpassing human-level performance on imagenet classification. In Proceedings of the IEEE international conference on computer vision. 1026–1034.
- He et al. (2017) Xiangnan He, Lizi Liao, Hanwang Zhang, Liqiang Nie, Xia Hu, and Tat-Seng Chua. 2017. Neural collaborative filtering. In Proceedings of the 26th international conference on world wide web. 173–182.
- Kingma and Ba (2015) Diederik P. Kingma and Jimmy Ba. 2015. Adam: A Method for Stochastic Optimization. In 3rd International Conference on Learning Representations, ICLR 2015, San Diego, CA, USA, May 7-9, 2015, Conference Track Proceedings, Yoshua Bengio and Yann LeCun (Eds.). http://arxiv.org/abs/1412.6980
- Kipf and Welling (2016) Thomas N Kipf and Max Welling. 2016. Semi-supervised classification with graph convolutional networks. arXiv preprint arXiv:1609.02907 (2016).
- Koren et al. (2009) Yehuda Koren, Robert Bell, and Chris Volinsky. 2009. Matrix factorization techniques for recommender systems. Computer 42, 8 (2009), 30–37.
- Lample et al. (2016) Guillaume Lample, Miguel Ballesteros, Sandeep Subramanian, Kazuya Kawakami, and Chris Dyer. 2016. Neural Architectures for Named Entity Recognition. In Proceedings of the 2016 Conference of the North American Chapter of the Association for Computational Linguistics: Human Language Technologies. Association for Computational Linguistics, San Diego, California, 260–270. https://doi.org/10.18653/v1/N16-1030
- Lappas et al. (2009) Theodoros Lappas, Kun Liu, and Evimaria Terzi. 2009. Finding a team of experts in social networks. In Proceedings of the 15th ACM SIGKDD international conference on Knowledge discovery and data mining. 467–476.
- Law et al. (2014) Vivian Law, Craig Knox, Yannick Djoumbou, Tim Jewison, An Chi Guo, Yifeng Liu, Adam Maciejewski, David Arndt, Michael Wilson, Vanessa Neveu, et al. 2014. DrugBank 4.0: shedding new light on drug metabolism. Nucleic acids research 42, D1 (2014), D1091–D1097.
- Le and Mikolov (2014) Quoc Le and Tomas Mikolov. 2014. Distributed representations of sentences and documents. In International conference on machine learning. 1188–1196.
- Li et al. (2020) Shuangli Li, Tong Xu, Hao Liu, Xinjiang Lu, and Hui Xiong. 2020. Competitive Analysis for Points of Interest. 1265–1274. https://doi.org/10.1145/3394486.3403179
- Li et al. (2015) Yujia Li, Daniel Tarlow, Marc Brockschmidt, and Richard Zemel. 2015. Gated graph sequence neural networks. arXiv preprint arXiv:1511.05493 (2015).
- Litjens et al. (2017) Geert Litjens, Thijs Kooi, Babak Ehteshami Bejnordi, Arnaud Arindra Adiyoso Setio, Francesco Ciompi, Mohsen Ghafoorian, Jeroen Awm Van Der Laak, Bram Van Ginneken, and Clara I Sánchez. 2017. A survey on deep learning in medical image analysis. Medical image analysis 42 (2017), 60–88.
- Liu et al. (2011) Qi Liu, Yong Ge, Zhongmou Li, Enhong Chen, and Hui Xiong. 2011. Personalized travel package recommendation. In 2011 IEEE 11th International Conference on Data Mining. IEEE, 407–416.
- Liu et al. (2020) Yang Liu, Zhi Li, Wei Huang, Tong Xu, and En-Hong Chen. 2020. Exploiting Structural and Temporal Influence for Dynamic Social-Aware Recommendation. Journal of Computer Science and Technology 35 (2020), 281–294.
- Maaten and Hinton (2008) Laurens van der Maaten and Geoffrey Hinton. 2008. Visualizing data using t-SNE. Journal of machine learning research 9, Nov (2008), 2579–2605.
- Martin et al. (2008) Suzanne Martin, Greg Kelly, W George Kernohan, Bernadette McCreight, and Christopher Nugent. 2008. Smart home technologies for health and social care support. Cochrane database of systematic reviews 4 (2008).
- Miller et al. (2017) Tamara P Miller, Yimei Li, Kelly D Getz, Jesse Dudley, Evanette Burrows, Jeffrey Pennington, Azada Ibrahimova, Brian T Fisher, Rochelle Bagatell, Alix E Seif, et al. 2017. Using electronic medical record data to report laboratory adverse events. British journal of haematology 177, 2 (2017), 283–286.
- Parameswaran and Garcia-Molina (2009) Aditya G Parameswaran and Hector Garcia-Molina. 2009. Recommendations with prerequisites. In Proceedings of the third ACM conference on Recommender systems. 353–356.
- Pathak et al. (2017) Apurva Pathak, Kshitiz Gupta, and Julian McAuley. 2017. Generating and personalizing bundle recommendations on steam. In Proceedings of the 40th International ACM SIGIR Conference on Research and Development in Information Retrieval. 1073–1076.
- Rendle et al. (2009) Steffen Rendle, Christoph Freudenthaler, Zeno Gantner, and Lars Schmidt-Thieme. 2009. BPR: Bayesian Personalized Ranking from Implicit Feedback. In Proceedings of the Twenty-Fifth Conference on Uncertainty in Artificial Intelligence (Montreal, Quebec, Canada) (UAI ’09). AUAI Press, Arlington, Virginia, USA, 452–461.
- Veličković et al. (2017) Petar Veličković, Guillem Cucurull, Arantxa Casanova, Adriana Romero, Pietro Lio, and Yoshua Bengio. 2017. Graph attention networks. arXiv preprint arXiv:1710.10903 (2017).
- Wan et al. (2018) Mengting Wan, Di Wang, Jie Liu, Paul Bennett, and Julian McAuley. 2018. Representing and recommending shopping baskets with complementarity, compatibility and loyalty. In Proceedings of the 27th ACM International Conference on Information and Knowledge Management. 1133–1142.
- Wang et al. (2019) Hao Wang, Tong Xu, Qi Liu, Defu Lian, Enhong Chen, Dongfang Du, Han Wu, and Wen Su. 2019. MCNE: An end-to-end framework for learning multiple conditional network representations of social network. In Proceedings of the 25th ACM SIGKDD International Conference on Knowledge Discovery & Data Mining. 1064–1072.
- Wang et al. (2017) Meng Wang, Mengyue Liu, Jun Liu, Sen Wang, Guodong Long, and Buyue Qian. 2017. Safe medicine recommendation via medical knowledge graph embedding. arXiv preprint arXiv:1710.05980 (2017).
- Xue et al. (2017) Hong-Jian Xue, Xinyu Dai, Jianbing Zhang, Shujian Huang, and Jiajun Chen. 2017. Deep Matrix Factorization Models for Recommender Systems.. In IJCAI, Vol. 17. Melbourne, Australia, 3203–3209.
- Zhang et al. (2020) Le Zhang, Tong Xu, Hengshu Zhu, Chuan Qin, Qingxin Meng, Hui Xiong, and Enhong Chen. 2020. Large-Scale Talent Flow Embedding for Company Competitive Analysis. In Proceedings of The Web Conference 2020. 2354–2364.
- Zhang et al. (2014) Ping Zhang, Fei Wang, Jianying Hu, and Robert Sorrentino. 2014. Towards personalized medicine: leveraging patient similarity and drug similarity analytics. AMIA Summits on Translational Science Proceedings 2014 (2014), 132.
- Zhang et al. (2019) Shuai Zhang, Lina Yao, Aixin Sun, and Yi Tay. 2019. Deep learning based recommender system: A survey and new perspectives. ACM Computing Surveys (CSUR) 52, 1 (2019), 1–38.
- Zhang et al. (2015) Yin Zhang, Daqiang Zhang, Mohammad Mehedi Hassan, Atif Alamri, and Limei Peng. 2015. CADRE: Cloud-assisted drug recommendation service for online pharmacies. Mobile Networks and Applications 20, 3 (2015), 348–355.
- Zheng et al. (2020) Zhi Zheng, Tong Xu, Chuan Qin, Xiangwen Liao, Yi Zheng, Tongzhu Liu, and Guixian Tong. 2020. Multi-Source contextual collaborative recommendation for medicine. Journal of computer research and development 57, 8 (2020), 1741–1754.
- Zhu et al. (2014) Tao Zhu, Patrick Harrington, Junjun Li, and Lei Tang. 2014. Bundle recommendation in ecommerce. In Proceedings of the 37th international ACM SIGIR conference on Research & development in information retrieval. 657–666.