Evidence for r-process delay in very metal-poor stars
Abstract
The abundances of -process elements of very metal-poor stars capture the history of the -process enrichment in the early stage of star formation in a galaxy. Currently, various types of astrophysical sites including neutron star mergers, magneto-rotational supernovae, and collapsars, are suggested as the origin of -process elements. The time delay between the star formation and the production of -process elements is the key to distinguish these scenarios with the caveat that the diffusion of -process elements in the interstellar medium may induce the delay in -process enrichment because -process events are rare. Here we study the observed Ba abundance data of very metal-poor stars as the tracer of the early enrichment history of -process elements. We find that the gradual increase of [Ba/Mg] with [Fe/H], which is remarkably similar among the Milky Way and classical dwarfs, requires a significant time delay (100 Myr – 1 Gyr) of -process events from star formation rather than the diffusion-induced delay. We stress that this conclusion is robust to the assumption regarding -process contamination in the Ba abundances because the sources with no delay would overproduce Ba at very low metallicities even without the contribution from the s-process. Therefore we conclude that sources with a delay, possibly neutron star mergers, are the origins of r-process elements.
1 Introduction
Neutron-capture processes are responsible for the synthesis of the heaviest elements in the Universe (Sneden & Cowan, 2003). Burbidge et al. (1957) classify them into two, namely the slow-process (s-process) and the rapid-process (r-process). The astrophysical sites that predominantly contribute to the production of s-process elements are the asymptotic giant branch (AGB) stars (Burbidge et al., 1957; Hollowell & Iben, 1988; Travaglio et al., 2004) while the origin of r-process elements remains one of the biggest mysteries in nuclear astrophysics.
Recently, the observations of the gravitational wave signal and its electromagnetic counterpart from a neutron star merger (NSM), GW170817, provided us with evidence that NSMs eject copious amounts of -process elements (see, e.g., Margutti & Chornock 2020 for a recent review). The merger rate and the mass of the ejected r-process elements derived from the observations of GW170817 agree remarkably well with those estimated from the -process elemental abundances of Galactic stars and ultra-faint dwarf galaxies (UFDs) (Eichler et al., 1989; Ji et al., 2016; Beniamini et al., 2016a; Côté et al., 2018; Hotokezaka et al., 2018; Rosswog et al., 2018) as well as geological measurements of radioactive isotopes (Hotokezaka et al., 2015; Tsujimoto et al., 2017; Bartos & Marka, 2019; Côté et al., 2020; Beniamini & Hotokezaka, 2020).
Even though the NSM scenario for the origin of -process elements successfully explains the total amount of -process elements in the Milky Way, it encounters potential obstacles to the delays between binary formation and merger. For example, a chemical evolution model with a delay time distribution of has difficulty explaining the distribution of stellar Eu abundances at higher metallicities (Hotokezaka et al., 2018; Côté et al., 2019). To overcome this difficulty, several effects have been considered such as neutron star natal kicks, steep delay time distribution, and turbulent diffusion (Wehmeyer et al., 2015; Simonetti et al., 2019; Tsujimoto & Baba, 2019; Banerjee et al., 2020; Dvorkin et al., 2020). This observation is one of the major arguments in support of -process elements being predominantly produced by astrophysical phenomena other than NSMs, such as magneto-rotational supernovae (MRSNe, Nishimura et al. 2015, 2017), peculiar magnetar formation (Metzger et al., 2008; Thompson & ud-Doula, 2018), common envelope jet supernovae (Grichener & Soker, 2019), and collapsars (Siegel et al., 2019). These latter phenomena are associated with the death of massive stars, and therefore they have no delay times between star formation and r-process enrichment.
A critical question for the origin of -process elements is: do we have any direct observational evidence supporting the delay between star formation and the production of -process elements, or are -process elements preferentially produced in the early Universe? We can infer the history of metal enrichment in the Universe through the elemental abundance ratio and the overall metallicity of stars, e.g., the distribution of stellar abundances on a [r/Mg] - [Fe/H] plot. This paper aims to infer the time delay of r-process element production in a largely model-independent fashion and to clarify the origin of r-process elements. Ishimaru et al. (2004) assert that the origin of the r-process elements should not be the highest-mass stars using three stars with low Eu abundances at . However, such measurements can be reconciled if -process events are sufficiently rare because the diffusion process delays the chemical enrichment. Here we use Ba abundances of very metal-poor stars () as the sample. With Ba abundances, which are available in a larger number of stars, we can distinguish the intrinsic delay of the -process from the diffusion delay. In section 2, we briefly describe the scenarios for the astrophysical phenomena suggested as the origin of -process elements. In section 3, we give the compilation of observed data and discuss the trend in the data. In section 4, we discuss the implication of the delay on the origin of the r-process in the Universe.
2 Scenarios for the r-process and delay times
The scenarios for the origin of -process elements are generally classified into three categories according to the relation between the star formation rate (SFR) and the production rate of -process elements: (i) the delay scenario (NSM model), (ii) the no-delay scenario (Rare SN model), and (iii) the “negative” delay scenario (Collapsar model; the origin of “negative” delays is explained below). Any astrophysical scenario for the origin of -process elements falls into one of the three categories. For all the scenarios we assume that -elements are predominantly produced by normal core-collapse SNe (ccSNe) and that the -process events are rare, e.g., of ccSNe. Here we briefly discuss these scenarios.
(i) The delay scenario (NSM model): A prominent feature of NSMs is a significant time delay after the formation of the progenitor stars. In fact, GW170817 occurred in a galaxy with weak star formation activity, suggesting that the time delay between the binary formation and merger is – Gyr (Blanchard et al., 2017; Levan et al., 2017). The delay times of NSMs are widely distributed from a few tens of Myr to longer than a Hubble time, which is described by the delay-time distribution function, :
| (1) |
where is the rate of the -process events, is a time between binary neutron star (BNS) formation and merger, and is the star formation rate. The form of is often assumed to be with a minimum delay . Beniamini & Piran (2019) find a somewhat steeper power law, with , inferred from the orbital separations of the Galactic BNS. In addition, the redshift distribution of short gamma-ray bursts (GRBs) is consistent with a with (Wanderman & Piran, 2015).
(ii) The no-delay scenario (Rare SN model): Peculiar ccSNe such as MRSNe and peculiar magnetar formation are proposed to produce heavy -process elements (Nishimura et al., 2015; Metzger et al., 2008; Thompson & ud-Doula, 2018). Since the evolution of the fraction of these peculiar ccSNe to normal ccSNe evolves is unknown, we assume here that it is constant with time during the Galaxy’s evolution. The production rate of -process elements is then proportional to that of -elements, i.e., .
(iii) The “negative” delay scenario (Collapsar model): Siegel et al. (2019) propose that the massive outflow from the central engine of long GRBs, i.e., collapsars, can be the site of the -process111The nucleosynthesis of heavy elements in collapsars is still under debate (Fujibayashi et al., 2020).. A “negative” delay is somewhat counter-intuitive, when discussing -process enrichment associated with the death of massive stars (which of course occurs after their birth, not before). It should instead be understood in an averaged sense. “Negative” delays from star formation to -process enrichment are a result of the fact that long GRBs preferentially occur in environments with large specific SFR and low metallicities (Svensson et al., 2010; Palmerio et al., 2019). This is perhaps most clearly demonstrated by the redshift distribution of long GRB which peaks at a higher redshift than the cosmic SFR (Wanderman & Piran, 2010). Therefore, we assume that the production ratio of -process elements to -elements decreases with time in this scenario:
| (2) |
where is a decreasing function, which takes into account the enhancement of the event rate of collapsars at the earlier times. In what follows, we assume motivated by the relation between the long GRB rate and cosmic SFR at (Wanderman & Piran, 2010). We caveat that the rate of long GRB in the very early Universe is not well constrained. We note, however, that the “negative” delay scenario is not necessarily limited to collapsars and would apply to other sources which peak at greater than the Cosmic star formation.
3 r-process delay inferred from very metal-poor stars
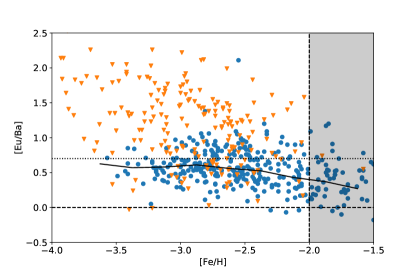
We now turn to constrain the early enrichment history of -process elements by using the r-process abundances of very metal-poor stars. Europium (Eu) is the most commonly used as the r-process tracer element. However, since the absorption lines of Eu are not so strong, the Eu measurements are often unavailable for very metal-poor stars. In such cases, barium (Ba) abundances are used as the tracer of -process elements instead of Eu (François et al., 2007; Duggan et al., 2018). Here we study Ba abundance evolution at the low metallicity range of . Although Ba is also produced by the s-process, the production is dominated by the r-process at this metallicity range. Figure 1 shows the [Eu/Ba] of metal-poor stars in the Milky Way. The value of [Eu/Ba] gradually decreases as the contribution of s-process sets in at . Stars with metallicity lower than that have values of [Eu/Ba] consistent with the r-process. 222The exception is the s-enhanced carbon-enhanced metal-poor (CEMP-s) stars. These stars are part of binaries, and the compositions of the stars are dominated by mass-transfer from the companions. Such stars are not included in this work..
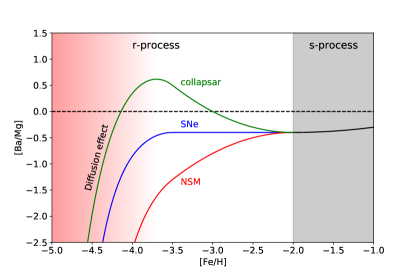
Figure 2 shows a schematic figure of the [Ba/Mg] evolution against [Fe/H]. The Galaxy was metal-poor at early times, and as a result, stars formed very early shape the curve on the left. At such extremely low metallicities, the chemical inhomogeneity of the interstellar medium (ISM) plays an important role because the event rate of the -process is much lower than normal SNe. The r-process elements in the ISM at a given location originate from a single enrichment event (Beniamini & Hotokezaka, 2020). The volume fraction of the highly enriched ISM is very small and therefore typical stars (outside of the enriched areas) have very low [Ba/Mg]. This inhomogeneity effect quickly disappears as more events start to contribute to the enrichment at each location, and the [Ba/Mg] track now represents the intrinsic delay of r-process element production. At , the s-process starts to contribute significantly to the Ba abundances. As we are interested in constraining the -process enrichment, in what follows, we will focus on very metal poor stars with .
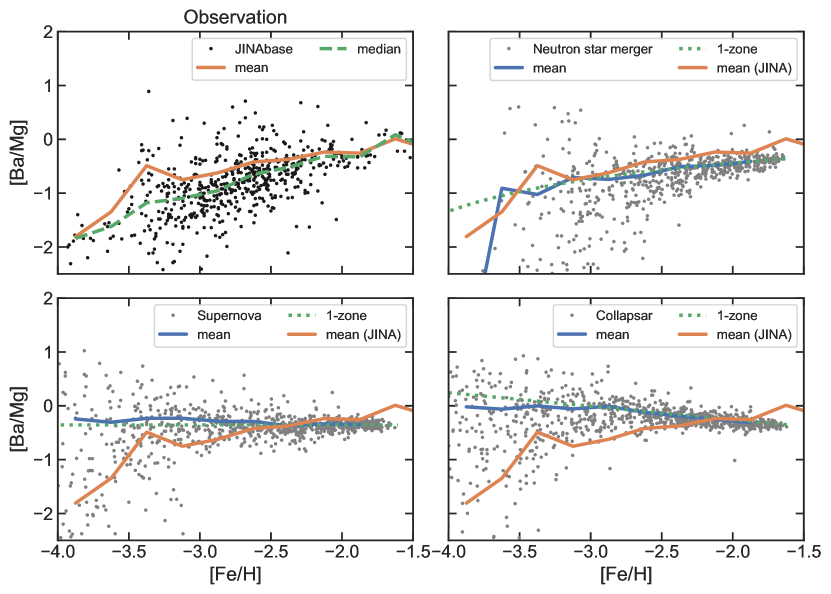
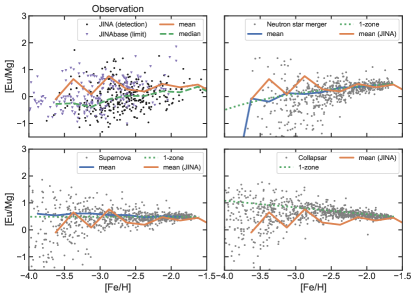
The top-left panel of Figure 3 plots the abundances of the observed metal poor stars. To quantitatively discuss the implications, we over-plot two curves, “linear mean” and median. The linear mean is defined as:
| (3) |
where the index runs from 1 to the number of stars in each [Fe/H] bin. We ignore stars with upper limits. The curves were mostly unchanged even if we assume all upper limit stars to have .
The interpretation of the increasing trend of [Ba/Mg] with [Fe/H] has to be treated with caution. Although the time delay would certainly be the reason for the increase, the inhomogeneity effect could also make a pseudo-increasing trend on the median even without time delay, as we have shown in Figure 2. This is because the abundance distribution has a long tail on the high-abundance end. The skewed abundance distribution naturally arises in the elemental abundance distribution of the ISM in a galaxy. Initially, one r-process event enriches a small portion of the ISM to a very high degree, and it dilutes to the whole galaxy as time passes. If we measure the distribution of the r-process element abundances of the ISM before complete mixing, the median would always be less than the “one-zone” prediction, for which instantaneous mixing is assumed.
In contrast, the linear mean, , is robust to the inhomogeneity of the distribution of r-process elements. It gives appropriate weights to both r-rich and r-poor gas. The deviation from a one-zone model arises because we are comparing the medians, which overestimate the importance of volumetrically dominant r-poor gas. If we assume that Mg and Fe distributions are homogeneous, and we sample the whole system with a sufficient resolution, the linear mean exactly matches the one-zone model with the instant mixing approximation. Therefore we conclude that the increase in the linear mean is a result of the time delay between the production of Mg and -process elements. The remaining problems are the validity of the assumptions. Namely, (i) the homogeneity of the denominator (Mg) and the x-axis (Fe), and (ii) a sufficient sampling of the volume. Although validating these conditions is difficult, we expect that such effects would deviate the linear mean symmetrically from the one-zone calculation. Therefore it is unlikely that the inhomogeneity effect alone gives the clear increasing trend suggested by the observations.
An independent argument is the gradual increase of the median [Ba/Mg]. As we explained above, the inhomogeneity effect can make an increasing trend in the median. However, the increase occurs exponentially, and therefore it would be very abrupt in this case. We can estimate the typical [Fe/H] range of the increase by the total volume fraction of r-rich bubbles. Here we estimate the range () from to assuming that the one-zone value [Ba/Mg]1zone is . The volume of each r-rich bubble ( region) is . The median of [Ba/Mg] roughly converges to [Ba/Mg]1zone when the total volume fraction of r-rich bubbles becomes . The typical volume of each bubble and the number of bubbles grow as and , respectively. Here we have assumed . Thus the total volume fraction grows as . Since [Fe/H] increases logarithmically with the number density of stars formed, we have Therefore, the value of [Fe/H] when the [Ba/Mg] converges to [Ba/Mg]1zone is
| (4) |
We can follow the same procedure to derive the [Fe/H] when the median of [Ba/Mg] surpasses [Ba/Mg] by substituting for 333Assuming a Gaussian distribution, , therefore a region of size has [Ba/Mg] value higher than [Ba/Mg]. The volume of a region is times that of the region. Therefore the total volume fraction of the regions becomes 1 when that of regions is .. Finally, can be derived as , and thus, we obtain the range that the diffusion increase occurs as for . However, the observational data show a slower increase, , which a diffusion-induced increase cannot reproduce.
To demonstrate the effects we have discussed, we run a Monte Carlo simulation of the chemical enrichment of the early phase of the Milky Way evolution, . Note that our model is also applicable to the chemical evolution of other galaxies simply by adopting another SFR evolution. Although our model does not capture outflow from galaxies (Emerick et al., 2018), we expect this not to be problematic as we are discussing short timescales. Figure 3 contains three panels from our model calculations. Here we briefly summarize our synthetic models. We prepare a box filled with hydrogen with a constant density, . The SFR is taken as , and is normalized such that the mean ccSN rate is . Fe and Mg are injected randomly in space with a rate proportional to the SFR. We assume that each ccSN produces (e.g. Nakar et al. 2016) and and each r-process event produces . We fix the overall rate of the r-process events at of ccSNe (Beniamini et al., 2016a; Hotokezaka et al., 2018).
We follow the dilution of the produced Fe, Mg, and r-process elements in the ISM via turbulent mixing with the method used in Hotokezaka et al. (2015); Beniamini & Hotokezaka (2020). The number density of an element at position at time is:
| (5) |
where is the total number of the element produced by each event, are time and spatial position of the -th event, , and is the diffusion coefficient444Once reaches the volume of the box, we fix in order to avoid an artificial leakage of the elements (Beniamini & Hotokezaka, 2020). . Following the results of Beniamini & Hotokezaka (2020) we set the to for the simulation. We track stars formed at random positions in the box. Their abundances are given by the ISM abundances at their birthplaces and times of birth.
Figure 3 shows the results of synthetic data obtained with our models. Also shown is the abundance evolution obtained by using the one-zone models and the linear mean calculated with the same procedures as the real data (equation 3). As we stated above, the mean traces the one-zone prediction in all the models. The SN and Collapsar models overproduce stars with compared with the observed distribution. It is clear that this overproduction of Ba cannot be solved by adding the -process contribution. Furthermore, it is also clear from the figure that the [Ba/Mg] very quickly converges to the one-zone lines within in [Fe/H]. Therefore the observed gradual rise in [Ba/Mg] results from the intrinsic time delay in the production of -process elements relative to the production of Mg, i.e., -process events’ delay from ccSNe. This result supports the idea that NSMs are the source of -process elements in the low metallicity region . We also performed a simulation with motivated by Beniamini & Piran (2019) and obtain a result similar to that with . Finally, we also examine [Eu/Mg] in figure 6. While the stars with Eu detection do not show a clear increasing trend in [Eu/Mg] compared to [Ba/Mg]. However, this is consistent with the rise in [Ba/Mg] if the stars with upper limits on Eu are accounted for.
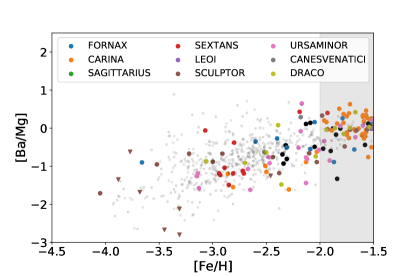
Figure 4 shows the [Ba/Mg] distribution for stars in classical dwarf galaxies. Remarkably, the same increasing [Ba/Mg] - [Fe/H] relation holds also for dwarf galaxies despite the fact that the time scale of chemical enrichment of the dwarf galaxies is longer than that of the MW, although the number of data points may not be very compelling. One can expect that such a similarity arises if (i) the time dependence of their SFHs, i.e. the values of , are similar, (ii) the DTD is very approximately , (iii) is shorter than the time scale of chemical enrichment of the galaxies, e.g., the time scale on which a galaxy evolves to , (iv) the -process and SNe Ia have not contributed significantly to the Ba and Fe abundances, respectively. Therefore the similarity seen in Fig. 4 supports our conclusion of -process delay and suggests that the scenarios with a constant delay time such as are less likely. We have ignored here the outflow efficiency that may be different between galaxies and have a significant impact on the stellar abundances of a galaxy Emerick et al. (2018). Even without considering this effect, the similarity persists robustly. Note that here we omit UFDs because they are so small that they likely have experienced none or only one -process event in the past (Beniamini et al., 2016a). In this case, the distribution of the stellar -process abundances is significantly different from that of galaxies that experienced multiple events and does not reflect the delay (Safarzadeh & Scannapieco, 2017; Beniamini et al., 2018; Tarumi et al., 2020b).
4 Conclusions and discussions
The observed abundance distribution of [Ba/Mg] of the Galactic very metal poor stars clearly shows that [Ba/Mg] significantly increases as [Fe/H] increases at . Such an increase is attributed to the intrinsic time delay of the -process events and/or the delay induced by chemical diffusion in the ISM. We showed that the increase of the linear mean and the gradual increase of the median require an intrinsic time delay of the production of -process elements and cannot be explained solely by the diffusion-induced delay. Therefore we conclude that r-process element production occurs with significant delays at this metallicity range, which is naturally expected in the NSM scenario (Figure 3 and see also Matteucci et al. 2014; Hirai et al. 2015; Wehmeyer et al. 2015; Côté et al. 2019; Simonetti et al. 2019; van de Voort et al. 2020). Any rare SN such as MRSNe and collapsars are not expected to have a significant time delay between the r-process production and Mg production. Consequently, SN models overproduce Ba at very low metallicities even if the contribution of the -process to the Ba abundances is completely ignored. Therefore such sources are incompatible with the observed trend. We conclude that this is a new line of evidence supporting NSMs as the origin of r-process elements at least in low metallicity environments [Fe/H] . Note that it is important to use Ba as the tracer. If we do the same analysis for Eu only with the detected samples, the increasing trend we have discussed is buried under noisy behavior (see §B). By including upper limits as zero abundance, we see a trace of the increasing trend as in Ba.
The [Ba/Mg] abundances of very metal poor stars in some dwarf galaxies also support the existence of significant time delays. Although the sample is small and dwarf galaxies have a different star formation history, most stars are on the same track as the Milky Way stars (Figure 4 and see also Reichert et al. 2020). Therefore the “delay” is likely a common feature, which can be tested with larger samples of the Ba abundances of dwarf galaxies.
Note that Ba is detected in most metal-poor stars as pointed out by Roederer (2013). The apparent “floor” of Ba abundance might indicate that some unknown neutron-capture processes are working in addition to the r-process source. The existence of such an event is also supported from Ba abundances of UFDs (Tarumi et al., 2020a). In this case, the intrinsic increase of [r/Mg] may be steeper than suggested by the Ba observations. However, our argument regarding the increasing mean still holds: stars with such low Ba abundances do not affect the linear mean [Ba/Mg] anyway.
It is possible that a significant fraction of the very metal-poor stars originally formed in dwarf galaxies that are now disrupted. Even in this case our argument remains the same. As Figure 4 shows, the secular evolution is present in each dwarf galaxy. To explain the ubiquitous increasing trend among dwarf galaxies, a delay in r-process enrichment is necessary.
Some globular clusters (GCs) show internal spread of r-process element abundances. The short duration of the star formation makes it difficult for delayed sources to occur within active star formation. However, considering the small internal spread of metallicity within each GC, the difficulty is common also to other origins. It is natural to expect that the star formation in a GC quenches before massive stars contribute to its chemical enrichment. Therefore no r-process events can contribute to the enrichment of this system. One possible solution, is the Eu spread in ISM. The formation process of GCs is poorly understood, and an investigation of the origin of such r-process spread would be interesting.
Further investigation would be needed to explain the trends seen at the higher metallicities (e.g. Buder et al. 2020 for stars in the Milky Way), which supports shorter or no time delay of the r-process events. One difference from the lower [Fe/H] regime is the timescale. At the relatively higher metallicities, [] , where is seen, it reflects delays of –. A similar feature is also found for the Sculptor dwarf galaxy. At where Skúladóttir et al. (2019) report , they also found increasing , which is clear evidence of the delayed contribution from AGB stars. Recently, Matsuno et al. (2021) studied the -process enrichment of Gaia-Enceladus stars. While they found a significant excess in the -process abundance normalized by an -element, i.e., , does not evolve with [Fe/H]. The fact that r-process delays are seen at and not at may indicate that the typical time delay of NSM is the order of a few , consistent with constraints from the Galactic BNS population (Beniamini & Piran, 2019).
The typical delay time of NSM is comparable to or longer than the one of AGB stars. The reason that significant contributions of AGB stars come in only at higher metallicity is likely the metallicity dependence of the s-process. At the lowest metallicity of , the amount of seed nuclei for the s-process nucleosynthesis is small (see, e.g. Käppeler et al. 2011). Therefore, it is naturally expected and consistent with observation that the contribution of AGB stars comes in later than the r-process in NSM.
As mentioned in §1, it was recently suggested that the natal kicks of BNS can play an important role in shaping the -process abundance distribution (Banerjee et al., 2020). This requires the typical center of mass kicks to be . This, however, is in contrast with an analysis of the kinematics of Galactic BNS which suggests that most systems were born with and finding the inferred kicks to be uncorrelated with the observed GW merger times (Beniamini & Piran, 2016). Indeed if kicks had played an important role in the MW chemical evolution, it would have been more difficult to explain the observed -process abundance in Reticulum II (see Beniamini et al. 2016b), whereas the measured abundances in Reticulum II and in classical dwarfs are fully in agreement with estimates from BNS (Beniamini et al., 2016a). An independent constraint comes from short GRBs. The offset distribution of those GRBs relative to the centers of their host galaxies is found to be fully consistent with the underlying distribution of stellar material in the host galaxies (Perets & Beniamini, 2021). This strongly suggests that the effects of kicks are subdominant in determining the merger locations of BNS.
In summary, we found that a significant increase of [r/Mg] at the lowest metallicity stars requires a delay of between star formation and the production of -process elements. No-delay and negative delay sources are incompatible with the observed data, even if we consider the inhomogeneity effect. Since NSMs naturally introduce a comparable delay, it is promising as the origin of r-process in the Universe.
Appendix A Dependence on star formation history
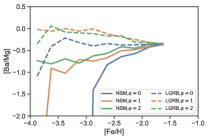
In Figure 5 we show the evolution of mean [Ba/Mg] with three different star formation histories. Solid lines and dashed lines show results with the NSM model and the collapsar model. The NSM models robustly show the increasing trends whereas the collapsar models show decreasing trends. Considering the observed similarity of the increasing trends between the MW and dwarf galaxies (Figure 4), NSM is favored as the origin of the r-process for either of those environments.
Appendix B Analysis with Eu
In Figure 6 we show the analysis with Eu. The increasing trend we have discussed with Ba is not seen because there are a lot of upper limits and the observed population is significantly biased from the true distribution. However, the upper limits at [Fe/H] indicate a weak increasing trend in [Eu/Mg]
References
- Abohalima & Frebel (2018) Abohalima, A., & Frebel, A. 2018, ApJS, 238, 36, doi: 10.3847/1538-4365/aadfe9
- Banerjee et al. (2020) Banerjee, P., Wu, M.-R., & Yuan, Z. 2020, ApJ, 902, L34, doi: 10.3847/2041-8213/abbc0d
- Bartos & Marka (2019) Bartos, I., & Marka, S. 2019, Nature, 569, 85, doi: 10.1038/s41586-019-1113-7
- Beniamini et al. (2018) Beniamini, P., Dvorkin, I., & Silk, J. 2018, MNRAS, 478, 1994, doi: 10.1093/mnras/sty1035
- Beniamini & Hotokezaka (2020) Beniamini, P., & Hotokezaka, K. 2020, MNRAS, 496, 1891, doi: 10.1093/mnras/staa1690
- Beniamini et al. (2016a) Beniamini, P., Hotokezaka, K., & Piran, T. 2016a, ApJ, 832, 149, doi: 10.3847/0004-637X/832/2/149
- Beniamini et al. (2016b) —. 2016b, ApJ, 829, L13, doi: 10.3847/2041-8205/829/1/L13
- Beniamini & Piran (2016) Beniamini, P., & Piran, T. 2016, MNRAS, 456, 4089, doi: 10.1093/mnras/stv2903
- Beniamini & Piran (2019) —. 2019, MNRAS, 487, 4847, doi: 10.1093/mnras/stz1589
- Blanchard et al. (2017) Blanchard, P. K., Berger, E., Fong, W., et al. 2017, ApJ, 848, L22, doi: 10.3847/2041-8213/aa9055
- Buder et al. (2020) Buder, S., Sharma, S., Kos, J., et al. 2020, arXiv e-prints, arXiv:2011.02505. https://arxiv.org/abs/2011.02505
- Burbidge et al. (1957) Burbidge, E. M., Burbidge, G. R., Fowler, W. A., & Hoyle, F. 1957, Reviews of Modern Physics, 29, 547, doi: 10.1103/RevModPhys.29.547
- Côté et al. (2018) Côté, B., Fryer, C. L., Belczynski, K., et al. 2018, ApJ, 855, 99, doi: 10.3847/1538-4357/aaad67
- Côté et al. (2019) Côté, B., Eichler, M., Arcones, A., et al. 2019, ApJ, 875, 106, doi: 10.3847/1538-4357/ab10db
- Côté et al. (2020) Côté, B., Eichler, M., Yagüe, A., et al. 2020, arXiv e-prints, arXiv:2006.04833. https://arxiv.org/abs/2006.04833
- Duggan et al. (2018) Duggan, G. E., Kirby, E. N., Andrievsky, S. M., & Korotin, S. A. 2018, ApJ, 869, 50, doi: 10.3847/1538-4357/aaeb8e
- Dvorkin et al. (2020) Dvorkin, I., Daigne, F., Goriely, S., Vangioni, E., & Silk, J. 2020, arXiv e-prints, arXiv:2010.00625. https://arxiv.org/abs/2010.00625
- Eichler et al. (1989) Eichler, D., Livio, M., Piran, T., & Schramm, D. N. 1989, Nature, 340, 126, doi: 10.1038/340126a0
- Emerick et al. (2018) Emerick, A., Bryan, G. L., Mac Low, M.-M., et al. 2018, ApJ, 869, 94, doi: 10.3847/1538-4357/aaec7d
- François et al. (2007) François, P., Depagne, E., Hill, V., et al. 2007, A&A, 476, 935, doi: 10.1051/0004-6361:20077706
- Fujibayashi et al. (2020) Fujibayashi, S., Shibata, M., Wanajo, S., et al. 2020, Phys. Rev. D, 102, 123014, doi: 10.1103/PhysRevD.102.123014
- Grichener & Soker (2019) Grichener, A., & Soker, N. 2019, ApJ, 878, 24, doi: 10.3847/1538-4357/ab1d5d
- Hirai et al. (2015) Hirai, Y., Ishimaru, Y., Saitoh, T. R., et al. 2015, ApJ, 814, 41, doi: 10.1088/0004-637X/814/1/41
- Hollowell & Iben (1988) Hollowell, D., & Iben, Icko, J. 1988, ApJ, 333, L25, doi: 10.1086/185279
- Hotokezaka et al. (2018) Hotokezaka, K., Beniamini, P., & Piran, T. 2018, International Journal of Modern Physics D, 27, 1842005, doi: 10.1142/S0218271818420051
- Hotokezaka et al. (2015) Hotokezaka, K., Piran, T., & Paul, M. 2015, Nature Physics, 11, 1042, doi: 10.1038/nphys3574
- Ishimaru et al. (2004) Ishimaru, Y., Wanajo, S., Aoki, W., & Ryan, S. G. 2004, ApJ, 600, L47, doi: 10.1086/381496
- Ji et al. (2016) Ji, A. P., Frebel, A., Chiti, A., & Simon, J. D. 2016, Nature, 531, 610, doi: 10.1038/nature17425
- Käppeler et al. (2011) Käppeler, F., Gallino, R., Bisterzo, S., & Aoki, W. 2011, Reviews of Modern Physics, 83, 157, doi: 10.1103/RevModPhys.83.157
- Levan et al. (2017) Levan, A. J., Lyman, J. D., Tanvir, N. R., et al. 2017, ApJ, 848, L28, doi: 10.3847/2041-8213/aa905f
- Margutti & Chornock (2020) Margutti, R., & Chornock, R. 2020, arXiv e-prints, arXiv:2012.04810. https://arxiv.org/abs/2012.04810
- Matsuno et al. (2021) Matsuno, T., Hirai, Y., Tarumi, Y., et al. 2021, arXiv e-prints, arXiv:2101.07791. https://arxiv.org/abs/2101.07791
- Matteucci et al. (2014) Matteucci, F., Romano, D., Arcones, A., Korobkin, O., & Rosswog, S. 2014, MNRAS, 438, 2177, doi: 10.1093/mnras/stt2350
- Metzger et al. (2008) Metzger, B. D., Thompson, T. A., & Quataert, E. 2008, ApJ, 676, 1130, doi: 10.1086/526418
- Nakar et al. (2016) Nakar, E., Poznanski, D., & Katz, B. 2016, ApJ, 823, 127, doi: 10.3847/0004-637X/823/2/127
- Nishimura et al. (2017) Nishimura, N., Sawai, H., Takiwaki, T., Yamada, S., & Thielemann, F. K. 2017, ApJ, 836, L21, doi: 10.3847/2041-8213/aa5dee
- Nishimura et al. (2015) Nishimura, N., Takiwaki, T., & Thielemann, F.-K. 2015, ApJ, 810, 109, doi: 10.1088/0004-637X/810/2/109
- Palmerio et al. (2019) Palmerio, J. T., Vergani, S. D., Salvaterra, R., et al. 2019, A&A, 623, A26, doi: 10.1051/0004-6361/201834179
- Perets & Beniamini (2021) Perets, H. B., & Beniamini, P. 2021, arXiv e-prints, arXiv:2101.11622. https://arxiv.org/abs/2101.11622
- Pritzl et al. (2005) Pritzl, B. J., Venn, K. A., & Irwin, M. 2005, AJ, 130, 2140, doi: 10.1086/432911
- Reichert et al. (2020) Reichert, M., Hansen, C. J., Hanke, M., et al. 2020, A&A, 641, A127, doi: 10.1051/0004-6361/201936930
- Roederer (2013) Roederer, I. U. 2013, AJ, 145, 26, doi: 10.1088/0004-6256/145/1/26
- Rosswog et al. (2018) Rosswog, S., Sollerman, J., Feindt, U., et al. 2018, A&A, 615, A132, doi: 10.1051/0004-6361/201732117
- Safarzadeh & Scannapieco (2017) Safarzadeh, M., & Scannapieco, E. 2017, MNRAS, 471, 2088, doi: 10.1093/mnras/stx1706
- Siegel et al. (2019) Siegel, D. M., Barnes, J., & Metzger, B. D. 2019, Nature, 569, 241, doi: 10.1038/s41586-019-1136-0
- Simonetti et al. (2019) Simonetti, P., Matteucci, F., Greggio, L., & Cescutti, G. 2019, MNRAS, 486, 2896, doi: 10.1093/mnras/stz991
- Skúladóttir et al. (2019) Skúladóttir, Á., Hansen, C. J., Salvadori, S., & Choplin, A. 2019, A&A, 631, A171, doi: 10.1051/0004-6361/201936125
- Sneden & Cowan (2003) Sneden, C., & Cowan, J. J. 2003, Science, 299, 70, doi: 10.1126/science.1077506
- Sneden et al. (2008) Sneden, C., Cowan, J. J., & Gallino, R. 2008, ARA&A, 46, 241, doi: 10.1146/annurev.astro.46.060407.145207
- Suda et al. (2017) Suda, T., Hidaka, J., Aoki, W., et al. 2017, PASJ, 69, 76, doi: 10.1093/pasj/psx059
- Svensson et al. (2010) Svensson, K. M., Levan, A. J., Tanvir, N. R., Fruchter, A. S., & Strolger, L. G. 2010, MNRAS, 405, 57, doi: 10.1111/j.1365-2966.2010.16442.x
- Tarumi et al. (2020a) Tarumi, Y., Suda, T., Grand, R. J. J., et al. 2020a, arXiv e-prints, arXiv:2009.10096. https://arxiv.org/abs/2009.10096
- Tarumi et al. (2020b) Tarumi, Y., Yoshida, N., & Inoue, S. 2020b, MNRAS, 494, 120, doi: 10.1093/mnras/staa720
- Thompson & ud-Doula (2018) Thompson, T. A., & ud-Doula, A. 2018, MNRAS, 476, 5502, doi: 10.1093/mnras/sty480
- Travaglio et al. (2004) Travaglio, C., Gallino, R., Arnone, E., et al. 2004, ApJ, 601, 864, doi: 10.1086/380507
- Tsujimoto & Baba (2019) Tsujimoto, T., & Baba, J. 2019, ApJ, 878, 125, doi: 10.3847/1538-4357/ab22b3
- Tsujimoto et al. (2017) Tsujimoto, T., Yokoyama, T., & Bekki, K. 2017, ApJ, 835, L3, doi: 10.3847/2041-8213/835/1/L3
- van de Voort et al. (2020) van de Voort, F., Pakmor, R., Grand, R. J. J., et al. 2020, MNRAS, 494, 4867, doi: 10.1093/mnras/staa754
- Wanderman & Piran (2010) Wanderman, D., & Piran, T. 2010, MNRAS, 406, 1944, doi: 10.1111/j.1365-2966.2010.16787.x
- Wanderman & Piran (2015) —. 2015, MNRAS, 448, 3026, doi: 10.1093/mnras/stv123
- Wehmeyer et al. (2015) Wehmeyer, B., Pignatari, M., & Thielemann, F. K. 2015, MNRAS, 452, 1970, doi: 10.1093/mnras/stv1352