Dynamical formation of the GW190814 merger
Abstract
We investigate the possible dynamical origin of GW190814, a gravitational wave (GW) source discovered by the LIGO-Virgo-Kagra collaboration (LVC) associated with a merger between a stellar black hole (BH) with mass and a compact object, either a BH or a neutron star (NS), with mass . Using a database of 240,000 -body simulations modelling the formation of NS-BH mergers via dynamical encounters in dense clusters, we find that systems like GW190814 are likely to form in young, metal-rich clusters. Our model suggests that a little excess () of objects with masses in the range in the compact remnants’ mass spectrum leads to a detection rate for dynamically formed “GW190814 -like” mergers of , i.e. within the observational constraints set by the GW190814 discovery, . Additionally, our model suggests that of dynamical NS-BH mergers are compatible with GW190426_152155, the only confirmed NS-BH merger detected by the LVC. We show that the relative amount of light and heavy NS-BH mergers can provide clues about the environments in which they developed.
1 Introduction
The LIGO-Virgo collaboration (LVC) detected recently GW190814, a merger between a BH with mass and a mysterious compact object with mass (The LIGO Scientific Collaboration et al., 2020). The properties of GW190814 challenge our understanding of compact binaries: i) the secondary mass falls in the “lower mass gap”, a range of masses () characterised by the observational absence of stellar remnants (Bailyn et al., 1998; Özel et al., 2012), ii) the mass ratio is small, , iii) and the inferred merger rate is fairly large, . The unusual mass of GW190814 secondary suggests that this merger involved either the heaviest NS or the lightest BH known in a compact binary system. Although the BH hypotesis seems to be the favoured one (The LIGO Scientific Collaboration et al., 2020), the existence of NS with masses up to (e.g. Freire et al., 2008; Tsokaros et al., 2020) or, more in general, the absence of a lower mass gap (e.g. Wyrzykowski & Mandel, 2020; Zevin et al., 2020) cannot be completely ruled out. Whether the secondary is a NS or a BH, matching all GW190814 features – low-mass companion, low mass-ratio, and large merger rate – poses a challenge to astrophysical theories. Population synthesis models for isolated binaries predict mass ratios (Dominik et al., 2012; Marchant et al., 2017; Giacobbo & Mapelli, 2018; Spera et al., 2019), unless special prescriptions are adopted (Eldridge et al., 2017; Giacobbo & Mapelli, 2018). Formation in active galactic nuclei could be a promising channel, although mergers developing in such extreme environments might have larger BH masses, (Yang et al., 2019), but comparable mass ratios, i.e. (Yang et al., 2019; McKernan et al., 2020), than GW190814. Nonetheless, of AGN-assisted mergers can have one of the binary components in the lower mass-gap (Yang et al., 2020). Other explanations include the accretion of material expelled during the NS formation remained bound to the binary due to the large mass of the primary (Safarzadeh & Loeb, 2020), through the development of a hierarchical merger involving two NSs and a BH (Lu et al., 2021) or, more in general, in hierarchical triples assembled either in the field or in dense clusters (e.g. Liu & Lai, 2020). Alternatively, GW190814-like systems may hint at a supernova (SN) mechanism acting on longer timescales than previously thought, thus enabling the proto-compact remnant to accrete enough mass before undergoing explosion (Zevin et al., 2020). However, even in such case the formation of mergers with a secondary mass and mass ratio compatible with GW190814 is almost impossible in the isolated binary scenario, regardless of the SN explosion mechanism assumed (Zevin et al., 2020). Another potential formation channel for GW190814 is via dynamical encounters in a star cluster. The dynamical formation of massive binaries (e.g. BH-BH) is efficient in globular clusters (GCs), where compact remnants undergo dozens of interactions before either merging inside the cluster, or getting ejected and merge afterward (Rodriguez et al., 2016; Askar et al., 2017; Rodriguez et al., 2018). However, binary BHs in GCs tend to have high mass ratios (, Rodriguez et al., 2016), while the formation of NS-BH binaries is suppressed owing to BHs that quench mass segregation of lighter objects. Therefore, the inferred NS-BH merger rate for GCs in the local Universe is rather low, (Clausen et al., 2013; Arca Sedda, 2020; Ye et al., 2020). Young and open clusters (YCs) might be suitable formation sites for NS-BH mergers (Ziosi et al., 2014; Rastello et al., 2020). The large number of YCs expected to lurk in galaxies (up to in Milky Way, e.g. Piskunov et al., 2006) can boost the overall NS-BH merger rate, especially if they contain a high fraction of primordial binaries (Rastello et al., 2020). In a recent work, we explored the NS-BH dynamical formation channel through a suite of 240,000 -body simulations (Arca Sedda, 2020) tailored to reproduce scatterings in star clusters with velocity dispersion km s-1, thus covering the range from YCs to nuclear clusters (NCs). We predict that some NS-BH mergers display distictive features, namely a chirp mass , a BH heavier than , and the absence of an electromagnetic (EM) counterpart even if the BH is highly spinning. In this Letter, we exploit this database to quantify the likelihood for dynamically formed GW190814-like sources.
2 Dynamical NS-BH merger rates and the formation of GW190814-like sources
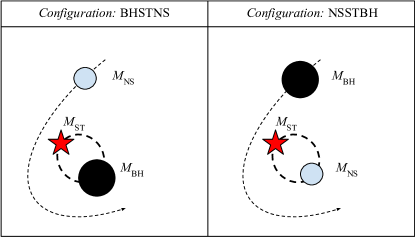
Our simulations (Arca Sedda, 2020) model binary-single hyperbolic encounters involving two compact objects and a normal star through ARGdf (Arca-Sedda & Capuzzo-Dolcetta, 2019), an improved version of the ARCHAIN -body code that implements Post-Newtonian formalism up to order 2.5 (Mikkola & Merritt, 2008) and enables a high-accuracy treatment for close encounters (Mikkola & Tanikawa, 1999). We adopt a mass function for compact objects such that all remnants with a final mass are labelled as NSs, whilst the remaining are labelled as BHs. The database, containing over 240,000 simulations, is dissected into two configurations (see Figure 1): either the binary contains a BH and a star (ST) and the third object is a NS (configuration BHSTNS), or viceversa (NSSTBH). Details about the initial conditions and the mass distribution of the objects involved in the scattering are discussed in Appendix A and B.
We identify mergers, i.e. of the whole sample. To characterise how varies across different values of the velocity dispersion (), we define an individual merger rate (), namely the number of mergers per unit time per cluster, as
| (1) |
i.e. as the product between the fraction of NS-BH mergers () which is measured directly from our simulations, the average number of binaries containing either a NS or a BH that at a given time coexist in the cluster (), and the rate of binary-single interactions that lead to the formation of a NS-BH binary (). We find that there is a tight relation between and , well described by a power-law
| (2) |
In the equation above, km s-1, and and , whose values are summarized in Table 1, are best-fit parameters calculated through a linear regression fit applied to the database of simulated mergers. The functional form above is likely the result of the relation between the parameters involved in Equation 1 and the cluster velocity dispersion. As discussed in Appendix A, the parameter is highly uncertain, as it depends on the mass of the cluster, the retention fraction of both NSs and BHs, and the cluster relaxation time. To constrain this quantity we resort to the suite of GCs Monte Carlo models named the MOCCA Survey Database I (Askar et al., 2017). In MOCCA we find on average for cluster mass and for heavier clusters. Note that the cluster mass and half-mass radius are linked to via (Arca Sedda, 2020)
| (3) |
thus we can uniquely infer the individual merger rate for a cluster with given mass and half-mass radius through its velocity dispersion. Table 2 lists estimates assuming typical values for in YCs, GCs, and NCs. At a redshift , the merger rate associated with a given cluster population can be roughly calculated as (Arca Sedda, 2020; Ye et al., 2020):
| (4) |
where is calculated through Eq. 2, Mpc-3 is the local density of Milky Way equivalent galaxies (Abadie et al., 2010) and is the total number of clusters in the galaxy. A typical NC has Gyr-1, i.e. 1-3 orders of magnitude larger than other cluster types. However, the contribution of NCs to the population of NS-BH is likely rather low, as they are outnumbered by GCs (around 200 in the Milky Way Harris, 2010) and YCs (up to Piskunov et al., 2006). Assuming around 200 GCs and 1 NCs for all MW-like galaxies in the local Universe implies a merger rate and . To explain the LVC inferred rate, the number of binaries with a compact object lurking in typical GCs and NCs should thus be . However, is more likely to be in GCs (e.g. Morscher et al., 2015; Kremer et al., 2020, see also Appendix A) and in NCs (e.g. Arca Sedda et al., 2020), thus suggesting that these environments are unlikely to be main contributor to the population of NS-BH mergers. Extending our calculations to YCs, instead, yields to:
with lower limits corresponding to and the NSSTBH configuration. According to Eq. 3, the values adopted above correspond to a cluster mass assuming pc. Note that such an optimistic rate is obtained assuming that all MW-like galaxies in the local Universe have a number of YCs , each of which contains at least binary that undergoes the type of scattering explored here.
| configuration | |||
|---|---|---|---|
| [Gyr-1] | |||
| BHSTNS | 0.0002 | ||
| 0.02 | |||
| NSSTBH | 0.0002 | ||
| 0.02 |
This rate falls within the LVC measurements (The LIGO Scientific Collaboration et al., 2020) and is in remarkably good agreement with simulations of compact YCs (Rastello et al., 2020). Assuming instead similar number densities for YCs and GCs, Mpc-3, leads to , in agreement with recent results from Fragione & Banerjee (2020) (for more details see Appendix E). The agreement between our models and -body simulations, in spite of the different assumptions adopted, suggests that the dynamical formation of NS-BH binaries is driven mostly by stellar dynamics and is less affected by stellar evolution and post-Newtonian corrections. Our simplified approach enables us to produce a catalogue of NS-BH mergers, which can be used to constrain their overall properties, and to access the NCs mass range, for which full direct simulations are prohibitive.
| [Gyr-1] | ||||||||
| NSSTBH | BHSSTNS | |||||||
| cluster | ||||||||
| type | [] | [pc] | [km s-1] | 0.0002 | 0.02 | 0.0002 | 0.02 | |
| YCs | ||||||||
| YCs | ||||||||
| YCs | ||||||||
| GCs | ||||||||
| NCs | ||||||||
3 Dynamical formation of GW190814 and GW190426_152155
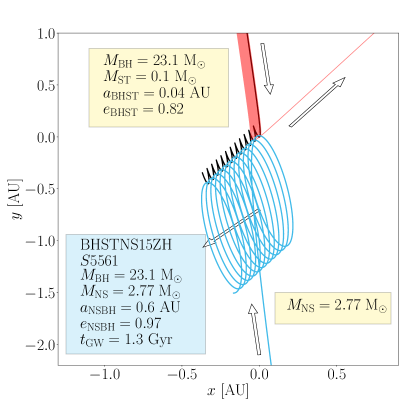
Among all our models we find 11 mergers with a BH with mass and a NS with mass . One interesting example is BHSTNS15ZH-S5561 (configuration BHSTNS, km s-1, metallicity ), which has and , i.e. within and from the GW190814 measured values. As shown in Figure 2, at formation BHSTNS15ZH-S5561 has a semimajor axis AU and eccentricity , merging within Gyr. Note that the large NS mass is due to the adopted mass spectrum for compact remnants, which enable the formation of NS with a maximum mass of at solar metallicity (see Appendix B).
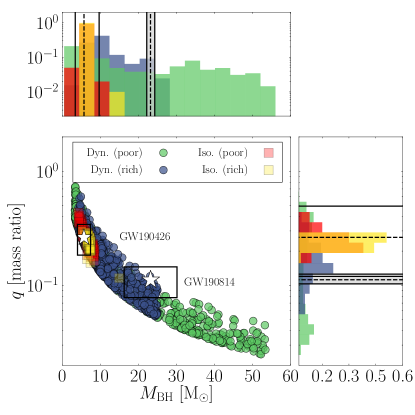
To identify other NS-BH mergers similar to GW190814, we use the BH mass and the mass ratio . Figure 3 compares these quantities for GW190814, our dynamical mergers, and isolated mergers (adapted from Giacobbo & Mapelli, 2018) for metal-poor () and metal-rich () stellar progenitors. It must be noted that Giacobbo & Mapelli (2018) adopts a rapid SN explosion scheme (see Fryer et al., 2012), whereas our model is based on a delayed SN scheme for the calculation of compact remnants’ masses. Nonetheless, updated models of isolated binary evolution accounting for both rapid and delayed SN, which have shown a broad agreement with Giacobbo & Mapelli (2018) models, suggest that the amount of mergers with properties similar to GW190814 is limited to , regardless of the SN mechanism considered (Zevin et al., 2020).
To identify systems similar to GW190814 in our database, we shortlist all mergers having a mass and mass ratio within the of the measured values for GW190814. We find a probability to find GW190814-like mergers in metal-poor configurations BHSTNS and NSSTBH, respectively, and for solar metallicity models. From Equation 2 and Table 2 we can thus derive a rate for mergers similar to GW190814 in YCs as:
with the lower(upper) limits corresponding to the case () km s-1, i.e. the typical value of velocity dispersion for MW young and open clusters(Soubiran et al., 2018; Kuhn et al., 2019; Jackson et al., 2020), and to configuration NSSTBH(BHSTNS).
Using the same procedure, we also seek for mergers similar to GW190426_152155, a NS-BH merger detected during the O3 LVC observation run, characterised by and . We find mergers with primary mass and mass ratio within of the measured value for GW190426_152155 in of our models regardless the progenitor metallicity, thus indicating that dynamical mergers can produce a substantial fraction of systems with a relatively low mass. Note that the interval of and values assumed in this case falls well within the observed credible interval level.
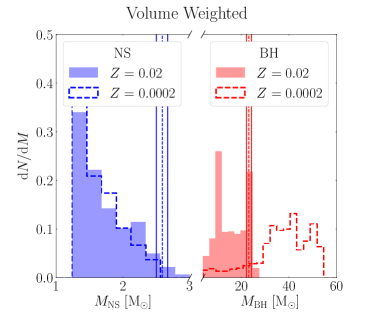
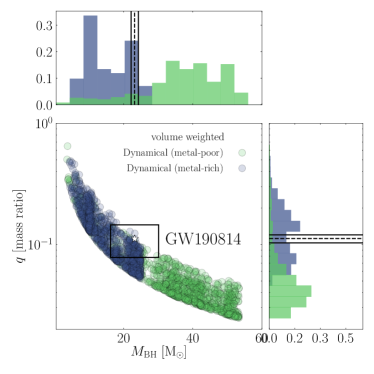
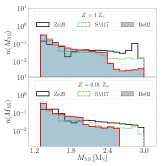
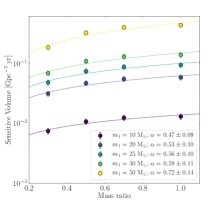
The analysis above does not account for potential observation biases that can affect GW detectors. For instance, the volume within which LIGO can detect a given class of sources depends on several parameters, like the source mass and mass ratio, the distance, the sky location, or the mutual inclination of the spins. For binaries with a total mass , Fishbach & Holz (2017) showed that this volume scales with the primary mass following a power-law and decreases at decreasing the mass ratio . Using Figure 1 in Fishbach & Holz (2017), we extract and at a fixed primary mass value , finding that such relation is well described by a power-law , with . In the following, we adopt a slope , which is the value associated with a primary mass . As we show in Appendix D, setting or , i.e. the values typical of systems with a primary , leads our estimated merger rate to vary by less than . To mimic the selection effect connected with the binary primary and mass ratio, we augment our population of NS-BH mergers to 10,000 by sampling them from the combined distribution and, from the augmented sample, we extract 1,000 NS-BH mergers weighing the probability to select a given mass and mass ratio with the selection functions (with a normalization constant), and (see also Arca Sedda & Benacquista, 2019; Arca Sedda et al., 2020). The resulting volume weighted mass distribution for BHs and NSs, and the plane are shown in Figure 4. The percentage of mergers falling inside the limiting values adopted for GW190814 remains limited to for metal-poor clusters, owing to the fact that heavier BHs have a larger probability to be selected. For metal-rich environments and the BHSTNS configuration, instead, this probability increases to , leading to an optimistic “volume-weighted” merger rate for GW190814-like mergers in YCs of
at redshift and adopting Mpc-3, , and as scaling values. The lower(upper) limit corresponds to configuration NSSTBH(BHSTNS). The same calculation for metal-poor clusters yields to a maximum value of , thus suggesting that a population of metal-rich YCs with km s-1, i.e. pc and , represent the most suited class of environments to explain the origin of GW190814. In comparison, the isolated scenario predicts a merger rate of , regardless of the assumptions on the SN mechanism (Zevin et al., 2020).
In the case of GW190426_152155, our procedure leads to , with the lower(upper) limit referring to (), thus indicating that the contribution of dynamical mergers to the population of low-mass NS-BH mergers can be non negligible.
The merger rates above represent optimistic estimates that rely on the assumption that YCs: 1) have around solar metallicity, 2) have all the same velocity dispersion, and 3) are in MW-like galaxies. The discovery of other mergers similar to GW190814, i.e. with chirp masses and mass ratio could help in placing constraints on the processes that regulate the formation and evolution of young clusters in the local Universe.
Using the volume weighted catalogue, we calculate the percentage of mergers with a primary mass in the ranges , and a companion mass in the range . As summarized in Table 3, we find that a dominant contribution to NS-BH mergers from metal-rich clusters would result in a probability to detect a primary heavier than , whereas for metal poor clusters this probability is comparable for light and heavy primary components.
| [] | [] | [] | |||||
|---|---|---|---|---|---|---|---|
| and | |||||||
| 0.0002 | |||||||
| 0.02 | |||||||
In the extreme case in which NS-BH mergers form dynamically and mostly in metal-rich clusters, the estimate above implies that 9 out of 10 detections of NS-BH mergers would involve a BH with , and 2-3 among them will have a companion with mass . Comparing these predictions with expectations from other channels and actual detections can help in unravelling the markers of different formation channels in detected sources and shed a light on the role of dynamics in determining the assembly of NS-BH mergers.
4 Summary and conclusions
In this Letter we exploited a suite of 240,000 -body simulations of hyperbolic encounters in star clusters to investigate the dynamical formation of NS-BH mergers with properties similar to GW190814 and GW190426_152155. Our main results can be summarized as follows:
-
1.
We find that the NS-BH merger probability depends strongly on the star cluster velocity dispersion, following a power law with slope . Overall, around of our models lead to a NS-BH merger;
-
2.
We derive an individual merger rate, i.e. number of mergers per time unit, for typical NCs (up to mergers per Gyr), GCs ( Gyr-1), and YCs Gyr-1;
-
3.
Since YCs outnumber GCs and NCs by a factor up to in typical galaxies, they might be the major contributor to the population of dynamical NS-BH mergers. In the local Universe, we infer a NS-BH merger rate for YCs of ;
-
4.
Among all simulations, we identify NS-BH mergers with a BH mass and mass ratio compatible with GW190814, and with properties similar to GW190426_152155. We exploit our models to derive a “raw” merger rate for dynamically formed GW190814-like sources, i.e. with mass and mass-ratio within the observed values, of ;
-
5.
To place our models in the context of LVC detections, we assume that the probability to select a NS-BH merger in our sample depends on the primary mass () and mass ratio () to mimic the potential selection effects to which GW detectors might be subjected. This “volume weighted” sample contains only of GW190814-like systems in metal-poor clusters, but this percentage becomes noticeable in metal-rich clusters ();
-
6.
Combining the volume weighted sample of mergers with the large abundance of YCs in Milky Way-like galaxies, we derive an optimistic rate for GW190814-like mergers of at low redshift, in the ballpark of LVC predictions and up to 100 times larger than the estimates obtained from isolated binary stellar evolution models;
-
7.
Using the same selection procedure, we find of mergers with properties comparable to GW190426_152155, with the lower limit corresponding to metal-poor clusters. This relatively low occurrence disfavours, but does not rule out, a dynamical origin for GW190426_152155;
-
8.
We suggest that the mass spectra of compact remnants in NS-BH merger candidates can be used to identify markers of different formation channels. In the extreme case in which all mergers formed dynamically in metal-rich clusters, we predict that 9 out of 10 mergers should involve a BH with and at least 2 of them involve a companion with mass . Comparing these predictions with future detections can shed a light on the dynamical channel and provide new insights on the mass spectrum of compact objects in the lower mass-gap range.
Acknowledgements
MAS acknowledges financial support from the Alexander von Humboldt Foundation for the research program “The evolution of black holes from stellar to galactic scales”, the Volkswagen Foundation Trilateral Partnership through project No. I/97778 “Dynamical Mechanisms of Accretion in Galactic Nuclei”, and the Deutsche Forschungsgemeinschaft (DFG, German Research Foundation) – Project-ID 138713538 – SFB 881 “The Milky Way System”. MAS is grateful to Martina Donnari for providing useful comments to an earlier version of this manuscript.
Appendix A Initial conditions I. Binary-single interaction rates
The idea at the basis of our approach is that BH-NS binaries form via interaction of a free roaming single compact object (a BH or NS) and another compact object (a NS or BH) paired with a star. Here, we consider “NSs” all compact objects with a mass and “BHs” otherwise. Since the two compact objects are heavier than the star, on average this configuration favours the ejection of the least massive component and the formation of a binary with a higher binding energy (Sigurdsson & Phinney, 1993). We explore two different configurations: NSSTBH (NS-star binary impacting over a single BH), and BHSTNS (BH-star binary impacting over a single NS), and we vary the stellar metallicity to either or and the cluster velocity dispersion to km s-1, thus covering the range of values going from young massive clusters (YCs), to globular clusters (GCs) and nuclear clusters (NCs).
In such stellar ensembles, the interaction rate between a binary with component mass , semimajor axis , and eccentricity , and a single object with mass can be written as
| (A1) |
being the average number of binaries coexisting in the cluster that contain either an NS or a BH, the density of scattering stars, the environment velocity dispersion, and the binary cross section
| (A2) |
The density of a population of (either BHs or NSs) with mean mass inhabiting a cluster with mass and half-mass radius can be estimated as . For BHs, this quantity can be inferred for instance from recent studies on BH retention fraction and consequent formation of a tight BH subsystem (Breen & Heggie, 2013; Morscher et al., 2015; Arca Sedda et al., 2018). In this work, we assume that the segregated population of BHs has a density comparable to the overall density of the cluster, , as suggested in Arca Sedda et al. (2018). For NSs instead, we consider the fact that mass-segregation is prevented by the presence of BHs in the cluster centre, and that their total mass is around 0.01 times the cluster mass. Thus, we adopt as an upper limit on the average density of NSs. The number of binaries in the cluster is a crucial parameter. To bracket this quantity, we take advantage of the MOCCA Survey Database I (Askar et al., 2017), a suite of around 2,000 Monte Carlo models of star clusters with initial masses in the range , thus covering the mass range of massive YCs and GCs.
Using the MOCCA models, we calculate the average number of binaries containing a BH(NS) in cluster at different times ( Gyr respectively) and in different mass bins, as shown in Figure 5.
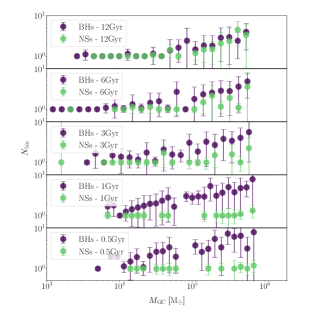
The figure highlights a clear, although non-trivial, dependence between and the cluster mass. Clusters lighter than are characterised by for NS in binaries regardless of the cluster mass, while it ranges in between for BHs, especially at earlier times. This is likely due to the fact that low-mass clusters have shorter relaxation times, thus the formation of binaries containing BHs and their ejection via strong scatterings occur earlier than in heavier mass clusters. At values instead, the number of BH in binaries varies between , almost regardless of the time, whereas the number of NS in binaries tends to be smaller , especially at earlier times. Given this non-trivial behaviour, in our calculations we leave as a scaling value.
We note that this assumption is compatible with results of other models (see e.g. Morscher et al., 2015), even the most recent one that implements updated stellar evolution for binary and single stars, new prescriptions for SN explosion mechanisms and recoil kicks, and post-Newtonian formalism for compact object interactions (e.g. Kremer et al., 2020), thus suggesting that the number of binaries left in the cluster at late evolutionary stages is likely the result of dynamics, rather than other mechanisms that, on the other hand, can affect the cluster structure.
Under the set of assumptions above, adopting a cluster velocity dispersion of km s-1, and using the median values of the masses of the binary and third object and the binary semimajor axis and eccentricity, we estimate an interaction rate of Gyr-1 for configuration NSSTBH and Gyr-1 for configuration BHSTNS.
To check the reliability of our calculations, we compare our results with MOCCA models as described in our companion paper (Arca Sedda, 2020), finding a range of values fully compatible with our theoretical estimate.
Appendix B Initial conditions II. Mass and orbital properties of binary-single scattering experiments
The binary-single scattering configuration explored in this work is characterised by the masses of the three objects (star, BH, and NS), the orbit of the initial binary, and the orbital properties of the single-binary interaction.
We sample the zero age main sequence (ZAMS) mass of the three objects from a Salpeter mass function. At metallicity values (), we assume that all stars with a ZAMS mass () evolve into BHs (Belczynski et al., 2002; Spera & Mapelli, 2017), whereas lighter stars with a mass above () evolve into NSs.
For stars, we select only masses in the range M⊙. This choice is motivated by the fact that the timescale associated with the binary single scatterings modelled here is 10-100 times longer than the half-mass relaxation time of the host cluster (see Appendix C), thus generally longer than the evolutionary time for stars with a mass M⊙, which is Gyr, depending on the metallicity. Stars with a mass , which constitute of the whole stellar population, evolve on timescales ( Gyr) comparable to the cluster relaxation time, depending on the cluster velocity dispersion. For these stars, a proper modelling should also consider the evolutionary stage of the star, a feature that cannot be accounted for in our -body models. Given the fact that they constitute a little fraction of the stellar population, as stars with a mass constitute over the of the whole population, and that their stellar evolution timescale is close (or even longer) than the typical time for the scatterings studied here, we exclude stars from our models.
For BHs, we adopt the mass spectrum described in Spera & Mapelli (2017) (hereafter SM17). In SM17 the authors use the SEVN tool. This tool implements prescriptions for single stellar evolution that include several SN explosion mechanisms and a treatment for pair instability and pulsational pair instability SNe, which naturally lead to a dearth of compact remnants with a mass in the range (the so-called upper mass gap). To derive the BH mass from the ZAMS mass we exploit Table 1-3 in Spera & Mapelli (2017)111The SEVN code was note publicly available when this study began., according to which the compact remnant mass is calculated adopting the delayed SN explosion mechanism (Fryer et al., 2012).
For NS, instead, we adopt the single star stellar evolution model from Belczynski et al. (2002) (hereafter Be02) implemented in the BSE package (Hurley et al., 2002). The maximum NS mass in our models reaches () M⊙ for (), with a small fraction of NSs () at solar metallicities having a mass , thus enabling us to explore the lower mass-gap region.
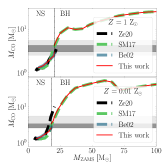
The combined use of SM17 prescriptions for BHs and Be02 for NSs leads our simulations to naturally exhibit a narrow lower mass-gap in the range at solar metallicity and for metal-poor systems. Figure 6 compares the relation between the ZAMS and the remnant masses and the compact remnants’ mass spectrum adopted here, in SM17, in Be02, and the new single stellar evolution models described in Zevin et al. (2020) (hereafter Ze20). We note that the mass spectrum adopted here is half-way between the case in which a wide lower mass-gap do exist and that in which NSs and BHs are linked by a continuous mass spectrum, and can provide a description of how the delayed SN mechanism or, more in general, an explosion mechanism that leads to a narrower mass-gap, can impact the properties of dynamically formed NS-BH mergers. In fact, our simulations suggest that an excess of of compact remnants with masses in the range M⊙ can lead to a dynamical merger rate compatible with LIGO expectations.
We note that the delayed SN model adopted here is only one among many possibilities, e.g. rapid SN mechanism (Fryer et al., 2012), electron-capture SN (Podsiadlowski et al., 2004). Nonetheless, none of the current models in the literature is capable of capturing the complex phases of SN physics, especially in the case of core-collapse SN, which can be altered significantly by stellar rotation (Mapelli et al., 2020) and requires full 3D hydrodynamical simulations to be fully unveiled (e.g. Burrows et al., 2019). From the theoretical point of view, recent single and binary stellar evolution population synthesis suggest that matching the GW190814 features requires that SN explosion proceeds on timescale longer than typically assumed (Zevin et al., 2020). Moreover, observations of NSs and BHs detected through their electromagnetic counterparts seem to be inconclusive about the existence of a lower mass-gap, suggesting that it might be populated of both massive NSs (Freire et al., 2008) and light BHs (Giesers et al., 2018; Thompson et al., 2019). This is also suggested by recent measurements based on microlensing events detected by the OGLE survey coupled with GAIA DR2 data, which favor a continuous mass spectrum in the mass range, rather than a lower mass-gap (Wyrzykowski & Mandel, 2020).
Regarding the orbital properties of the binary and the incoming object, as detailed in our companion paper (Arca Sedda, 2020) we assume that the binary-single interaction is hyperbolic and in the regime of strong deflection. For the binary, we adopt as minimum semimajor axis the maximum between 100 times the star’s Roche lobe and 1000 times the ISCO of the compact object in the binary, to avoid that the star is disrupted or swallowed before the scattering takes place. The maximum semimajor axis allowed is, instead, calculated as the minimum between the hard-binary separation (Heggie, 1975) and the relation suggested by Rodriguez et al. (2016), who have shown that dynamically processed binaries have typical semimajor axis proportional to the binary reduced mass and the ratio between the cluster mass and semimajor axis, namely . We adopt , which produces semimajor axis distribution in full agreement with binary-single scatterings of this kind found in MOCCA simulations with a km s-1 (see Figure 10 in Arca Sedda, 2020).
Appendix C Criteria for the identification of merger candidates.
To identify NS-BH merger candidates we refine the selection procedure described in Arca Sedda (2020) as follows. We first calculate the GW timescale for all binaries, assuming (Peters, 1964)
| (C1) |
and
| (C2) |
We mark all NS-BH binaries with Gyr as ”merger candidates”. To determine whether these candidates can undergo merger in a cluster environment we need to infer the time at which the scattering takes place, i.e. the NS-BH binary formation time , and the timescale over which the binary can get disrupted, e.g. via further strong encounters or secular perturbations.
In a real cluster, the NS-BH binary formation time depends on a number of factors: the mass segregation time-scale, the core-collapse process, the formation of binaries and multiples in the cluster core, the formation or not of a BH subsystem. All these features are not captured by our three-body models, but are naturally accounted for in the MOCCA models. Therefore, we use a multi-stepped approach exploiting these high-resolution Monte Carlo models. First, we use the MOCCA database to reconstruct the logarithmic distribution of the ratio between and the half-mass cluster relaxation time calculated at 12 Gyr for all NS-BH binaries formed in MOCCA models,
| (C3) |
where the relaxation time is calculated as (Binney & Tremaine, 2008)
| (C4) |
This enables us to provide an estimate of for a given value of the cluster relaxation time, which is directly connected with the cluster velocity dispersion, mass, and half-mass radius (Binney & Tremaine, 2008).
The disruption of the NS-BH binary can be driven by either impulsive mechanisms, e.g. due to a strong encounter with another compact object, or diffusive mechanisms, e.g. due to the effect of the continuous interactions with passing-by stars or the mean field of the cluster.
If the binary is soft, i.e. (Heggie, 1975), we can distinguish between a catastrophic regime, i.e. the binary is disrupted in a single interaction, and a diffusive regime, i.e. the binary is disrupted owing to the secular effect impinged by interactions with cluster stars. A catastrophic interaction occurs if the impact parameter falls below a maximum value (Binney & Tremaine, 2008)
| (C5) |
otherwise, the binary evolution is dominated by the secular, diffusive, mechanism.
In the catastrophic regime, the binary disruption occurs over a timescale (Bahcall et al., 1985)
| (C6) |
In the diffusive regime, the binary can disrupt via high-speed encounters with perturbers of mass , a process characterised by a time scale (Heggie, 1975; Binney & Tremaine, 2008)
| (C7) |
where is a factor inferred from scattering experiments (Bahcall et al., 1985) and represents the perturbers number density. However, if these encounters are sufficiently rare, the binary can undergo disruption secularly, due to the cumulative effect of all the weak interactions with cluster stars over. This process takes place over an evaporation time (Binney & Tremaine, 2008):
| (C8) |
If the binary is hard, instead, an interaction with a passing-by star tends, on average, to harden the binary further (Heggie, 1975). As the binary hardens, the encounters become rarer but more violent, possibly resulting in the ejection of the binary over a time
| (C9) |
where is the cluster relaxation time and is a parameter derived from scattering experiments (Goodman & Hut, 1993; Heggie & Hut, 2003).
All the timescales listed above depend on the cluster properties and the average values of scattering parameters. However, our three-body simulations are a) uniquely defined by the cluster velocity dispersion, which is degenerate in the cluster mass and half-mass radius through Equation 3, and b) do not take into account the disruption, evaporation, or ejection processes. To partly solve the degeneracy and provide a more reliable description of the possible NS-BH outcomes, we adopt the following treatment to determine whether the NS-BH is likely to survive further stellar encounters and eventually merge.
For each NS-BH merger candidate we create a sample of 100 clusters with the same velocity dispersion but a half-mass radius selected from the observed distribution for GCs (Harris, 2010) and NCs (Georgiev & Böker, 2014; Georgiev et al., 2016). For each cluster model, we create 100 different scattering parameters to obtain all the relevant timescales in Eqs. C3-C9. First, we select the formation time through the following steps:
-
•
extract the value from the distribution reconstructed through MOCCA models;
-
•
extract the cluster half-mass radius from the observed distribution of Galactic GCs and local NCs;
-
•
combine and (which is fixed for each model) to calculate the cluster mass and the corresponding relaxation time from Equation C4;
for each -th version of the same NS-BH merger candidate in a different environment, the formation time is thus uniquely defined as . This sampling is done for each value of the velocity dispersion explored here, i.e. km s-1.
To characterise the disruption processes, instead, we extract an impact parameter from a linear distribution , as expected from geometrical considerations, limited above by the cluster free mean path and below by 0.1 times the binary semimajor axis, i.e. sufficiently hard to pose a threat to the binary survival222We verified that decreasing further this limit does not impact the results.. The mass of the perturber is extracted from a power-law mass function with slope limited in the range . However, it must be noted that if the cluster core is dominated by heavy remnants, the mass function can be significantly steeper. For instance, if the cluster contains a BH subsystem, Arca Sedda et al. (2018) suggested that half of the mass inside the subsystem is contributed from stars and the remaining in BHs. If we assume that stellar BHs have masses in the range and that the overall mass function in the subsystem is described by a power-law, it is possible to show that inside the subsystem . We found that a steeper mass function decreases the number of merger candidates by .
If the binary is soft, we check whether it is in the diffusive () or in the catastrophic regime, calculating the corresponding disruption timescales.
According to this statistical procedure, each NS-BH is characterised by 10,000 potential outcomes. We identify as potential mergers those fullfilling one of the following conditions:
-
•
Gyr and if the binary is soft and in the catastrophic regime,
-
•
Gyr and if the binary is soft and in the diffusive regime,
-
•
the binary is hard.
If one of the conditions is fullfilled in at least of the interactions modelled for the same NS-BH candidate, we label it as a merger. The number of times the merging binary has been identified as hard () or soft () determines the binary status, which is labelled as “hard” if or “soft” otherwise. Similarly, we label the merger as in-cluster or ejected depending on the number of times that the binary has been identified as a candidate for ejection before merging or not.
We repeated the same procedure 10 times to verify the impact of randomization onto the calculation of the individual merger rate (Equation 2) and we notice an overall variation of in the values quoted in Table 4.
In general, we find that the vast majority of NS-BH mergers in our models come from hard binaries (), with the fraction reaching the maximum in correspondence of lower-velocity dispersion clusters. Around of mergers in hard binaries and in clusters with km s-1 are ejected from the parent cluster before the merger takes place.
| configuration | |||||
|---|---|---|---|---|---|
| [Z⊙] | [km s-1] | [%] | [%] | [%] | |
| NSSTBH | 0.0002 | 5 | 0.0 | 100.0 | 0.0 |
| 0.0002 | 15 | 0.0 | 95.2 | 4.8 | |
| 0.0002 | 20 | 0.0 | 90.3 | 9.7 | |
| 0.0002 | 35 | 0.0 | 98.5 | 1.5 | |
| 0.0002 | 50 | 1.7 | 98.3 | 0.0 | |
| 0.0002 | 100 | 15.5 | 84.5 | 0.0 | |
| BHSTNS | 0.0002 | 5 | 0.0 | 100.0 | 0.0 |
| 0.0002 | 15 | 0.0 | 90.9 | 9.1 | |
| 0.0002 | 20 | 0.0 | 95.5 | 4.6 | |
| 0.0002 | 35 | 2.3 | 97.7 | 0.0 | |
| 0.0002 | 50 | 7.3 | 91.0 | 1.8 | |
| 0.0002 | 100 | 5.5 | 94.5 | 0.0 | |
| NSSTBH | 0.02 | 5 | 0.0 | 100.0 | 0.0 |
| 0.02 | 15 | 4.0 | 88.0 | 8.0 | |
| 0.02 | 20 | 0.0 | 88.1 | 11.9 | |
| 0.02 | 35 | 0.0 | 95.1 | 4.9 | |
| 0.02 | 50 | 3.0 | 94.1 | 3.0 | |
| 0.02 | 100 | 10.6 | 88.7 | 0.7 | |
| BHSTNS | 0.02 | 5 | 0.0 | 100.0 | 0.0 |
| 0.02 | 15 | 0.0 | 91.7 | 8.3 | |
| 0.02 | 20 | 0.0 | 94.4 | 5.6 | |
| 0.02 | 35 | 0.0 | 98.5 | 1.5 | |
| 0.02 | 50 | 1.0 | 99.0 | 0.0 | |
| 0.02 | 100 | 4.4 | 95.6 | 0.0 |
Appendix D The role of the detector sensitivity
The detection of a GW source depends intrinsically on several parameters, such as the distance at which the merger took place, the direction of the wave hitting the detector, and the properties of the binary emitting GWs. Recently, Fishbach & Holz (2017) have shown that the volume () accessible to the LIGO detector scales with the mass of the primary through a power-law , with , assuming and at a fixed mass ratio, and increases at increasing the mass ratio if the primary mass is kept fixed (e.g. cfr. with their Figure 1). In order to take into account this observational bias in our analysis, we extract the data from Fishbach & Holz (2017) Figure 1333We use the data extraction tool https://apps.automeris.io/wpd/.. We associate to the extracted data a conservative error of and reconstruct the dependence between the volume and the mass ratio at fixed primary mass. As shown in Figure 7, we find, for primary masses in the range , that the volume-mass ratio relation is well represented by a power-law with a slope in the range . Given the mass of the primary in GW190814 we adopt in the main analysis, although we test also the cases and for the sake of comparison. Table 5 lists the probability to find a GW190814-like merger in our database once this ”volume weighting” procedure is taken into account. We find that varying the slope in the relation causes a maximum variation in of up to . Due to this, in our calculations we assume a for solar metallicity systems and for mergers with metal-poor progenitors.
| Z | |||
|---|---|---|---|
| 0.0002 | 4.04 | 4.32 | 4.63 |
| 0.02 | 23.2 | 21.8 | 22.1 |
Appendix E Comparison with similar works
In this section we compare our inferred merger rate with recent results obtained through full -body simulations of YCs (Rastello et al., 2020; Fragione & Banerjee, 2020).
To perform the comparison, we make use of Equation 3 to derive the mass, half-mass radius, or velocity dispersion of host clusters. For the sake of comparison, Figure 8 shows the link between these three parameters and highlights typical values for Galactic GCs, YCs, and the NC.
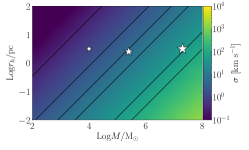
.
Rastello et al. (2020) predict a global merger rate of , but only of these mergers form dynamically, thus implying a dynamical merger rate of . The simulations presented by Rastello et al. (2020) focus on star clusters with masses in the range and half-mass radii pc, corresponding to a velocity dispersion km s-1, according to our Equation 3.
In this range of values, our inferred individual merger rate is roughly Gyr-1, depending on the metallicity (the larger the metallicity the lower the rate) and configuration (BHSTNS produces more mergers).
If we assume that Rastello et al. (2020) models represent the “normal” population of YCs in a MW-sized galaxy, we infer a merger rate of (see Equation 2 in the main paper), thus bracketing the value inferred from direct models. Note that the assumption that the density of YCs in the local Universe is 2.31 Mpc-3 (e.g. similar to that of globular clusters Rodriguez et al., 2016; Ye et al., 2020; Fragione & Banerjee, 2020) leads to a merger rate of . In a more recent work, Fragione & Banerjee (2020) explored the output of 65 -body simulations of clusters with masses and half-mass radii pc (Banerjee, 2020). The authors find 15 NS-BH binaries formed over a 10 Gyr timescale, but none of them merging within a Hubble time. Adopting an average density for the cosmic YCs population of Mpc-3, the authors derive an upper limit on the NS-BH merger rate of . For these models, the velocity dispersion inferred from Equation 2 in the main paper is km s-1. According to our calculations, the individual merger rate for these types of clusters is Gyr-1, depending on the configuration and the metallicity. This implies a local Universe merger rate of , thus embracing predictions for both massive YCs (Fragione & Banerjee, 2020) and globular clusters (, Ye et al., 2020).
Despite our models rely upon several physically motivated key assumptions, they capture the essential elements of dynamical NS-BH formation, leading to merger rates in broad agreement with the results obtained with more detailed models. Our models thus provide a complementary view on the NS-BH mergers formation process, enabling the possibility to collect statistically significant sample of candidates that can be used to place constraints on the properties of the overall NS-BH merger population.
References
- Abadie et al. (2010) Abadie, J., Abbott, B. P., Abbott, R., LIGO Scientific Collaboration, & Virgo Collaboration. 2010, Classical and Quantum Gravity, 27, 173001, doi: 10.1088/0264-9381/27/17/173001
- Arca Sedda (2020) Arca Sedda, M. 2020, Communications Physics, 3, 43, doi: 10.1038/s42005-020-0310-x
- Arca Sedda et al. (2018) Arca Sedda, M., Askar, A., & Giersz, M. 2018, MNRAS, 479, 4652, doi: 10.1093/mnras/sty1859
- Arca Sedda & Benacquista (2019) Arca Sedda, M., & Benacquista, M. 2019, MNRAS, 482, 2991, doi: 10.1093/mnras/sty2764
- Arca-Sedda & Capuzzo-Dolcetta (2019) Arca-Sedda, M., & Capuzzo-Dolcetta, R. 2019, MNRAS, 483, 152, doi: 10.1093/mnras/sty3096
- Arca Sedda et al. (2020) Arca Sedda, M., Mapelli, M., Spera, M., Benacquista, M., & Giacobbo, N. 2020, ApJ, 894, 133, doi: 10.3847/1538-4357/ab88b2
- Askar et al. (2017) Askar, A., Szkudlarek, M., Gondek-Rosińska, D., Giersz, M., & Bulik, T. 2017, MNRAS, 464, L36, doi: 10.1093/mnrasl/slw177
- Bahcall et al. (1985) Bahcall, J. N., Hut, P., & Tremaine, S. 1985, ApJ, 290, 15, doi: 10.1086/162953
- Bailyn et al. (1998) Bailyn, C. D., Jain, R. K., Coppi, P., & Orosz, J. A. 1998, ApJ, 499, 367, doi: 10.1086/305614
- Banerjee (2020) Banerjee, S. 2020, arXiv e-prints, arXiv:2004.07382. https://arxiv.org/abs/2004.07382
- Belczynski et al. (2002) Belczynski, K., Kalogera, V., & Bulik, T. 2002, ApJ, 572, 407, doi: 10.1086/340304
- Binney & Tremaine (2008) Binney, J., & Tremaine, S. 2008, Galactic Dynamics: Second Edition (Princeton University Press)
- Breen & Heggie (2013) Breen, P. G., & Heggie, D. C. 2013, MNRAS, 432, 2779, doi: 10.1093/mnras/stt628
- Burrows et al. (2019) Burrows, A., Radice, D., & Vartanyan, D. 2019, MNRAS, 485, 3153, doi: 10.1093/mnras/stz543
- Clausen et al. (2013) Clausen, D., Sigurdsson, S., & Chernoff, D. F. 2013, MNRAS, 428, 3618, doi: 10.1093/mnras/sts295
- Dominik et al. (2012) Dominik, M., Belczynski, K., Fryer, C., et al. 2012, ApJ, 759, 52, doi: 10.1088/0004-637X/759/1/52
- Eldridge et al. (2017) Eldridge, J. J., Stanway, E. R., Xiao, L., et al. 2017, PASA, 34, e058, doi: 10.1017/pasa.2017.51
- Feldmeier et al. (2014) Feldmeier, A., Neumayer, N., Seth, A., et al. 2014, A&A, 570, A2, doi: 10.1051/0004-6361/201423777
- Fishbach & Holz (2017) Fishbach, M., & Holz, D. E. 2017, ApJ, 851, L25, doi: 10.3847/2041-8213/aa9bf6
- Fragione & Banerjee (2020) Fragione, G., & Banerjee, S. 2020, arXiv e-prints, arXiv:2006.06702. https://arxiv.org/abs/2006.06702
- Freire et al. (2008) Freire, P. C. C., Ransom, S. M., Bégin, S., et al. 2008, ApJ, 675, 670, doi: 10.1086/526338
- Fryer et al. (2012) Fryer, C. L., Belczynski, K., Wiktorowicz, G., et al. 2012, ApJ, 749, 91, doi: 10.1088/0004-637X/749/1/91
- Georgiev & Böker (2014) Georgiev, I. Y., & Böker, T. 2014, MNRAS, 441, 3570, doi: 10.1093/mnras/stu797
- Georgiev et al. (2016) Georgiev, I. Y., Böker, T., Leigh, N., Lützgendorf, N., & Neumayer, N. 2016, MNRAS, 457, 2122, doi: 10.1093/mnras/stw093
- Giacobbo & Mapelli (2018) Giacobbo, N., & Mapelli, M. 2018, MNRAS, 480, 2011, doi: 10.1093/mnras/sty1999
- Giesers et al. (2018) Giesers, B., Dreizler, S., Husser, T.-O., et al. 2018, MNRAS, 475, L15, doi: 10.1093/mnrasl/slx203
- Goodman & Hut (1993) Goodman, J., & Hut, P. 1993, ApJ, 403, 271, doi: 10.1086/172200
- Harris (2010) Harris, W. E. 2010, arXiv e-prints, arXiv:1012.3224. https://arxiv.org/abs/1012.3224
- Heggie & Hut (2003) Heggie, D., & Hut, P. 2003, Classical and Quantum Gravity, 20, 4504, doi: 10.1088/0264-9381/20/20/603
- Heggie (1975) Heggie, D. C. 1975, MNRAS, 173, 729, doi: 10.1093/mnras/173.3.729
- Hurley et al. (2002) Hurley, J. R., Tout, C. A., & Pols, O. R. 2002, MNRAS, 329, 897, doi: 10.1046/j.1365-8711.2002.05038.x
- Jackson et al. (2020) Jackson, R. J., Jeffries, R. D., Wright, N. J., et al. 2020, MNRAS, doi: 10.1093/mnras/staa1749
- Kremer et al. (2020) Kremer, K., Ye, C. S., Rui, N. Z., et al. 2020, ApJS, 247, 48, doi: 10.3847/1538-4365/ab7919
- Kuhn et al. (2019) Kuhn, M. A., Hillenbrand, L. A., Sills, A., Feigelson, E. D., & Getman, K. V. 2019, ApJ, 870, 32, doi: 10.3847/1538-4357/aaef8c
- Liu & Lai (2020) Liu, B., & Lai, D. 2020, arXiv e-prints, arXiv:2009.10068. https://arxiv.org/abs/2009.10068
- Lu et al. (2021) Lu, W., Beniamini, P., & Bonnerot, C. 2021, MNRAS, 500, 1817, doi: 10.1093/mnras/staa3372
- Mapelli et al. (2020) Mapelli, M., Spera, M., Montanari, E., et al. 2020, ApJ, 888, 76, doi: 10.3847/1538-4357/ab584d
- Marchant et al. (2017) Marchant, P., Langer, N., Podsiadlowski, P., et al. 2017, A&A, 604, A55, doi: 10.1051/0004-6361/201630188
- McKernan et al. (2020) McKernan, B., Ford, K. E. S., & O’Shaughnessy, R. 2020, arXiv e-prints, arXiv:2002.00046. https://arxiv.org/abs/2002.00046
- Mikkola & Merritt (2008) Mikkola, S., & Merritt, D. 2008, AJ, 135, 2398, doi: 10.1088/0004-6256/135/6/2398
- Mikkola & Tanikawa (1999) Mikkola, S., & Tanikawa, K. 1999, MNRAS, 310, 745, doi: 10.1046/j.1365-8711.1999.02982.x
- Morscher et al. (2015) Morscher, M., Pattabiraman, B., Rodriguez, C., Rasio, F. A., & Umbreit, S. 2015, ApJ, 800, 9, doi: 10.1088/0004-637X/800/1/9
- Özel et al. (2012) Özel, F., Psaltis, D., Narayan, R., & Santos Villarreal, A. 2012, ApJ, 757, 55, doi: 10.1088/0004-637X/757/1/55
- Peters (1964) Peters, P. C. 1964, Phys. Rev., 136, B1224, doi: 10.1103/PhysRev.136.B1224
- Piskunov et al. (2006) Piskunov, A. E., Kharchenko, N. V., Röser, S., Schilbach, E., & Scholz, R. D. 2006, A&A, 445, 545, doi: 10.1051/0004-6361:20053764
- Piskunov et al. (2007) Piskunov, A. E., Schilbach, E., Kharchenko, N. V., Röser, S., & Scholz, R. D. 2007, A&A, 468, 151, doi: 10.1051/0004-6361:20077073
- Podsiadlowski et al. (2004) Podsiadlowski, P., Langer, N., Poelarends, A. J. T., et al. 2004, ApJ, 612, 1044, doi: 10.1086/421713
- Portegies Zwart et al. (2010) Portegies Zwart, S. F., McMillan, S. L. W., & Gieles, M. 2010, ARA&A, 48, 431, doi: 10.1146/annurev-astro-081309-130834
- Rastello et al. (2020) Rastello, S., Mapelli, M., Di Carlo, U. N., et al. 2020, arXiv e-prints, arXiv:2003.02277. https://arxiv.org/abs/2003.02277
- Rodriguez et al. (2018) Rodriguez, C. L., Amaro-Seoane, P., Chatterjee, S., et al. 2018, Phys. Rev. D, 98, 123005, doi: 10.1103/PhysRevD.98.123005
- Rodriguez et al. (2016) Rodriguez, C. L., Chatterjee, S., & Rasio, F. A. 2016, Phys. Rev. D, 93, 084029, doi: 10.1103/PhysRevD.93.084029
- Safarzadeh & Loeb (2020) Safarzadeh, M., & Loeb, A. 2020, ApJ, 899, L15, doi: 10.3847/2041-8213/aba9df
- Sigurdsson & Phinney (1993) Sigurdsson, S., & Phinney, E. S. 1993, ApJ, 415, 631, doi: 10.1086/173190
- Soubiran et al. (2018) Soubiran, C., Cantat-Gaudin, T., Romero-Gómez, M., et al. 2018, A&A, 619, A155, doi: 10.1051/0004-6361/201834020
- Spera & Mapelli (2017) Spera, M., & Mapelli, M. 2017, MNRAS, 470, 4739, doi: 10.1093/mnras/stx1576
- Spera et al. (2019) Spera, M., Mapelli, M., Giacobbo, N., et al. 2019, MNRAS, 485, 889, doi: 10.1093/mnras/stz359
- The LIGO Scientific Collaboration et al. (2020) The LIGO Scientific Collaboration, the Virgo Collaboration, & et al. 2020, arXiv e-prints, arXiv:2006.12611. https://arxiv.org/abs/2006.12611
- Thompson et al. (2019) Thompson, T. A., Kochanek, C. S., Stanek, K. Z., et al. 2019, Science, 366, 637, doi: 10.1126/science.aau4005
- Tsokaros et al. (2020) Tsokaros, A., Ruiz, M., & Shapiro, S. L. 2020, arXiv e-prints, arXiv:2007.05526. https://arxiv.org/abs/2007.05526
- Wyrzykowski & Mandel (2020) Wyrzykowski, Ł., & Mandel, I. 2020, A&A, 636, A20, doi: 10.1051/0004-6361/201935842
- Yang et al. (2019) Yang, Y., Bartos, I., Haiman, Z., et al. 2019, ApJ, 876, 122, doi: 10.3847/1538-4357/ab16e3
- Yang et al. (2020) Yang, Y., Gayathri, V., Bartos, I., et al. 2020, ApJ, 901, L34, doi: 10.3847/2041-8213/abb940
- Ye et al. (2020) Ye, C. S., Fong, W.-f., Kremer, K., et al. 2020, ApJ, 888, L10, doi: 10.3847/2041-8213/ab5dc5
- Zevin et al. (2020) Zevin, M., Spera, M., Berry, C. P. L., & Kalogera, V. 2020, arXiv e-prints, arXiv:2006.14573. https://arxiv.org/abs/2006.14573
- Ziosi et al. (2014) Ziosi, B. M., Mapelli, M., Branchesi, M., & Tormen, G. 2014, MNRAS, 441, 3703, doi: 10.1093/mnras/stu824