“I Don’t Think So”: Summarizing Policy Disagreements for Agent Comparison
Abstract
With Artificial Intelligence on the rise, human interaction with autonomous agents becomes more frequent. Effective human-agent collaboration requires users to understand the agent’s behavior, as failing to do so may cause reduced productivity, misuse or frustration. Agent strategy summarization methods are used to describe the strategy of an agent to its destined user through demonstration. A summary’s objective is to maximize the user’s understanding of the agent’s aptitude by showcasing its behaviour in a selected set of world states. While shown to be useful, we show that current methods are limited when tasked with comparing between agents, as each summary is independently generated for a specific agent. In this paper, we propose a novel method for generating dependent and contrastive summaries that emphasize the differences between agent policies by identifying states in which the agents disagree on the best course of action. We conduct user studies to assess the usefulness of disagreement-based summaries for identifying superior agents and conveying agent differences. Results show disagreement-based summaries lead to improved user performance compared to summaries generated using HIGHLIGHTS, a strategy summarization algorithm which generates summaries for each agent independently.
Introduction
With the maturing of reinforcement learning (RL) methods, RL-based agents are being trained to perform complex tasks in various domains, including robotics, healthcare and transportation. Importantly, these agents do not operate in a vaccum – people interact with agents in a wide range of settings. Effective interaction between an agent and a user requires from the latter the ability to anticipate and understand its behavior. For example, clinicians should understand treatment regimes recommended by agents to determine their viability.
To facilitate improved user understanding of agents’ behavior, a range of explainable RL methods have been developed (Puiutta and Veith 2020; Heuillet, Couthouis, and Díaz-Rodríguez 2021). These can be divided into two explanation categories: (1) “local” explanation approaches explaining why an agent chose a particular action in a given state, e.g., saliency maps highlighting the information an agent attends to (Greydanus et al. 2017), and (2) “global” explanation methods that describe the policy of an agent more generally, such as strategy summaries that demonstrate the agents’ behavior in a selected set of states (Amir, Doshi-Velez, and Sarne 2019). While these approaches have been shown to improve people’s understanding of agent behavior, they are typically not optimized for a particular user task.
In this work, we aim to enhance users’ ability to distinguish between the behavior of different agents. Such scenarios arise when people are required to select an agent from a set of alternatives. E.g., a user might need to choose from a variety of smart home assistants or self-driving cars available on the market. Importantly, there often isn’t a clear “ground-truth” for which agent is superior, as agents may prioritize alternative outcomes and users may occupy different preferences. For example, some users may prefer self-driving cars that value safety very highly, while others might be willing to relax safety considerations to a degree to allow for faster driving. The ability to distinguish policies is also important for model developers, as different configurations of reward functions and algorithm parameters can lead to different behaviors in unexpected ways, especially in domains where the reward function is not obvious, such as healthcare (Gottesman et al. 2019).
One possible approach for helping users distinguish between policies of agents is to use strategy summarization methods (Amir, Doshi-Velez, and Sarne 2018, 2019). Using these methods, a summary is generated for each agent, allowing the user to compare their behavior. However, these approaches are not optimized for the task of agent comparison, as each summary is generated independently. For instance, the HIGHLIGHTS algorithm (Amir and Amir 2018) selects states based on their importance as determined by the differences in Q-values for alternative actions in a given state. If two high-quality agents are compared, it is possible that they will consider the same states as most important, and will choose the same (optimal) action in those states, resulting in similar strategy summaries. In such a case, even if the agents’ policies differ in numerous regions of the state-space, it will not be apparent from the summaries.
This work presents the DISAGREEMENTS algorithm which is optimized for comparing agent policies. Our algorithm compares agents by simulating them in parallel and noting disagreements between them, i.e. situations where the agents’ policies differ. These disagreement states constitute behavioral differences between agents and are used to generate visual summaries optimized towards showcasing the most prominent conflicts, thus providing contrastive information. Our approach assumes access to the agent’s strategy, described using a Markov Decision Process (MDP) policy, and quantifies the importance of disagreements by making use of agents’ Q-values.
To evaluate DISAGREEMENTS, we conducted two human-subject experiment to test the following properties of the algorithm: Firstly, whether it improves users’ ability to identify a superior agent when one exists, i.e. given ground-truth performance measures. Secondly, do DISAGREEMENTS summaries outperform HIGHLIGHTS summaries in conveying differences in behavior of agents to users. Both experiments make use of HIGHLIGHTS summaries as a baseline for comparison. Results indicate a significant improvement in user performance for the agent superiority identification task, while not falling short in the behaviour conveying task, as compared to HIGHLIGHTS.
Our contributions are threefold: i) We introduce and formalize the problem of comparing agent policies; ii) we develop DISAGREEMENTS, an algorithm for generating visual contrastive summaries of agents’ behavioral conflicts, and iii) we conduct human-subject experiments, demonstrating that summaries generated by DISAGREEMENTS lead to improved user performance compared to HIGHLIGHTS summaries.
Related Work
In recent years, explainable AI has regained interest, initially focusing mainly on explaining supervised models. More recently, research has begun exploring explanations of reinforcement learning agents (Puiutta and Veith 2020; Heuillet, Couthouis, and Díaz-Rodríguez 2021). In this work, we focus on global explanations that aim to describe the policy of the agent rather than explain a particular action. Specifically, we develop a new method for strategy summarization. In this section we describe in more depth strategy summary methods (Amir, Doshi-Velez, and Sarne 2019).
Strategy summarization techniques convey agent behavior by demonstrating the actions taken by the agent in a selected set of world states. The key question in this approach is then how to recognize meaningful agent situations.
One such approach called HIGHLIGHTS (Amir and Amir 2018), extracts important states from execution traces of the agent. Intuitively, a state is considered important if the decision made in that state has a substantial impact on the agent’s utility. To illustrate, a car reaching an intended highway exit would be an important state, as choosing a different action (continuing on the highway) will cause a significant detour. HIGHLIGHTS has been shown to support people’s ability to understand the capabilities of agents and develop mental models of their behavior (Amir and Amir 2018; Huber et al. 2020).
Sequeira and Gervasio (2020) extended HIGHLIGHTS by suggesting additional importance criteria for the summary state selection referred to as Interestingness Elements. Huang et al. (2017); Lage et al. (2019) proposed a different approach for generating summaries based on machine teaching methods. The key idea underlying this approach is to select a set of states that is optimized to allow the reconstruction of the agents’ policy using imitation learning or inverse reinforcement learning methods.
Common to all previous policy summarization approaches is that each summary is generated specifically for a single agent policy, independent of other agents. This can hinder users’ ability to compare agents, as the summaries might show regions of the state-space where the agents act similarly, failing to capture useful information with respect to where the agent policies diverge. For example, HIGHLIGHTS focuses on “important” states and it is likely that the states found to be most the important to one agent will be considered important by another agent as well. These could be inherently important stages of the domain such as reaching the goal or evading a dangerous state. If the agents act similarly in these important states, the HIGHLIGHTS summaries of the agents might portray similar behavior, even for agents whose global aptitude varies greatly. In contrast, if the summaries do differ from one another and portray different regions of the state-space, they do not convey how the alternative agent would have acted had it been tasked with the same scenario.
To address these limitations, we propose a new approach that is specifically optimized for supporting users’ ability to distinguish between policies.
Background
For the purpose of this work, we assume a Markov Decision Process (MDP) setting. Formally, an MDP is a tuple , where S is the set of world states; A is the set of possible actions available to the agent; is a reward function mapping each state, and is the transition function. A solution to an MDP is a policy denoted .
Summaries
A summary, denoted , is a set of trajectories . Each trajectory being a sequence of consecutive states surrounding the disagreement state and extracted from the agent’s execution traces.
We formally define a summary extraction process of an agent’s policy given an arbitrary importance function , mapping state-action pairs to numerical scores.
Definition 1 (Summary Extraction).
Given an agent’s execution traces, a summary trajectory budget , and an
importance function .
The agent’s summary is then the set of trajectories that maximizes the importance function.
| (1) |
In this paper, our baseline is the HIGHLIGHTS algorithm, which computes importance as a function of the -values in a given state. Specifically, we implement the importance function from Huber et al. (2020), an extension to HIGHLIGHTS, which suggests determining the importance of a state based on the difference between the maximal and second -values. Formally:
| (2) |
The trajectory is then the sequence of states preceding and succeeding the important state.
Disagreement-Based Summaries
We propose a new summary method which supports the comparison of alternative agents by explicitly highlighting the disagreements between them. Thus, constructing contrastive summaries that convey policy divergence between agents exposed to the same world states. This approach is in line with the literature on explanations from the social sciences, which shows that people prefer contrastive explanations (Miller 2018). We note that while typically contrastive explanations refer to “why not?” questions and consider counterfactuals, in our case the contrast is between the decisions made by two different policies.
We next describe our proposed disagreement-based summary method. Specifically, we formalize the notion of agent disagreement, describe the “DISAGREEMENTS” algorithm for generating a joint summary of the behavior of two agents, and describe how to measure the importance of a disagreement state and disagreement trajectory.
Agent Disagreement
The two main dimensions on which agents can differ are their valuations of states and their policies, i.e. their choice of action. These dimensions are of course related, as different state valuations will naturally lead to different policies. Our definition of a disagreement focuses on the policy. We then utilize the value function for ranking purposes.
In other words, any state for which different agents choose different actions is considered a disagreement state. We use these states to analyze and portray how the agents differ from one another in their behavior. Formally:
Definition 2 (Disagreement State).
Given two agents and with policies , respectively. Define a state as a disagreement state iff:
| (3) |
The set of all disagreement states would then be:
| (4) |
For a compact MDP where every state may be computed, this definition would suffice. Alas, for more complex settings containing a continuous or vast state space, it is not feasible to compare all states. The proposed method must be able to overcome this difficulty.
Identifying Agent Disagreements Through Parallel Online Execution
Given two alternative agents to compare, we initiate an online execution of both agents simultaneously such that we follow the first (denoted as the Leader or for short, with policy ), while querying the second (denoted as the Disagreer or for short, with policy ) for the action it would have chosen in each state. Both agents are constrained to act greedily and deterministically with respect to their -values. Upon reaching a disagreement state, we allow the Disagreer to “split-off” from following the Leader and continue independently for a limited number of steps while recording the states it reaches for later analysis. Once the limit is reached, we store the disagreement trajectory, and revert the Disagreer back to the disagreement state, from which it continues to follow the Leader until the next disagreement state is reached and the process is repeated.
The DISAGREEMENTS Algorithm
| Parameter | Description | F | H |
|---|---|---|---|
| Summary budget, i.e. number of trajectories | 5 | 5 | |
| Length of each trajectory | 10 | 20 | |
| Number of states following to include in the trajectory | 5 | 10 | |
| The number of simulations (episodes) run by the DISAGREEMENTS algorithm | 10 | 10 | |
| Maximal number of shared states allowed between two trajectories in the summary | 3 | 5 | |
| Importance method used for evaluating disagreements | Last State | Last State |
The Algorithm. First, three lists are initialized for the Leader traces, disagreement states and Disagreer trajectories (lines 4–6). Then, simulation of the agents are run (lines 7–27). Each simulation collects all states seen by the Leader during the execution (line 24), disagreement states (line 13), and the Disagreer trajectories (lines 14–19). Each step of the simulation, both agents are queried for their choice of action (lines 10–11), if they disagree on the action — a disagreement state is added (line 13) and a disagreement trajectory is created (lines 14–19), after which the simulation is reverted to the last disagreement state (line 21). Upon simulations completion, all disagreement trajectories (coupled pairs of Leader and Disagreer trajectories) are obtained (line 28) and the most important ones are passed as output (line 29).
Since the Leader agent controls which areas of the domain state-space are reached, we repeat the process again, reversing the agent’s roles. This is important because the Leader determines which regions of the state-space are reached and as such also conveys information about the agent’s preferences. This process results in two sets of disagreements states (one for each agent as the Leader). Typically, these sets can be very large, and it is infeasible for a user to explore all of them. Therefore, a ranking procedure is necessary for the disagreements found in order to generate a compact summary. We next describe approaches for quantifying the importance of a disagreement.
Disagreement Importance
Various methods can be used for determining disagreement importance. We first define the notion of a state’s value based on multiple agents.
State Value We assume the agents are -based, possessing a function () which quantifies their valuation of state-action pairs, denoted as -values. -values are calculated and adjusted during the training phase of the agent and depend on the algorithm used as well as on the specification of the reward function. Therefore, -values of different agents may vary greatly. This renders each individual agent’s assessment of a state-action pair as its own estimate rather than representing a ground truth. The values themselves may not even be on the same scale. To allow for comparison between values, we normalize each agent’s -values by dividing by the maximum -value appearing in each, thus rendering each value an indication of how good a state-action pair is compared to the best one observed by the agent. Formally:
| (5) |
Since our agents’ action selection is greedy and deterministic with respect to their -values, we denote the value of state as the highest -value associated with it.
Definition 3 (Agent State Value).
Given an agent , its function and a state , we define the value of as:
| (6) |
Alas, measuring only the importance of a single state has its limitations. Without ground truth, we are left only with the agents’ estimations which may be flawed. Suppose our agents reach a disagreement state where both are convinced the other’s action is a poor choice. They each go their separate ways only to reunite at a shared state after several steps with minimal to no impact on the succeeding execution, e.g. overtaking a vehicle from the left or from the right. This realization led us to formulate a trajectory-based approach for determining the importance of a disagreement state.
Disagreement Trajectory Importance
To determine the importance of a disagreement state, we compare the trajectories that branch out of it by following each agent. We formulate trajectory value metrics to evaluate these, while constraining ourselves to observing only trajectories of similar length.
A trajectory denotes the sequence of states encountered when following state for steps according to a policy . Since each agent evaluates states differently, we consider the value of a state as the sum of both agents’ valuations, i.e. . There are numerous ways to quantify the importance of a trajectory. A description of several methods tested in our work is provided in the Appendix. The summaries generated for the user studies made use of the last-state importance method.
Last State Importance: We define the importance of a disagreement trajectory as the difference between the values of the last states reached by each of the agents. This reflects how “far off” from each other the disagreement has led the agents. Formally:
| (7) |
This metric achieves a high importance score when one agent arrives at a state which both agents agree is valuable, while the other agent arrives at a state whose value both agents agree is poor.
Trajectory Diversity
Using these methods we are able to acquire the set of disagreement states ordered by importance, and for each, their corresponding trajectories. These shall be woven together to create a visual summary for displaying to the user. To increase the coverage of the summary and avoid showing redundant trajectories (in both methods), we restrict the summary generated to not contain i) multiple trajectories that end or begin at the same state, ii) trajectories where the Leader and Disagreer share the same state before-last and iii) overlapping trajectories which share more than a predefined number of states.
Empirical Methodology
To evaluate our method we conducted two user studies. The first was designed to assess whether DISAGREEMENTS summaries help users identify the superior between two alternative agents, while the second user study examines whether such summaries are useful for conveying agent behavior differences. In both studies we use the HIGHLIGHTS algorithm as a baseline for comparison. We note here that there is a significant difference between the output summaries of both methods rooted in the fact that DISAGREEMENTS was designed for presenting two policies in a contrastive manner. This is achieved by portraying both agents simultaneously on the screen. To our knowledge no other global explanation methods exist that directly compare policies and visualizes their differences to lay users.
Empirical Domains. To evaluate our algorithm we generated summaries of agents playing the game of Frogger (Sequeira and Gubert 2020) and controlling a vehicle in a highway environment (Leurent 2018).
Frogger The objective of the game is to guide a frog from the bottom of the screen to an empty lily-pad at the top of the screen. The agent controls the frog and can initiate the following four movement actions: up, down, left or right, causing the frog to hop in that direction. To reach the goal the agent must lead the frog across a road with moving cars while avoiding being run over, then, the agent must pass the river by jumping on passing logs. This domain allows us to compare different agents in a setting with ground truth information about agents’ skill, i.e. game score.
Highway This domain consists of a busy highway with multiple lanes and vehicles. The agent controls a vehicle driving through traffic with the intent of avoiding collisions. The agent can choose to move right or left (changing lanes), increase or decrease velocity or stay idle, i.e. make no change. There is no defined target the agent is required to reach, instead the road goes on continuously. This property allows us to observe the agent’s general behavior and preferences instead of focusing on its progression towards reaching the goal.Screenshots from the DISAGREEMENTS output summaries displayed in Figure 1.
Red & black rectangles represent different agents.
Frogger Agents. We made use of the framework developed by Sequeira and Gervasio (2020) to test the DISAGREEMENTS algorithm on multiple configurable agents of varying capabilities. Three different agents were trained using standard -learning (watkins1992q), based on the configurations provided by the framework.
-
•
Expert (E): 2000 training episodes. Default rewards. Average game score: 110,000.
-
•
Mid-range (M): 1000 training episodes. Default rewards. Average game score: 50,000.
-
•
LimitedVision (LV): 2000 training episodes. Default rewards. Lower perception of incoming cars. Average game score: 55,000.
Agent performance was calculated by averaging the game score of ten executions. Each agent’s unique configuration contributes to its performance, providing us a ground truth for the assessment tasks we present to the experiment participants. The agents’ skill hierarchy, based on their average score, is as follows: . An important requirement for the experiment was that all agents have a decent ability to play Frogger. Prior to this study, we verified via an additional experiment that HIGHLIGHTS summaries are indeed useful for comparing Frogger agents that differ substantially in their skills (see Appendix). All HIGHLIGHTS and DISAGREEMENTS summaries were generated for fully trained agents, thus reflecting their final policies.
Highway Agents. Agents with varying behaviors were trained by altering their reward functions. All highway agents were trained for 2000 episodes using double DQN architecture (Hasselt 2010) and rewarded for avoiding collisions.
-
•
ClearLane (CL): Rewarded for high velocity while maximizing the distance between itself and the nearest vehicle in front of it.
-
•
SocialDistance (SD): Rewarded for maximizing the distance between itself and the closest vehicles.
-
•
FastRight(FR): Rewarded for high velocity and driving in the rightmost (bottom) lane.
Henceforth, we will refer to all domain agents by their abbreviations.
Summary Attributes All summaries were composed of five trajectories made up of sequential states, ten for Frogger and twenty for Highway. These contained the important state at the center of the trajectory, with half the states preceding and the rest succeeding it. Video-clips of the summaries were generated to present to the users and a fade-in and fade-out effect was added to further call attention to the transition between trajectories. For more details, sensitivity analysis and the complete surveys, see Appendix.
Experiment 1 - Identifying Superiority
The objectives of the first experiment were twofold. Firstly, to support our claims regarding the limitations of the HIGHLIGHTS algorithm for comparing agents, and secondly, to compare the DISAGREEMENTS algorithm to HIGHLIGHTS and show its added value.
Hypotheses.
We hypothesized that summaries generated by the HIGHLIGHTS
algorithm are limited in their ability to help users distinguish between agents
and the DISAGREEMENTS algorithm is more suited for this task. More specifically,
we state the following hypotheses:
H1: Participants shown summaries generated by HIGHLIGHTS for
agents of decent skill will struggle to identify the better performing
agent.
H2: Participants shown summaries generated by the DISAGREEMENTS
algorithm will exhibit a higher success rate for identifying the better
performing agent, compared to ones shown HIGHLIGHTS summaries.
Experimental Conditions A between-subject experimental setup was designed with two experimental conditions that varied in the summary generation method, DISAGREEMENTS or HIGHLIGHTS (Amir and Amir 2018). Participants were randomly assigned a condition.
Participants. 74 participants were recruited through Amazon Mechanical Turk (27 female, mean age , STD ), each receiving for their completion of the Task. To incentivize participants to make an effort, they were provided a bonus of 10 cents for each correct answer in the superiority identification task. Participants who spent less than a threshold duration of time on experiment tasks, based on the length of the task summary video, were filtered out.
Procedure. Participants were first introduced to the game of Frogger and the concept of AI agents. Each explanation was followed by a short quiz to ensure understanding before advancing to the task. Next, participants were randomly split into one of two conditions and were shown summary videos of pairs of different agents generated using either DISAGREEMENTS or HIGHLIGHTS.
Participants in both groups were first introduced to the summary method they would be shown and were required to pass a quiz to ensure their understanding. Participants were then asked to choose the better performing agent based on the summary videos. They were able to pause, play and repeat the summary videos without restrictions, allowing freedom to fully inspect the summary before deciding which agent they believe is more skillful. Participants were also asked to provide a textual explanation for their selection and to rate their decision confidence on a 7-point Likert scale (0 - not at all confident to 6 - very confident). Overall, there were 3 pairs of agent comparisons . The ordering of the agent pairs was randomized to avoid learning effects, and participants were also not told if the same agent appeared in multiple comparisons, that is, they made each decision independently of other decisions.
Participants in the HIGHLIGHTS condition were shown a HIGHLIGHTS summary of each agent (i.e. two separate videos, one for each agent.), while participants in the DISAGREEMENTS group were supplied two configurations of the DISAGREEMENTS summaries. One summary where the first agent is the Leader while the second is the Disagreer, and the opposite summary, where the first agent is the Disagreer and the second is the Leader. Upon conclusion, participants answered a series of explanation satisfaction questions adapted from (Hoffman et al. 2018).
Evaluation Metrics and Analyses. The main evaluation metric of interest was the success rate of identifying the superior Frogger agent with each summary method. We compare this metric across all the agent selection tasks given to participants. We also compare participants’ confidence in their decision. To compare the explanation satisfaction ratings given to the summaries, we averaged the values of the different items normalizing in such a way that higher values always mean that the summary is more helpful. In all analyses we used the non-parametric Mann-Whitney test and computed effect sizes using rank-biserial correlation. In all plots the error bars depict the bootstrapped confidence intervals (Efron and Tibshirani 1994).
Experiment 2 - Conveying Agent Differences
This experiment’s objective was to test the usefulness of DISAGREEMENTS summaries for conveying differences in general agent behavior in comparison to HIGHLIGHTS.
Hypotheses.
The DISAGREEMENTS algorithm is designed to portray instances of disagreement between
agents. We hypothesized that this would provide a clear and contrastive distinction between the alternative agents, thus emphasizing behavioral differences and providing a more appealing visual experience.
More specifically,we state the following hypotheses:
H3: Success rate of participants shown DISAGREEMENTS summaries will surpass that of participants shown HIGHLIGHTS summaries.
H4: participants will prefer summaries generated by the DISAGREEMENTS method.
Experimental Conditions A within subject setup was chosen in order to allow participants to provide a direct comparison between the methods and state their preferences. As participants experience both HIGHLIGHTS and DISAGREEMENTS summaries, to reduce cognitive overload, we chose to display only two agent comparisons for each method. We chose the comparisons between the most distinctly dissimilar agents, dropping due to similarity of reward associated with distance from neighboring vehicles.
Participants. 45 participants were recruited through Amazon Mechanical Turk (13 female, mean age , STD ), receiving similar pay and bonus incentive as in the first experiment. As in Exp#1, participants were filtered out if their task completion time was below a threshold.
Procedure. Participants followed a similar procedure as in the previous experiment diverging solely in the domain introduction and the questions asked. Instead of superiority between the agents, participants were queried about which trait was more dominant in the compared agents. The ground truth was established directly from the reward functions of the agents. Each comparison included two such questions along with a mandatory confidence rating and textual explanation of the answers. In addition, participants were ultimately asked which method they preferred. Since this was a within-subject design, participants saw both methods, in a random order. All questions are provided in the Appendix.
Evaluation Metrics and Analyses. The main evaluation metric of interest was the success rate of correctly assigning a more dominant trait to an agent. We compare this metric across the different agent selection tasks and summary methods. Similarly to experiment 1, we compare participants’ confidence in their answers. For evaluating summary method satisfaction of participants we used the non-parametric Wilcoxon signed-rank test (Wilcoxon 1947) for matched pairs.
Results
We now describe the results of our comparison between the HIGHLIGHTS strategy summarization method and our novel DISAGREEMENTS approach. We report the main experimental results with respect to the hypotheses raised in the previous section.
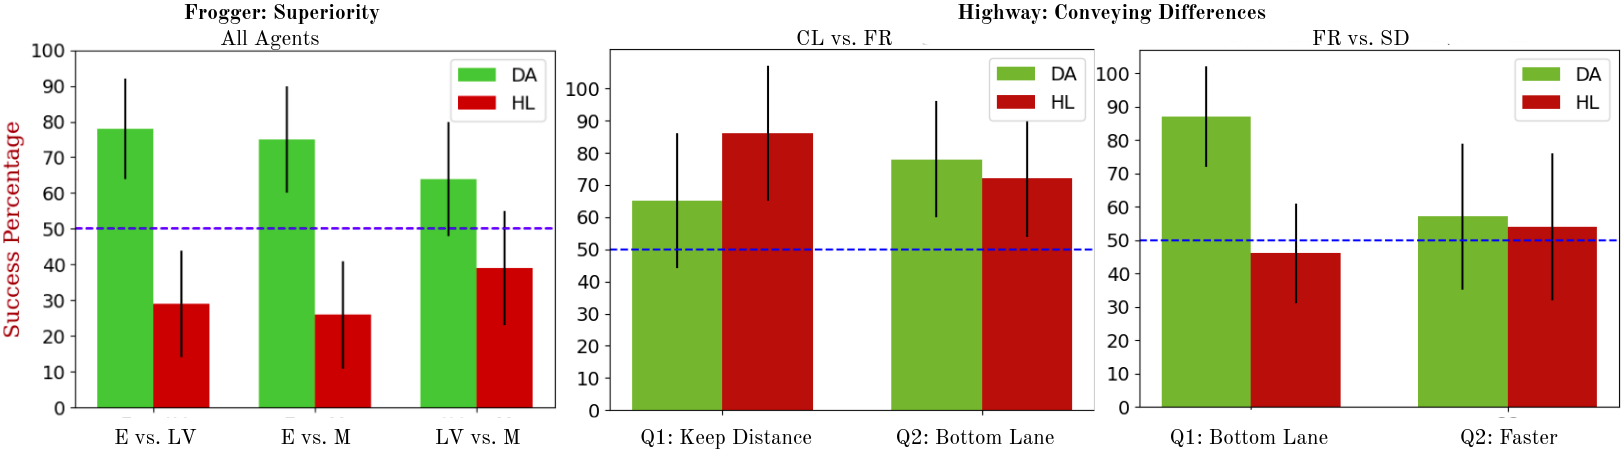
Figure 2 shows the percentage of participants who were successful in answering the experiment tasks in each of the experiment conditions, for each agent pair combination.
(H1) Participants in the HIGHLIGHTS condition struggled to successfully identify the better performing agent in the comparison task. When all agents are of decent performance, we see the difficulty of distinguishing between them manifest itself in a poor success rate. Based on participants’ textual explanations of the choice of agent, it seems they were concerned that agent was indecisive, e.g., “[Agent ] seems very indecisive while … [Agent ] seems to have a plan and is going with it.”. We hypothesize that these responses are a consequence of a single trajectory in agent ’s summary where the frog is seen leaping between logs in a seemingly indecisive manner. These results emphasize the limitations of independent comparisons.
(H2) Participants in the DISAGREEMENTS condition were more successful in the agent comparison task. Participants in the DISAGREEMENTS group showed vast improvement in the ability to identify the better performing Frogger agent (see Figure 2). The differences in success rate between conditions were statistically significant and substantial for all agent comparisons ( vs. : ; vs. : ; vs. : ). Textual explanations provide insights regarding how the contrastive nature of the DISAGREEMENTS summaries helped participants decide which agent to choose, e.g. “ I preferred the path that … [Agent ] was taking”; “I felt that … [Agent ] was making slightly stronger moves, and pushing ahead further”.
(H3) A significant difference was found between success rates of participants in the conveying differences task. Participants achieved a significantly higher success rate with the DISAGREEMENTS method in the vs. comparison (). Albeit, this was mostly a result of the low performance of HIGHLIGHTS in due to the summary containing, coincidentally, only trajectories of the agent at the bottom lane. The inferior performance of DISAGREEMENTS in of vs. () can be explained by summary trajectories where no vehicles were present in ’s lane allowing it to drive faster than and appear less considerate of keeping distance. While not necessarily outperforming it, the DISAGREEMENTS is at least equivalently useful as HIGHLIGHTS, which was shown to be better than random (Huber et al. 2020).
(H4) No clear participant preference towards one summary method was observed. Most participants answered that both methods were equally beneficial. However, more participants found DISAGREEMENTS more helpful and containing less irrelevant information than HIGHLIGHTS, while finding the latter more pleasing.
Confidence and satisfaction In both experiments no statistically significant differences were found between the confidence or satisfaction of participants in different conditions (See Appendix).
Discussion and Future Work
With the maturing of AI, circumstances which require people to choose between alternative market-available solutions, are likely to arise. The necessity of distinguishing between alternative agents becomes ever more clear. Moreover, distinguishing between policies is key for developers when analyzing different algorithms and configurations.
This paper presented a new approach for comparing RL agents by generating policy disagreement summaries. Experimental results show summaries help convey agent behaviour differences and improve users’ ability to identify superior agents, when one exists.
As for future work, we note the following possible directions: i) expanding DISAGREEMENTS to enable comparison of more than two agents; ii) testing additional state and trajectory importance methods; iii) further enhancing the diversity between trajectories in the summary, and iv) formulating and defining disagreement “types” for generating further user-specific summaries.
Acknowledgements
The research was partially funded by the Israeli Science Foundation grant #2185/20
References
- Amir and Amir (2018) Amir, D.; and Amir, O. 2018. HIGHLIGHTS: Summarizing Agent Behavior to People. In Proc. of the 17th International conference on Autonomous Agents and Multi-Agent Systems (AAMAS).
- Amir, Doshi-Velez, and Sarne (2018) Amir, O.; Doshi-Velez, F.; and Sarne, D. 2018. Agent Strategy Summarization. In Proceedings of the 17th International Conference on Autonomous Agents and MultiAgent Systems, 1203–1207. International Foundation for Autonomous Agents and Multiagent Systems.
- Amir, Doshi-Velez, and Sarne (2019) Amir, O.; Doshi-Velez, F.; and Sarne, D. 2019. Summarizing agent strategies. Autonomous Agents and Multi-Agent Systems, 33(5): 628–644.
- Efron and Tibshirani (1994) Efron, B.; and Tibshirani, R. J. 1994. An introduction to the bootstrap. CRC press.
- Gottesman et al. (2019) Gottesman, O.; Johansson, F.; Komorowski, M.; Faisal, A.; Sontag, D.; Doshi-Velez, F.; and Celi, L. A. 2019. Guidelines for reinforcement learning in healthcare. Nature medicine, 25(1): 16–18.
- Greydanus et al. (2017) Greydanus, S.; Koul, A.; Dodge, J.; and Fern, A. 2017. Visualizing and Understanding Atari Agents. arXiv preprint arXiv:1711.00138.
- Hasselt (2010) Hasselt, H. 2010. Double Q-learning. Advances in neural information processing systems, 23: 2613–2621.
- Heuillet, Couthouis, and Díaz-Rodríguez (2021) Heuillet, A.; Couthouis, F.; and Díaz-Rodríguez, N. 2021. Explainability in deep reinforcement learning. Knowledge-Based Systems, 214: 106685.
- Hoffman et al. (2018) Hoffman, R. R.; Mueller, S. T.; Klein, G.; and Litman, J. 2018. Metrics for explainable AI: Challenges and prospects. arXiv preprint arXiv:1812.04608.
- Huang et al. (2017) Huang, S. H.; Held, D.; Abbeel, P.; and Dragan, A. D. 2017. Enabling robots to communicate their objectives. Autonomous Robots, 1–18.
- Huber et al. (2020) Huber, T.; Weitz, K.; André, E.; and Amir, O. 2020. Local and Global Explanations of Agent Behavior: Integrating Strategy Summaries with Saliency Maps. CoRR, abs/2005.08874.
- Lage et al. (2019) Lage, I.; Lifschitz, D.; Doshi-Velez, F.; and Amir, O. 2019. Exploring Computational User Models for Agent Policy Summarization. In Proceedings of the Twenty-Eighth International Joint Conference on Artificial Intelligence, IJCAI-19, 1401–1407. International Joint Conferences on Artificial Intelligence Organization.
- Leurent (2018) Leurent, E. 2018. An Environment for Autonomous Driving Decision-Making. https://github.com/eleurent/highway-env.
- Miller (2018) Miller, T. 2018. Explanation in artificial intelligence: Insights from the social sciences. Artificial Intelligence.
- Puiutta and Veith (2020) Puiutta, E.; and Veith, E. M. S. P. 2020. Explainable Reinforcement Learning: A Survey. CoRR, abs/2005.06247.
- Sequeira and Gervasio (2020) Sequeira, P.; and Gervasio, M. 2020. Interestingness elements for explainable reinforcement learning: Understanding agents’ capabilities and limitations. Artificial Intelligence, 288: 103367.
- Sequeira and Gubert (2020) Sequeira, P.; and Gubert, J. 2020. Frogger python implementation.
- Wilcoxon (1947) Wilcoxon, F. 1947. Probability tables for individual comparisons by ranking methods. Biometrics, 3(3): 119–122.