|
|
Role of precursor composition in the polymorph transformations, morphology control and ferromagnetic properties of nanosized TiO2 |
| Dmitry Zablotsky,∗a Mikhail M. Maiorov,a Aija Krumina,a,b Marina Romanova,c and Elmars Blumsa | |
|
|
Pure phase and mixed phase TiO2 nanoparticles have been produced using a pyrolytic method from a non-aqueous carboxylate precursor. The precursor was prepared by a multiphase cation exchange using pentanoic acid (C4H9COOH). The thermal stability, polymorph content, morphology, size distribution and surface region of the produced nanoparticles were studied by TGA/DSC, XRD, FTIR and TEM. High quality monodisperse nanoparticles have been produced in the size range from 7 to 27 nm. The nanoparticles showed room temperature ferromagnetism revealed by VSM within bound polaron model. The carboxylate precursor is a good alternative to standard sol-gel to produce nanoparticles free from impurities. |
1 Introduction
Titanium dioxide (TiO2) is a multifunctional semiconducting metal oxide (SMO) that is expected to play a significant role in environmental and energy applications 1, 2. Amongst all SMOs (such as WO3, ZnO, Fe2O3, MnO2 etc.) TiO2 is the most intensively studied because its chemically inert, reusable, abundant and inexpensive, non-toxic and biologically compatible and has a wide band gap (3 eV), which makes it an ideal photocatalyst that can be used to break down and mineralize organic pollutants, inhibit bacterial growth, self-sterilize surfaces or split water to hydrogen and oxygen by solar light3. In the past decades a tremendous effort has been put into improving the efficiency of TiO2 materials. Titania crystallizes in three distinct polymorphs with different properties and structure: rutile (tetragonal, space group P42/mmm), anatase (tetragonal, space group I41/amd) and brookite (orthorhombic, space group Pcab). Bi-phasic anatase/rutile mixtures are most wanted than pure phases because of superior properties 4, 5, 6, 7, 8. The established standard - Aeroxide TiO2 P25 marketed by Evonik Industries (Degussa) – a mixed phase photocatalyst consisting of about 70-80 wt.% anatase and 20-30 wt.% rutile, has been extensively studied, benefited from synergistic interaction of the phases 9, 10, 11, 12, 13. Fundamentally, a considerable problem is a very limited range of precursors and process chemistries to produce nanostructured TiO2. The solution-based sol–gel chemistry is commonly used to produce TiO2 nanocrystallites. It starts from either an organometallic titanium alkoxide (Ti ethoxide, butoxide or isopropoxide) or inorganic titanium chloride (TiCl4 or TiCl3) and proceeds via a two-step process: hydrolysis of the salt by added water resulting in the formation of intermediate species (monomers) and their subsequent self-assembly and polymerization into extended 3D network. The colloidal suspension (sol) is precipitated, dried and calcined to complete the phase transformation.
Previous studies have shown that during sol-gel the phase content, crystalline structure, size and morphology of particles were found to be highly sensitive to various parameters, such as the Ti:H2O ratio, anion content (e.g. Cl-), the pH, and the choice of reaction modulator 14, 15, 16, 17, 18, 19, 20. The hydrolysis of the Ti precursor is a critical step, which determines the initial monomer species and strongly impacts the resultant phase 17, 21. For instance, a change of molar ratios in the chemical environment (such as decrease in instantaneous concentration of Ti precursor) results in different hydrolysis speeds and time-dependent shifts of polymorph selectivity 22. The complexity of the method and the lack of detailed understanding of the chemical equilibrium of the species in solution and kinetics of nucleation and growth of the different phases makes it difficult to achieve and reproduce a substantial control over the relative phase content, usually obtaining a final mixture of anatase, rutile and brookite. Secondly, there are safety concerns over direct use of Ti alkoxides or chlorides in sol-gel as they are in general very reactive and sensitive to moisture. The hydrolysis is vigorous (even at 0 ∘C), hence, extensive precautions are necessary in handling these chemicals. Likewise, the sol-gel generates highly corrosive acidic conditions, since the alkoxide route requires acid catalysts (e.g. HCl, HNO3, H2SO4 17, 20, 22) to control the steps in the reaction and phase selectivity, whereas chloride precursors (TiCl4 or TiCl3) produce large amounts of corrosive HCl in situ during hydrolysis, which results in chloride-rich solutions with very low pH. Moreover, extensive dialysis/purification procedures are required to remove the byproducts of sol-gel synthesis adsorbed on the particle surface and strongly bound (e.g. Cl-, NO, NH) species obtained from precursors cannot be totally removed 19, 23. The doping impurities, secondary impurity phases and surface-adsorbed features definitely influence the surface properties, which can hinder the application potential of the material. For instancce, Aeroxide (Degussa) P25 - the most successful and used photocatalyst - is instead produced by pyrogenic flame-hydrolysis, in which vapourised TiCl4 is combusted in an oxy-hydrogen flame 24. The solid is then separated and treated with steam at 450-550 ∘C to remove chlorine-containing groups. The main advantage of pyrohydrolysis is that it is scalable to industrial levels. Nevertheless, a toxic chlorine-rich flame presents significant corrosive hazards and is unfriendly to the environment. Beyond the obvious concerns with environmental pollution, Ti chlorides are not easy to store and handle. Thus, it is a practically and scientifically important challenge to develop alternative precursors to control the size, polymorph content and morphology of TiO2 nanocrystals and, therefore, optimize the properties of material. A metal-organic precursor is more favourable than inorganic titanium chlorides, because it can be used in a chlorine-free system without related hazards, however, the widely used Ti alkoxides suffer from instability and poor cost-efficiency.
In this study we report the development of substitute precursors to produce nanostructured TiO2 via pyrolysis or thermal decomposition using metal-organic carboxylate-based extraction systems. Having the advantage of being inexpensive and environmentally friendly, metal carboxylate complexes have been used extensively in the production of nanoparticles of SMOs 25, 26, 27, 28, but the production of TiO2 nanoparticles from a carboxylate precursor has not been reported. Herein, Ti chloride is used as the initial titanium source preserving the key advantage of low cost, however, the chloride anions Cl- are avoided with the extraction system via aqueous/organic phase segregation and metal cation exchange resulting in in situ dialysis. The resulting precursors are storable and the nanostructured TiO2 is produced by non-hydrolytic pyrolysis. Thus, we are able to overcome many of the specific problems described above to achieve better particle size and polymorph control than hydrolytic routes by simply varying the temperature of pyrolysis.
2 Experimental
2.1 Preparation of Ti-containing organometallic precursor and pyrolization treatment
Initially, an aqueous solution of TiCl3 was produced by dissolving fine-grained c.p. titanium powder (1.2 g, particle size 63-100 m, -140+230 mesh) in boiling hydrochloric acid solution (60 ml, 1:1 vol.). The metal concentration was adjusted to 0.1M by dH2O addition (pH 0.5). Titanium-rich carboxylate-based organometallic precursor was produced by liquid-liquid extraction: 60 ml of TiCl3 aqueous solution and 20 ml (3:1 aqueous/organic volume ratio) of pentanoic acid (without diluent) were placed in a separation funnel; 1M NaOH soluion was added to the mixture in small portions, followed by vigorous shaking after each addition until the pH of the aqueous phase reached pH 1, after which the phases were allowed to separate for 0.5 h. After complete stratification and removal of the aqueous phase followed by filtration, a Ti-rich precursor E1 (0.15M Ti) was produced. To study the effect of precursor concentration on produced TiO2 a more concentrated precursor E2 (0.5M Ti) was prepared as described above, but with 5:1 aqueous/organic volume ratio. The precursors E1 and E2 were pyrolyzed for 1 h at 350 ∘C (E1/E2-350), 400 ∘C (E1/E2-400), 450 ∘C (E1/E2-450), 550 ∘C (E1/E2-550), 650 ∘C (E1/E2-650), 750 ∘C (E1/E2-750) in static air to sample the phase content of derived TiO2 nanoparticles 29.
2.2 Preparation of reference TiO2 by sol-gel
A reference sample was prepared by standard sol-gel method, using 250 ml of 0.1M TiCl3 aqueous solution produced in the previous step. The gel-like precipitate was obtained by dropwise addition of 0.5M NaOH aqueous solution at a rate of 3 ml/min under vigorous stirring until pH 6 of the solution was reached. The produced gel was aged for 24 h at ambient conditions, followed by filtration and washing with dH2O. The absence of chlorine in the decantate was checked by AgNO3 solution. The as-dried precipitate (P) was calcined at 450 ∘C (P-450), 550 ∘C (P-550), 650 ∘C (P-650), 750 ∘C (P-750) in static air to produce TiO2 nanoparticles.
2.3 Characterization
The thermal stability of the produced precursors was studied by thermal gravimetric analysis (TGA) and differential scanning calorimetry (DSC) using the STA PT1600 (LINSEIS) device. The sample was heated in static air from ambient temperature to 700∘C at a rate of 10 ∘C/min.
IR spectra were recorded at r.t. using Bruker Tensor II FT-IR spectrophotometer. For each spectrum 36 scans were performed in the range 4000-400 cm-1 with 7 mm KBr discs (TiO2/KBr mass ratio 1:100) prepared under a load of 2000 kg.
Powder X-ray diffraction (XRD) patterns of dried samples were recorded in range between 20∘ and 75∘ using D8 Advance (Bruker Corporation) diffractometer with CuK radiation ( = 1.5418Å), accelerating voltage 40 kV and current 40 mA; step size 0.02∘ at a scanning rate 2 s/step. Zero-background Si sample holders were used. The quantitative phase composition of the produced materials were determined by Rietvield refinement (FullProf Suite ver. 7.30), a whole pattern fitting method that systematically varies constraints in a simulated pattern to reproduce the experimental pattern. The refinement was performed starting from the identified crystal phases and known crystal structure data using isotropic size broadening (as confirmed by HRTEM snapshots), Pseudo-Voigt reflection profile approximation with Caglioti equation (FWHM) and experimental instrumental broadening parameters with standard reference material. The background was modeled using a 6th-order shifted polynomial. The parameters refined were zero shift, scale factors, unit cell and peak shape.
The morphology of the produced nanoparticles was checked by transmission electron microscopy (TEM) (FEI Technai G2 F20 operating at 200 kV) in bright field mode. Dynamic light scattering (DLS, Malvern Instruments, Zetasizer Nano S90) was used to measure the hydrodynamic size distribution in particle suspensions produced by electric ablation. For the measurement the initial suspension was diluted with distilled water to achieve optimum count rate.
The ferromagnetic properties of the produced samples were investigated by vibrating sample magnetometry (VSM). The magnetization curve was recorded at r.t. (Lake Shore Cryotronics instrument 7404VSM) in a field range up to 1 T. Several full magnetization cycles have been performed to detect potential hysteretic behavior.
3 Results and discussion
The preparation of reference sample (P) within a standard sol-gel procedure involves the hydrolysis of TiCl3, which generates highly acidic (low pH) and chloride (Cl-) rich solution. The selectivity of formed TiO2 polymorphs is highly dependent on instantaneous pH, Ti concentration and reaction time 23, 20, where small change in molar ratios would result in different phase structure 30. At high Ti concentration ([Ti] > 0.25 M) the solution will predominantly contain [TiO(OH2)5]2+ monomers and the condensation will proceed by olation by sharing equatorial edges 31 with formation of hydroxo bridges (Ti-OH-Ti) 22. In this case, rutile-rich crystallites are precipitated 31, 32, 33, 34, 35. To stabilize the production of anatase, Ti concentration was decreased to 0.1 M 23, 31, 22. Moreover, the pH was raised to 6 to avoid the formation of a substantial amount of brookite 23, 31, 35. Conversion of the amorphous hydrated precipitate (P) to crystalline anatase is realized by calcination treatment.
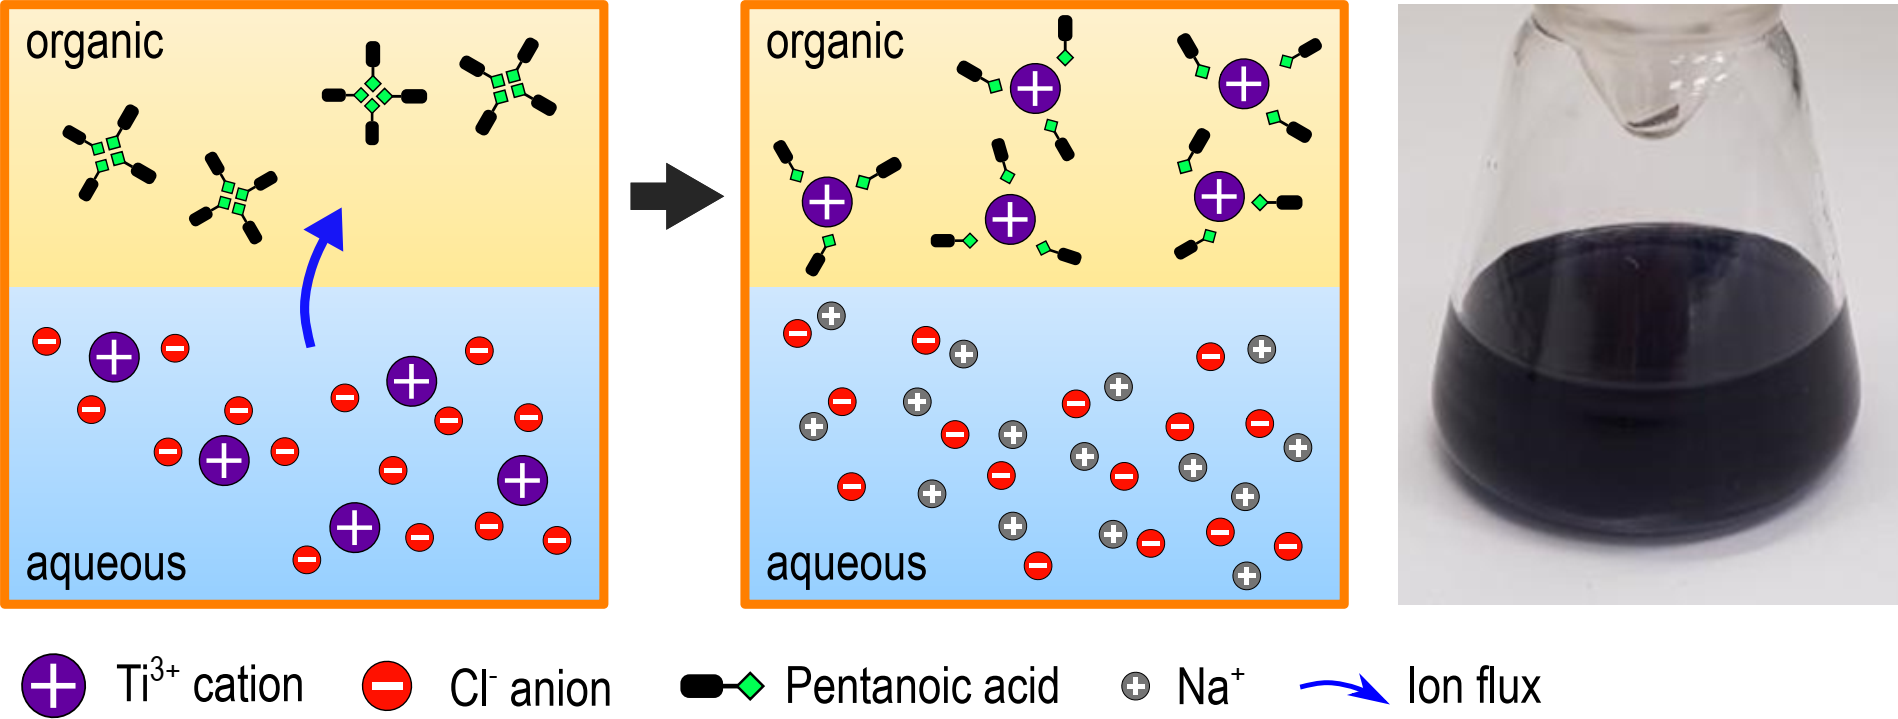
The organometallic Ti precursors E1 and more concentrated E2 were produced by liquid-liquid extraction: the extraction of Ti3+ from aqueous phase (aq) into the organic phase (o) by pentanoic acid is realized by cation exchange (Fig. 1), according to equation
Pentanoic acid is an efficient cation exchanger due to its favourable hydrophylic/hydrophobic balance. The organometallic extracts, which were brightly violet immediately after extraction (Fig. 1), decolorated shortly after production due to the change of the Ti oxidation state from Ti3+ to Ti4+ and were long-term storable.
3.1 Thermal analysis
The thermal behaviour of the precursors, phase transition and phase stability of produced TiO2 nanoparticles were studied using TGA-DSC analysis. The measured thermoanalytical curves in the range between 20 and 700 ∘C are shown in Fig. 2. The thermogravimetric analysis of the as-dried reference precipitate (P) shows active weight loss (ca. 20wt.%) when the sample is heated from r.t. to 200 ∘C, which is accompanied by a pronounced endothermic peak (peak max at 90 ∘C) in the DSC trace. This step is attributed to the loss of weakly bound physisorbed water from the surface of the particles. The second step in the range between 200 ∘C and 400 ∘C (peak max at 290 ∘C) is identified by a broad endothermic process related to the liberation of crystallization water and chemisorbed surface hydroxyls from hydrated precipitates (titanium oxyhydrate). This is accompanied by a small mass loss ca. 5 wt.%. According to the XRD results (see below) the crystallization of anatase from the precipitates starts at about 450 ∘C, which does not associate to any DSC event. Further temperature increase results in prolonged weight loss of the precipitates at a reduced rate, associated with continuing dehydration process up to 1000 ∘C.
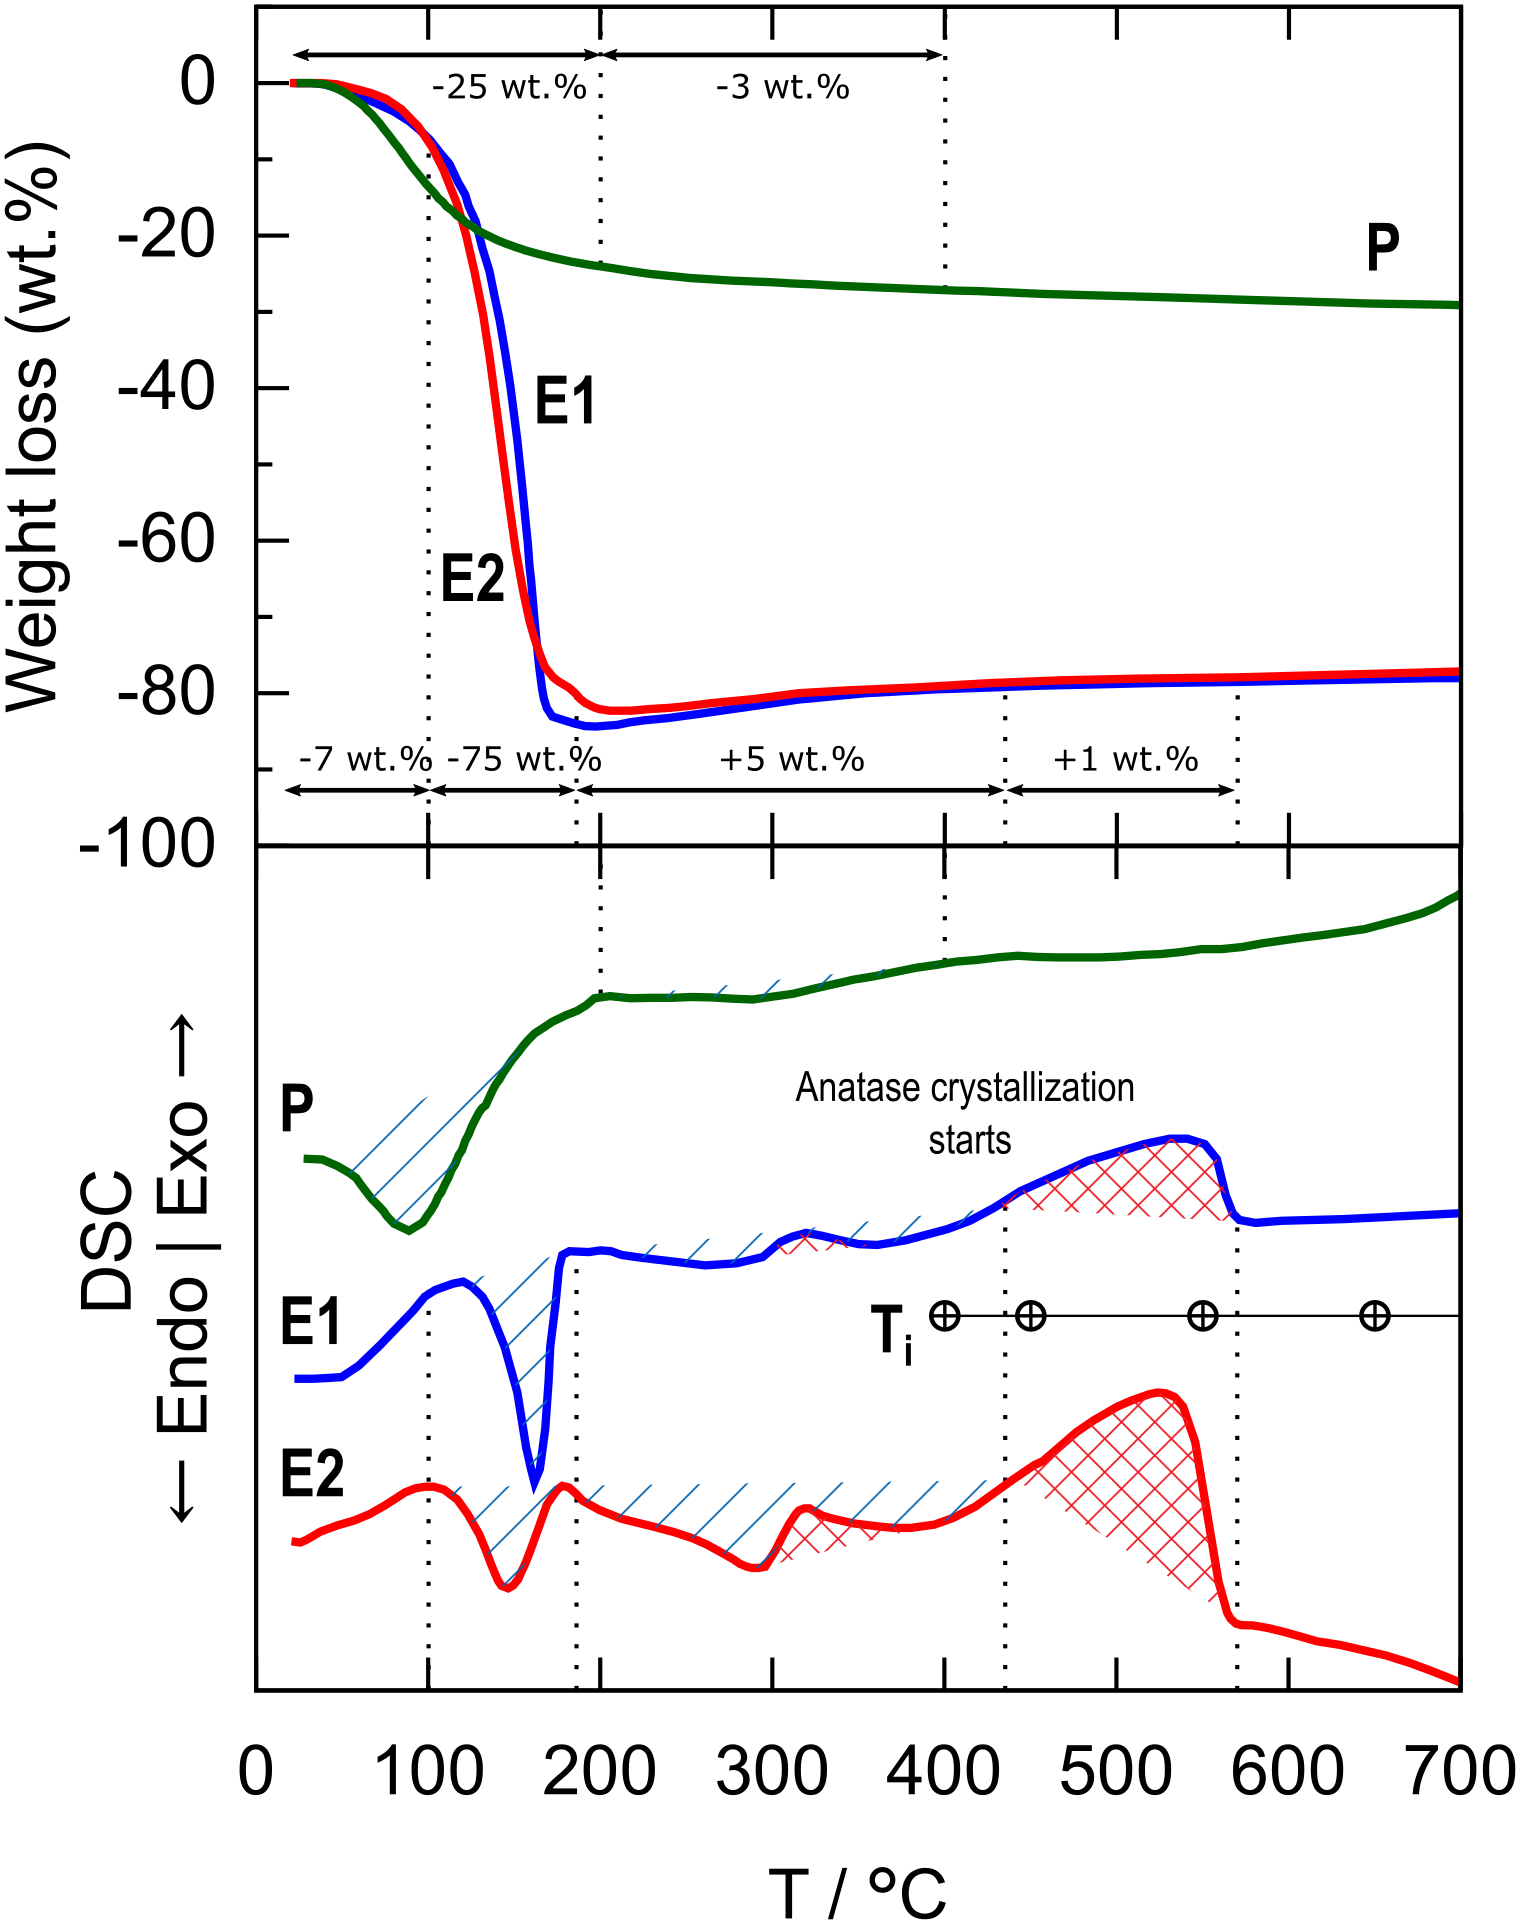
The organometallic carboxylate Ti precursors E1 and E2 produced by liquid-liquid extraction show a strong endothermic peak in the range between 100 ∘C and 186 ∘C related to the active evaporation of free extractant (pentanoic acid) and is accompanied by a pronounced mass loss ca. 75 wt.%, which terminates around the boiling point of pentanoic acid (Tboil=186 ∘C). At this point the mass loss ends and amounts to 80-85 wt.%. Further temperature increase initiates the thermal decomposition of non-reactive titanium pentanoate contained in the precursor, which should proceed according to the standard route for transition metal carboxylates 36, 37: Ti(OOCR)TiO2+2R2CO+2CO2. The decarboxylation of the organic component is accompanied by the formation of ketones containing 3 to 9 carbon atoms (i.e. dibutyl ketone, dipropyl ketone, diethyl ketone, acetone) 38, 39, 37. The ketones evolved during this process also undergo decomposition with atmospheric oxygen to yield CO2 and H2O 36. The third step in the temperature range between 200 ∘C and ca. 450 ∘C is marked by the broad endothermal process associated with breakdown of organic groups and release of volatile species, mainly CO2 and formed ketones 38, 39, 37. The signature of this process is more pronounced in the DSC trace of precursor E2 having higher Ti concentration. The liberation of the titanium ion from the organometallic precursor leads to the formation of amorphous nuclei of TiO2 nanoparticles. This process is accompanied by the gradual increase of the sample mass (by 5-6 wt.%) owing to the oxygen binding from the air during titanium oxidation. The exothermic event at ca. 320 ∘C in the DSC trace indicates the energy release from combustion/burning of carbonaceous residues. The more gradual removal of organic groups continues up to 450 ∘C, as shown by infrared spectroscopy (see below), which indicates that the carboxylate (COO-) functional group from pentanoic acid is fully desorbed at this temperature. TGA analysis shows that the conversion of titanium pentanoate to TiO2 is complete at 450 ∘C with no further mass change. As confirmed by XRD analysis (see below) the produced TiO2 is amorphous giving no XRD trace of crystalline structure. The formation of high crystalline anatase starts at ca. 450 ∘C accompanied by a broad exothermic process (peak max ca. 530 ∘C) associated with restructuring and grain growth of anatase particles. The transformation is completed at ca. 560 ∘C the product fully transforms into anatase phase.
| T, ∘C | Primary phase | Secondary phase | ||||||||||
|---|---|---|---|---|---|---|---|---|---|---|---|---|
| Unit cell, Å | wt.% | Phase | Crystallite | Unit cell, Å | wt.% | Phase | Crystallite | |||||
| a, b | c | size, dXRD | a, b | c | size, dXRD | |||||||
| Sol-gel reference sample (P) | ||||||||||||
| r.t. | - amorphous - | |||||||||||
| 450 | 3.795 | 9.492 | 100% | A | 7 nm | |||||||
| 550 | 3.793 | 9.497 | 100% | A | 9 nm | |||||||
| 650 | 3.790 | 9.504 | 95% | A | 12 nm | 4.593 | 2.958 | 5% | R | 18 nm | ||
| 750 | 4.596 | 2.960 | 79% | R | 64 nm |
|
9.181 | 21% | Imp. | 45 nm | ||
| Pyrolyzed carboxylate precursor E1 (0.15M) | ||||||||||||
| 350 | - amorphous - | |||||||||||
| 400 | - amorphous - | |||||||||||
| 450 | 3.794 | 9.481 | 100% | A | 8 nm | |||||||
| 550 | 3.790 | 9.504 | 100% | A | 15 nm | |||||||
| 650 | 3.788 | 9.513 | 65% | A | 24 nm | 4.596 | 2.961 | 35% | R | 27 nm | ||
| 750 | 4.593 | 2.960 | 100% | R | 59 nm | |||||||
| Pyrolyzed carboxylate precursor E2 (0.5M) | ||||||||||||
| 350 | - amorphous - | |||||||||||
| 400 | - amorphous - | |||||||||||
| 450 | 3.789 | 9.489 | 100% | A | 8 nm | |||||||
| 550 | 3.788 | 9.517 | 77% | A | 20 nm | 4.597 | 2.960 | 23% | R | 27 nm | ||
| 650 | 4.595 | 2.961 | 81% | R | 46 nm | 3.785 | 9.520 | 19% | A | 33 nm | ||
| 750 | 4.595 | 2.962 | 100% | R | 57 nm | |||||||
Gravimetric analysis confirmed 0.15M titanium loading in precursor E1 and 0.5M in E2, correponding to the efficiency of cation exchange 45% and 100% respectively. Higher ratio of aqueous to organic phase volumes (5:1 vs 3:1) achieves complete extraction and efficient loading of metal cations in the organic phase.
As evident from thermal analysis the formation mechanism of nanoparticles from produced organometallic precursors differ substantially from the standard hydrolytic sol-gel process. The details of the phase content, stability and surface functional groups of produced nanoparticles can be derived from the XRD and FTIR analysis.
3.2 XRD analysis
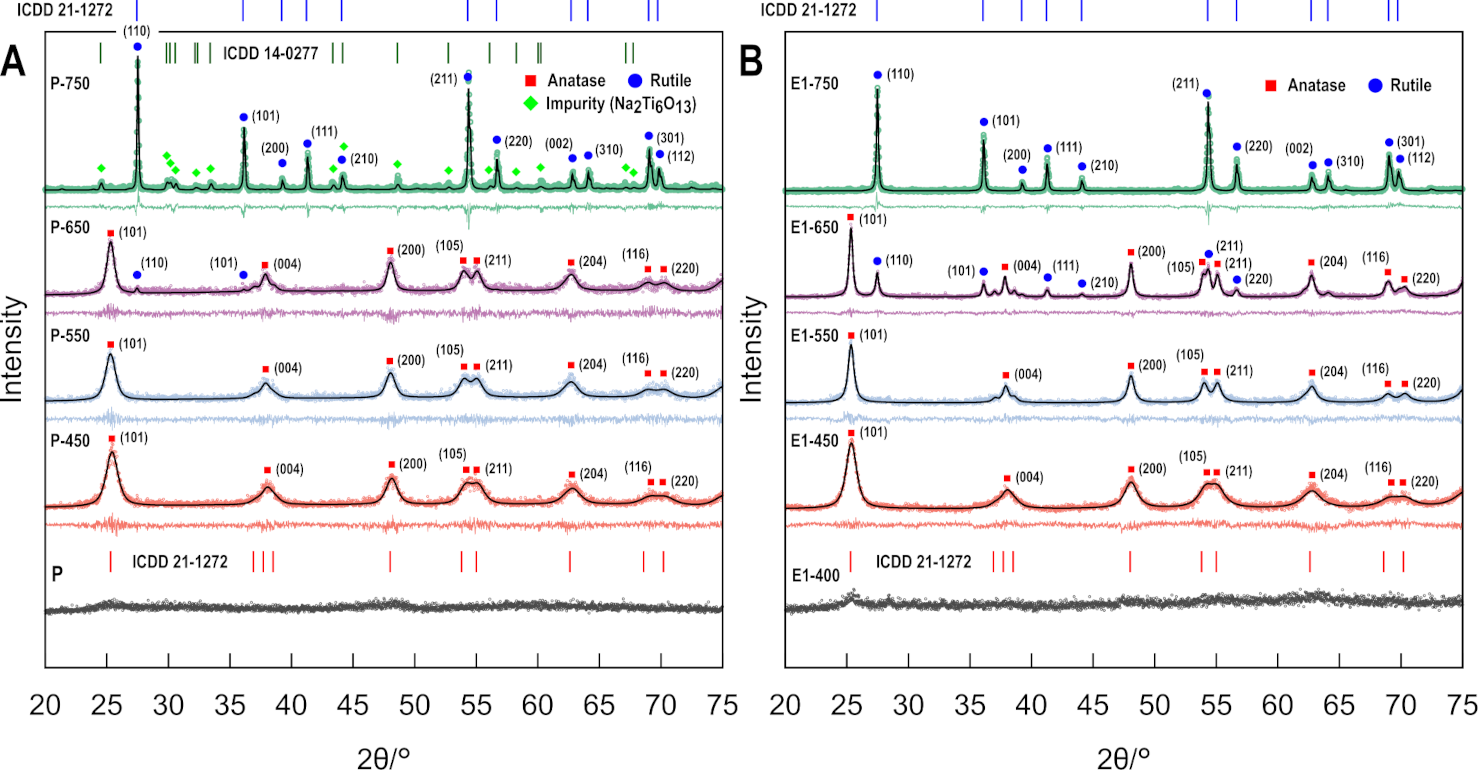
The precipitate (P) from standard "one pot" sol-gel system was used as precursor to produce TiO2 nanoparticles by calcination. The XRD patterns of calcined nanopowders are shown in Fig. 3A and used as reference. The XRD pattern of the as dried precipitate does not show clear signs of crystallinity, indicating that the TiO2 precursor before calcination is in amorphous state. The annealing temperature of 450 ∘C induces the crystallization of precipitate and distinctive peaks emerge, attributable to the tetragonal structure (space group: I41/amd) of crystalline anatase. All the peaks are fully indexed within ICDD PDF Pattern 00-021-1272 indicating that anatase titania has been formed at this temperature. The results of the Rietvield refinement concerning phase content and crystallite size are reported in Table 1.
Fig. 3B shows the XRD patterns of powders produced by pyrolysis of the organometallic precursor (E1). The sample pyrolyzed at 400 ∘C shows only a weak and diffuse peak at 2 = 25.3∘ attributable to the [101] reflection of anatase, which demonstrates that the sample still remains in mostly amorphous state. Pyrolyzation at 450 ∘C induces the formation of pure nano-crystalline anatase from this precursor. The corresponding diffractogram in Fig. 3B closely reflects the XRD pattern of precipitate (P) calcined at 450 ∘C (Fig. 3A) indicating identical phase state. The crystallite size of the produced anatase nanoparticles is ca. 7-8 nm (Table 1).
When the processing temperature of the precursors is increased to 650 ∘C weak [110] (27.4∘, 100% intensity) and [101] (36.1∘) reflections appear in the XRD pattern of calcined precipitates corresponding to the tetragonal structure (space group: P42/mnm) of crystalline titania rutile polymorph, which marks the beginning of a high-temperature anatase-to-rutile transformation accompanied by rapid grain growth (Table 1). The diffractograms of powders obtained by pyrolyzation of organometallic precursor at this temperature show additional reflections of rutile. All additional peaks are readily indexed within standard ICCD PDF Pattern 00-021-1276 for rutile.
At 750 ∘ both precursors complete the transformation from anatase to rutile and rutile becomes the predominant crystalline phase. This course of transformation is consistent with previous reports 40, 41. No traces of brookite phase are found in any of the samples as confirmed by the absence of indicative [121] (30.8∘, 90% intensity) reflection (ICDD PDF 00-029-1276).
At 750 ∘C simultaneously with the anatase to rutile transformation the calcination of the precipitate obtained by the reference method finally leads to the crystallization of the impurity phase in P-750 (Fig. 3A) identified as sodium titanate Na2Ti6O (ICDD PDF 00-014-0277, space group: C12/m1). It is evident that an appreciable amount (ca. 20%, Table 1) of by-products of the standard monophasic "one-pot" synthesis are remaining in the produced materials despite extensive purification measures and the confirmed absence of chloride in washwater effluent. In this case sodium from the precipitating basic agent NaOH binds the chloride from the titanium chloride solution forming a large amount of sodium chloride in the precipitate, which is difficult to remove. The impurity phase becomes apparent in the XRD as the product of the high-temperature reaction between the unremoved residues of the sodium salt and titanium dioxide during calcination. In industrial pyro-hydrolysis process used to produce commercial TiO2 the powder is treated with steam at 450-550 ∘C to remove chlorine-containing groups. Our results show that within the non-hydrolytic extraction-pyrolysis method the purification is achieved already at the precursor preparation stage, employing a biphasic system, in which one of the phases accumulates the target product, Ti-containing organometallic compound, and the other accumulates by-products of the synthesis, in this case chloride anions.
Moreover, non-hydrolytic pyrolysis of organometallic extract allows facile phase control by just varying the temperature of the pyrolytic treatment. The samples E1-550 and E2-550 produced by pyrolysis at 550 ∘C mimic the mixed phase content of Aeroxide P25, consisting of ca. 70-80 wt.% anatase and 20-30 wt.% rutile with ca. 20-27 nm particle size in both phases (Table 1). The phase evolution of the particles is independent of the concentration of organometallic precursors, with just the start of the anatase-to-rutile conversion beginning at ca. 100 ∘C lower temperature, which allows to use concentrated precursors to produce phase-pure anatase.
3.3 TEM analysis
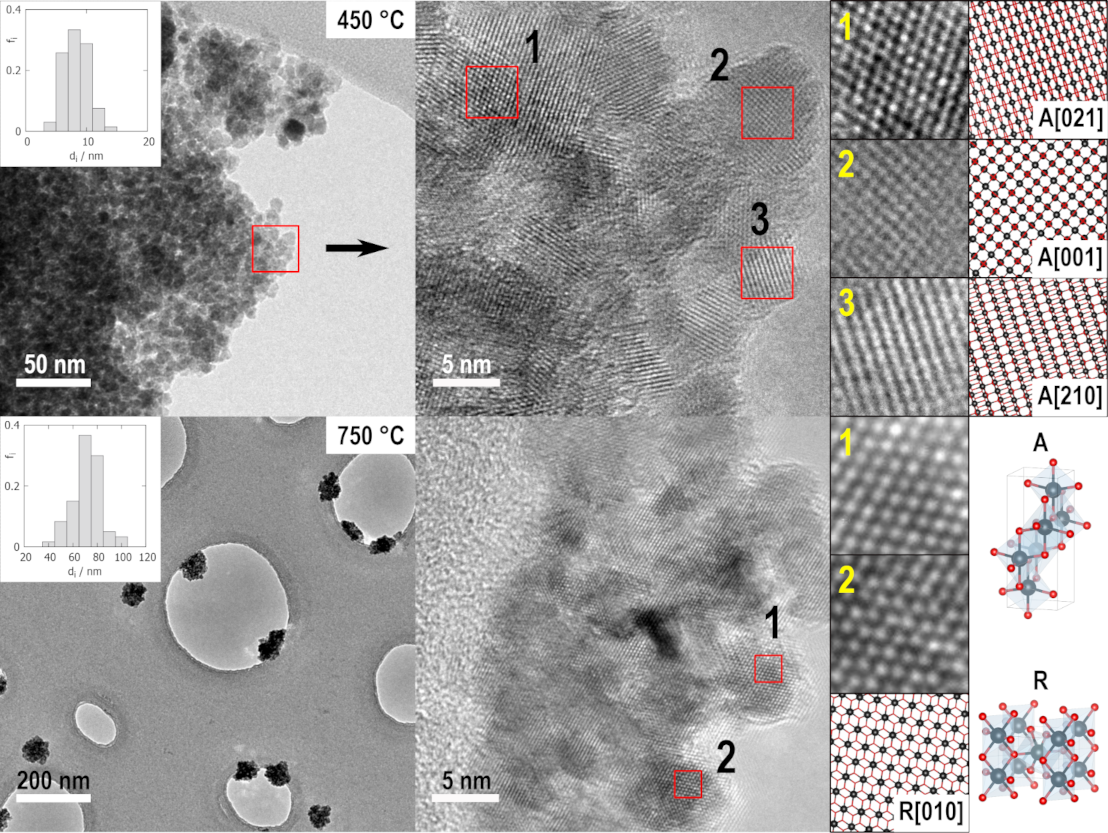
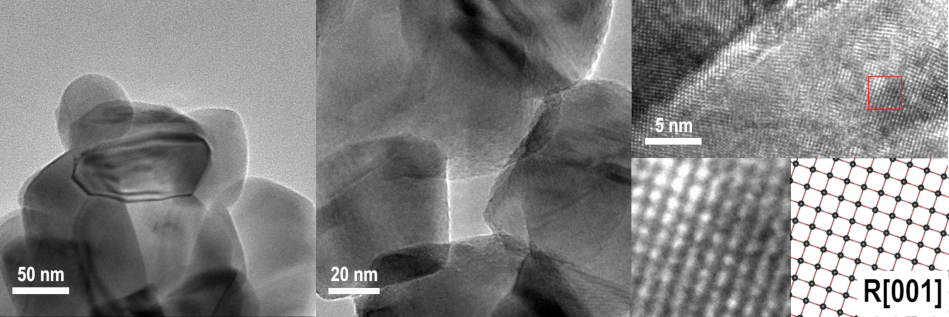
Fig. 4 shows characteristic TEM snapshots of TiO2 particles produced by pyrolyzation of organometallic precursor E1 at 450 ∘C (E1-450). The particles are roughly spheroidal, which is characteristic for nucleation directly from the amorphous state. A tight size distribution is measured by particle counting with an average size of 8.3 nm in agreement with XRD assessment based on Rietvield modelling (Table 1). High resolution TEM shows lattice fringes unambiguously identifiable as projections of anatase crystal structure.
As indicated by DSC analysis (Fig. 2), at ca. 560 ∘C the amorphous phase is fully expended and the primary crystallite formation terminates. Pyrolyzation at higher temperature is accompanied by primary crystallite fusion with simultaneous anatase-to-rutile transition. Fig. 4 shows the particles pyrolyzed at 750 ∘C (E1-750). The highly irregular-shaped particles are constructed by joining of a number of ca. 10 nm primary crystalline grains forming secondary aggregates. According to strict thermodynamic arguments, single-phase anatase is only stable below ca. 11-14 nm size due to its slightly lower surface free energy 42, with rutile being the macroscopically (ca. >35 nm) stable polymorph 42, 43, 44. Epitaxial attachment of aggregated phase-pure anatase nanoparticles leads to joining on their facets, where the rutile nucleation is initiated assisted by intermediate phase, e.g. brookite 45, 46, 47 or high-pressure TiO phase 48, formation at twinned interface between contacting anatase grains 45, 47, 49, 50. Rutile transformation then propagates rapidly into the bulk of the crystallites. The epitaxially fused nanoparticles with the rutile structure are noted in the high resolution TEM snapshots. Close inspection of TEM microphotographs (Fig. 4) clearly reveals that the particles have many adjacent rutile crystallites sintered together and crystallographically aligned with respect to each other. The average size of the secondary aggregates is 70.3 nm, consistent with XRD analysis (Table 1).
3.4 Infrared (IR) spectroscopy
While XRD provides the information about the bulk of the particles, FT-IR is a surface-sensitive method. It probes the the surface region and chemistry of the particles, which is not identified by XRD.
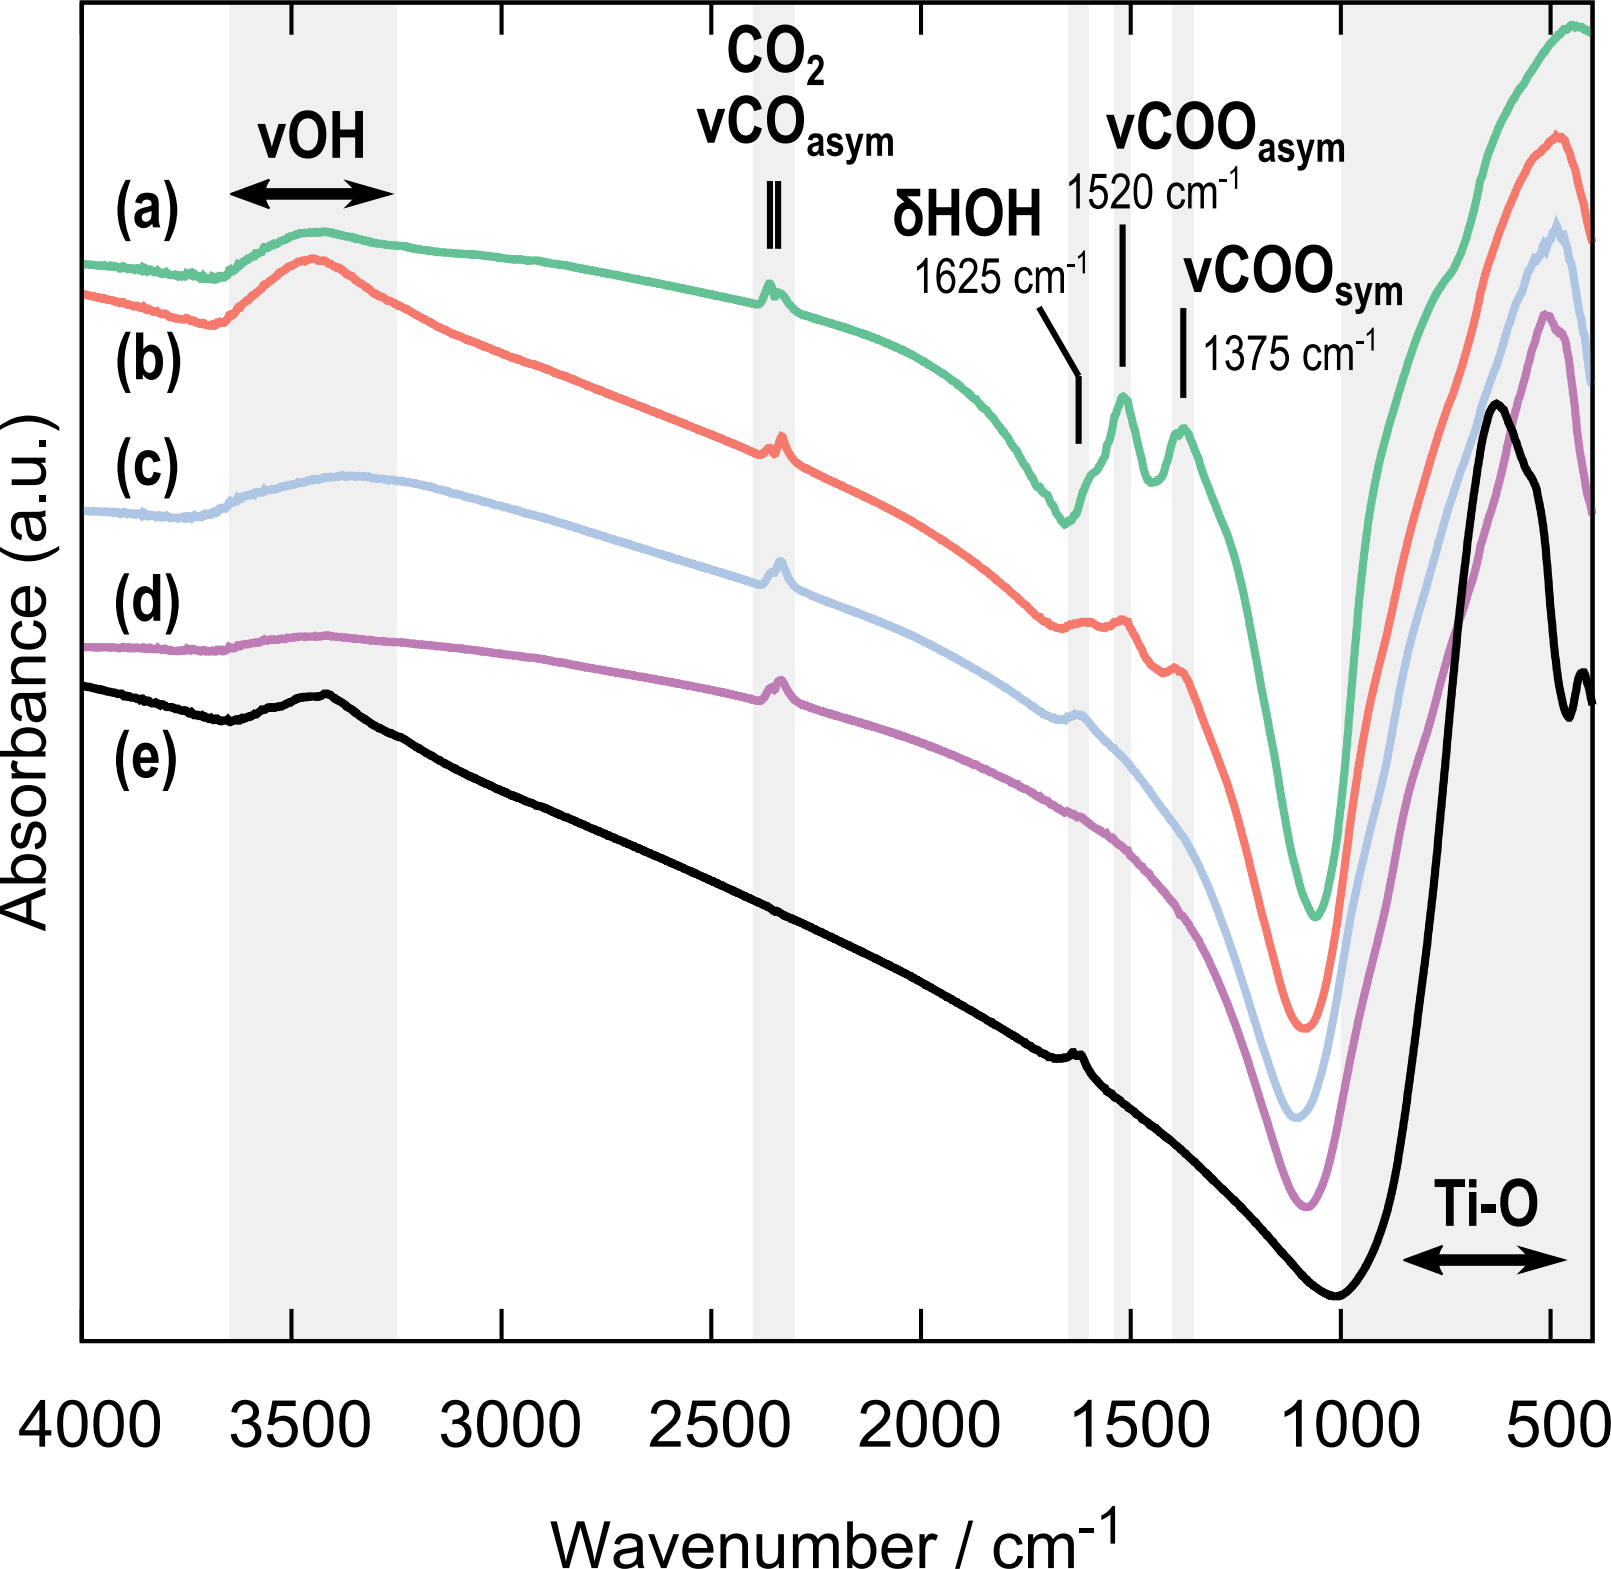
FT-IR spectra of nanoparticles produced by pyrolyzation of carboxylate precursor (E1) are shown in Fig. 5. The broad IR absorption band at 3200-3600 cm-1 in all samples corresponds to the stretching vibration of the hydroxyl groups (OH) terminated on TiO2 surface (Ti-OH) and adsorbed molecular water. The spectrum band centered at 1625 cm-1 is from the bending vibration of chemisorbed water H-O-H. Weak absorbance doublet at 2341 cm-1 and 2360 cm-1 is due to asymmetric C-O stretching vibration of carbon dioxide. Since this band is present only in the pyrolyzed samples, we ascribe it to CO2 residues from the oxidation of pentanoic acid captured on the pores in the nanopowder***cf. Fig. 5e, showing FT-IR of nanoparticles produced by electrodispersion of initial metallic powder without any chemicals and calcined at high temperature (see below). Peaks at 1375 cm-1 and 1520 cm-1 represent symmetric COO and asymmetric COO stretching modes of the carboxylate (COO-) functional group 51 coming from the organic component of the precursors used in the synthesis process. The magnitude of the separation between carboxylate stretches = COO - COO=145 cm-1 is consistent with the value for ionic carboxylate complexes (164 cm-1 for ionic acetate 52). This typically indicates that the carboxylate group is bound to the surface Ti-centers in bidentate bridging configuration 53, where one metal cation is bound to one of the oxygens of the COO- group and another metal cation to the other oxygen. Carboxylate vibrations disappear with pyrolyzation temperature starting at 450 ∘C, indicating complete elimination of organic residues when the anatase crystallization starts. A remaining broad and strong absorption band between 1000 and 400 cm-1 envelops a set of peaks corresponding to the intrinsic Ti-O-Ti, O-Ti-O and Ti-O lattice vibrations of nano-crystalline titanium oxides 54.
3.5 Defect-induced room-temperature ferromagnetism
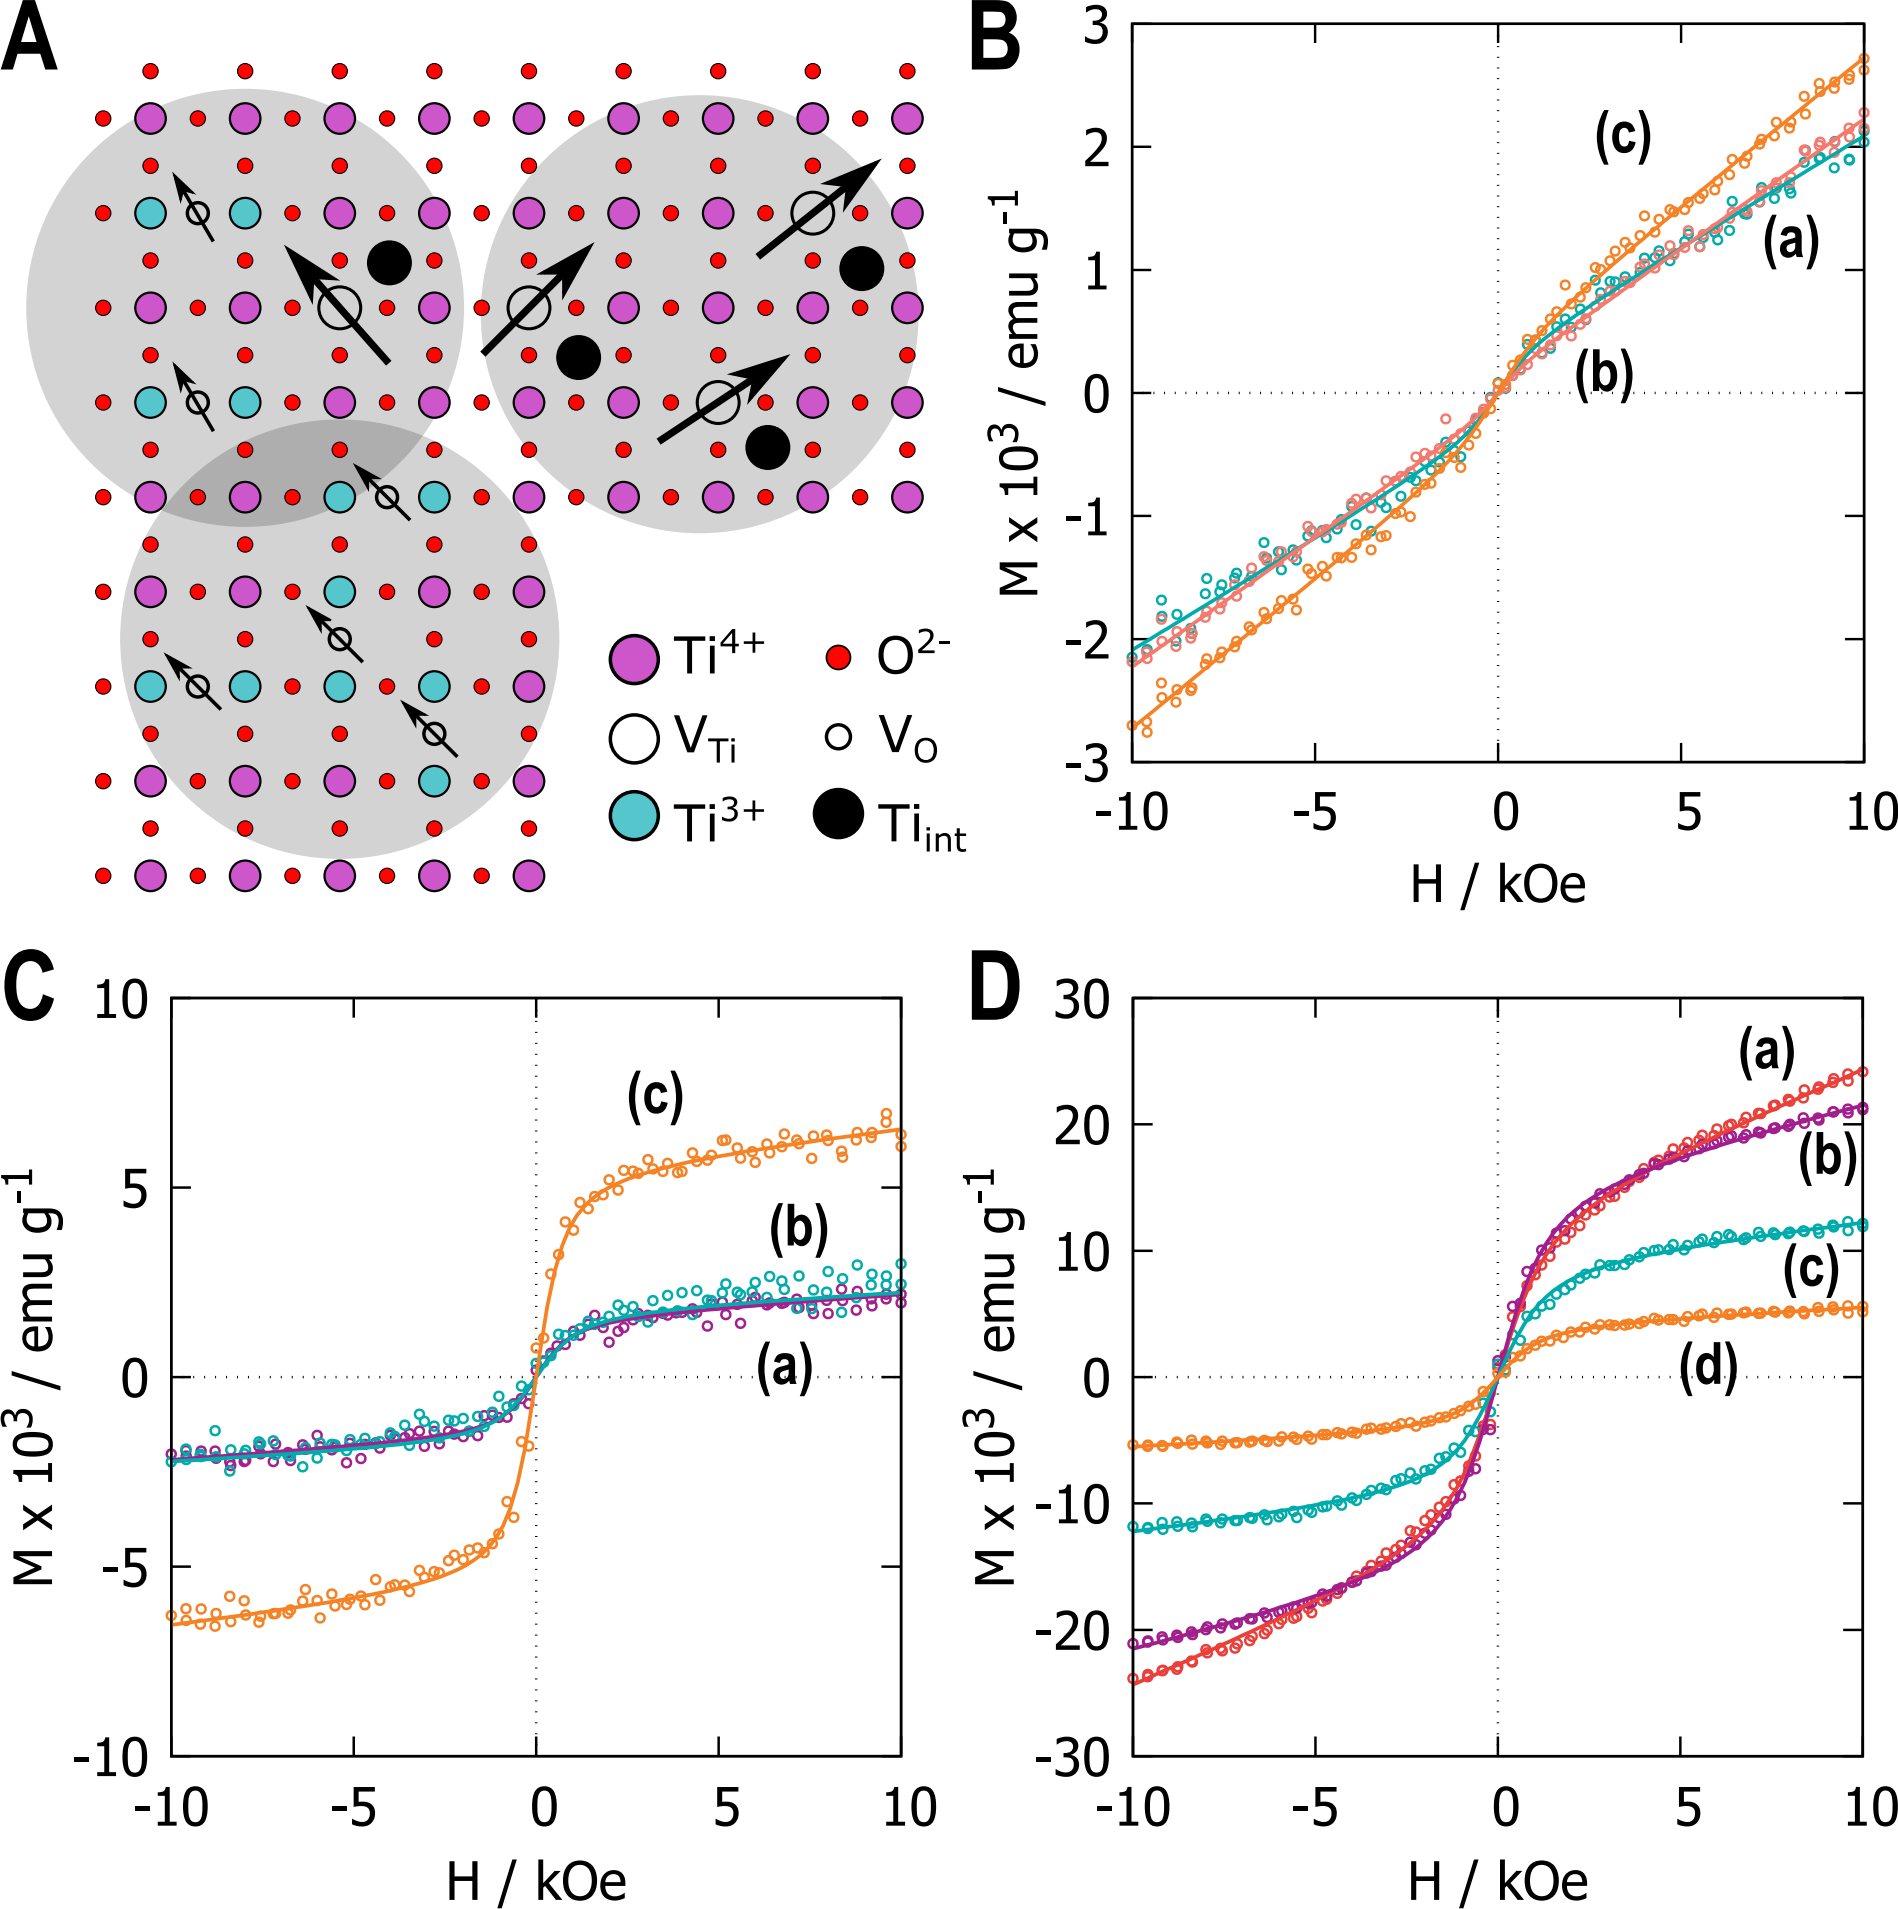
To obtain an estimation of the defect content in the produced materials we characterize their ferromagnetic behaviour by VSM. The recorded magnetization curves M-H are shown in Fig. 6 with the magnetic field varying in the range between -10 kOe to +10 kOe. TiO2 precipitates produced by standard sol-gel are predominantly paramagnetic (Fig. 6B), irrespective of the calcination temperature. The mass magnetic susceptibility of the samples calcined at 550 ∘C (P-550) and 650 ∘C (P-650) having anatase as the dominant phase is ca. cm3 g-1. The anatase-to-rutile transition in the calcined samples is accompanied just by a slight increase in at 750 ∘C (P-750, Table 2).
| T, ∘C | / | / | / | / |
| cm3 g-1 | emu g-1 | g-1 | ||
| Sol-gel reference sample (P) | ||||
| 550 | 1.8 | 0.3 | 0.3 | 12 |
| 650 | 2.1 | 0.1 | 0.1 | 15 |
| 750 | 2.4 | 0.3 | 0.4 | 9.7 |
| Pyrolyzed carboxylate precursor (E1) | ||||
| 450 | 0.6 | 1.6 | 1.5 | 12 |
| 550 | 0.5 | 1.8 | 2.0 | 9.7 |
| 750 | 1.3 | 4.8 | 4.0 | 13 |
| Electrodispersed sample (ED) | ||||
| 350 | 12.0 | 13 | 16 | 8.6 |
| 450 | 6.8 | 15.5 | 19 | 8.6 |
| 550 | 3.2 | 9.5 | 12 | 8.6 |
| 750 | 1.4 | 4.3 | 4.8 | 9.7 |
In contrast, the M-H curves of powders produced by pyrolyzation of organometallic precursor (Fig. 6C) show distinct room-temperature ferromagnetism superposed by the paramagnetic process. For all recorded magnetization curves the hysteresis is negligible with small values of coercitive field ranged within 50-90 Oe and the remanence factor varying around 5-8%, indicating soft superparamagnetic-like behaviour characteristic for d0 ferromagnetism 55.
Stoichiometric TiO2, having all Ti in 4+ oxidation state is non-ferromagnetic due to the lack of unpaired electrons. Likewise, no magnetic impurities are introduced during the preparation or handling of the samples. The staring metallic Ti powder is chemically pure titanium as confirmed by X-Ray fluorescence. The content of magnetic impurities, i.e. Fe, Ni or Co, is below 0.1 at.%. The doping of the produced particles by the trace elements potentially present in the precursors is discarded as the origin of room-temperature ferromagnetism, because all samples were produced from the same metallic powder. Moreover, the absence of impurities in the sample produced by pyrolyzation of organometallic precursor is assured, on account of high selectivity of pentanoic acid extractant towards titanium ions and unfavorable conditions for the concurrent bi-phasic extraction of other metallics in precursor preparation. Hence, room temperature ferromagnetism (RTFM) in the pyrolyzed samples is due to the intrinsic defects in the nanoparticles.
The origin of RTFM, known also as d0 magnetism, in undoped semiconducting metal oxides (SMO) is ascribed to intrinsic defects in the crystal lattice, generated during the production process 56. The emergence of ferromagnetism is typically accompanied by a high number of oxygen vacancies VO in the anionic sublattice of TiO2 films 57, 58, 59, 60, nanoparticles 61, 30 and single crystals 62, 63. Likewise, the defect complex Ti3+-VO was noted, which forms when oxygen is removed: the charge imbalance makes unpaired excess electrons occupy 3d state of nearby Ti ions, generating reduced Ti3+ ions and providing the local magnetic moments 64, 65. In oxygen-defficient TiO2-δ nanoparticles the reduction mechanism Ti4+ Ti3+ can also be initiated by Ti interstitials, without involving oxygen vacancies 66. Moreover, cationic vacancies VTi were shown to produce d0-ferromagnetism 67, 68. The balance of these defects is strongly dependent on the preparation method.
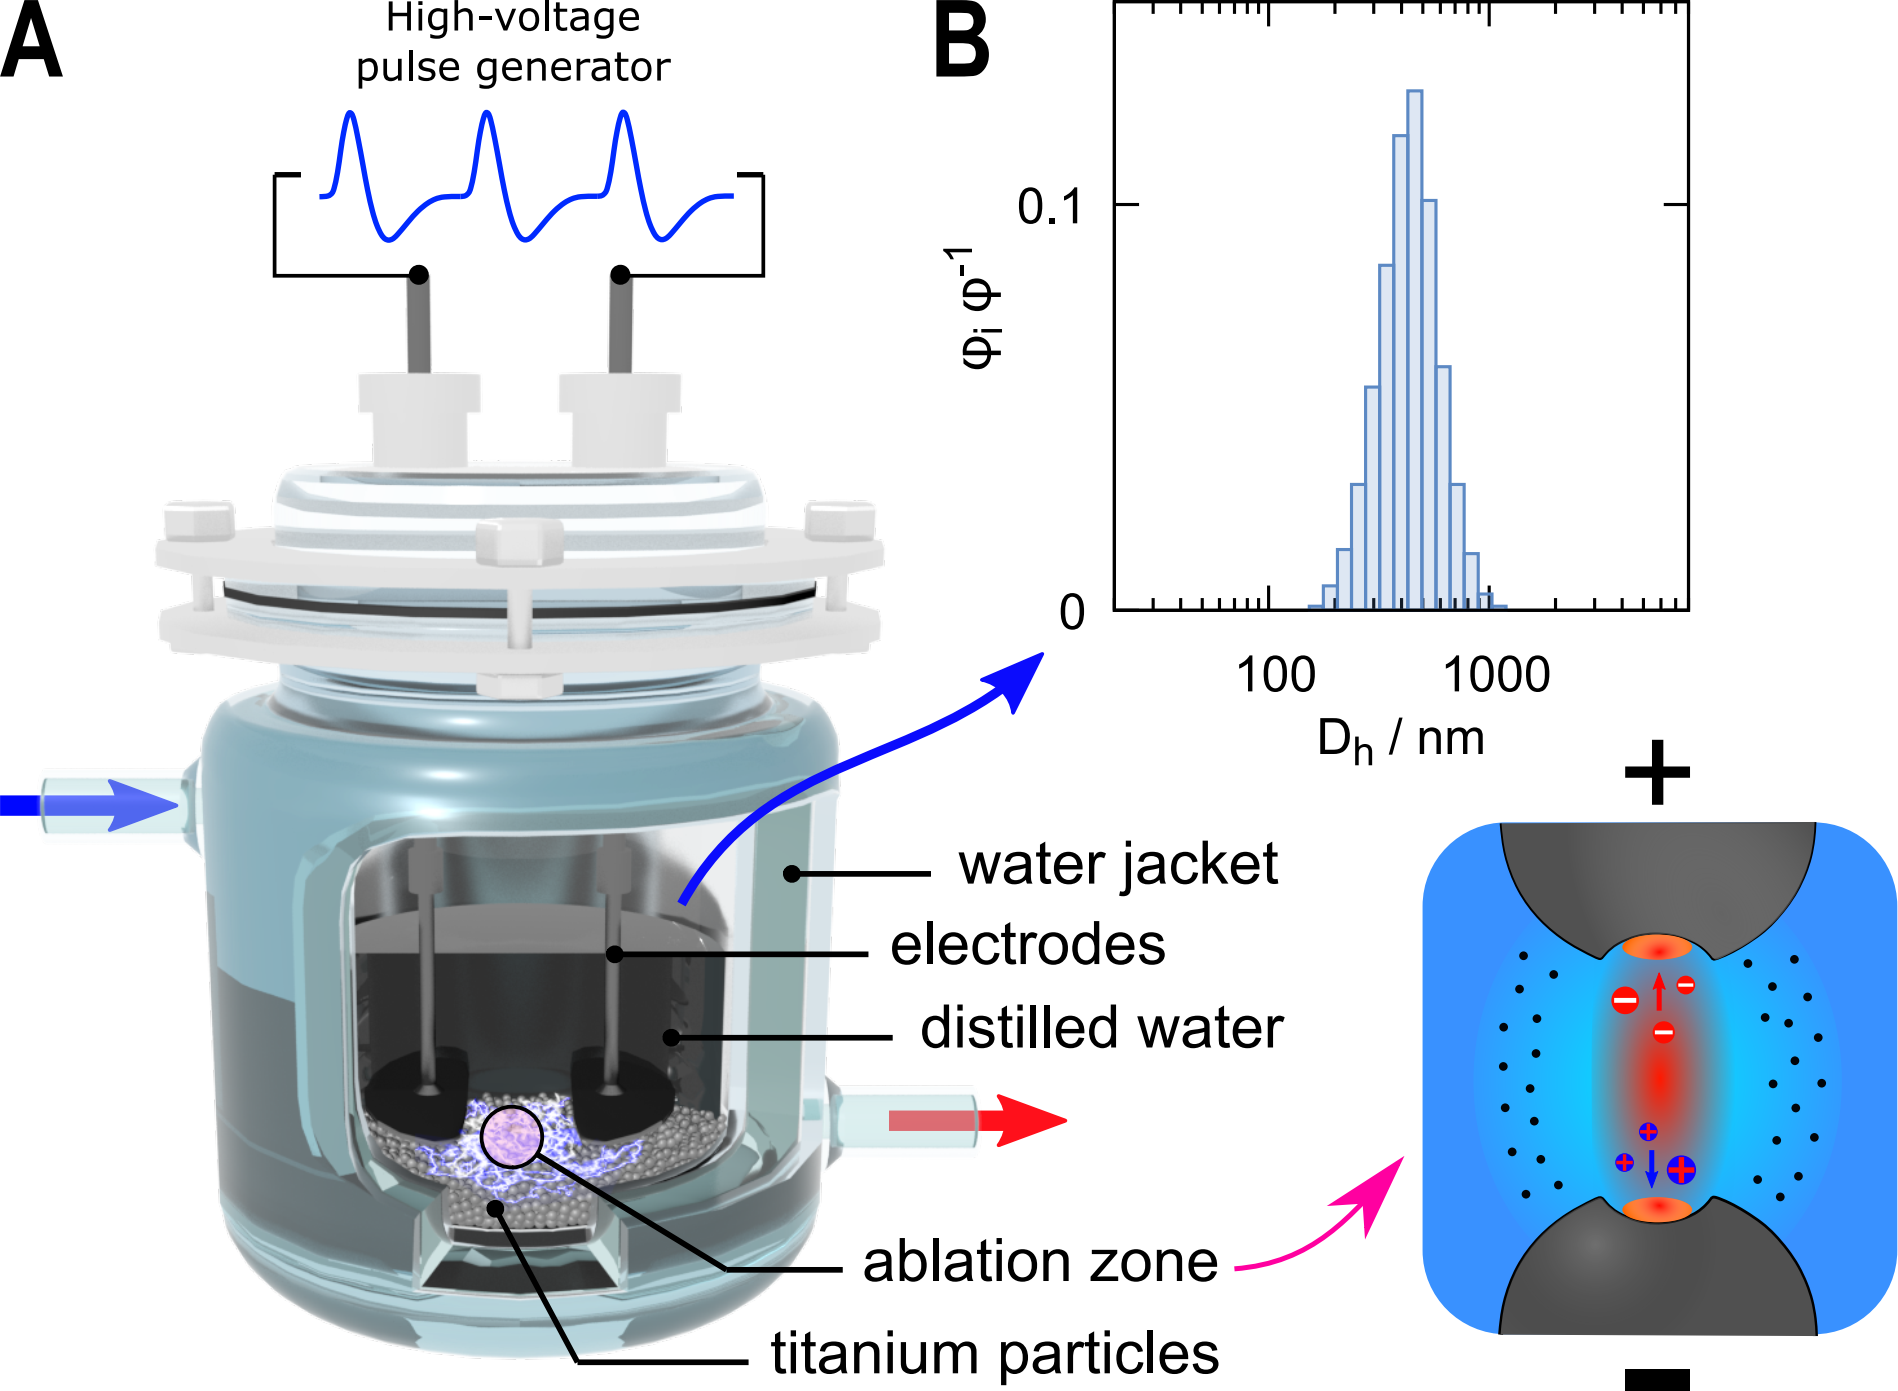
In view of this, we have produced a reference sample with high defect loading by physical condensation - direct electric ablation of the starting metallic titanium precursor without additional chemicals, using a device shown schematically in Fig. 7A 69.
| T, ∘C | Unit cell, Å | wt.% | Phase | Crystallite | |
|---|---|---|---|---|---|
| a,b | c | size, dXRD | |||
| r.t. | 4.190 | 4.190 | 62% | TiO | 26 nm |
| 5.092 | 13.811 | 25% | Ti2O3 | 12 nm | |
| 5.148 | 9.580 | 13% | Ti3O | 35 nm | |
| 350 | 4.187 | 4.187 | 53% | TiO | 23 nm |
| 5.066 | 13.803 | 19% | Ti2O3 | 12 nm | |
| 5.147 | 9.548 | 16% | Ti3O | 26 nm | |
| 3.787 | 9.428 | 12% | A | 24 nm | |
| 450 | 4.589 | 2.961 | 45% | R | 13 nm |
| 3.785 | 9.526 | 23% | A | 52 nm | |
| 4.195 | 4.195 | 14% | TiO | 37 nm | |
| 5.134 | 9.626 | 9% | Ti3O | 28 nm | |
| 5.149 | 13.642 | 9% | Ti2O3 | 12 nm | |
| 550 | 4.593 | 2.958 | 71% | R | 27 nm |
| 3.784 | 9.519 | 22% | A | 49 nm | |
| 5.124 | 9.659 | 7% | Ti3O | 27 nm | |
| 650 | 4.596 | 2.961 | 81% | R | 33 nm |
| 3.786 | 9.526 | 18% | A | 52 nm | |
| 5.137 | 9.695 | below 5% | Ti3O | 10 nm | |
| 750 | 4.596 | 2.961 | 86% | R | 52 nm |
| 3.786 | 9.527 | 14% | A | 62 nm | |
| 850 | 4.593 | 2.960 | 100% | R | 73 nm |
| 3.786 | 9.491 | below 5% | A | 28 nm | |
Briefly, a 20 g portion of metallic titanium powder was added to 200 ml of distilled water forming a particle bed. Flat titanium electrodes connected to a spectrometric discharge generator operating at 100 Hz and 2 kV were pressed onto the particle bed. After turning on the generator a luminous network of intermittent sparks appears within the particle bed. Reactive dispersion of titanium using distilled water as the working dielectric is accompanied by rapid ejection and oxidation of vaporized titanium and the formation of titanium oxide nanoparticles. The rapid in situ quenching leads to a highly defected oxygen-deficient structure.
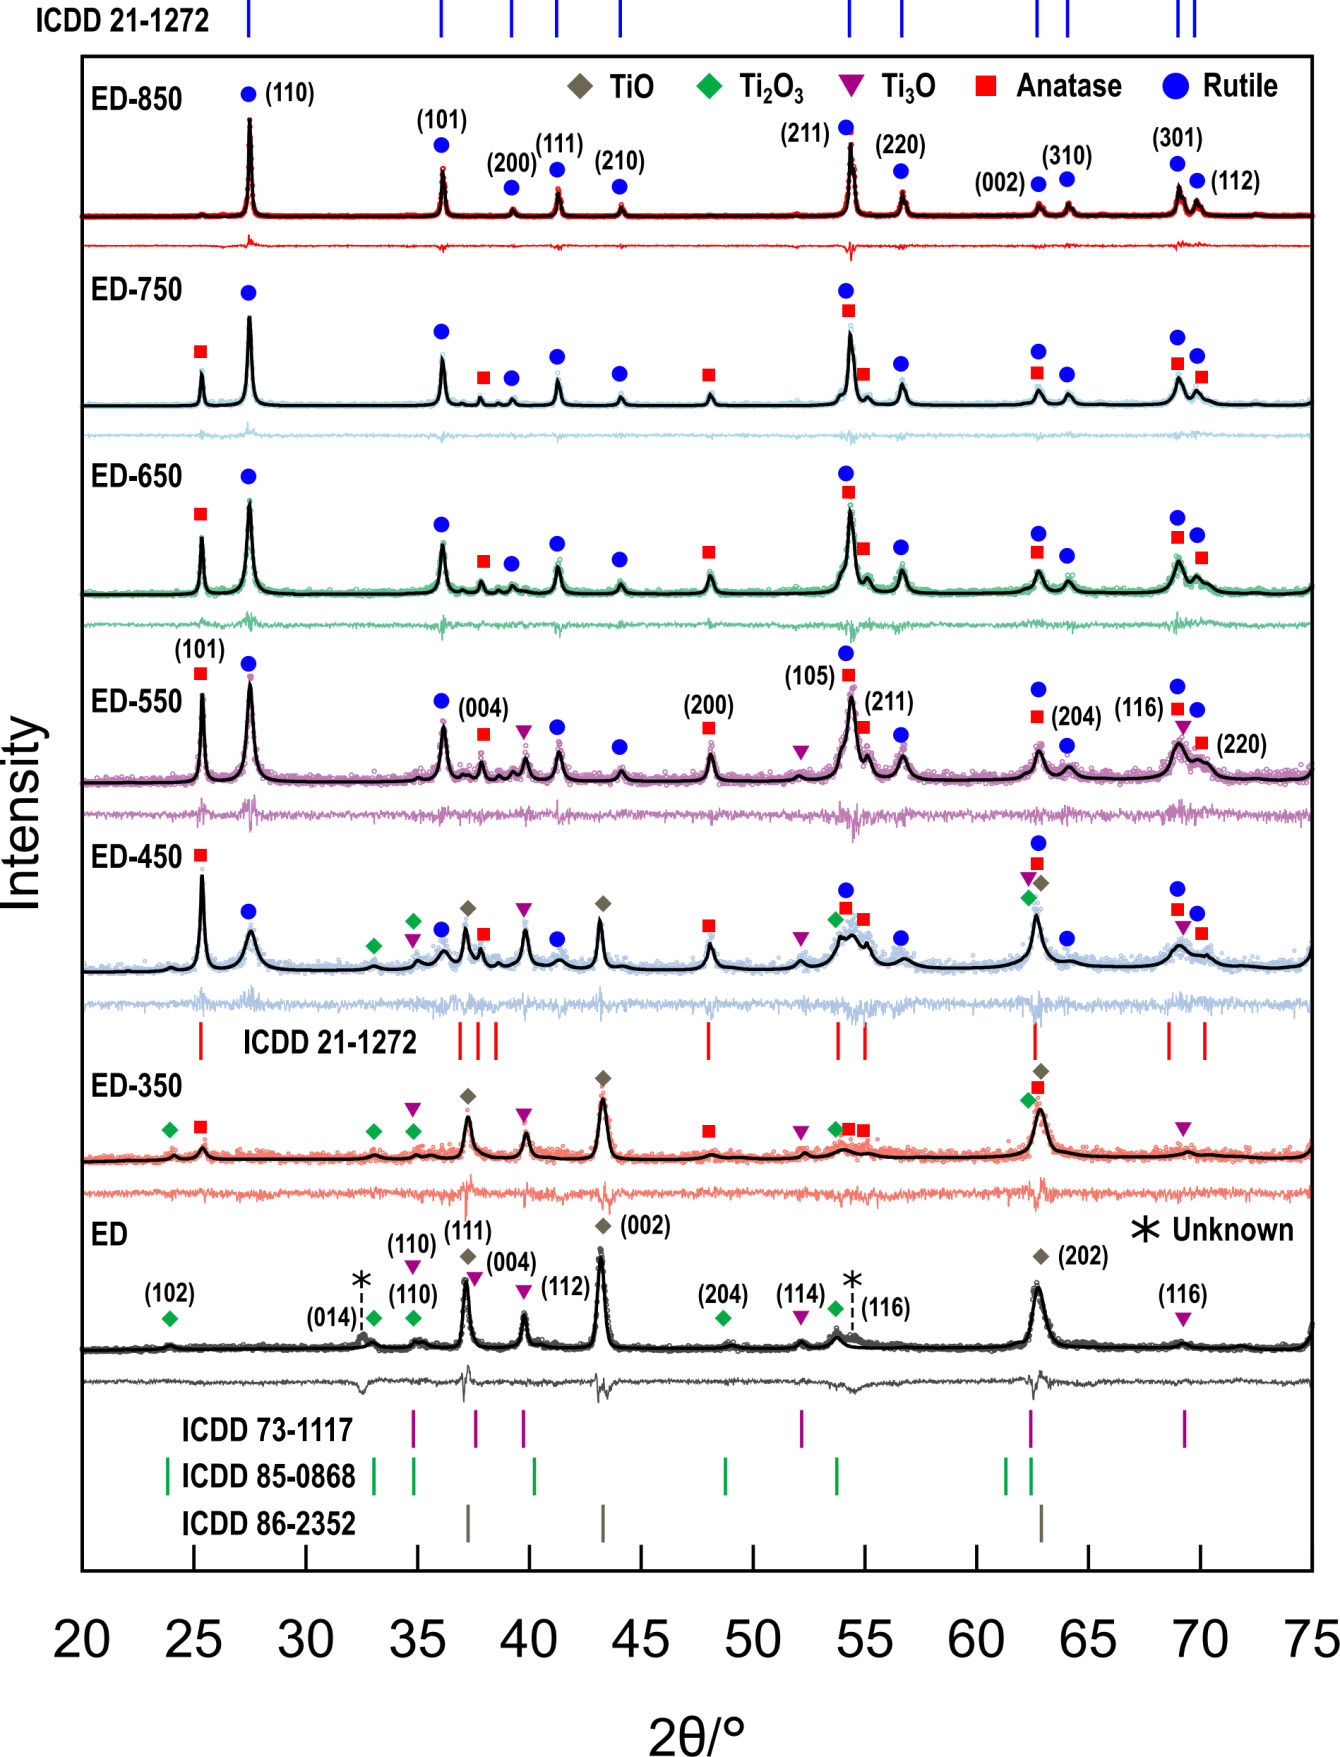
The initially transparent liquid turned completely black after 30 min of device operation, evidencing the condensation of nanodispersed phase. Dynamic light scattering (DLS, Malvern Instruments, Zetasizer Nano S90) (Fig. 7B) showed that the hydrodynamic particle size in the decanted supernatant varies in a broad range between ca. 100 nm to 1 m, which indicates that the particles form associates in liquid medium due to the lack of stabilization 70, 71, 72, 73, 74. The produced suspension was dried, the electrodispersed nanopowder (ED) was calcined at 350 ∘C (ED-350), 450 ∘C (ED-450), 550 ∘C (ED-550), 650 ∘C (ED-650), 750 ∘C (ED-750), 850 ∘C (ED-850) in static air for 2 h to sample phase structure transformation and ferromagnetic properties.
The phase content of electrodispersed nanoparticles is non-stoichiometric oxygen-deficient oxides (Fig. 9, Table 3), predominantly titanium monoxide TiO (space group: Fm-3m, indexed within ICDD PDF 01-086-2352), which is able to accommodate up to 10-20% of O vacancies in the cubic structure 75, but also trigonal Ti2O3 structure (space group: R3c, ICDD PDF 01-085-0868) and cubic Ti3O structure (space group: P-31c, ICDD PDF 01-073-1117) have been found with average crystallite size ca. 25-35 nm. Anatase appears after calcination at 350 ∘C and the content of non-stoichiometric oxides begins to decrease due to a more complete oxidation. A mixed phase sample ED-750 of stoichiometric anatase (14 wt.%) and rutile TiO2 (86 wt.%) is finally obtained calcining at 750 ∘C with grain size ca. 50-60 nm. Higher calcination temperature (850 ∘C) completes the anatase-to-rutile transition with particles having slightly irregular rounded shape (Fig. 8) and the lattice fringes are fully indexed to projections of rutile structure.
As expected, due to non-stoichiometry and a high defect content generated by the very rapid reactive quenching of electrically ablated vapourized material in surrounding water, the produced nanoparticles show significantly enhanced ferromagnetic properties (Fig. 6D).
Theoretical studies indicate that concentrated cationic 67 and anionic 76 defects couple ferromagnetically by exchange interaction, forming bound magnetic polarons (BMPs), which are bubbles of ferromagnetially ordered spins (Fig. 6A) 56. More quantitative understanding of the polaron-induced magnetism can be obtained within the BMP-model by fitting the measured magnetization with the equation of the type 56, 65, 77, 78
| (1) |
where the first term describes the superparamagnetic contribution and the second term describes to first order of magnetic field H the paramagnetic processes in non-ferromagnetic matrix, which are not related to the superparamagnetic properties of the sample. Here, is the saturation magnetization [emu g-1], which is the product of the number of bound magnetic polarons involved in the polarization process per unit mass of the sample [g-1] and - the spontaneous dipole moment [erg G-1] of a polaron; is the Langevin function, - Langevin parameter, erg K-1 is the Boltzmann constant, T - temperature (ca. 300 K) and is paramagnetic susceptibility [cm3 g-1]. We have analyzed the recorded M-H curves for all samples in terms of the bound polaron model Eq. (1) using polaron concentration , their dipole moment and magnetic susceptibility as fitting parameters. The theoretical lines closely follow the measured M-H curves for all samples (Fig. 6). The calculated parameters are summarized in Table 2.
The superparamagnetic saturation magnetization of samples produced by pyrolyzation of organometallic precursor is about an order of magnitude higher than for reference sol-gel particles, indicating a more defected structure. consistently increases with the pyrolyzation temperature, reaching 4.8 memu/g at 750 ∘C (E1-750).
The highest superparamagnetic saturation =15.5 memu/g is obtained for electrodispersed sample ED-450, indicating highly defected structure was produced. Calcination at high temperature >450 ∘C leads to the decrease of ferromagnetic properties due to the gradually diminishing defect content, such as the filling of oxygen vacancies in static air. The remaining superparamagnetic saturation at the highest annealing temperature 750 ∘C is = 4.3 memu/g.
The phase composition, crystallite size (ca. 50-60 nm) and polaron content ( 4 - 4.8 g-1) in both rutile-rich samples E1-750 and ED-750 (Table 2) produced respectively by pyrolyzation and electrodispersion is similar. It is worth noting that according to the TGA traces (Fig. 2) showing continuous mass gain, the pyrolyzation of organometallic precursor relies on oxygen absorption from the environment, which might favor formation of oxygen vacancies. This is in contrast to the precipitated sample, which shows similar phase composition and crystallite size, but an order of magnitude smaller polaron concentration, indicating a defect-free crystal lattice, since the stoichiometry of the precipitates in aqueous sol-gel is assured on account of the hydrolysis and condensation process.
Previously, 10 nm TiO2-δ nanoparticles with mostly anatase phase produced by sol-gel showed saturation magnetization 9.5 memu/g and coercitivity of 96 Oe after annealing under reducing H2/Ar atmosphere. The origin of the ferromagnetism was attributed to a large content of VO. This was contested by Parras et al. 66, where Magneli phase TiO1.84 was stabilized under similar conditions. Rather than the influence of oxygen vacancies, the saturation magnetization 10 memu/g was instead ascribed to the Ti3+ ions induced by reduction, initiated by formation of Ti interstitials. Polycrystalline TiO2 treated under 4 MeV Ar5+ ion irradiation showed 0.4 memu/g saturation with 168 Oe coercitive field79. Oxygen vacancies VO were the dominant defects after irradiation. Wang et al. 80 produced 10-20 nm anatase nanoparticles by sol-gel and reported 1 memu/g saturation and 93 Oe coercitive field attributed to VO content and charge transfer interactions between Ti3+ and Ti2+. Recently 81, 82, sol-gel produced 10 nm single-phase anatase TiO2 calcined at 400 ∘C showed ca. 0.5-13 memu/g saturation and 11-305 Oe coercitivity, on account of VO. Wang et al. 68 produced highly defected 10-20 nm anatase TiO2 nanoparticles with 25 memu/g superparamagnetic saturation and 18 Oe coercitivity using solvothermal reaction. Moreover, defected TiO2 showed remarkably higher photocatalytic activity vs. normal TiO2 because of the more efficient charge transfer 68.
Our results show that the effective polaron magnetic moment ( emu, Table 2) does not distinctly depend on the preparation method or thermal treatment. Remarkably, very similar magnitudes of polaron magnetic moments were obtained in two previous investigations, in which this quantity was estimated: emu was measured in large nanorods65 with diameter 100 nm and length of few m produced by NaOH-assisted solvothermal processing with vacuum annealing and/or low-pressure calcination. The phase content varied from pure brookite to anatase-rutile mix with large concentration of VO and Ti3+ states. The same polaron moment was measured in sol-gel produced 10 nm single-phase anatase81 due to VO, despite saturation magnetization being roughly 2 orders of magnitude smaller than in the first study 65. Our results show that the polaron properties are roughly unaffected neither by the preparation method, phase content of the produced TiO2, nor annealing conditions, which lead just to the variability of polaron concentration in the samples.
A unambiguous one-to-one linear correlation exists between the concentration of bound magnetic polarons and the oxygen vacancy content65. Theoretical calculations indicate that a single oxygen vacancy VO can produce magnetic moment of about 1.4-2.4 79, 62, 63, cation vacancy VTi – about 2.3-4 67, 79, 62, 63 and di-vacancy – 2 67, 55. For a characteristic moment 2 per defect, ca. 0.4-0.7% of defective cells are found in the electrodispersed powders with defect content decreasing with higher calcination temperature. In contrast, in pyrolyzed samples the defect content is ca. 0.01-0.04% without an obvious dependence on the pyrolyzation temperature.
4 Conclusions
An organometallic precursor based on titanium carboxylate complex has been developed to produce phase-pure anatase, rutile and mixed phase TiO2 nanoparticles with controllable polymorph content using a simple non-hydrolytic thermal process. The new approach, based on a different reaction mechanism, eliminates from consideration many reaction parameters, which are difficult to control in the hydrolytic sol-gel processes, particularly, such as instantaneous Ti:H2O ratio, hydrolysis rate, pH, reaction modulators, and allows better control of the reaction process. A broad range of samples with varying structures, sizes and phase compositions has been produced by pyrolyzation of the carboxylate precursor. The temperature of the pyrolytic treatment comes out as a single parameter determining the grain size and crystal phase tuning of the final product in a simple, predictable and reproducible way.
The carboxylate precursor produced by biphasic cation exchange is long-term storable, hydrolytically stable and not sensitive to moisture contained in the air, unlike inorganic Ti chlorides or organometallic alkoxides commonly employed in the standard methods, which undergo vigorous hydrolysis. On this account titanium carboxylates are also ideal precursors for film deposition. The high chemical purity of the produced materials is assured on account of the biphasic extraction involved in the preparation of the precursor. Common impurities characteristic for the standard "one-pot" production methods have not been found during the investigation. The results are correlated against the traditional sol-gel method and confirm that the reported process is a good technique to produce TiO2 nanoparticles having surfaces free from organics.
An advantage of the the carboxylate precursor in pyrogenic synthesis is that it allows to avoid the commonly used titanium chlorides and the related corrosive hazards in chlorine rich flames. Flame synthesis 83, 84 is a widely employed to produce high quality metal oxide nanoparticles through a one-step process. Hence, the carboxylate precursor is a favourable alternative in the production of TiO2 nanoparticles.
Acknowledgements
We acknowledge technical staff from the University of Latvia, which was involved in the preparation of some of the samples under grant agreement No. 1.1.1.1/16/A/085 (2017-2018).
Notes and references
- Shayegan et al. 2018 Z. Shayegan, C.-S. Lee and F. Haghighat, Chemical Engineering Journal, 2018, 334, 2408–2439.
- Byrne et al. 2018 C. Byrne, G. Subramanian and S. C. Pillai, Journal of Environmental Chemical Engineering, 2018, 6, 3531–3555.
- Ali et al. 2018 I. Ali, M. Suhail, Z. A. Alothman and A. Alwarthan, RSC Advances, 2018, 8, 30125–30147.
- Wu et al. 2004 C. Wu, Y. Yue, X. Deng, W. Hua and Z. Gao, Catalysis Today, 2004, 93-95, 863–869.
- Kho et al. 2010 Y. K. Kho, A. Iwase, W. Y. Teoh, L. Mädler, A. Kudo and R. Amal, The Journal of Physical Chemistry C, 2010, 114, 2821–2829.
- Li et al. 2009 G. Li, C. P. Richter, R. L. Milot, L. Cai, C. A. Schmuttenmaer, R. H. Crabtree, G. W. Brudvig and V. S. Batista, Dalton Transactions, 2009, 10078.
- Li et al. 2007 G. Li, L. Chen, M. E. Graham and K. A. Gray, Journal of Molecular Catalysis A: Chemical, 2007, 275, 30–35.
- Bacsa and Kiwi 1998 R. Bacsa and J. Kiwi, Applied Catalysis B: Environmental, 1998, 16, 19–29.
- Jiang et al. 2018 X. Jiang, M. Manawan, T. Feng, R. Qian, T. Zhao, G. Zhou, F. Kong, Q. Wang, S. Dai and J. H. Pan, Catalysis Today, 2018, 300, 12–17.
- Bickley et al. 1991 R. I. Bickley, T. Gonzalez-Carreno, J. S. Lees, L. Palmisano and R. J. Tilley, Journal of Solid State Chemistry, 1991, 92, 178–190.
- Kawahara et al. 2002 T. Kawahara, Y. Konishi, H. Tada, N. Tohge, J. Nishii and S. Ito, Angewandte Chemie International Edition, 2002, 41, 2811–2813.
- Hurum et al. 2005 D. C. Hurum, K. A. Gray, T. Rajh and M. C. Thurnauer, The Journal of Physical Chemistry B, 2005, 109, 977–980.
- Ohtani et al. 2010 B. Ohtani, O. Prieto-Mahaney, D. Li and R. Abe, Journal of Photochemistry and Photobiology A: Chemistry, 2010, 216, 179–182.
- Goutailler et al. 2002 G. Goutailler, C. Guillard, S. Daniele and L. G. Hubert-Pfalzgraf, Journal of Materials Chemistry, 2002, 13, 342–346.
- Yu 2003 J. Yu, Journal of Catalysis, 2003, 217, 69–78.
- Bessekhouad et al. 2003 Y. Bessekhouad, D. Robert and J. V. Weber, Journal of Photochemistry and Photobiology A: Chemistry, 2003, 157, 47–53.
- Isley and Penn 2006 S. L. Isley and R. L. Penn, The Journal of Physical Chemistry B, 2006, 110, 15134–15139.
- Ranade et al. 2002 M. R. Ranade, A. Navrotsky, H. Z. Zhang, J. F. Banfield, S. H. Elder, A. Zaban, P. H. Borse, S. K. Kulkarni, G. S. Doran and H. J. Whitfield, Proceedings of the National Academy of Sciences, 2002, 99, 6476–6481.
- Liu et al. 2008 Y.-J. Liu, M. Aizawa, Z.-M. Wang, H. Hatori, N. Uekawa and H. Kanoh, Journal of Colloid and Interface Science, 2008, 322, 497–504.
- Paola et al. 2008 A. D. Paola, G. Cufalo, M. Addamo, M. Bellardita, R. Campostrini, M. Ischia, R. Ceccato and L. Palmisano, Colloids and Surfaces A: Physicochemical and Engineering Aspects, 2008, 317, 366–376.
- Cihlar et al. 2015 J. Cihlar, V. Kasparek, M. Kralova and K. Castkova, International Journal of Hydrogen Energy, 2015, 40, 2950–2962.
- Símonarson et al. 2019 G. Símonarson, S. Sommer, A. Lotsari, B. Elgh, B. B. Iversen and A. E. Palmqvist, ACS Omega, 2019, 4, 5750–5757.
- Pottier et al. 2003 A. Pottier, S. Cassaignon, C. Chanéac, F. Villain, E. Tronc and J.-P. Jolivet, Journal of Materials Chemistry, 2003, 13, 877–882.
- Schumacher et al. Jun. 2005 K. Schumacher, A. Schild and M. Morters, Flame-hydrolytically produced titanium dioxide powder, Jun. 2005.
- Yu and Peng 2002 W. W. Yu and X. Peng, Angew. Chem., Int. Ed., 2002, 41, 2368.
- Yu et al. 2003 W. W. Yu, L. Qu, W. Guo and X. Peng, Chem. Mater., 2003, 15, 2854.
- Yu et al. 2004 W. W. Yu, J. C. Falkner, C. T. Yavuz and V. L. Colvin, Chem. Commun., 2004, 2306–2307.
- Park et al. 2004 J. Park, K. An, J.-G. P. Yosun Hwang, H.-J. Noh, J.-Y. Kim, J.-H. Park, N.-M. Hwang and T. Hyeon, Nature Materials, 2004, 3, 891–895.
- Serga et al. 2018 V. Serga, D. Zablotsky, A. Krūmiņa, M. Lubane and G. Heidemane, Key Engineering Materials, 2018, 762, 288–293.
- Wang et al. 2014 Y. Wang, Y. He, Q. Lai and M. Fan, Journal of Environmental Sciences, 2014, 26, 2139–2177.
- Paola et al. 2009 A. D. Paola, M. Bellardita, R. Ceccato, L. Palmisano and F. Parrino, The Journal of Physical Chemistry C, 2009, 113, 15166–15174.
- Roca and Leite 2012 R. A. Roca and E. R. Leite, Journal of the American Ceramic Society, 2012, 96, 96–102.
- Reyes-Coronado et al. 2008 D. Reyes-Coronado, G. Rodríguez-Gattorno, M. E. Espinosa-Pesqueira, C. Cab, R. de Coss and G. Oskam, Nanotechnology, 2008, 19, 145605.
- Abbasi et al. 2015 S. Abbasi, S. M. Zebarjad, S. H. N. Baghban and A. Youssefi, Synthesis and Reactivity in Inorganic, Metal-Organic, and Nano-Metal Chemistry, 2015, 45, 1539–1548.
- Zhou et al. 2016 Y. Zhou, C. Chen, N. Wang, Y. Li and H. Ding, The Journal of Physical Chemistry C, 2016, 120, 6116–6124.
- Rai and Parashar 1979 A. Rai and G. Parashar, Thermochimica Acta, 1979, 29, 175–179.
- Seddon and Wood 1986 A. Seddon and J. Wood, Thermochimica Acta, 1986, 106, 341–354.
- Judd et al. 1974 M. D. Judd, B. A. Plunkett and M. I. Pope, Journal of Thermal Analysis, 1974, 6, 555–563.
- Leicester and Redman 2007 J. Leicester and M. J. Redman, Journal of Applied Chemistry, 2007, 12, 357–366.
- Zhang and Banfield 2002 H. Zhang and J. F. Banfield, Chemistry of Materials, 2002, 14, 4145–4154.
- Nicula et al. 2003 R. Nicula, M. Stir, C. Schick and E. Burkel, Thermochimica Acta, 2003, 403, 129–136.
- Zhang and Banfield 1998 H. Zhang and J. F. Banfield, Journal of Materials Chemistry, 1998, 8, 2073–2076.
- Zhang and Banfield 2000 H. Zhang and J. F. Banfield, The Journal of Physical Chemistry B, 2000, 104, 3481–3487.
- Zhu et al. 2005 K.-R. Zhu, M.-S. Zhang, J.-M. Hong and Z. Yin, Materials Science and Engineering: A, 2005, 403, 87–93.
- Penn and Banfield 1998 R. L. Penn and J. F. Banfield, American Mineralogist, 1998, 83, 1077–1082.
- Zhang et al. 1998 Y.-H. Zhang, C. K. Chan, J. F. Porter and W. Guo, Journal of Materials Research, 1998, 13, 2602–2609.
- Tossell 1999 J. A. Tossell, American Mineralogist, 1999, 84, 877–883.
- Zhu et al. 2015 S.-C. Zhu, S.-H. Xie and Z.-P. Liu, Journal of the American Chemical Society, 2015, 137, 11532–11539.
- Zhang and Banfield 2000 H. Zhang and J. F. Banfield, Journal of Materials Research, 2000, 15, 437–448.
- Oskam et al. 2003 G. Oskam, A. Nellore, R. L. Penn and P. C. Searson, The Journal of Physical Chemistry B, 2003, 107, 1734–1738.
- Nolan et al. 2009 N. T. Nolan, M. K. Seery and S. C. Pillai, The Journal of Physical Chemistry C, 2009, 113, 16151–16157.
- Nakamoto 2008 K. Nakamoto, Infrared and Raman Spectra of Inorganic and Coordination Compounds, John Wiley & Sons, Inc., 2008.
- Zeleňák et al. 2007 V. Zeleňák, Z. Vargová and K. Györyová, Spectrochimica Acta Part A: Molecular and Biomolecular Spectroscopy, 2007, 66, 262–272.
- 54 C. D. C. (editor), The Coblentz Society Desk Book of Infrared Spectra. 2nd ed., The Coblentz Society, 1982.
- Esquinazi et al. 2020 P. D. Esquinazi, W. Hergert, M. Stiller, L. Botsch, H. Ohldag, D. Spemann, M. Hoffmann, W. A. Adeagbo, A. Chassé, S. K. Nayak and H. B. Hamed, physica status solidi (b), 2020, 257, 1900623.
- Coey et al. 2005 J. M. D. Coey, M. Venkatesan and C. B. Fitzgerald, Nature Materials, 2005, 4, 173–179.
- Yoon et al. 2006 S. D. Yoon, Y. Chen, A. Yang, T. L. Goodrich, X. Zuo, D. A. Arena, K. Ziemer, C. Vittoria and V. G. Harris, Journal of Physics: Condensed Matter, 2006, 18, L355–L361.
- Yoon et al. 2007 S. D. Yoon, Y. Chen, A. Yang, T. L. Goodrich, X. Zuo, K. Ziemer, C. Vittoria and V. G. Harris, Journal of Magnetism and Magnetic Materials, 2007, 309, 171–175.
- Rumaiz et al. 2007 A. K. Rumaiz, B. Ali, A. Ceylan, M. Boggs, T. Beebe and S. I. Shah, Solid State Communications, 2007, 144, 334–338.
- Liu et al. 2016 Y. Liu, S. Feng, Z. Li, L. Zhang, G. Wang, W. Chen, T. Wang and W. Zhong, RSC Advances, 2016, 6, 57013–57018.
- Zhao et al. 2008 Q. Zhao, P. Wu, B. L. Li, Z. M. Lu and E. Y. Jiang, Journal of Applied Physics, 2008, 104, 073911.
- Liu et al. 2019 H. Liu, G. P. Li, Q. L. Lin, D. J. E, X. D. Gao, X. B. Wei, X. D. Pan, S. X. Zhang, J. J. Ding and W. Lan, Journal of Superconductivity and Novel Magnetism, 2019, 32, 3557–3562.
- Liu et al. 2020 H. Liu, G. Li, D. E, N. Xu, Q. Lin, X. Gao, C. Lan, J. Chen, C. Wang, X. Zhan and K. Zhang, RSC Advances, 2020, 10, 18687–18693.
- Zhou et al. 2009 S. Zhou, E. Čižmár, K. Potzger, M. Krause, G. Talut, M. Helm, J. Fassbender, S. A. Zvyagin, J. Wosnitza and H. Schmidt, Physical Review B, 2009, 79, 113201.
- Santara et al. 2013 B. Santara, P. K. Giri, K. Imakita and M. Fujii, Nanoscale, 2013, 5, 5476.
- Parras et al. 2013 M. Parras, Á. Varela, R. Cortés-Gil, K. Boulahya, A. Hernando and J. M. González-Calbet, The Journal of Physical Chemistry Letters, 2013, 4, 2171–2176.
- Peng et al. 2009 H. Peng, J. Li, S.-S. Li and J.-B. Xia, Physical Review B, 2009, 79, 092411.
- Wang et al. 2015 S. Wang, L. Pan, J.-J. Song, W. Mi, J.-J. Zou, L. Wang and X. Zhang, Journal of the American Chemical Society, 2015, 137, 2975–2983.
- Maiorov et al. 2019 M. M. Maiorov, D. Zablotsky, E. Blums and A. Krumina, IOP Conference Series: Materials Science and Engineering, 2019, 503, 012029.
- Segal et al. 2008 I. Segal, A. Zablotskaya, E. Lukevics, M. Maiorov, D. Zablotsky, E. Blums, I. Shestakova and I. Domracheva, Applied Organometallic Chemistry, 2008, 22, 82–88.
- Zablotskaya et al. 2009 A. Zablotskaya, I. Segal, E. Lukevics, M. Maiorov, D. Zablotsky, E. Blums, I. Shestakova and I. Domracheva, Journal of Magnetism and Magnetic Materials, 2009, 321, 1428–1432.
- Segal et al. 2010 I. Segal, A. Zablotskaya, E. Lukevics, M. Maiorov, D. Zablotsky, E. Blums, A. Mishnev, R. Georgieva, I. Shestakova and A. Gulbe, Applied Organometallic Chemistry, 2010, 24, 193–197.
- Zablotskaya et al. 2018 A. Zablotskaya, I. Segal, M. Maiorov, D. Zablotsky and E. Blums, Inorganic Frameworks as Smart Nanomedicines, Elsevier, 2018, pp. 279–316.
- Zablotskaya et al. 2015 A. Zablotskaya, I. Segal, Y. Popelis, A. Mishnev, M. Maiorov, D. Zablotsky, E. Blums, V. Nikolajeva and D. Eze, Applied Organometallic Chemistry, 2015, 29, 376–383.
- Banus et al. 1972 M. D. Banus, T. B. Reed and A. J. Strauss, Physical Review B, 1972, 5, 2775–2784.
- Lu et al. 2011 J. Lu, K. Yang, H. Jin, Y. Dai and B. Huang, Journal of Solid State Chemistry, 2011, 184, 1148–1152.
- Zablotsky et al. 2020 D. Zablotsky, S. Kralj, G. Kitenbergs and M. M. Maiorov, Journal of Non-Newtonian Fluid Mechanics, 2020, 278, 104248.
- Zablotsky et al. 2020 D. Zablotsky, S. Kralj and M. M. Maiorov, Colloids and Surfaces A: Physicochemical and Engineering Aspects, 2020, 603, 125079.
- Sanyal et al. 2013 D. Sanyal, M. Chakrabarti, P. Nath, A. Sarkar, D. Bhowmick and A. Chakrabarti, Journal of Physics D: Applied Physics, 2013, 47, 025001.
- Wang et al. 2014 Q. Wang, X. Wei, J. Dai, J. Jiang and X. Huo, Materials Science in Semiconductor Processing, 2014, 21, 111–115.
- Akshay et al. 2018 V. R. Akshay, B. Arun, S. Dash, A. K. Patra, G. Mandal, G. R. Mutta, A. Chanda and M. Vasundhara, RSC Advances, 2018, 8, 41994–42008.
- Chanda et al. 2018 A. Chanda, K. Rout, M. Vasundhara, S. R. Joshi and J. Singh, RSC Advances, 2018, 8, 10939–10947.
- Ma and Yang 2010 H.-K. Ma and H.-A. Yang, Journal of Alloys and Compounds, 2010, 504, 115–122.
- Manuputty et al. 2019 M. Y. Manuputty, J. A. H. Dreyer, Y. Sheng, E. J. Bringley, M. L. Botero, J. Akroyd and M. Kraft, Chemical Science, 2019, 10, 1342–1350.