![[Uncaptioned image]](/html/2102.02836/assets/x1.png)
Assessment of the Performance of Density Functionals for Predicting Potential Energy Curves in Hydrogen Storage Applications
Abstract
The availability of accurate computational tools for modeling and simulation is vital to accelerate the discovery of materials capable of storing hydrogen (\ceH2) under given parameters of pressure swing and temperature. Previously, we compiled the H2Bind275 dataset consisting of equilibrium geometries and assessed the performance of 55 density functionals over this dataset (Veccham, S. P.; Head-Gordon, M. J. Chem. Theory Comput., 2020, 16, 4963–4982). As it is crucial for computational tools to accurately model the entire potential energy curve (PEC), in addition to the equilibrium geometry, we have extended this dataset with 389 new data points to include two compressed and three elongated geometries along 78 PECs for \ceH2 binding, forming the H2Bind787 dataset. Assessing the performance of 55 density functionals on this significantly larger and more comprehensive H2Bind787 dataset, we have identified the best performing density functionals for \ceH2 binding applications: PBE0-DH, B97X-V, B97M-V, and DSD-PBEPBE-D3(BJ). Addition of Hartree Fock exchange improves the performance of density functionals, albeit not uniformly throughout the PEC. We recommend the usage of B97X-V and B97M-V density functionals as they give good performance for both geometries and energies In addition, we have also identified B97M-V and B97M-rV as the best semi-local density functionals for predicting \ceH2 binding energy at its equilibrium geometry.
1 Introduction
Hydrogen (\ceH2) is a favorable substitute for fossil fuels as the only by-product of hydrogen fuel cell engines is water and the efficiency of a fuel cell is significantly higher than an internal combustion engine. However, \ceH2 is a light gas with low volumetric and gravimetric energy densities. This poses a significant hurdle to storage and transportation of \ceH2. Storing \ceH2 reversibly in adsorbed form on porous materials is a promising solution to this problem.1, 2, 3 Ideally, such materials should adsorb \ceH2 at high pressure and release it at low pressure so that the released \ceH2 can be used for operating a fuel cell. Designing materials with this property, while simultaneously not compromising on high volumetric and gravimetric storage capacities, is an active area of research.4, 5
While multiple porous materials like Metal-Organic Frameworks (MOFs), Covalent Organic Frameworks (COFs), graphene, and other amorphous materials have been shown to adsorb \ceH2, none of these materials meet all the target criteria proposed by the U.S. Department of Energy for an ideal storage material.5 As experimental synthesis and characterization of potential \ceH2 storage materials is expensive and time-consuming, computational modeling and screening of materials has emerged as a viable alternative to it.6, 7, 8 Computational techniques can be used in two different, potentially complementary ways. First, molecular modeling can be used to understand the mechanism of \ceH2 binding in different porous materials and this understanding can be used to systematically tune materials to achieve target properties.9, 10, 5 Second, computational techniques can be used to screen materials in a high-throughput manner to select only a handful of potentially viable materials for synthesis and characterization.
The ability of a material to store \ceH2 is characterized by its usable capacity, which is defined as the amount of \ceH2 stored at the high operating pressure that is released when the pressure is reduced to the low operating pressure. Optimizing the usable capacity for typical fixed operating pressures of 5 bar and 100 bar gives an optimal value for the Gibbs free energy of adsorption (). Assuming a correlation between enthalpy and entropy of adsorption in porous materials gives a range of to kJ/mol for the optimal value for enthalpy of adsorption ().11, 12, 13 The internal energy of binding, which is the largest component of , can be computed using different quantum chemistry methods, including, but not limited to, density functional theory (DFT),14, 9, 15, 10 Møller-Plesset perturbation theory (MP2),16, 17, 18 and different variants of coupled-cluster theory.19, 20, 21 Each of these methods have different accuracies and computational costs associated with them.
DFT, scaling as ( is the number of basis functions in the system), can provide a reasonable balance between cost and accuracy of computing \ceH2 binding energy. However, as the exact density functional remains unknown, different density functional approximations (DFAs), proposed in lieu of the exact density functional, provide varying accuracies for different chemical systems and/or properties computed.22 In order to address this problem, we adopted a two-pronged approach.21 (1) We compiled the H2Bind275 dataset that consists of \ceH2(s) interacting with binding motifs representative of different porous materials known for \ceH2 adsorption. This dataset consists only of equilibrium geometries, that is, \ceH2(s) are located at the minimum of the potential energy curve (PEC) with respect to the binding site. We computed highly accurate reference interaction energies using coupled-cluster singles, doubles, and perturbative triples (CCSD(T)) extrapolated to the complete basis set limit for this dataset. (2) We assessed the performance of 55 DFAs and identified the best performing density functionals for this dataset. In addition, we also identified inexpensive semi-local density functionals which give very good performance for low computational cost and are suitable for in silico high-throughput screening purposes.
The H2Bind275 dataset, consisting of 275 data points, provides a balanced representation of different \ceH2 binding mechanisms like polarization, charge transfer interaction, and dispersion.23, 15, 24 It also captures the chemical diversity of binding motifs that \ceH2 interacts with in porous frameworks. This dataset assesses the ability of density functionals to reproduce \ceH2 binding energies at the minima of the PEC. However, as DFAs are routinely used for geometry optimizations and molecular dynamics simulations either directly or indirectly (by generating reference data for training force fields), they should also be able to reproduce the entire PEC which would ensure accurate nuclear gradients as required for geometry optimization and molecular dynamics simulations. A strategy of assessing the performance of DFAs for PECs has been previously employed for other non-covalent interaction energy datasets like S22, S66, and A24. The S22x5 dataset25 was created from the S22 dataset26 by including geometries that are shortened and elongated along a well-defined interaction coordinate. Similarly, the S66x827 and A21x1228 extended datasets were created from the S66 and A24 datasets.29
In order to address this issue for \ceH2 storage, we have extended the H2Bind275 dataset to include geometries that are located at five different points on 78 separate PECs, not just the minimum. This extended dataset, hereafter referred to as the H2Bind787 dataset, was generated by shortening and stretching the distance between \ceH2 and the binding motif. The reference interaction energies were computed using CCSD(T) extrapolated to the complete basis set (CBS) limit using the same strategy outlined in Ref. 21. The performance of 55 DFAs were assessed using regularized relative errors metrics by appropriately weighing the error coming from different points on the PECs. We have analyzed the performance of these DFAs for the extended dataset by comparing and contrasting it with the performance of the original equilibrium H2Bind275 dataset.
This paper is organized as follows. The H2Bind787 dataset is introduced and the protocol for computing reference interaction energies is discussed. All the density functionals chosen for assessment in this work are briefly introduced and classified. The distribution of the reference interaction energies at different points on the PEC is outlined. The performance of DFAs for predicting \ceH2 interaction energies across the PEC is discussed and contrasted with their performance for the previous H2Bind275 dataset. The performance of DFAs for predicting equilibrium geometries and interaction energies at equilibrium geometries is explored. The best DFAs for predicting \ceH2 binding energies are recommended while considering their computational cost.
2 Computational details
2.1 H2Bind787 dataset
| s-block ions | salts | organic ligands | transition metals | total | |
|---|---|---|---|---|---|
| geometries | 19 | 13 | 5 | 41 | 78 |
| data points at PEC minimum | 38 | 26 | 10 | 82 | 156 |
| data points not at PEC minimum | 95 | 65 | 25 | 204111One data point excluded due to convergence issues | 389 |
| H2Bind787 | 133 | 91 | 35 | 286 | 545 |
The H2Bind275 dataset consists of 275 \ceH2 interaction energies but only 86 unique geometries as many of them have multiple \ceH2s. For example, the geometry of \ceCaCl2-(H2)4 has four hydrogen molecules bound to \ceCaCl2 contributing four data points to the H2Bind275 dataset. The H2Bind787 dataset was generated by starting from a subset of the original H2Bind275 dataset. This subset was created by choosing only 78 unique geometries and computing their interaction energies adiabatically using the method outlined in Ref. 21. All of these geometries are located on the PEC at their respective minima. The adiabatic interaction energy, which relaxes the geometries of the binding motif and \ceH2, was chosen as it is closest to experimentally measurable values. For each minimum geometry, five additional geometries were generated by compressing and elongating the distance between the binding motif and the center of mass of \ceH2 (denoted by ). For geometries containing multiple \ceH2s bound to a single binding moiety, compressed and elongated geometries were generated for only one of the \ceH2s. This step was necessary in order to maintain low redundancy in the dataset and make its size manageable. In addition to this, the interaction energy at the minimum of the PEC was also computed using vertical interaction energy method. In total, this dataset contains 78 adiabatic and 78 vertical interaction energies (a total of 156 data points) located at the PEC minimum.
In this work, two compressed geometries ( and ) and three elongated geometries (, , and ) were considered. These distances were chosen as they are representative of the PEC in both the compressed and elongated regimes. In a porous material, \ceH2 interacts with not only its primary binding site but also has secondary interactions with other components of the framework. The binding distances of \ceH2 to its secondary interaction sites of the porous material are often longer than their corresponding equilibrium distances. As a consequence of this, when modeling \ceH2 in a porous material, the elongated portion of the PEC is sampled more than the compressed part. Additionally, the compressed portion of the PEC is usually significantly higher in energy (repulsive if compressed enough), and is sampled less often in a molecular dynamics or Monte Carlo simulation. Hence, DFAs should be able to reproduce the elongated portion of the PEC more faithfully than the compressed portion. We have included more data points in the elongated regime than the compressed regime in order to underscore its relative importance. As shown in Table 1, the number of non-equilibrium data points is roughly times the number of data points at equilibrium. In total, counting both the equilibrium and non-equilibrium data points, this H2Bind787 dataset consists of \ceH2 interaction energies with representative binding motifs.
| s-block ions | salts | organic ligands | transition metals |
| \ceLi+-(H2)_n, | \ceAlF3-H2 | benzene\ce-H2 | \ceMX-H2, XH, F, Cl; MCu, Ag, Au |
| \ceCaF2-(H2)_n, | phenol\ce-H2 | \ceCoF3-H2 | |
| \ceNa+-(H2)_n, | pyrrole\ce-H2 | \ceCu(OMe)-H2 | |
| \ceCaCl2-(H2)_n, | butene\ce-H2 | \ceCuCN-H2 | |
| \ceMg^2+-(H2)_n, | tetrazole\ce-H2 | \ceSc+-(H2)_n, \ceV+-(H2)_n, | |
| \ceMgF2-(H2)_n, | \ceTi+-(H2)_n, | ||
| \ceCa^2+-(H2)_n, | \ceCr+-(H2)_n, \ceMn+-(H2)_n, | ||
| \ceFe+-(H2)_n, | |||
| \ceCo+-(H2)_n, \ceNi+-(H2)_n, | |||
| \ceCu+-(H2)_n, | |||
| \ceZn+-(H2)_n, |
This dataset, like the H2Bind275 dataset, can also be divided into categories based on the chemical nature of the binding motif as shown in Table 2: (1) s-block ions: consisting of group 1 and group 2 bare metal cations with unscreened charge binding one or multiple \ceH2s, (2) salts: consisting of small inorganic salts like \ceAlF3, \ceCaCl2, and \ceMgF2 binding one or multiple \ceH2s, (3) organic ligands: comprising of small aliphatic and aromatic molecules binding one \ceH2, (4) transition metals: including small transition metal complexes and 3d transition metal cations binding one or multiple \ceH2s. Each of these categories is also representative of various mechanisms of \ceH2 binding found in porous materials. For example, \ceH2 in the organic ligands category is mostly dispersion-bound. The s-block metals category binds \ceH2 using a combination of electrostatic and forward charge transfer (\ceH2 metal) interactions.15 This dataset captures both chemical and mechanistic diversity encountered in \ceH2 binding to porous materials. For a detailed discussion about different chemical categories in this dataset, we refer readers to Ref. 21.
2.2 Reference Binding Energies
Calculation of accurate reference interaction energies is an important task in compiling a dataset. Reference interaction energies were computed using coupled-cluster theory with singles, doubles, and perturbative triples (CCSD(T))30 extrapolated to the complete basis set limit. Inspired by the success of composite extrapolation methods31, 32, 33, 34 for computing highly accurate reference values, we have developed our own composite extrapolation method using focal point analysis35, 36 for computing accurate reference \ceH2 binding energies:
| (1) | ||||
| (2) | ||||
| (3) |
Here, is the reference energy computed using the composite method, is the Hartree Fock energy computed using a basis set of quintuple-zeta (5Z) quality, is the MP2 correlation energy extrapolated to the complete basis set limit with the 2-point extrapolation formula37 using correlation energies computed with quadruple-zeta (QZ) and quintuple-zeta quality basis sets, and is the difference between the CCSD(T) and MP2 correlation energies computed with a triple-zeta quality basis set. is the core-valence contribution to the correlation energy computed as the difference between MP2 correlation energies with () and without () the frozen-core approximation. This composite method for computing reference \ceH2 interaction energies ensures that the effect of higher-order excitations neglected in CCSD(T) are sufficiently small. It also ensures that the basis set incompleteness errors are small and that both HF and extrapolated correlation energy components are of complete basis set limit quality. Further details of this scheme can be found in Ref. 21.
The cc-pVnZ38, 39 (T, Q, or 5) family of basis sets was used for all the HF and correlation energy calculations when core electrons were not included in the correlation calculations. cc-pCVnZ40, 41 (T, Q, or 5) family of basis sets were employed when some or all of the core electrons were included in the correlation calculations. For transition metals, the cc-pwCVnZ42 (T, Q, or 5) series of basis sets was used with a neon core excluded in all correlation energy computations.
2.3 Density Functional Approximations
55 DFAs, including all the commonly used density functionals, were chosen to perform a thorough assessment. We have also included DFAs that have previously shown very good performance for a range of non-covalent interaction energy prediction problems represented by multiple datasets.43 Based on the different quantities DFAs depend on, they are categorized into rungs of the metaphorical Jacob’s ladder.44 From the first rung of the Jacob’s ladder, in which DFAs depend only on electron density, SVWN545, 46 and SPW9245, 47 DFAs were chosen. From the second rung called Generalized Gradient Approximation (GGA), 12 different DFAs were chosen: the PBE family and its variants (PBE,48 PBE-D3(0),49 RPBE,50 revPBE,51 and revPBE-D3(op)52), BLYP53, 54 and BLYP-D3(op)52, dispersion-corrected variants of B9755 (BLYP-D3(0)49 and BLYP-D3(BJ)56), PW91,57 and GAM.58 From the meta-GGA rung, the different variants of TPSS (TPSS,59 TPSS-D3(BJ),56 and revTPSS60), SCAN61 and its dispersion-corrected version SCAN-D3(BJ)62, MS263 and MS2-D3(op),52 the combinatorially-optimized B97M-V64 and B97M-rV65, 66 were chosen. In addition, mBEEF67 and the semi-local Minnesota functionals M06-L68 and MN15-L69 were also included in the assessment. Rung four DFAs, containing HF exchange, are generally more accurate than semi-local functionals as they partially alleviate the problem of self-interaction error. In this work, global hybrid density functionals like B3LYP70 and B3LYP-D3(0),56 PBE071 and PBE0-D3(BJ),56 TPSSh72 and TPSSh-D3(BJ),56 the M06 family of density functionals (M06,73 M06-2X,73 M06-2X-D3(0),49 and revM0674), MVSh,75 and SCAN076 which is the hybrid variant of SCAN are included. Range-separated hybrids, which are hybrid functionals containing DFT exchange and some HF exchange in the short-range and only HF exchange in the long range, included in this study are B97X-D,77 B97X-D3,78 B97X-V,79 B97M-V,22 M1180 and its revised version revM11.81 Two screened exchange density functionals (HSE-HJS82, 83 and MN12-SX84), which contain DFT exchange in the short range and attenuated HF exchange in the long range are also included. Double hybrid density functionals, which are at the top the Jacob’s ladder classification, contain some percentage of correlation energy from wavefunction methods. These DFAs are characterized by their superior accuracy and increased computational cost in comparison to semi-local and hybrid DFAs. We have included seven double hybrid density functionals in this study: B2PLYP-D3(BJ),85 XYG3,86 XYGJ-OS,87 PBE0-DH,88, PTPSS-D3(0),89 DSD-PBEPBE-D3(BJ),90 and B97M(2).91
The def2-QZVPPD92 basis set was used for all DFA calculations with a quadrature grid of 99 Euler-MacLaurin radial points and 590 Lebedev angular points for integrating the exchange-correlation contribution. SG-193 integration grid was used for integrating the VV10 component. The choice of core for frozen core approximation and employment of density fitting approximation for computing MP2 correlation energy in double hybrid density functionals is discussed in Table S1. All the PECs were interpolated using the one-dimensional Akima interpolator.94 All computations were performed using Q-Chem 5.95
3 Results and Discussion
3.1 H2Bind787 dataset
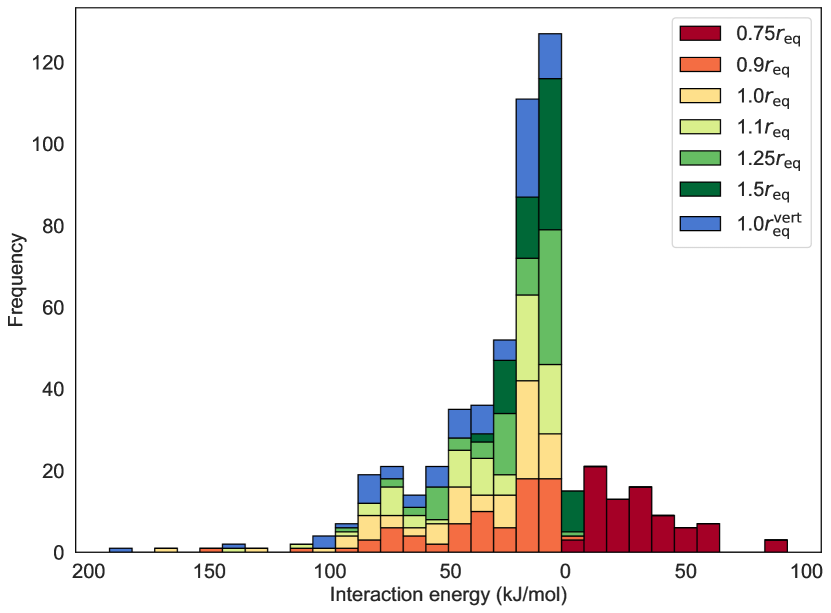
Typically, the coupled cluster reference \ceH2 interaction energy with the binding motif is strongest at equilibrium, that is at . This implies that the geometries optimized using B97M-V/def2-TZVPD92 are also close to the CCSD(T)/CBS minima. Fig. 1 shows the distribution of interaction energies for the entire H2Bind787 dataset consisting of 545 data points. The equilibrium and geometries near equilibrium (, , and ) have attractive interaction energies, with most of them smaller than 100 kJ/mol in magnitude. Geometries that are stretched by 25% () are still attractive in nature, but most interaction energies are smaller than 60 kJ/mol in magnitude. Geometries stretched by 50% of their equilibrium distance are bound only weakly with a median binding energy of kJ/mol. At the other extreme of the PEC, geometries that are compressed by 25% () are mostly repulsive with a median interaction energy of kJ/mol. This geometry was also chosen in order to sample the repulsive part of the PEC and assess how accurately different density functionals can reproduce it.96
The range of interaction energies covered by each PEC is also very large. The coinage metal containing species are the strongest binders, as illustrated by the extreme example of \ceAuF which binds \ceH2 with an interaction energy of kJ/mol at equilibrium and interacts with \ceH2 with an energy of kJ/mol (repulsive) at , thus spanning an interaction range of kJ/mol. Data points in the organic category have the smallest ranges (average range is kJ/mol). A typical PEC of \ceH2 interacting with a binding moiety has the shape of a Morse potential. However, there is considerable variation in the well depth, well width, and decay in the long range for different chemical species. This variation can provide some clues into the dominant mechanism of interaction. For example, the \ceAuCl binding motif interacts with one \ceH2 with an interaction energy of kJ/mol at equilibrium which decays to kJ/mol at ( decrease). This is a sharp decay in the interaction energy in comparison to the \ceMg^2+ case. In the \ceMg^2+ interacting with one \ceH2 case, the interaction energy at equilibrium is kJ/mol in comparison to kJ/mol at ( decrease). This suggested that the dominant mechanism of interaction in \ceMg^2+ case is longer-ranged (like permanent electrostatics) than \ceAuCl which is dominated by orbital controlled short-ranged interactions like charge transfer.
3.2 Performance of Density Functional Approximations on PECs
| Rank | DFA | RMSE (kJ/mol) | DFA | RegMAPE (%) |
|---|---|---|---|---|
| 1 | PBE0-DH | 2.9 | PBE0-DH | 5.0 |
| 2 | DSD-PBEPBE-D3(BJ) | 3.7 | B97X-V | 5.4 |
| 3 | B97X-V | 4.0 | B97M-V | 6.3 |
| 4 | B97X-D | 4.1 | DSD-PBEPBE-D3(BJ) | 6.3 |
| 5 | PBE0 | 4.2 | XYGJ-OS | 6.9 |
| 6 | MVSh | 4.3 | B97M(2) | 7.4 |
| 7 | HSE-HJS | 4.3 | PBE0 | 7.6 |
| 8 | B97M-V | 4.5 | HSE-HJS | 7.6 |
| 9 | XYGJ-OS | 4.6 | B2PLYP-D3(BJ) | 8.2 |
| 10 | B97X-D3 | 4.8 | XYG3 | 8.5 |
| 11 | XYG3 | 4.8 | B97X-D | 9.0 |
| 12 | PTPSS-D3(0) | 4.9 | B97M-rV | 9.0 |
| 13 | B97M(2) | 5.1 | B97M-V | 9.1 |
| 14 | PBE0-D3(BJ) | 5.2 | SCAN0 | 9.1 |
| 15 | MN15 | 5.7 | PTPSS-D3(0) | 9.3 |
| 16 | B2PLYP-D3(BJ) | 5.8 | B97X-D3 | 9.8 |
| 17 | SCAN0 | 5.8 | MVSh | 10.2 |
| 18 | TPSSh | 6.0 | TPSSh | 11.3 |
| 19 | revM11 | 6.3 | PBE0-D3(BJ) | 11.5 |
| 20 | mBEEF | 6.7 | M11 | 12.0 |
| 21 | revM06 | 6.9 | revTPSS | 12.0 |
| 22 | B3LYP | 7.4 | revM06 | 12.4 |
| 23 | revTPSS | 7.5 | TPSS | 13.6 |
| 24 | B3LYP-D3(0) | 7.5 | TPSSh-D3(BJ) | 13.8 |
| 25 | B97M-V | 7.6 | B3LYP-D3(0) | 14.0 |
| 26 | B97M-rV | 7.6 | oTPSS-D3(BJ) | 14.6 |
| 27 | TPSS | 7.7 | TPSS-D3(BJ) | 14.7 |
| 28 | oTPSS-D3(BJ) | 7.8 | MN15 | 15.3 |
| 29 | TPSSh-D3(BJ) | 8.0 | PBE | 15.3 |
| 30 | MN15-L | 8.0 | revM11 | 15.3 |
| 31 | revPBE-D3(op) | 8.5 | BLYP-D3(op) | 15.4 |
| 32 | TPSS-D3(BJ) | 8.5 | B3LYP | 15.5 |
| 33 | revPBE | 9.1 | SCAN | 15.6 |
| 34 | MN12-SX | 9.2 | MN12-SX | 16.2 |
| 35 | RPBE | 9.3 | SCAN-D3(BJ) | 16.3 |
| 36 | M11 | 9.4 | M06 | 16.9 |
| 37 | B97-D3(BJ) | 9.7 | revPBE-D3(op) | 17.0 |
| 38 | BLYP-D3(op) | 9.8 | PW91 | 17.4 |
| 39 | M06 | 9.9 | MS2 | 17.4 |
| 40 | BLYP | 10.1 | mBEEF | 17.4 |
| 41 | PBE | 10.3 | BP86-D3(BJ) | 18.4 |
| 42 | M06-L | 10.5 | M06-2X | 19.3 |
| 43 | BP86-D3(BJ) | 10.9 | M06-2X-D3(0) | 19.8 |
| 44 | B97-D3(0) | 11.0 | MN15-L | 19.8 |
| 45 | PBE-D3(0) | 11.0 | PBE-D3(0) | 20.1 |
| 46 | PW91 | 11.2 | MS2-D3(op) | 20.3 |
| 47 | GAM | 11.8 | M06-L | 20.7 |
| 48 | MS2 | 12.1 | RPBE | 20.9 |
| 49 | MS2-D3(op) | 12.4 | BLYP | 22.1 |
| 50 | SCAN | 12.9 | revPBE | 23.4 |
| 51 | SCAN-D3(BJ) | 13.2 | B97-D3(BJ) | 24.2 |
| 52 | M06-2X | 13.4 | GAM | 24.7 |
| 53 | M06-2X-D3(0) | 13.4 | B97-D3(0) | 28.3 |
| 54 | SPW92 | 32.6 | SPW92 | 63.0 |
| 55 | SVWN5 | 32.7 | SVWN5 | 63.0 |
We will discuss the performance of DFAs using multiple error metrics. Each of these metrics gives different weights to different aspects of the dataset. First, we will discuss the performance of DFAs using the root mean square error (RMSE) metric which gives equal importance to all data points in the H2Bind787 dataset. The RMSE of all 55 DFAs assessed in this work is shown in Table 3. The non-empirical double hybrid functional with just two fixed parameters, PBE0-DH, gives the least RMSE of 2.9 kJ/mol. The second best DFA is another double hybrid DSD-PBEPBE-D3(BJ) with an RMSE of 3.7 kJ/mol. In comparison to the earlier H2Bind275 dataset where DSD-PBEPBE-D3(BJ) was ranked fourth, it performs relatively better for the H2Bind787 dataset moving up by two places.21 This is closely followed by B97X-V and B97X-D, both of which show a similar RMSEs of and kJ/mol respectively. Another trend seen in the H2Bind275 dataset that is transferable to the H2Bind787 dataset is that the best performing DFA in each rung of the Jacob’s ladder performs better than the best performing functional in rung directly below it. The least RMSE DFA in each rung also remains the same: SPW92 for LDA, revPBE-D3(op) for GGAs, mBEEF for meta-GGAs, B97X-V in the hybrids rung, and PBE0-DH in the double hybrids rung. The ranking of B97M-V deteriorates in the extended dataset in comparison to the previous H2Bind275 dataset. Another interesting observation is the improvement in the ranking of the MN15 density functional which is ranked 15th in the H2Bind787 dataset with an RMSE of kJ/mol (MN15 was ranked 25th with an RMSE of kJ/mol in the H2Bind275 dataset). The relative performance of B97M-V and B97M-rV (ranked 25th and 26th) in the H2Bind787 dataset remains comparable to their performance in the H2Bind275 dataset. We also note that commonly used density functionals like M06-2X and M06-2X-D3(0) and the recently developed density functionals like SCAN and SCAN-D3(BJ) show very large RMSEs.
The reference interaction energies in the H2Bind787 dataset span a very large range: from to 92.1 kJ/mol. However, for \ceH2 storage applications between 5 and 100 bar, interaction energies in the to kJ/mol range would be ideal.11, 12, 13 A good error metric should give more weight to data points in this range by considering the following aspects:
-
1.
The H2Bind787 dataset contains many model binding motifs, each of them binding \ceH2 with different interaction energies at their corresponding equilibrium geometry. Binding motifs that bind \ceH2 with an interaction energy in the range of to kJ/mol should have larger weights.
-
2.
Each binding motif contributes six data points: two compressed data points, three elongated data points, and one data point at equilibrium. Equilibrium geometries should be given larger weight than the non-equilibrium ones.
The regularized mean absolute percentage error (RegMAPE) was formulated in Ref. 21 in order to satisfy requirement (1). RegMAPE uses percentage error in the to kJ/mol range, regularized percentage error (in order to avoid small denominators) for interaction energies weaker than kJ/mol, and absolute error for interaction energies stronger than kJ/mol. The error metrics in neighboring ranges are also smoothly interpolated. For the same amount of error, as percentage error is much larger in magnitude than absolute error, the RegMAPE error metric is able to satisfy criterion (1). For example, an error of 5 kJ/mol for a reference interaction energy of 100 kJ/mol will contribute 5 units to the total error while the same error for a reference interaction energy of 20 kJ/mol will contribute 25 units to the total error. For a given binding motif, the equilibrium geometry should be given more weight as it represents the \ceH2 interaction with the primary binding site: the main lever to tune while designing binding sites. As non-equilibrium geometries are higher in energy, they would be encountered less frequently in a molecular dynamics or Monte Carlo simulation. Hence, lower weight for non-equilibrium geometries is achieved by using the equilibrium regularization value for non-equilibrium geometries as well. As the equilibrium geometry always has a stronger interaction energy, the regularized value of its reference interaction energy, , will be larger in magnitude in comparison to the regularized values of non-equilibrium interaction energies (). The large magnitude of the denominator will give a smaller weight to the errors of non-equilibrium geometries in comparison to the equilibrium one. RegMAPE for equilibrium and non-equilibrium geometries as defined in Eq. (4) satisfies requirement (2).
| (4) |
where is the RegMAPE, and are the DFA and reference interaction energies at geometry, and is the regularized interaction energy for the equilibrium geometry. As the vertical interaction energy is located at the minimum of the PEC, the error in this data point is regularized using the vertical reference interaction energy.
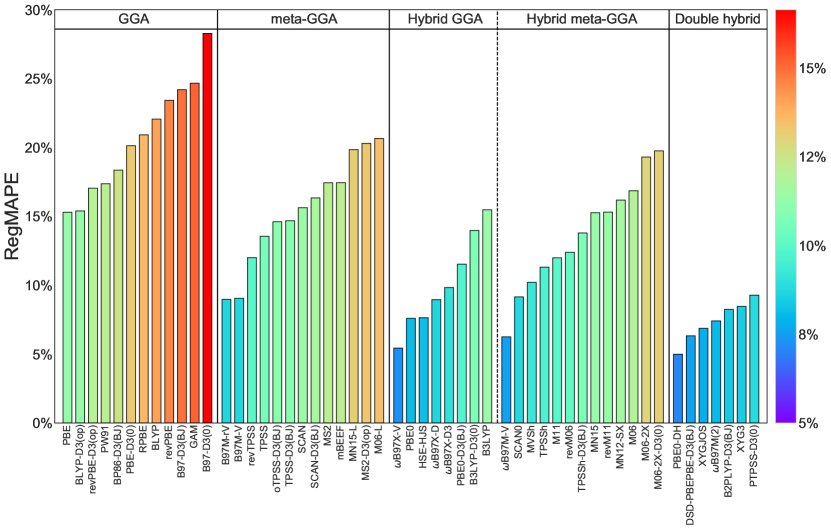
The performance of DFAs assessed by the RegMAPE error metric is shown in Fig. 2 and Table (3). While there are some similarities in the relative ordering of density functionals for RegMAPE and RMSE error metrics, there are also noteworthy differences. Again, PBE0-DH shows the best performance with the least RegMAPE of 5.0%. It is followed by the B97X-V and B97M-V density functionals which have RegMAPEs of 5.4% and 6.3% respectively. The DSD-PBEPBE-D3(BJ) density functional, which was the best performing density functional in the H2Bind275 dataset with RegMAPE of 4.9%, is the fourth best performing DFA for the H2Bind787 dataset. The small decline in the performance of DSD-PBEPBE-D3(BJ) can be attributed to its poor performance for the non-equilibrium geometries as shown in Table S2. Another noteworthy decline in performance is that of the B97M-V and B97M-rV functionals. These functionals were the best performing semi-local density functionals in the H2Bind275 dataset (ranked 5th and 6th), and were recommended as inexpensive alternatives to the best performing and expensive density functionals.21 However, their performance in the current H2Bind787 dataset deteriorates with B97M-rV and B97M-V yielding errors of 9.0% and 9.1% (ranked 14th and 15th) respectively. While this reflects their lacklustre performance for the non-equilibrium geometries, they still remain the best performing semi-local functionals. The next best performing semi-local density functional, revTPSS, is ranked 21st and shows a RegMAPE of 12.0%. The performance of PBE0 and B2PLYP-D3(BJ) DFAs shows significant improvement relative to their performance in the H2Bind275 dataset with both density functionals entering the top 10 category for the H2Bind787 dataset.
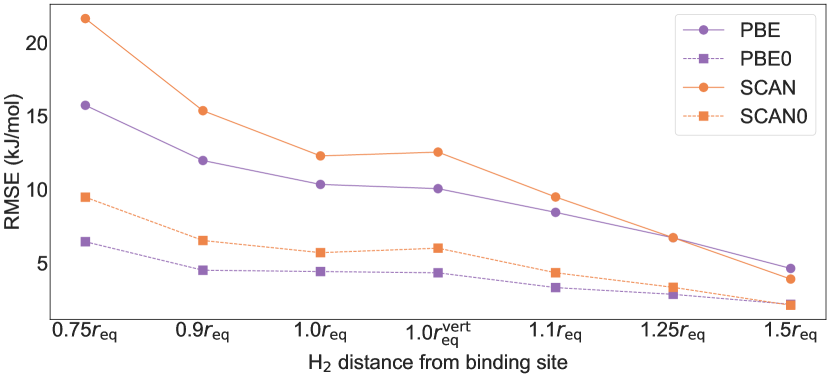
Other general trends also hold for DFAs assessed with the RegMAPE error metric. The best DFA of each rung of the Jacob’s ladder outperforms the best DFA from the rung below it. The best performing meta-GGA functional is B97M-rV with a RegMAPE of 9.0% and the best GGA is PBE with a RegMAPE of 15.3%. The effect of addition of empirical dispersion correction can also be assessed using the mean signed error (MSE) and RegMAPE metrics. Addition of dispersion correction improves the performance only if the parent density functional has a systematic underbinding problem (characterized by a positive value of MSE). For example, B3LYP has an MSE of 2.7 kJ/mol and a RegMAPE of 15.5% and is systematically underbinding \ceH2(s). Addition of a dispersion correction to B3LYP leads to the B3LYP-D3(0) functional which overcomes this underbinding problem. B3LYP-D3(0) slightly overbinds with an MSE of kJ/mol, but shows an improved RegMAPE of 14.0%. Addition of DFT-D corrections also improves the performance of other underbinding DFAs like revPBE and BLYP. However, addition of these corrections to parent DFAs that are already overbinding exacerbates the overbinding issue leading to poorer performance as exemplified by PBE, PBE0, TPSS, SCAN, and MS2 functionals. Remarkably, PBE without any dispersion correction is the best performing GGA. As empirical dispersion correction is distance dependent, it is interesting to see its effect at different points on the PEC. For overbinding functionals, addition of dispersion correction worsens their performance across the PEC as exemplified by the PEC of PBE and PBE-D3(0) in Fig. 3. The difference between the RMSEs of PBE and PBE-D3(0) increases with increasing distance of \ceH2 with the binding site as dispersion corrections are usually damped in the short range. Dispersion corrections improve the performance of underbinding functionals in the short range. However, in the long range, dispersion corrections overestimate its magnitude, causing BLYP, B3LYP, and revPBE to overbind in the elongated regime. MSEs and RMSEs of all the DFAs containing dispersion corrections and their corresponding parent functionals is shown in Table S3.
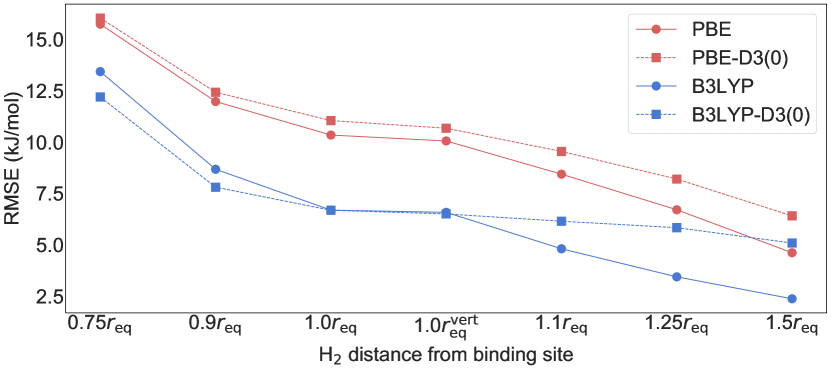
Addition of HF exact exchange is essential to ameliorate the effect of self interaction error in density functionals. Comparing DFAs belonging to the same family, addition of HF exchange improves the performance of semi-local functionals for the H2Bind787 dataset. PBE0, which contains 25% HF exchange, is ranked the 7th with a RegMAPE of 7.6%. In contrast, the PBE functional is ranked 29th with a RegMAPE for 15.3%, more than two times that of PBE0. HF exchange is a short-range effect and addition of HF exchange improves the performance of density functionals in the short range as shown in Fig. 4. While the hybrid functional performs better than its semi-local counterpart throughout the PEC, its effect is more pronounced in the compressed region than the elongated region. The SCAN and SCAN0 functionals show RMSEs of 21.6 and 9.5 kJ/mol (a difference of 12.2 kJ/mol) at of the PEC. Their RMSEs at is 3.9 and 2.1 kJ/mol, with the hybrid functional improving on the semi-local one by only 1.8 kJ/mol.
The RegMAPE error metric gives larger weights to data points whose reference interaction energies are in the interesting range for \ceH2 storage. Further, it gives more weight to the equilibrium data point than non-equilibrium data points. The relative weights of data points on the PES can be further tuned in order to assess the origin of errors of different DFAs. Elongated geometries are encountered more often than compressed geometries in porous material capable of storing \ceH2. Compressed geometries are also much higher in energy (geometries compressed by 25% are almost always repulsive) and are encountered less often in simulations. This would suggest retuning the weights of the regularized errors by giving larger weights to equilibrium and elongated regions of the PEC. The weighted RegMAPE (denoted as wRegMAPE or ) is defined as:
| (5) |
where is the RegMAPE at the point defined in Eq. (4). Ensuring that the weights sum up to would enable an apples-to-apples comparison of wRegMAPE and RegMAPE. In the case of RegMAPE, , for all values of . Reducing the weights of the compressed geometries with the scheme shown in Table 4, the wRegMAPE can be computed using Eq. (5). This wRegMAPE metric, shown in Table 5, gives more weight to the elongated geometries. As the vertical interaction is computed its respective PEC minimum, the 1.0 data point is assigned a weight equal to that of the adiabatic interaction energy at PEC minimum.
| PEC location | 0.9 | 1.0 | 1.0 | 1.1 | 1.25 | 1.5 | |
|---|---|---|---|---|---|---|---|
| Weight () | 0.75 | 0.91 | 1.07 | 1.07 | 1.07 | 1.07 | 1.07 |
| Rank | DFA | wRegMAPE (%) |
|---|---|---|
| 1 | PBE0-DH | 4.8 |
| 2 | B97X-V | 5.2 |
| 3 | DSD-PBEPBE-D3(BJ) | 5.9 |
| 4 | B97M-V | 6.0 |
| 5 | XYGJ-OS | 6.5 |
| 6 | B97M(2) | 7.0 |
| 7 | PBE0 | 7.4 |
| 8 | HSE-HJS | 7.4 |
| 9 | XYG3 | 7.9 |
| 10 | B2PLYP-D3(BJ) | 8.0 |
| 11 | B97M-rV | 8.4 |
| 12 | B97M-V | 8.4 |
| 13 | B97X-D | 8.5 |
| 14 | SCAN0 | 8.7 |
| 15 | PTPSS-D3(0) | 9.1 |
Comparing the magnitude of the wRegMAPE (Table 5) of different DFAs to their corresponding RegMAPE (Table 3), we can notice that the wRegMAPEs are slightly smaller. Smaller wRegMAPEs suggest that density functionals perform better for the equilibrium and elongated geometries in comparison to the compressed ones. However, the relative ordering of density functionals remains more or less the same. The top five best performing DFAs (PBE0-DH, B97X-V, B97M-V, DSD-PBEPBE-D3(BJ), and XYGJ-OS) according to the RegMAPE metric are also the five best performing functionals according to the wRegMAPE metric. We see that the recently parametrized B97M(2) double hybrid density functional, which uses B97M-V orbitals, is ranked sixth with wRegMAPE of 7.0%.
3.3 Performance of Density Functional Approximation for Geometries
All the equilibrium geometries for this dataset were obtained by geometry optimization using the B97M-V density functional in the def2-TZVPD basis set.92 With the exception of two chemical systems (\ceAlF3-H2 and \ceTi+-(H2)2), the CCSD(T)/CBS equilibrium geometry of all other chemical systems coincides (up to sampling precision) with the B97M-V/def2-TZVPD equilibrium geometry. This further validates the choice of equilibrium geometries for the H2Bind787 dataset.
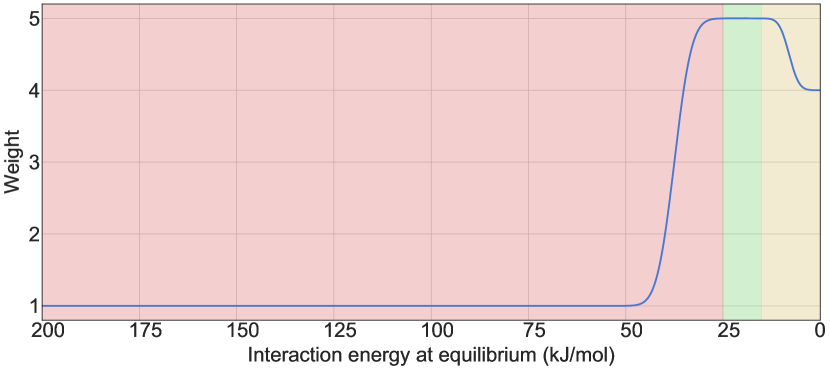
In order to assess the error in prediction of equilibrium geometry in a manner that is sensitive for \ceH2 storage purposes, we have devised a weighting scheme that gives larger weights to more relevant data points. Data points with reference adiabatic interaction energy at equilibrium () in the range of to kJ/mol are given a weight of . Equilibrium interaction energies stronger than kJ/mol are assigned a weight of . These weights were chosen to reflect the relative importance of these data points in the RegMAPE metric. In the RegMAPE metric, a density functional yielding an error of 1 kJ/mol in the strong binding regime contributes 1 unit to the total error as absolute error metric is used in this regime. A DFA with an error of the 1 kJ/mol in the middle of the favorable regime for \ceH2 storage (that is at kJ/mol) contributes 5 units to the total error as percentage error metric is used. The RegMAPE metric assigns a weight that is 5 times larger to the species in the favorable regime in comparison to the strong binders, thus justifying the weights of and in Fig. (5). The weak binders with equilibrium interaction energies weaker than kJ/mol are mostly comprised of the organic ligands. These species are ubiquitously found in porous materials capable of adsorbing \ceH2 (like MOFs) and form secondary binding sites for \ceH2. As this regime is not as important as the favorable one, it is assigned a weight of . This weighting scheme is used to form the weighted mean signed error (wMSE) and weighted mean unsigned error (wMAE) metrics in Fig. (5). The reference adiabatic interaction energy at equilibrium decides the weight of the corresponding PEC. As the vertical interaction energy does not lie on the adiabatic PEC, those data points were not included in the analyses in this section.
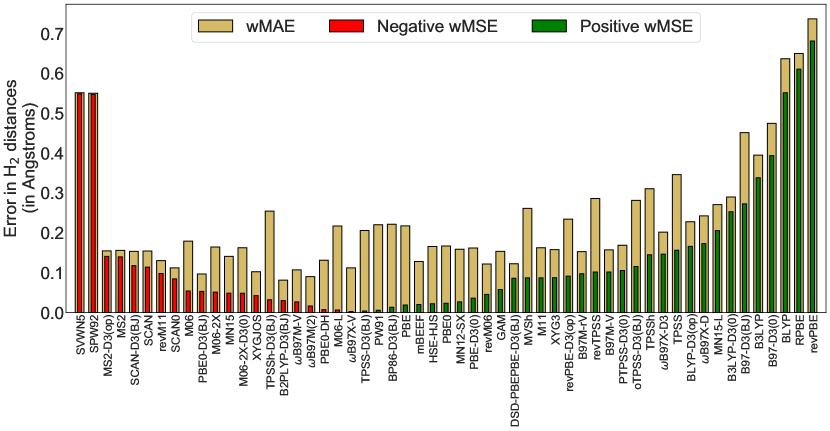
Most DFAs predict longer equilibrium binding motif – \ceH2 distances which is shown as a positive value of wMSE in Fig. 6. With the exception of the LDA density functionals, we see that all other density functionals which predict shorter equilibrium \ceH2 distances have a very small negative wMSE (Å). The double hybrid density functional B2PLYP-D3(BJ) gives the best performance for predicting equilibrium geometry with a wMAE of 0.08Å. It is closely followed by the recently parametrized double hybrid B97M(2) density functional with a wMAE of 0.09Å. Both of these DFAs perform much better for equilibrium geometries in comparison to their performance for PECs. It is also rather surprising to note the less good performance of PBE0-DH (wMAE of Å), which is the best performing DFA for binding energies according to RMSE and RegMAPE. On the other hand, PBE0-D3(BJ) gives good geometries (ranked 3rd with wMAE of 0.10 Å) but its performance for PECs is mediocre (ranked 19th with a RegMAPE of 11.5%). However, other top performing DFAs in the energetics category like XYGJ-OS, B97M-V, and B97X-V also perform well for geometries giving low wMAEs of 0.10 Å, 0.11 Å, and 0.11Å respectively. In particular, B97X-V shows no systematic error with virtually zero wMSE. It is also interesting to note the good performance of some semi-local density functionals like mBEEF and B97M-rV which give very low errors despite having no HF exchange. In light of these observations, and given the enhanced computational cost of double hybrid DFA nuclear gradients,97 one can use hybrid DFAs like PBE0-D3(BJ) or B97M-V to perform a geometry optimization and then use the optimized geometry to perform a single point interaction energy calculation using a hybrid or double hybrid functional.
Another noticeable tread is the performance of DFAs upon the addition of some form of empirical dispersion correction. Addition of empirical dispersion corrections to DFAs reduces their errors for equilibrium \ceH2 distance prediction when the parent functional overestimates it. For example, the addition of the D3(op) correction to revPBE decreases its wMSE from 0.68Å to 0.09Å (concurrently decreasing wMAE from 0.74Å to 0.23Å). The performance of the commonly used density functional B3LYP and M06-2X is quite poor with large wMSE and wMAEs.
| Rank | DFA | RegMAPEad |
|---|---|---|
| 1 | B97X-V | 4.7 |
| 2 | DSD-PBEPBE-D3(BJ) | 4.7 |
| 3 | PBE0-DH | 5.3 |
| 4 | B97M-V | 6.0 |
| 5 | XYGJ-OS | 7.1 |
| 6 | B97M-rV | 7.2 |
| 7 | B97M-V | 7.2 |
| 8 | B97M(2) | 7.4 |
| 9 | B97X-D | 7.8 |
| 10 | XYG3 | 7.9 |
| 11 | B2PLYP-D3(BJ) | 8.3 |
| 12 | PBE0 | 8.4 |
| 13 | HSE-HJS | 8.4 |
| 14 | B97X-D3 | 9.5 |
| 15 | SCAN0 | 9.7 |
| 28 | B3LYP | 15.7 |
| 30 | PBE | 16.3 |
| 31 | SCAN | 16.4 |
| 33 | revPBE-D3(op) | 17.3 |
| 42 | mBEEF | 19.9 |
| 48 | M06-2X | 22.3 |
| 51 | B97-D3(BJ) | 24.4 |
| 52 | GAM | 26.5 |
| 53 | B97-D3(0) | 29.4 |
Typically, DFAs are used to optimize geometries of complexes containing an \ceH2 bound to a binding motif. After the geometry optimization has converged to a minimum on the potential energy surface, the binding energy of \ceH2 is computed as the difference between the energy of the complex at the minimum of the potential energy surface and energies of the binding motif and \ceH2 in isolation. Alternatively, DFAs can also be used in molecular dynamics and Monte Carlo simulations either directly98 or indirectly (as reference energies for parametrizing force fields).99, 100, 101, 102 In these typical use cases, error in equilibrium binding energy can be attributed to two sources: (1) Inaccurate prediction of equilibrium geometry (2) Incorrect prediction of binding energy for the equilibrium geometry. Using DFAs for modeling \ceH2 binding materials, the DFA equilibrium geometry is typically used for computing the equilibrium binding energy.
We can assess the effect of relaxing the geometry along the PEC (defined by each DFA), the interaction coordinate of \ceH2 with the binding site. Geometry optimization along this coordinate can either improve or deteriorate the performance of density functionals. The performance of selected density functionals for predicting the minimum energy geometry on its PEC and the \ceH2 binding energy for this geometry assessed by the RegMAPE error metric is shown in Table 6 (the complete table showing the performance of all 55 DFAs is included in Table S4).
As both the reference and DFA geometries are relaxed along the potential energy curve, this error metric is adiabatic (ad) in nature as reflected in its subscript (RegMAPEad). The top five density functionals by the RegMAPEad error metric are also the top five best performers according to their RegMAPE errors (Table 3), further emphasizing the superior performance of these DFAs for computing \ceH2 interaction energies. While the top five density functionals remain the same, it is interesting to note small changes in their order. B97X-V is the best performing DFA with a RegMAPEad of 4.65% which is very closely followed by DSD-PBEPBE-D3(BJ) with a RegMAPEad of 4.68%. Another noteworthy difference is the performance of the B97M-rV and the B97M-V functionals which are ranked sixth and seventh with RegMAPEad of 7.22% and 7.23% respectively. These DFAs were ranked 12th and 13th with RegMAPE of 9.0% and 9.1%. These functionals show a favorable cancellation of error in prediction of \ceH2 equilibrium binding energies when the equilibrium geometry is also optimized using the same functional. As these density functionals also do not have any HF exchange, they are computationally less expensive making them well-suited for applications in high-throughput material screening. The rVV10 non-local functional, which is an approximation65 of the VV10 non-local functional, also allows for efficient evaluation in a plane wave framework and can be useful for modeling periodic systems like MOFs. A thorough assessment of the DFA geometry relaxed on the entire potential energy surface, not just along the one-dimensional PEC, is beyond the scope of this work and we refer interested readers to Ref. 28 for a detailed discussion of this topic.
4 Conclusions
The H2Bind275 dataset published recently21 assesses the performance of density functionals for predicting the interaction energy of \ceH2 with different model binding motifs at the equilibrium geometry. In this work, we have assessed the ability of DFAs to predict \ceH2 interaction energies with binding motifs accurately throughout the PEC, not just at equilibrium geometry. To that end, we have extended our previous H2Bind275 dataset by adding two compressed and three elongated geometries along the PEC to form the H2Bind787 dataset. The H2Bind787 dataset comprises 545 data points at different fixed points along 78 PECs of various model binding motifs with \ceH2. Reference interaction energies for all data points were computed using CCSD(T) extrapolated to the complete basis set limit. The performance of 55 DFAs was assessed with the CCSD(T) reference interaction energies using multiple error metrics. The RMSE metric is democratic and gives equal important to all the 545 data points. The RegMAPE metric, on the other hand, gives more weight to binding motifs with interaction energies in the range of to kJ/mol at equilibrium geometry. For each binding motif, the RegMAPE metric is designed to give more weight to the equilibrium than non-equilibrium data points as the latter are encountered less often in modeling and simulation. DFAs are also assessed on the basis of their predicted equilibrium geometry and binding energy at predicted equilibrium geometry.
The CCSD(T) reference interaction energies for the H2Bind787 dataset span a wide range of attractive and repulsive interaction energies. As repulsive geometries are usually not included in non-covalent interaction energy datasets, the H2Bind787 dataset adds considerably to the diversity of the available datasets. The non-empirical double hybrid functional, PBE0-DH, shows the least error (RMSE of 2.9 kJ/mol and RegMAPE of 5.0%) in predicting \ceH2 binding energy throughout the PEC. The B97X-V, B97M-V, and DSD-PBEPBE-D3(BJ) density functionals are also top performers. The semi-local density functionals, B97M-V and B97M-rV, show poorer performance for the H2Bind787 dataset, in comparison to the previous H2Bind275 dataset using the RegMAPE error metric. For the H2Bind787 dataset, B97M-V and B97M-rV are ranked 13th and 12th respectively with RegMAPEs of 9.1% and 9.0%. Previously in the H2Bind275 dataset, they were ranked 5th and 6th with RegMAPE of 6.8%. In general, the good performance of the top density functionals in the H2Bind275 dataset continues for the H2Bind787 dataset. Addition of DFT-D empirical dispersion correction increases the accuracy of underbinding density functionals like revPBE, BLYP, and B3LYP. This addition also decreases the accuracy of overbinding parent density functionals like PBE, PBE0, TPSS, SCAN, and MS2. As DFT-D empirical dispersion corrections are distance dependent, their effect is not felt uniformly across the PEC. The effect of addition of HF exchange, a short-ranged effect, improves the performance of density functionals in the compressed regime more than in the elongated regime of the PEC, thus playing a crucial role in accurately predicting the repulsive wall of the PEC. The weighted RegMAPE metric gives smaller weights to DFA errors in the compressed region of the PEC. This metric shows that, in general, DFAs perform better in the equilibrium and elongated regime than in the compressed region.
Assessment of DFAs for predicting equilibrium geometries reveals that PBE0-DH, which is the best performer for energies, shows less good performance for geometries. However, other hybrid functionals like B97M-V and B97X-V give good performance for both geometries and energies. Using the adiabatic RegMAPE metric (RegMAPEad) reveals that the semi-local DFAs, B97M-V and B97M-rV, show very small errors. They benefit significantly from cancellation between geometry-driven and energy-driven errors. B97M-V and B97X-V are the only density functionals that are not double hybrids which consistently show good performance for all the error metrics (energy and geometry-related) defined in this work. As these hybrid functionals have significantly lower computational cost in comparison to double hybrids, we recommend their usage for \ceH2 binding applications.
The H2Bind787 dataset, consisting of highly accurate reference interaction energies, represents a distinctive addition to other non-covalent interaction energy databases. More than half of this dataset consists of transition metal species which are usually underrepresented in non-covalent interaction energy datasets. This dataset is composed of complete PECs, rather than just PEC minimum geometries – only a handful of the non-covalent interaction energy datasets contain this information. Besides, almost all of the PECs in this dataset sample the repulsive wall. For these reasons, using the H2Bind787 dataset in training or validating DFAs can improve their performance and transferability. This work further validates the selection of best performing density functionals for the H2Bind275 dataset using a semi-independent dataset that is about two times larger. The definition and generalization of different error metrics (RegMAPE, wRegMAPE, and RegMAPEad) can be used for assessment of other similar datasets with well-defined schemes for weighting different data points. As force field parametrization requires good reference energies throughout the potential energy surface, the top performing density functionals in this work can be used for generating them.
This work was supported by the Hydrogen Materials - Advanced Research Consortium (HyMARC), established as part of the Energy Materials Network under the U.S. Department of Energy, Office of Energy Efficiency and Renewable Energy, under Contract No. DE-AC02-05CH11231. The following author declares a competing financial interest. M. H. G. is a part owner of Q-Chem, Inc.
Additional information regarding the parameters used for double hybrid density functionals, performance of density functionals for the non-equilibrium subset of the H2Bind787 dataset, and the RegMAPEad error for all DFAs assessed in this work is included in the supplementary information. CCSD(T)/CBS and DFA interaction energies for all 55 functionals are provided in the file supporting_information.xlsx. The geometries of all complexes in the H2Bind787 are included in geometries.zip file.
References
- Takagi et al. 2004 Takagi, H.; Hatori, H.; Soneda, Y.; Yoshizawa, N.; Yamada, Y. Adsorptive hydrogen storage in carbon and porous materials. Mater. Sci. Eng., B 2004, 108, 143–147
- Thomas 2007 Thomas, K. M. Hydrogen adsorption and storage on porous materials. Catal. Today 2007, 120, 389–398
- Murray et al. 2009 Murray, L. J.; Dincă, M.; Long, J. R. Hydrogen storage in metal–organic frameworks. Chem. Soc. Rev. 2009, 38, 1294–1314
- Park et al. 2012 Park, N.; Choi, K.; Hwang, J.; Kim, D. W.; Kim, D. O.; Ihm, J. Progress on first-principles-based materials design for hydrogen storage. Proc. Natl. Acad. Sci. U. S. A. 2012, 109, 19893–19899
- Allendorf et al. 2018 Allendorf, M. D.; Hulvey, Z.; Gennett, T.; Ahmed, A.; Autrey, T.; Camp, J.; Seon Cho, E.; Furukawa, H.; Haranczyk, M.; Head-Gordon, M.; Jeong, S.; Karkamkar, A.; Liu, D. J.; Long, J. R.; Meihaus, K. R.; Nayyar, I. H.; Nazarov, R.; Siegel, D. J.; Stavila, V.; Urban, J. J.; Veccham, S. P.; Wood, B. C. An assessment of strategies for the development of solid-state adsorbents for vehicular hydrogen storage. Energy Environ. Sci. 2018, 11, 2784–2812
- Colón et al. 2014 Colón, Y. J.; Fairen-Jimenez, D.; Wilmer, C. E.; Snurr, R. Q. High-throughput screening of porous crystalline materials for hydrogen storage capacity near room temperature. J. Phys. Chem. C 2014, 118, 5383–5389
- Thornton et al. 2017 Thornton, A. W.; Simon, C. M.; Kim, J.; Kwon, O.; Deeg, K. S.; Konstas, K.; Pas, S. J.; Hill, M. R.; Winkler, D. A.; Haranczyk, M.; Smit, B. Materials Genome in Action: Identifying the Performance Limits of Physical Hydrogen Storage. Chem. Mater. 2017, 29, 2844–2854
- Ahmed et al. 2019 Ahmed, A.; Seth, S.; Purewal, J.; Wong-Foy, A. G.; Veenstra, M.; Matzger, A. J.; Siegel, D. J. Exceptional hydrogen storage achieved by screening nearly half a million metal-organic frameworks. Nat. Commun. 2019, 10, 1–9
- Kapelewski et al. 2014 Kapelewski, M. T.; Geier, S. J.; Hudson, M. R.; Stück, D.; Mason, J. A.; Nelson, J. N.; Xiao, D. J.; Hulvey, Z.; Gilmour, E.; FitzGerald, S. A.; Head-Gordon, M.; Brown, C. M.; Long, J. R. M2(m-dobdc) (M = Mg, Mn, Fe, Co, Ni) Metal–Organic Frameworks Exhibiting Increased Charge Density and Enhanced H2 Binding at the Open Metal Sites. J. Am. Chem. Soc. 2014, 136, 12119–12129
- Tsivion et al. 2017 Tsivion, E.; Veccham, S. P.; Head-Gordon, M. High-Temperature Hydrogen Storage of Multiple Molecules: Theoretical Insights from Metalated Catechols. ChemPhysChem 2017, 18, 184–188
- Garrone et al. 2008 Garrone, E.; Bonelli, B.; Otero Areán, C. Enthalpy-entropy correlation for hydrogen adsorption on zeolites. Chem. Phys. Lett. 2008, 456, 68–70
- Bhatia and Myers 2006 Bhatia, S. K.; Myers, A. L. Optimum conditions for adsorptive storage. Langmuir 2006, 22, 1688–1700
- Bae and Snurr 2010 Bae, Y. S.; Snurr, R. Q. Optimal isosteric heat of adsorption for hydrogen storage and delivery using metal-organic frameworks. Microporous Mesoporous Mater. 2010, 132, 300–303
- Mueller and Ceder 2005 Mueller, T.; Ceder, G. A density functional theory study of hydrogen adsorption in MOF-5. J. Phys. Chem. B 2005, 109, 17974–17983
- Tsivion et al. 2014 Tsivion, E.; Long, J. R.; Head-Gordon, M. Hydrogen physisorption on metal-organic framework linkers and metalated linkers: A computational study of the factors that control binding strength. J. Am. Chem. Soc. 2014, 136, 17827–17835
- Cabria et al. 2008 Cabria, I.; López, M.; Alonso, J. Hydrogen storage capacities of nanoporous carbon calculated by density functional and Møller-Plesset methods. Phys. Rev. B 2008, 78, 075415
- Cabria et al. 2011 Cabria, I.; López, M.; Alonso, J. Simulation of the hydrogen storage in nanoporous carbons with different pore shapes. Int. J. Hydrogen Energy 2011, 36, 10748–10759
- Niaz et al. 2014 Niaz, S.; Manzoor, T.; Islam, N.; Pandith, A. H. Theoretical investigations on C2H4Nb complex as a potential hydrogen storage system, using moller–plesset (MP2) and density functional theory. Int. J. Quantum Chem. 2014, 114, 449–457
- Kocman et al. 2015 Kocman, M.; Jurečka, P.; Dubeckỳ, M.; Otyepka, M.; Cho, Y.; Kim, K. S. Choosing a density functional for modeling adsorptive hydrogen storage: reference quantum mechanical calculations and a comparison of dispersion-corrected density functionals. Phys. Chem. Chem. Phys. 2015, 17, 6423–6432
- Ma et al. 2015 Ma, L.-J.; Jia, J.; Wu, H.-S. Computational investigation of hydrogen storage on scandium–acetylene system. Int. J. Hydrogen Energy 2015, 40, 420–428
- Veccham and Head-Gordon 2020 Veccham, S. P.; Head-Gordon, M. Density Functionals for Hydrogen Storage: Defining the H2Bind275 Test Set with Ab Initio Benchmarks and Assessment of 55 Functionals. J. Chem. Theory Comput. 2020, 16, 4963–4982
- Mardirossian and Head-Gordon 2016 Mardirossian, N.; Head-Gordon, M. B97M-V: A combinatorially optimized, range-separated hybrid, meta-GGA density functional with VV10 nonlocal correlation. J. Chem. Phys. 2016, 144, 214110
- Sillar et al. 2009 Sillar, K.; Hofmann, A.; Sauer, J. Ab Initio Study of Hydrogen Adsorption in MOF-5. J. Am. Chem. Soc. 2009, 131, 4143–4150
- Koizumi et al. 2019 Koizumi, K.; Nobusada, K.; Boero, M. Hydrogen storage mechanism and diffusion in metal–organic frameworks. Phys. Chem. Chem. Phys. 2019, 21, 7756–7764
- Gráfová et al. 2010 Gráfová, L.; Pitonak, M.; Rezac, J.; Hobza, P. Comparative study of selected wave function and density functional methods for noncovalent interaction energy calculations using the extended S22 data set. J. Chem. Theory Comput. 2010, 6, 2365–2376
- Jurečka et al. 2006 Jurečka, P.; Šponer, J.; Černỳ, J.; Hobza, P. Benchmark database of accurate (MP2 and CCSD (T) complete basis set limit) interaction energies of small model complexes, DNA base pairs, and amino acid pairs. Phys. Chem. Chem. Phys. 2006, 8, 1985–1993
- Řezáč et al. 2011 Řezáč, J.; Riley, K. E.; Hobza, P. S66: A well-balanced database of benchmark interaction energies relevant to biomolecular structures. J. Chem. Theory Comput. 2011, 7, 2427–2438
- Witte et al. 2015 Witte, J.; Goldey, M.; Neaton, J. B.; Head-Gordon, M. Beyond energies: Geometries of nonbonded molecular complexes as metrics for assessing electronic structure approaches. J. Chem. Theory Comput. 2015, 11, 1481–1492
- Řezáč and Hobza 2013 Řezáč, J.; Hobza, P. Describing noncovalent interactions beyond the common approximations: How accurate is the “gold standard,” CCSD (T) at the complete basis set limit? J. Chem. Theory Comput. 2013, 9, 2151–2155
- Raghavachari et al. 1989 Raghavachari, K.; Trucks, G. W.; Pople, J. A.; Head-Gordon, M. A fifth order comparison of electron correlation theories. Chem. Phys. Lett. 1989, 157, 479–483
- Tajti et al. 2004 Tajti, A.; Szalay, P. G.; Császár, A. G.; Kállay, M.; Gauss, J.; Valeev, E. F.; Flowers, B. A.; Vázquez, J.; Stanton, J. F. HEAT: High accuracy extrapolated ab initio thermochemistry. J. Chem. Phys. 2004, 121, 11599–11613
- DeYonker et al. 2006 DeYonker, N. J.; Cundari, T. R.; Wilson, A. K. The correlation consistent composite approach (ccCA): An alternative to the Gaussian-n methods. J. Chem. Phys. 2006, 124, 84108
- Karton et al. 2006 Karton, A.; Rabinovich, E.; Martin, J. M.; Ruscic, B. W4 theory for computational thermochemistry: In pursuit of confident sub-kJ/mol predictions. J. Chem. Phys. 2006, 125, 11599
- Curtiss et al. 2007 Curtiss, L. A.; Redfern, P. C.; Raghavachari, K. Gaussian-4 theory. J. Chem. Phys. 2007, 126, 084108
- East and Allen 1993 East, A. L. L.; Allen, W. D. The heat of formation of NCO. J. Chem. Phys. 1993, 99, 4638–4650
- Császár et al. 1998 Császár, A. G.; Allen, W. D.; Schaefer, H. F. In pursuit of the ab initio limit for conformational energy prototypes. J. Chem. Phys. 1998, 108, 9751–9764
- Helgaker et al. 1997 Helgaker, T.; Klopper, W.; Koch, H.; Noga, J. Basis-set convergence of correlated calculations on water. J. Chem. Phys. 1997, 106, 9639–9646
- Dunning 1989 Dunning, T. H. Gaussian basis sets for use in correlated molecular calculations. I. The atoms boron through neon and hydrogen. J. Chem. Phys. 1989, 90, 1007–1023
- Woon and Dunning 1993 Woon, D. E.; Dunning, T. H. Gaussian basis sets for use in correlated molecular calculations. III. The atoms aluminum through argon. J. Chem. Phys. 1993, 98, 1358–1371
- Woon and Dunning 1995 Woon, D. E.; Dunning, T. H. Gaussian basis sets for use in correlated molecular calculations. V. Core-valence basis sets for boron through neon. J. Chem. Phys. 1995, 103, 4572–4585
- Peterson and Dunning 2002 Peterson, K. A.; Dunning, T. H. Accurate correlation consistent basis sets for molecular core-valence correlation effects: The second row atoms Al-Ar, and the first row atoms B-Ne revisited. J. Chem. Phys. 2002, 117, 10548–10560
- Balabanov and Peterson 2005 Balabanov, N. B.; Peterson, K. A. Systematically convergent basis sets for transition metals. I. All-electron correlation consistent basis sets for the 3d elements Sc-Zn. J. Chem. Phys. 2005, 123, 64107
- Mardirossian and Head-Gordon 2017 Mardirossian, N.; Head-Gordon, M. Thirty years of density functional theory in computational chemistry: an overview and extensive assessment of 200 density functionals. Mol. Phys. 2017, 115, 2315–2372
- Perdew et al. 2005 Perdew, J. P.; Ruzsinszky, A.; Tao, J.; Staroverov, V. N.; Scuseria, G. E.; Csonka, G. I. Prescription for the design and selection of density functional approximations: More constraint satisfaction with fewer fits. J. Chem. Phys. 2005, 123, 62201
- Dirac 1930 Dirac, P. A. Note on exchange phenomena in the Thomas atom. Math. Proc. Cambridge Philos. Soc. 1930; pp 376–385
- Vosko et al. 1980 Vosko, S. H.; Wilk, L.; Nusair, M. Accurate spin-dependent electron liquid correlation energies for local spin density calculations: a critical analysis. Can. J. Phys. 1980, 58, 1200–1211
- Perdew and Wang 1992 Perdew, J. P.; Wang, Y. Accurate and simple analytic representation of the electron-gas correlation energy. Phys. Rev. B 1992, 45, 13244
- Perdew et al. 1996 Perdew, J.; Burke, K.; Ernzerhof, M. Generalized Gradient Approximation Made Simple. Phys. Rev. Lett. 1996, 77, 3865–3868
- Grimme et al. 2010 Grimme, S.; Antony, J.; Ehrlich, S.; Krieg, H. A consistent and accurate ab initio parametrization of density functional dispersion correction (DFT-D) for the 94 elements H-Pu. J. Chem. Phys. 2010, 132, 154104
- Hammer et al. 1999 Hammer, B.; Hansen, L. B.; Nørskov, J. K. Improved adsorption energetics within density-functional theory using revised Perdew-Burke-Ernzerhof functionals. Phys. Rev. B 1999, 59, 7413
- Zhang and Yang 1998 Zhang, Y.; Yang, W. Comment on “Generalized gradient approximation made simple”. Phys. Rev. Lett. 1998, 80, 890
- Witte et al. 2017 Witte, J.; Mardirossian, N.; Neaton, J. B.; Head-Gordon, M. Assessing DFT-D3 Damping Functions Across Widely Used Density Functionals: Can We Do Better? J. Chem. Theory Comput. 2017, 13, 2043–2052
- Becke 1988 Becke, A. D. Density-functional exchange-energy approximation with correct asymptotic behavior. Phys. Rev. A 1988, 38, 3098
- Lee et al. 1988 Lee, C.; Yang, W.; Parr, R. G. Development of the Colle-Salvetti correlation-energy formula into a functional of the electron density. Phys. Rev. B 1988, 37, 785–789
- Becke 1997 Becke, A. D. Density-functional thermochemistry. V. Systematic optimization of exchange-correlation functionals. J. Chem. Phys. 1997, 107, 8554–8560
- Grimme et al. 2011 Grimme, S.; Ehrlich, S.; Goerigk, L. Effect of the damping function in dispersion corrected density functional theory. J. Comput. Chem. 2011, 32, 1456–1465
- Perdew et al. 1992 Perdew, J. P.; Chevary, J. A.; Vosko, S. H.; Jackson, K. A.; Pederson, M. R.; Singh, D. J.; Fiolhais, C. Atoms, molecules, solids, and surfaces: Applications of the generalized gradient approximation for exchange and correlation. Phys. Rev. B 1992, 46, 6671–6687
- Haoyu et al. 2015 Haoyu, S. Y.; Zhang, W.; Verma, P.; He, X.; Truhlar, D. G. Nonseparable exchange–correlation functional for molecules, including homogeneous catalysis involving transition metals. Phys. Chem. Chem. Phys. 2015, 17, 12146–12160
- Tao et al. 2003 Tao, J.; Perdew, J. P.; Staroverov, V. N.; Scuseria, G. E. Climbing the density functional ladder: Nonempirical meta–generalized gradient approximation designed for molecules and solids. Phys. Rev. Lett. 2003, 91, 146401
- Perdew et al. 2009 Perdew, J. P.; Ruzsinszky, A.; Csonka, G. I.; Constantin, L. A.; Sun, J. Workhorse semilocal density functional for condensed matter physics and quantum chemistry. Phys. Rev. Lett. 2009, 103, 026403
- Sun et al. 2015 Sun, J.; Ruzsinszky, A.; Perdew, J. P. Strongly constrained and appropriately normed semilocal density functional. Phys. Rev. Lett. 2015, 115, 036402
- Brandenburg et al. 2016 Brandenburg, J.; Bates, J.; Sun, J.; Perdew, J. Benchmark tests of a strongly constrained semilocal functional with a long-range dispersion correction. Phys. Rev. B 2016, 94, 115144
- Sun et al. 2013 Sun, J.; Haunschild, R.; Xiao, B.; Bulik, I. W.; Scuseria, G. E.; Perdew, J. P. Semilocal and hybrid meta-generalized gradient approximations based on the understanding of the kinetic-energy-density dependence. J. Chem. Phys. 2013, 138, 044113
- Mardirossian and Head-Gordon 2015 Mardirossian, N.; Head-Gordon, M. Mapping the genome of meta-generalized gradient approximation density functionals: The search for B97M-V. J. Chem. Phys. 2015, 142, 074111
- Sabatini et al. 2013 Sabatini, R.; Gorni, T.; De Gironcoli, S. Nonlocal van der Waals density functional made simple and efficient. Phys. Rev. B 2013, 87, 4–7
- Mardirossian et al. 2016 Mardirossian, N.; Ruiz Pestana, L.; Womack, J. C.; Skylaris, C.-K.; Head-Gordon, T.; Head-Gordon, M. Use of the rVV10 nonlocal correlation functional in the B97M-V density functional: defining B97M-rV and related functionals. J. Phys. Chem. Lett. 2016, 8, 35–40
- Wellendorff et al. 2014 Wellendorff, J.; Lundgaard, K. T.; Jacobsen, K. W.; Bligaard, T. mBEEF: An accurate semi-local Bayesian error estimation density functional. J. Chem. Phys. 2014, 140, 144107
- Zhao and Truhlar 2006 Zhao, Y.; Truhlar, D. G. A new local density functional for main-group thermochemistry, transition metal bonding, thermochemical kinetics, and noncovalent interactions. J. Chem. Phys. 2006, 125, 194101
- Yu et al. 2016 Yu, H. S.; He, X.; Truhlar, D. G. MN15-L: A new local exchange-correlation functional for Kohn–Sham density functional theory with broad accuracy for atoms, molecules, and solids. J. Chem. Theory Comput. 2016, 12, 1280–1293
- Becke 1993 Becke, A. D. Density‐functional thermochemistry. III. The role of exact exchange. J. Chem. Phys. 1993, 98, 5648–5652
- Adamo and Barone 1999 Adamo, C.; Barone, V. Toward reliable density functional methods without adjustable parameters: The PBE0 model. J. Chem. Phys. 1999, 110, 6158–6170
- Staroverov et al. 2003 Staroverov, V. N.; Scuseria, G. E.; Tao, J.; Perdew, J. P. Comparative assessment of a new nonempirical density functional: Molecules and hydrogen-bonded complexes. J. Chem. Phys. 2003, 119, 12129–12137
- Zhao and Truhlar 2008 Zhao, Y.; Truhlar, D. G. The M06 suite of density functionals for main group thermochemistry, thermochemical kinetics, noncovalent interactions, excited states, and transition elements: two new functionals and systematic testing of four M06-class functionals and 12 other functionals. Theor. Chem. Acc. 2008, 120, 215–241
- Wang et al. 2018 Wang, Y.; Verma, P.; Jin, X.; Truhlar, D. G.; He, X. Revised M06 density functional for main-group and transition-metal chemistry. Proc. Natl. Acad. Sci. U. S. A. 2018, 115, 10257–10262
- Sun et al. 2015 Sun, J.; Perdew, J. P.; Ruzsinszky, A. Semilocal density functional obeying a strongly tightened bound for exchange. Proc. Natl. Acad. Sci. U. S. A. 2015, 112, 685–689
- Hui and Chai 2016 Hui, K.; Chai, J.-D. SCAN-based hybrid and double-hybrid density functionals from models without fitted parameters. J. Chem. Phys. 2016, 144, 044114
- Chai and Head-Gordon 2008 Chai, J.-D.; Head-Gordon, M. Long-range corrected hybrid density functionals with damped atom–atom dispersion corrections. Phys. Chem. Chem. Phys. 2008, 10, 6615–6620
- Lin et al. 2012 Lin, Y.-S.; Li, G.-D.; Mao, S.-P.; Chai, J.-D. Long-range corrected hybrid density functionals with improved dispersion corrections. J. Chem. Theory Comput. 2012, 9, 263–272
- Mardirossian and Head-Gordon 2014 Mardirossian, N.; Head-Gordon, M. B97X-V: A 10-parameter, range-separated hybrid, generalized gradient approximation density functional with nonlocal correlation, designed by a survival-of-the-fittest strategy. Phys. Chem. Chem. Phys. 2014, 16, 9904–9924
- Peverati and Truhlar 2011 Peverati, R.; Truhlar, D. G. Improving the accuracy of hybrid meta-GGA density functionals by range separation. J. Phys. Chem. Lett. 2011, 2, 2810–2817
- Verma et al. 2019 Verma, P.; Wang, Y.; Ghosh, S.; He, X.; Truhlar, D. G. Revised M11 Exchange-Correlation Functional for Electronic Excitation Energies and Ground-State Properties. J. Phys. Chem. A 2019, 123, 2966–2990
- Krukau et al. 2006 Krukau, A. V.; Vydrov, O. A.; Izmaylov, A. F.; Scuseria, G. E. Influence of the exchange screening parameter on the performance of screened hybrid functionals. J. Chem. Phys. 2006, 125, 224106
- Henderson et al. 2008 Henderson, T. M.; Janesko, B. G.; Scuseria, G. E. Generalized gradient approximation model exchange holes for range-separated hybrids. J. Chem. Phys. 2008, 128, 194105
- Peverati and Truhlar 2012 Peverati, R.; Truhlar, D. G. Screened-exchange density functionals with broad accuracy for chemistry and solid-state physics. Phys. Chem. Chem. Phys. 2012, 14, 16187–16191
- Grimme 2006 Grimme, S. Semiempirical hybrid density functional with perturbative second-order correlation. J. Chem. Phys. 2006, 124, 6158
- Zhang et al. 2009 Zhang, Y.; Xu, X.; Goddard, W. A. Doubly hybrid density functional for accurate descriptions of nonbond interactions, thermochemistry, and thermochemical kinetics. Proc. Natl. Acad. Sci. U. S. A. 2009, 106, 4963–4968
- Zhang et al. 2011 Zhang, I. Y.; Xu, X.; Jung, Y.; Goddard, W. A. A fast doubly hybrid density functional method close to chemical accuracy using a local opposite spin ansatz. Proc. Natl. Acad. Sci. U. S. A. 2011, 108, 19896–19900
- Brémond and Adamo 2011 Brémond, E.; Adamo, C. Seeking for parameter-free double-hybrid functionals: The PBE0-DH model. J. Chem. Phys. 2011, 135, 024106
- Goerigk and Grimme 2011 Goerigk, L.; Grimme, S. Efficient and accurate double-hybrid-meta-GGA density functionals- evaluation with the extended GMTKN30 database for general main group thermochemistry, kinetics, and noncovalent interactions. J. Chem. Theory Comput. 2011, 7, 291–309
- Kozuch and Martin 2013 Kozuch, S.; Martin, J. M. L. Spin-component-scaled double hybrids: An extensive search for the best fifth-rung functionals blending DFT and perturbation theory. J. Comput. Chem. 2013, 34, 2327–2344
- Mardirossian and Head-Gordon 2018 Mardirossian, N.; Head-Gordon, M. Survival of the most transferable at the top of Jacob’s ladder: Defining and testing the B97M(2) double hybrid density functional. J. Chem. Phys. 2018, 148, 241736
- Rappoport and Furche 2010 Rappoport, D.; Furche, F. Property-optimized Gaussian basis sets for molecular response calculations. J. Chem. Phys. 2010, 133, 134105
- Gill et al. 1993 Gill, P. M.; Johnson, B. G.; Pople, J. A. A standard grid for density functional calculations. Chem. Phys. Lett. 1993, 209, 506–512
- Akima 1970 Akima, H. A new method of interpolation and smooth curve fitting based on local procedures. J. Assoc. Comput. Mach. 1970, 17, 589–602
- Shao et al. 2015 Shao, Y.; Gan, Z.; Epifanovsky, E.; Gilbert, A. T.; Wormit, M.; Kussmann, J.; Lange, A. W.; Behn, A.; Deng, J.; Feng, X.; Ghosh, D.; Goldey, M.; Horn, P. R.; Jacobson, L. D.; Kaliman, I.; Khaliullin, R. Z.; Kuś, T.; Landau, A.; Liu, J.; Proynov, E. I.; Rhee, Y. M.; Richard, R. M.; Rohrdanz, M. A.; Steele, R. P.; Sundstrom, E. J.; Woodcock, H. L.; Zimmerman, P. M.; Zuev, D.; Albrecht, B.; Alguire, E.; Austin, B.; Beran, G. J.; Bernard, Y. A.; Berquist, E.; Brandhorst, K.; Bravaya, K. B.; Brown, S. T.; Casanova, D.; Chang, C. M.; Chen, Y.; Chien, S. H.; Closser, K. D.; Crittenden, D. L.; Diedenhofen, M.; Distasio, R. A.; Do, H.; Dutoi, A. D.; Edgar, R. G.; Fatehi, S.; Fusti-Molnar, L.; Ghysels, A.; Golubeva-Zadorozhnaya, A.; Gomes, J.; Hanson-Heine, M. W.; Harbach, P. H.; Hauser, A. W.; Hohenstein, E. G.; Holden, Z. C.; Jagau, T. C.; Ji, H.; Kaduk, B.; Khistyaev, K.; Kim, J.; Kim, J.; King, R. A.; Klunzinger, P.; Kosenkov, D.; Kowalczyk, T.; Krauter, C. M.; Lao, K. U.; Laurent, A. D.; Lawler, K. V.; Levchenko, S. V.; Lin, C. Y.; Liu, F.; Livshits, E.; Lochan, R. C.; Luenser, A.; Manohar, P.; Manzer, S. F.; Mao, S. P.; Mardirossian, N.; Marenich, A. V.; Maurer, S. A.; Mayhall, N. J.; Neuscamman, E.; Oana, C. M.; Olivares-Amaya, R.; Oneill, D. P.; Parkhill, J. A.; Perrine, T. M.; Peverati, R.; Prociuk, A.; Rehn, D. R.; Rosta, E.; Russ, N. J.; Sharada, S. M.; Sharma, S.; Small, D. W.; Sodt, A.; Stein, T.; Stück, D.; Su, Y. C.; Thom, A. J.; Tsuchimochi, T.; Vanovschi, V.; Vogt, L.; Vydrov, O.; Wang, T.; Watson, M. A.; Wenzel, J.; White, A.; Williams, C. F.; Yang, J.; Yeganeh, S.; Yost, S. R.; You, Z. Q.; Zhang, I. Y.; Zhang, X.; Zhao, Y.; Brooks, B. R.; Chan, G. K.; Chipman, D. M.; Cramer, C. J.; Goddard, W. A.; Gordon, M. S.; Hehre, W. J.; Klamt, A.; Schaefer, H. F.; Schmidt, M. W.; Sherrill, C. D.; Truhlar, D. G.; Warshel, A.; Xu, X.; Aspuru-Guzik, A.; Baer, R.; Bell, A. T.; Besley, N. A.; Chai, J. D.; Dreuw, A.; Dunietz, B. D.; Furlani, T. R.; Gwaltney, S. R.; Hsu, C. P.; Jung, Y.; Kong, J.; Lambrecht, D. S.; Liang, W.; Ochsenfeld, C.; Rassolov, V. A.; Slipchenko, L. V.; Subotnik, J. E.; Van Voorhis, T.; Herbert, J. M.; Krylov, A. I.; Gill, P. M.; Head-Gordon, M. Advances in molecular quantum chemistry contained in the Q-Chem 4 program package. Mol. Phys. 2015, 113, 184–215
- Taylor et al. 2016 Taylor, D. E.; Ángyán, J. G.; Galli, G.; Zhang, C.; Gygi, F.; Hirao, K.; Song, J. W.; Rahul, K.; Anatole von Lilienfeld, O.; Podeszwa, R.; Bulik, I. W.; Henderson, T. M.; Scuseria, G. E.; Toulouse, J.; Peverati, R.; Truhlar, D. G.; Szalewicz, K. Blind test of density-functional-based methods on intermolecular interaction energies. J. Chem. Phys. 2016, 145, 124105
- Neese et al. 2007 Neese, F.; Schwabe, T.; Grimme, S. Analytic derivatives for perturbatively corrected “double hybrid” density functionals: theory, implementation, and applications. J. Chem. Phys. 2007, 126, 124115
- Fetisov et al. 2018 Fetisov, E. O.; Shah, M. S.; Long, J. R.; Tsapatsis, M.; Siepmann, J. I. First principles Monte Carlo simulations of unary and binary adsorption: CO2, N2, and H2O in Mg-MOF-74. Chem. Commun. 2018, 54, 10816–10819
- Fang et al. 2013 Fang, H.; Kamakoti, P.; Ravikovitch, P. I.; Aronson, M.; Paur, C.; Sholl, D. S. First principles derived, transferable force fields for CO2 adsorption in Na-exchanged cationic zeolites. Phys. Chem. Chem. Phys. 2013, 15, 12882–12894
- Fang et al. 2014 Fang, H.; Demir, H.; Kamakoti, P.; Sholl, D. S. Recent developments in first-principles force fields for molecules in nanoporous materials. J. Mater. Chem. A 2014, 2, 274–291
- Becker et al. 2017 Becker, T. M.; Heinen, J.; Dubbeldam, D.; Lin, L.-C.; Vlugt, T. J. Polarizable force fields for CO2 and CH4 adsorption in M-MOF-74. J. Phys. Chem. C 2017, 121, 4659–4673
- Dubbeldam et al. 2019 Dubbeldam, D.; Walton, K. S.; Vlugt, T. J.; Calero, S. Design, parameterization, and implementation of atomic force fields for adsorption in nanoporous materials. Adv. Theory Simul. 2019, 2, 1900135